regression model based on real-time video skeleton
TRANSCRIPT

Universidad Central and Universidad JorgeTadeo Lozano
Regression model based onreal-time video skeleton trackingas a cost-effective alternative to
stabilometry
Thesis
In partial fulfilment of the requirements for the degree of masterof:
Modelling and Simulation
German David Sosa Ramırez
Director: Hugo Franco Triana, PhD
Bogota, D.C. 2018

AUTHOR
Date
Signature

A la abuela que muchas veces me ha llamado “el doctor”.Nos acercamos a ese tıtulo, ya lo dira el manana
i


Acknowledgments
In first place, thanks to Fundacion Colombiana para la Esclerosis Multiple. Spe-cially to the specialists Xiomary Hernandez, Herney Cuartas, Rocıo Bayona andtheir cheerful group of patients. All of you offered us your time and dedicationgenerously in different stages of this project for the sake of the benefit of peoplewith physical disability.
We also thank to the Fundacion Universitaria de Ciencias de la Salud, particularlyto Nicolas Figueroa and Victor Vargas in MovyLab, for allowing us to work in theirlaboratory and obtain the required data for this project.
Similarly, we appreciate the time and effort dedicated by the physiotherapists ofUniversidad Manuela Beltran, Andrea Vasquez and Juanita Sanchez, who sup-ported the collaborative work in conjunction with Universidad Central. Addition-ally, we want to express our gratitude to Juanita for their medical advice andguidance along last years, that guided this work in the correct direction in termsof physical rehabilitation.
We would like to thank to the teachers and academic partners in COMMONSResearch group, as well as the departments of systems engineering and mathe-matics in Universidad Central, who supported this work and encourage people todo proper research in order to make scientific progress in Colombia.
And personally, thanks to professors Hugo Franco and Angelica Ramırez. Both ofyou made huge contributions to this project in terms of ideas, dedication, scientificand engineering guidance, all required to bring this to the reality. Specially, thanksto Hugo since, his experience and constant supervision, made me learn a lot inthese last years... more than expected.
iii


Abstract
Human balance function is the ability to preserve and correct the standing posturedinamically, allowing people to perform daily living activities in bipodal equilib-rium, such as walking, or make controlled movements during upright position.Such ability relies on the Postural Control System, intended to keep the center-of-gravity (COG) within the subject base of support while minimizing the bodysway. Thus, postural control assessment is a key factor for physicians and phys-iotherapists to provide adequate physical therapy interventions in order to main-tain or improve static and dynamic balance when neurological diseases, traumaor ageing induce balance disorders. In most of cases, balance and postural con-trol function assessment relies on functional balance tests carried out by medicalpersonnel. However, such tests involve subjective evaluations, introducing inter-specialist variability and hindering test reproducibility along disease progressionand treatment. In order to provide objective balance measures using a low-costsystem, this work proposes the formulation of a regression model, based on theskeleton tracking hierarchical geometry provided by Kinect, able to support astabilometry evaluation comparable to that obtained through computerized pos-turography (CP) in a motion analysis laboratory (MAL). This is achieved byintegrating into the system both kinematic postural information from Kinect andcenter-of-pressure (COP) measures from a force platform. Such implementationleads to lower implementation costs and space requirements, especially in compar-ison to a traditional MAL. These advantages in conjunction with reliable COGestimations could contribute to the development of low-cost stabilometry systems,then extending balance assessment to several clinical and daily life scenarios, ben-efiting both patients and physicians.
v


Contents
List of Figures xi
List of Tables xv
1 Introduction 1
1.1 Problem statement . . . . . . . . . . . . . . . . . . . . . . . . . . . 1
1.2 Motivation . . . . . . . . . . . . . . . . . . . . . . . . . . . . . . . 2
1.3 Thesis approach . . . . . . . . . . . . . . . . . . . . . . . . . . . . 3
2 Literature Review 5
2.1 Balance disorders . . . . . . . . . . . . . . . . . . . . . . . . . . . . 6
2.1.1 Etiology of balance disorders . . . . . . . . . . . . . . . . . 6
2.1.2 Common diseases associated to balance disorders . . . . . . 7
2.2 Postural control assessment . . . . . . . . . . . . . . . . . . . . . . 11
2.2.1 The Postural Control System . . . . . . . . . . . . . . . . . 12
2.2.2 Functional balance tests . . . . . . . . . . . . . . . . . . . . 13
2.2.3 Balance objective measures . . . . . . . . . . . . . . . . . . 17
2.2.4 Stabilometry . . . . . . . . . . . . . . . . . . . . . . . . . . 20
2.3 Balance measurement devices . . . . . . . . . . . . . . . . . . . . . 22
vii

2.3.1 Motion Analysis Laboratories . . . . . . . . . . . . . . . . . 22
2.3.2 Markerless motion capture systems . . . . . . . . . . . . . . 24
3 Objectives 29
3.1 General Objective . . . . . . . . . . . . . . . . . . . . . . . . . . . 29
3.2 Specific Objectives . . . . . . . . . . . . . . . . . . . . . . . . . . . 29
4 Materials and Methods 31
4.1 Model formulation . . . . . . . . . . . . . . . . . . . . . . . . . . . 32
4.1.1 Postural data acquisition . . . . . . . . . . . . . . . . . . . 32
4.1.2 COG estimation by regression analysis . . . . . . . . . . . . 34
4.2 Experimental setup . . . . . . . . . . . . . . . . . . . . . . . . . . . 39
4.2.1 Data acquisition and preprocessing . . . . . . . . . . . . . . 39
4.2.2 Subject sample for postural data acquisition . . . . . . . . . 45
4.2.3 Data acquisition protocol . . . . . . . . . . . . . . . . . . . 47
4.2.4 Model fitting and validation . . . . . . . . . . . . . . . . . . 49
4.3 Case study: balance assessment in Multiple Sclerosis . . . . . . . . 51
4.3.1 Balance test description . . . . . . . . . . . . . . . . . . . . 52
4.3.2 Evaluation of acceptance . . . . . . . . . . . . . . . . . . . 54
5 Results 57
5.1 Acquired postural data . . . . . . . . . . . . . . . . . . . . . . . . . 57
5.1.1 Sample description . . . . . . . . . . . . . . . . . . . . . . . 57
5.1.2 Dataset description . . . . . . . . . . . . . . . . . . . . . . . 58
5.2 Model fitting and validation . . . . . . . . . . . . . . . . . . . . . . 60
5.2.1 Model parameterization . . . . . . . . . . . . . . . . . . . . 60
5.2.2 Model performance . . . . . . . . . . . . . . . . . . . . . . . 63

5.2.3 COG trajectory estimation from postural data . . . . . . . 65
5.3 Case study results . . . . . . . . . . . . . . . . . . . . . . . . . . . 67
5.3.1 COG trajectories for patients . . . . . . . . . . . . . . . . . 68
5.3.2 User acceptance survey . . . . . . . . . . . . . . . . . . . . 69
6 Discussion and Future Work 83
6.1 Model fitting and testing . . . . . . . . . . . . . . . . . . . . . . . . 83
6.2 Case study results . . . . . . . . . . . . . . . . . . . . . . . . . . . 85
6.3 Future work . . . . . . . . . . . . . . . . . . . . . . . . . . . . . . . 86
Bibliography 89
A Kinect technical specifications 103
B AMTI AccuGait Optimized platform specifications 107
C Acceptance survey for patients 113
D Acceptance survey for medical staff 117
E Published works 121

List of Figures
2.1 Central Nervous System structure and principal parts (outlined inblue). Retrieved from: https://en.wikipedia.org/wiki/Central_nervous_system (modified with permissions) . . . . . . . . . . . . 7
2.2 Principal neuronal affections caused by some of the most commonneurodegenerative diseases: Parkinson, Multiple Sclerosis, Hunt-ington and Alzheimer . . . . . . . . . . . . . . . . . . . . . . . . . 8
2.3 Postural control system representation as a closed-loop control sys-tem to maintain equilibrium and perform controlled movement.Based on the description of Massion [80] . . . . . . . . . . . . . . . 12
2.4 Visualization of the principal balance measures studied in biome-chanics during a balance test. 3D scene (left), 2D projection (cen-ter) and measure conventions (right) . . . . . . . . . . . . . . . . . 18
2.5 Center-of-pressure trajectories on a stabilogram for a young adult(left) and an elderly (right). Retrieved from https://www.researchgate.
net/publication/255791155 . . . . . . . . . . . . . . . . . . . . . 21
2.6 Infrared cameras tracking position markers and two force plat-form measuring ground-reaction forces for each foot in a motionanalysis laboratory. Retrieved from http://www.qualisys.com/
applications/human-biomechanics/gait-rehab/(modified withpermission) . . . . . . . . . . . . . . . . . . . . . . . . . . . . . . . 23
2.7 Microsoft Kinect components. Retrieved from: https://msdn.
microsoft.com/es-co/library/jj131033.aspx . . . . . . . . . . 26
xi

4.1 Kinect skeleton tracking model. Retrieved from: https://hughfernandez.com/2012/07/04/skeletons-el-desarrollo-de-una-interfaz-
verdaderamente-natural/ . . . . . . . . . . . . . . . . . . . . . . 33
4.2 System representation of the balance function where COG is relatedto the position of body segments as observable variables. Wide grayarrows represent multiple simultaneous signals . . . . . . . . . . . 35
4.3 Proposed neural network architecture for COG estimation from theposition of the different body joints provided by the Kinect skeletonmodel . . . . . . . . . . . . . . . . . . . . . . . . . . . . . . . . . . 37
4.4 Proposed model for the estimation of COG from position of jointsprovided by Kinect using COP trajectories obtained with a forceplatform as target measures . . . . . . . . . . . . . . . . . . . . . . 40
4.5 System representation of the balance function where COG is relatedto the COP position as an observable variable. Wide gray arrowsrepresent multiple simultaneous signals . . . . . . . . . . . . . . . . 41
4.6 Temporal mismatch between Kinect and force platform measuresdue to the different sampling frequencies of both devices . . . . . . 43
4.7 Position and orientation of the Kinect coordinate system in real-world coordinates with the origin in the force platform . . . . . . . 44
4.8 Visualization of COP trajectories and postural data after spatio-temporal preprocessing . . . . . . . . . . . . . . . . . . . . . . . . . 45
4.9 Exercises included in the balance test for the generation of posturaldata . . . . . . . . . . . . . . . . . . . . . . . . . . . . . . . . . . . 48
5.1 Average mean-squared error across LOOCV folds for different ofnumber of nodes in hidden layer h2 . . . . . . . . . . . . . . . . . . 61
5.2 Average mean-squared-error across LOOCV folds for different train-ing epochs . . . . . . . . . . . . . . . . . . . . . . . . . . . . . . . . 62
5.3 Learning curve for the best parameter combination evaluated ontrain and test datasets . . . . . . . . . . . . . . . . . . . . . . . . . 65

5.4 Intermediate and final model body representation obtained afterfitting. h1 (a), h2 (b), both hidden layers (c), and final output (d).Each body figure was generated according to the correspondingweights values in the network (positive values are drawn in green-blue and negative in red). . . . . . . . . . . . . . . . . . . . . . . . 66
5.5 Stabilograms (in platform area and zoomed) showing the COG tra-jectories obtained from the model (red) and from force platformdata (blue). All stabilograms correspond to executions of “normalbipedestation” performed during data acquisition stage. . . . . . . 72
5.6 Stabilograms (in platform area and zoomed) showing the COG tra-jectories obtained from the model (red) and from force platformdata (blue). All stabilograms correspond to executions of “bi-pedestation with feet together” performed during data acquisitionstage. . . . . . . . . . . . . . . . . . . . . . . . . . . . . . . . . . . 73
5.7 Stabilograms (in platform area and zoomed) showing the COG tra-jectories obtained from the model (red) and from force platformdata (blue). All stabilograms correspond to executions of “bi-pedestation with feet together and closed eyes” performed duringdata acquisition stage. . . . . . . . . . . . . . . . . . . . . . . . . . 74
5.8 Stabilograms (in platform area and zoomed) showing the COG tra-jectories obtained from the model (red) and from force platformdata (blue). All stabilograms correspond to executions of “TAN-DEM position” performed during data acquisition stage. . . . . . . 75
5.9 Stabilograms (in platform area and zoomed) showing the COG tra-jectories obtained from the model (red) and from force platformdata (blue). All stabilograms correspond to executions of “mono-pedestation” performed during data acquisition stage. . . . . . . . 76
5.10 Stabilograms (in platform area and zoomed) showing the COG tra-jectories obtained from the model (red) and from force platformdata (blue). All stabilograms correspond to executions of “forwardreach test” performed during data acquisition stage. . . . . . . . . 77
5.11 Stabilograms (in platform area and zoomed) showing the COG tra-jectories obtained from the model (red) and from force platformdata (blue). All stabilograms correspond to executions of “lateralreach test” performed during data acquisition stage. . . . . . . . . 78
5.12 Patients 1 to 3 . . . . . . . . . . . . . . . . . . . . . . . . . . . . . 79

5.13 Patients 4 to 6 . . . . . . . . . . . . . . . . . . . . . . . . . . . . . 80

List of Tables
4.1 structure of the joints that defines segments in the Kinect skeletonmodel . . . . . . . . . . . . . . . . . . . . . . . . . . . . . . . . . . 38
4.2 Weight and height statistics reported in literature for the selectedstudy population . . . . . . . . . . . . . . . . . . . . . . . . . . . . 46
5.1 Sample anthropometric description (weight and height) for dataacquisition . . . . . . . . . . . . . . . . . . . . . . . . . . . . . . . 58
5.2 Postural information dataset from Kinect and platform measuresafter acquisition process and offline alignment preprocessing . . . . 59
5.3 Average duration, and number of observations per exercise in bal-ance test . . . . . . . . . . . . . . . . . . . . . . . . . . . . . . . . . 59
5.4 Model average performance and standard deviation for differentvalues of α and B with E = 2000 and M = 1. Error units are insquare meters (m2) . . . . . . . . . . . . . . . . . . . . . . . . . . . 63
5.5 Gender, age and time since MS onset for each of the patients in-cluded in the case study . . . . . . . . . . . . . . . . . . . . . . . . 67
5.6 Survey results for patients after performing balance test . . . . . . 69
5.7 Survey results for patients after seeing stabilogram results explainedby an expert . . . . . . . . . . . . . . . . . . . . . . . . . . . . . . 70
5.8 Survey results for clinical personnel after postural data acquisitiontraining session . . . . . . . . . . . . . . . . . . . . . . . . . . . . . 71
xv
5.9 Survey results for clinical personnel after visual inspection of esti-mated stabilograms . . . . . . . . . . . . . . . . . . . . . . . . . . . 71

Chapter 1
Introduction
1.1 Problem statement
Balance is the ability of a subject to preserve the center-of-gravity (COG) of hisor her body directly above the base of support (BOS), by means of coordinatedvoluntary muscular actions. This function is controlled by different componentssuch as visual, vestibular and somatosensory inputs of the human body [84]. Bal-ance function is required to hold the posture against the influence of gravity, andallows people to perform daily living actions by themselves [63], such as walking,eating, bathing, dressing, among others [137]. Thus, the balance function assess-ment is a topic of interest in medical community since it is a key predictor todetermine the state of the PCS of a subject [18], involving its evolution, recoveryand intervention through physical therapy when balance disorders are present.
Balance impairment might indeed increase the fall risk, potentially causing severeinjuries or even death, and it is considered one of the major causes of physicaldisability (PD) around the world [88]. The World Health Organization (WHO)found than one billion people (15 % of world population approximately) exhibitsome kind of PD, and 110 to 190 million of them experience a significant loss ofmotor capabilities as consequence of these disorders [88]. The principal causesof PD involve aging, neural trauma [24] and neurodegenerative diseases such asMultiple Sclerosis, Parkinson and Huntington disease [58, 101]. In Colombia, theprevalence of PD is approximately 6.3 % of the population and around 60 % ofthem present motor disorders associated to their disability [4].
1

2 CHAPTER 1. INTRODUCTION
Given such high prevalence of PD, physicians and physiotherapists agree thatphysical therapy is a valuable intervention when addressing rehabilitation in pa-tients with PD and balance disorders, and may help to reduce long-term effectsof neurodegenerative processes, improving their quality of life. Additionally, thetherapeutic pathway should be based on the correct assessment of the balancefunction, a.k.a postural control, of the patients in order to follow their evolutionand to adjust each selected program to their particular needs. In that sense,medical community has designed a set of quantitative, standardized functionalbalance tests to evaluate postural control, such as the Romberg Test or the BergBalance Scale [92]. Such tests allow physicians to obtain representative scores andbiomarkers according to the state of the postural control system, and they haveproved themselves as useful descriptors of the patient evolution in terms of theimpact of each physical therapy intervention [18].
Despite the utility that functional balance tests have brought to physical rehabili-tation evaluation and tracking, they still have several drawbacks, such as the lackof reproducibility associated to the inherent subjectivity of an ordinal scale, eval-uated by an expert using direct observation of the subject performance. However,recent advances in computerized posturography (CP) technology, allow physiciansto overcome these disadvantages by providing quantitative data related to the pos-tural control state with notable accuracy. In fact, traditional an emergent acqui-sition systems for CP evaluation, such as force platforms, motion capture systemsand electromyography, have converged into the implementation of motion analysislaboratories (MAL) [132], offering objective measures related to postural controlsuch as COG, ground-reaction forces, range of motion, etc. in a non-invasive way.
1.2 Motivation
The use of computational technology in medicine is a strong trend thanks tothe data acquisition and processing capabilities of modern biomedical systemsat an affordable price for high and mid-income countries. In physical disability,computer applications in conjunction with different electronic systems such assensors, trainers, or stimulators, have become a strong technological support inrehabilitation, either for patients or physicians; e.g., patients benefit from virtualreality environments, stimulating the adherence to rehabilitation programs, whilephysicians and physiotherapists can take advantage of the registration of objectivemeasures to provide reproducibility and improve accuracy of their diagnostics.
The potential of computer applications to support rehabilitation of patients as wellas diagnosis from physicians has been evidenced in variety of works and articles in

1.3. THESIS APPROACH 3
academic publications (See chapter 2). However, most of those approaches addressonly one type of population at the same time, i.e. patients or physicians. Forpatients, some works describe the implementation of compact and portable virtualreality tools that might be used at clinic or home improving the impact of therapybut usually lacking of objective measures. In contrast, different approaches havebeen presented to provide accurate measures for physicians by using measuringsystems e.g., FP and MAL, beside standard physical tests. However, such testsdo not usually look attractive to patients because they imply large displacements(from home to laboratory) and extenuating therapy sessions.
Even though MAL systems became the standard choice for balance assessment(among other uses), their implementation is rather expensive because of the highcost of their measurement equipment and their space requirements, related to workspace and accuracy. On the other hand, new low-cost motion capture systems, e.g.Kinect devices, have been developed for human-computer interaction (HCI) andvideo gaming, using real time human body segmentation and skeleton tracking.Despite the motion detection in Kinect-based applications is coarse, since suchsoftware is not intended to estimate dynamic measures like COG, the kinematicdata that they provide is being used in physical therapy with remarkable resultsfor postural control assessment and rehabilitation process support.
Thus, an interesting contribution to computerized posturography, and hence phys-ical therapy, would be the development a computational system bringing the bestof both scenarios: portability and virtual reality components, able to acquireand register objective biometric and biomechanical data in an accurate way. Thisproject propose the development of a computational system based on Kinect tech-nology, to estimate balance function objective measures, s.a. COP and COG, usingthe information provided by a Kinect system and a force platform simultaneously.Indeed, such a development is a feasible task given Kinect is a low-cost device withan active software development community, and high quality force platforms athand in the MAL systems available at the Universidad Central and the Fundacionpara las ciencias de la salud (FUCS) in Bogota, Colombia.
1.3 Thesis approach
This work proposes the development of a regression model adapted to the sim-plified geometry of the human body implemented in the Kinect skeleton trackingsoftware, allowing the implementation of a Kinect-based application to performstabilometry evaluation by COG estimation. To do that, the joint positions pro-vided by Kinect and the COP obtained by a force platform will be acquired si-

4 CHAPTER 1. INTRODUCTION
multaneously. Then, a regression analysis will be applied to approximate therelationship between the relative position of body segments and the COP. At theend a post-processing stage will be applied to estimate COG from COP based onthe approach presented by Benda et al. [11].
In terms of evaluation, the model will be trained and validated using the dataprovided by the force platform of the laboratory from the balance performanceof healthy subjects without balance disorders during a functional balance test.Once the model has been quantitatively validated and tested, the potential clinicalcontribution of the resulting system will be examined through a case study with asmall set of multiple sclerosis patients from Fundacion para la Esclerosis Multiple(FUNDEM).
‘This report is organized as follows. Chapter 2 contains a literature review con-cerning the assessment of balance and postural control functions from clinical,engineering and biomechanical perspectives. Chapter 3 explicitly enumerates thegeneral and specific objectives of the Thesis. Chapter 4 describes the materialsand methods used for data collection, and for the model the construction andvalidation; this chapter also presents the methods related to a preliminary clinicalcase study at FUNDEM. The obtained results are reported in chapter 5, in termsof the selected sample, system performance and clinical use. Finally, these resultsare discussed in chapter 6; the potential incoming stages of the enclosing projectare then mentioned at the end of the chapter. Final sections of this documentinclude the references and complementary appendices.
Chapter 2
Literature Review
In order to propose a regression model, intended to estimate the COG as anapproach to video-based stabilometry to support postural control assessment, itis necessary to understand the scope of:
• The social impact caused by postural control disorders.
• The common techniques and procedures adopted by physicians and physio-therapists to assess balance.
• The technological systems previously developed and implemented in medicalscenarios to provide best and more accurate measures to support balanceassessment.
• The involved physical therapy procedures.
This chapter presents an overview on the specialized literature related to such top-ics, synthesizing their principal findings to provide a deeper comprehension of theproblem, then identifying its current technological needs and providing some hintson the potential contribution of this work in the field of computerized posturog-raphy. So, this review covers the following sections: nature and causes of balancedisorders, description and assessment of postural control system, and balance mea-surement devices available for analysis and evaluation of balance function.
5

6 CHAPTER 2. LITERATURE REVIEW
2.1 Balance disorders
Physical disability (PD) is a human condition defined as a partial or total reductionof functional mobility caused by an impairment. This condition heavily impactsthe quality of life of the patient since, in most cases, it shortens his or her lifeexpectancy and imposes increasing functionality constraints as the subject ages[88]. These limitations involve difficulties to perform activities related to physicalactions necessary for independent living, such as interpersonal relationship, workactivities, school duties, self care tasks (feeding, dressing, bathing), etc. A patientwith diagnosis of PD will eventually require assistance from a third person [75].
Causes of physical disability are diverse and may be the result of accidents, geneticconditions or specific diseases. When balance and mobility become affected bysuch a disorder, a deteriorating process starts in the subject, involving a series ofstages: disease, impairment, disability and handicap [89]. This process may lastfor life, with a few or even no chances of full recovery. Following sections presenta brief review of the different causes of balance disorders, with a focus on theprincipal neurodegenerative diseases affecting the central nervous system (CNS)and their corresponding physical rehabilitation processes.
2.1.1 Etiology of balance disorders
Balance impairments may be the result of different causes. The principal reasonis attributed to age, particularly to the limb weakness and the deterioration ofbones in elder people. In the United States, 30 % of people older than 65 reportdifficulty to stand or walking, whereas 20 % require the use of a mobility aidsuch as a cane or a walker [110, 108]. Another source of balance impairmentsare physical injuries, being the ankle sprain the most recurrent damage amongathletes and dancers [56]. The incidence of disability associated to ankle sprain isapproximately 6.94 per 1000 exposures for men and 13.6 per 1000 exposures forwomen [42]. Neural trauma, usually caused by brain injury, is another recurrentcause of disorders of balance and mobility, often due to traffic accidents [24]. Neu-ral trauma cases caused by concussion have growth over the last years with morethan 57 million people being hospitalized annually (with a high presence of peo-ple younger than 20) [72]. In particular, neurodegenerative diseases are a quitefrequent cause of balance impairment, mainly affecting adults and elder people[134, 90, 107, 7]. Most common neurodegenerative diseases and conditions in-clude Alzheimer, Parkinson, Multiple Sclerosis, Huntington, Amyothropic LateralSclerosis and Friedrich Ataxia, among others.

2.1. BALANCE DISORDERS 7
Figure 2.1: Central Nervous System structure and principal parts (outlined inblue). Retrieved from: https://en.wikipedia.org/wiki/Central_nervous_
system (modified with permissions)
Despite neurodegenerative diseases are not the principal cause of balance im-pairment, they have attracted a lot of attention from medical community, sincethose patients with related diagnoses usually become highly dependent on physicaltherapy to alleviate their symptoms and preserve their quality of life over certainminimum. Even though physical therapy is also intended to improve mobility insubjects with physical injury or neural trauma, most of interventions last a fewweeks, month or years, whereas people with neurodegenerative diseases generallydo require physical therapy for life. Similarly, subjects affected by this kind of dis-eases benefit more from physical therapy than older people with musculosketelaldeterioration rather than neural damage.
2.1.2 Common diseases associated to balance disorders
The central nervous system (CNS) consists of the brain (brainstem, cerebellum,diencephalon and cerebrum) and the spinal cord as shown in Figure 2.1 [66]. Otherdefinitions include cranial nerves, such as optical and olfactory nerve tracts, sincethey synapses directly on the brain without intermediate ganglia. CNS is made

8 CHAPTER 2. LITERATURE REVIEW
Figure 2.2: Principal neuronal affections caused by some of the most common neu-rodegenerative diseases: Parkinson, Multiple Sclerosis, Huntington and Alzheimer
principally of nerve and brain cells, known as neurons, so that the CNS is dividedinto the white matter (mainly made up of myelinated axons) and grey matter(mainly made up of neuronal cell bodies and dendrites) [66]. CNS plays an funda-mental role in the control of vegetative body functions, voluntary motion, equilib-rium, and sensation, among many others. In humans, CNS is also responsible ofself consciousness, central thoughts, information processing, speech and memory.
Neurons are a special type of electrically excitable cell conforming neural networksenabling the CNS to receive, process and transmit information through electro-chemical signals along the body [66]. In most cases, neurons are not produced bycell division but through a process called neurogenesis from stem cells. Neuroge-nesis is highly active during childhood but progressively decreases on adulthoodand elderly [66]. Thus, neurodegenerative diseases causing damage or destructionof neurons in the CNS are a major concern for medical community, given the lowchances of neuron tissue recovery. Depending on the disease, they might affectthe brain or the spinal cord, even the peripheral nerves in some cases, and at-tack neurons in different ways. T selection of some neurodegenerative diseases tobe described in the rest of this section is illustrated in Figure 2.2 showing theirprincipal negative effects on the CNS. This group of diseases were selected basedon their impact on the quality of life of a patient and the prevalence around theworld, as well in Colombia.

2.1. BALANCE DISORDERS 9
Parkinson’s disease
Parkinson’s disease is described as a degenerative disease recognized by the sig-nificant deterioration of the subtantia nigra [22], an important structure locatedin the midbrain with high levels of melanin and dopamine, two powerful neuro-transmitters closely related to movement functions. Since its discovery, circa 1817,Parkinson’s disease ætiology is not completely understood, and it is believed tobe caused by genetic and environmental factors. Around the world, this diseaseaffects 6.2 million of people approximately [134], while the prevalence in Colombiais around 4.7 cases per 1.000 habitants, with a high predominance of women [101].
Parkinson’s disease has no cure and their symptoms involve involuntary limb shak-ing or tremor, rigidity and loss of strength, eventually causing postural instability,akinesia, and difficulties for walking or performing fine movements. Such behavioris caused by the loss of dopamine in the subtantia nigra, a region of dense and pro-fusely connected neurons, responsible of the body movement. To diminish thoseeffects, patients are treated with injected or oral doses of levodopa to counter thedopamine loss [61], though its action become less effective over time. On the otherhand, physical therapy have shown to be useful when performed periodically [5].Therapeutic interventions usually combine physical therapy with medication inorder to slow down the Pakinson’s degenerative process as long as possible .
Multiple sclerosis
Multiple sclerosis (MS) is known to be an autoimmune disorder of the CNS char-acterized by the demyelination and axonal degeneration of neurons produced bythe T-cells, i.e. lymphocytes, of the auto immune system which are tricked andsees myelin as a foreign [128, 121]. The mechanisms that produces MS have eludedmedical community and, since neuronal damage is not caused by self-degenerationof neurons but action of T-cells, they debate about classify MS as a neurodegen-erative disorder or not[128]. 60 % of MS patients are no longer fully-ambulatoryafter 20 years from onset, that is the reason for MS to be one of the principalcauses of physical disability in young adults around the world affecting 30 per100.000 habitants with a high prevalence in Europe (80/100.000) and the Amer-icas (8.3/100.000) [90]. In some locations in Colombia, prevalence of MS reaches4.98 cases per 100.000 habitants with high predominance of women [111, 106].
MS symptoms are not regular. Instead, MS causes periods of acute attacks withan increasing frequency as the disease advances. Depending on the location of thelesion caused by MS, symptoms may be different. For example, visual, sensory

10 CHAPTER 2. LITERATURE REVIEW
and cognitive disorders are present when lesions occur in the brain; on the otherhand, muscle weakness, ataxia as well as postural and gait disorders are usualwhen spinal chord and nerves are harmed [35]. Although there is no cure forMS, there are treatments with corticosteroids to mitigate pain and prevent newattacks. Also, physical therapy plays a fundamental function to improve prognosisand is highly recommended when MS become chronic [53].
Huntington disease
Huntington disease (HD) is a genetic and autosomal disorder caused by the mu-tation of the Huntington gene (HTT). Despite HTT origin is not totally under-stood, there is strong evidence that a mutation, consisting of abnormal repetitionsof cytosine-adenine-guanine (CAG) codes, produces a toxic function propagatedduring RNA transcription resulting in a rapid process of brain cell death [107].Prevalence of HD is hard to quantify since all humans have the HTT gene and themutation is transmitted by inheritance with a 50 % of probability, but symptomsdo not appear until 30 or 40 years of age in most cases. It is estimated that casesof HD oscillates between 4-10 per 100.000 habitants in the Americas [107]. Thereare no reports of prevalence of HD in Colombia, however, a study in the townof Juan de Acosta shows that it has the second highest prevalence for HD in theworld in the decade of the 1990s, with more of 5 per 1000 habitants [38], just afterMaracaibo in Venezuela, with 7 cases per 100 habitants [139].
HD symptoms appear after 30 or 40 years of age. The most known manifestationof HD is chorea, an involuntary feet and hands movement resembling dancing.However, symptoms may also involve gait and postural instability, changes of be-haviour, dementia and, finally, death after 15-20 years after onset [135, 59]. Sinceseveral psychological syndromes appear as result of HD, pharmaceutical treatmentto combat depression, irritability and impulsive behaviours [54] is frequent. Forphysical rehabilitation, physicians recommend physical therapy as the primaryintervention, usually in conjunction with relaxants [54].
Alzheimer’s disease
Commonly known as Alzheimer, this neurodegenerative disease is considered theprincipal cause of dementia around the world. The pathogenesis of Alzheimeris poorly understood, but is usually attributed to a genetic disorder involvingseveral genes, making it difficult to find a consistent treatment, even for palliativepurposes. However, this disease can be easily detected by the presence of senile

2.2. POSTURAL CONTROL ASSESSMENT 11
plaques and neurofibrillary tangles as a product of a degenerative structural changeof brain neurons [125]. Since Alzheimer is associated to elderly in most of cases,prevalence is usually presented by age-groups instead of global accounts. In thatsense, it is estimated that 11 % of people in United States between 65 and 85years old has Alzheimer, whereas for those older than 85, the prevalence ascendsto 32 % [7]. In Colombia, Pradilla reported estimates pointing out that 3 % of thepopulation has dementia symptoms related to neurodegenerative diseases, with a60 %-70 % of chances of being induced by Alzheimer [101]. This study did notconsider any age-group classification.
Alzheimer symptoms mainly involve cognitive and emotional alterations, includinganxiety, memory losses, decreasing abilities for written and spoken language, etc.,even though they may also include functional disorders as loss of coordination,increased risk of falling and emerging constraints for self-care tasks, s.a. bathingor dressing [7]. Despite Alzheimer effects are basically cognitive, the introductionof physical therapy interventions may help to retrain the brain and muscularsystem, reducing neural deterioration and loss of muscle mass [99].
2.2 Postural control assessment
The correct function of the postural control is required to perform daily actions inan effective and safe way [16]. The alteration of this system is normally associatedto aging [78] or CNS diseases or abnormal conditions [95], with a severe impactin the quality of life of the affected subject as well as a high risk of falling, oftenrelated to injuries such as hip fracture and concussion, among others. For thisreason, an accurate assessment of the balance function is required to determinewhen a specific subject could require therapeutic intervention.
However, such evaluation is quite challenging for physicians, given the complexityof the problem of human posture characterization, even when the subject is askedto maintain balance in a bipedal natural stance [57]. In order to provide a moreaccurate diagnosis, physicians rely on standardized and validated assessment pro-tocols, known as functional balance tests, which have proved to be a convenienttool for postural control assessment. Additionally, the recent introduction of ob-jective measures from the biomechanical point of view allowed new progresses inthe study and comprehension of balance disorders, in order to develop new andmore effective treatments.

12 CHAPTER 2. LITERATURE REVIEW
2.2.1 The Postural Control System
The Postural Control System (PCS) is described as an arrangement of body sub-systems, involving the CNS and the neuromuscular system, that has two mainfunctions: i) ensure the balance of the body against gravity and ii) fix the orien-tation and position of body segments while performing an intended task [80]. Asit is illustrated in Figure 2.3, such functions are carried out based on the actionof different components: multisensory inputs (vestibular system, somatosensorysystem and visual information), a set of reference values (such as center of grav-ity and vertical references), and a set of positions and reactions executed by themuscular system to ensure balance or performing voluntary movements [80, 118].
In order to keep the body balance, the PCS uses two types of reference values: oneassociated to body segment orientation and one associated to stability in termsof weight distribution. Additionally, there are multiple sensory inputs such as thevision, the vestibular and somatosensory system, that, in conjunction with thosereferences, are perceived and processed to produce an inner body representationof both stability and equilibrium. Then, this information is used to determinethe actions required to achieve a determined posture, depending on the positionto be adopted. Stimuli to execute these actions are propagated by the posturalnetworks, i.e. the nerves of neuromuscular system, to the specific groups of musclescontrolling the orientation of the principal body segments, i.e. head (and neck),trunk and limbs, by their independent closed-loop processes.
Figure 2.3: Postural control system representation as a closed-loop control sys-tem to maintain equilibrium and perform controlled movement. Based on thedescription of Massion [80]
2.2. POSTURAL CONTROL ASSESSMENT 13
2.2.2 Functional balance tests
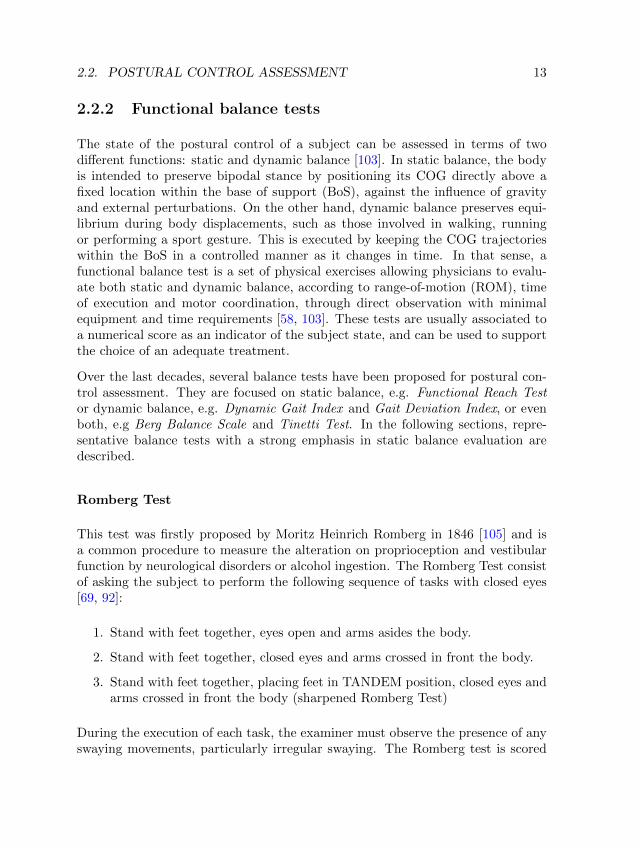
The state of the postural control of a subject can be assessed in terms of twodifferent functions: static and dynamic balance [103]. In static balance, the bodyis intended to preserve bipodal stance by positioning its COG directly above afixed location within the base of support (BoS), against the influence of gravityand external perturbations. On the other hand, dynamic balance preserves equi-librium during body displacements, such as those involved in walking, runningor performing a sport gesture. This is executed by keeping the COG trajectorieswithin the BoS in a controlled manner as it changes in time. In that sense, afunctional balance test is a set of physical exercises allowing physicians to evalu-ate both static and dynamic balance, according to range-of-motion (ROM), timeof execution and motor coordination, through direct observation with minimalequipment and time requirements [58, 103]. These tests are usually associated toa numerical score as an indicator of the subject state, and can be used to supportthe choice of an adequate treatment.
Over the last decades, several balance tests have been proposed for postural con-trol assessment. They are focused on static balance, e.g. Functional Reach Testor dynamic balance, e.g. Dynamic Gait Index and Gait Deviation Index, or evenboth, e.g Berg Balance Scale and Tinetti Test. In the following sections, repre-sentative balance tests with a strong emphasis in static balance evaluation aredescribed.
Romberg Test
This test was firstly proposed by Moritz Heinrich Romberg in 1846 [105] and isa common procedure to measure the alteration on proprioception and vestibularfunction by neurological disorders or alcohol ingestion. The Romberg Test consistof asking the subject to perform the following sequence of tasks with closed eyes[69, 92]:
1. Stand with feet together, eyes open and arms asides the body.
2. Stand with feet together, closed eyes and arms crossed in front the body.
3. Stand with feet together, placing feet in TANDEM position, closed eyes andarms crossed in front the body (sharpened Romberg Test)
During the execution of each task, the examiner must observe the presence of anyswaying movements, particularly irregular swaying. The Romberg test is scored

14 CHAPTER 2. LITERATURE REVIEW
positive if the subject sways widely or falls while performing a task(in some cases,the score also includes the time the subject holds the upright position). Thistest is not quantitative and has low prediction potential in the context of balancedisorders. However, it is a recurrent practice in postural control assessment sinceit is a quick clinical tool to assess the balance function of a particular subject indifferent scenarios.
Functional Reach Test
Functional Reach is a measure of the stability margin of a subject while perform-ing maximal forward reach within a fixed base of support [44]. A variation iscalled Functional Lateral Reach test and uses the same approach but evaluatingmediolateral balance [21]. Both tests can be used altogether to determine thefunctional reach of a subject in terms of anteroposterior and mediolateral balance.Functional Reach is tested by placing the subject next to a wall with a tape oryardstick on it, then the subject is asked to perform the following tasks:
1. With a comfortable feet separation, raise dominant arm (performing 90◦shoulderflexion), then reach forward as far as possible without taking a step.
2. With a comfortable feet separation, raise dominant arm (performing 90◦shoulderabduction), then reach lateral as far as possible without taking a step.
At the beginning of each task, the examiner places a mark in the wall as startingpoint where the subject can reach with his arm raised in upright position. Then,during the execution of the task, another mark is placed as ending point when thesubject has reach the maximum distance without taking a step. The FunctionalReach Test is scored by measuring the distance between starting and ending pointsusing the fingertips as reference point. The quantitative measures provided byFunctional Reach Test have demonstrated to be a useful tool to track balancefunction changes over time, specially in impaired older people [21].
Berg Balance Scale
The Berg Balance Scale (BBS) was originally formulated to assess static anddynamic balance in elderly people [13], but it is now widely used for balanceassessment in patients with neurodegenerative diseases or stroke [17]. BBS isconsidered an ambulatory yet exhaustive functional test that does not require

2.2. POSTURAL CONTROL ASSESSMENT 15
complex equipment nor space to be applied, and consists of the evaluation of 14physical tasks involving standing, sitting an object interaction, as follows:
1. Sitting to standing: Stand up without using hands for support
2. Standing unsupported: Stand for two minutes without holding on
3. Sitting with back unsupported with feet supported on the floor or stool: twominutes
4. Standing to sitting: Sit down with minimal use hands for support
5. Transfer from a seat with armrest to another seat without armrest
6. Standing unsupported with eyes closed for ten seconds
7. Standing unsupported with feet together for 1 minute
8. Reach forward: Lift arm 90◦and reach forward as far as possible
9. Pick up object from the floor in standing position
10. Turning to look behind over left and right shoulders in standing position
11. Turn 360◦: Turn completely, pause, and turn completely in the other direc-tion.
12. Place a foot in a stool during standing: alternate foot and continue untileach foot is placed 4 times in stool
13. Standing unsupported with on foot in front for 30 seconds
14. Standing in one leg for more than 10 seconds
For each of the tasks, the subject performance is graded using an ordinal scalefrom 0 (unable) to 4 (able and independent), according to different factors suchas the the ability of the subject to hold a determined position during a previouslyspecified time lapse, the time spent to complete a dynamic task, the additional useof hands or legs for support, or the need for third party assistance to complete atask. When finished, BBS is summarized as the sum of all individual scores. Thisprocess yields an overall integer value ranging from 0 to 56, corresponding to badperformance (0−20), medium performance (21−40) or good performance (41−56).Experimental studies have demonstrated that BBS scores could offer remarkablereliability and reproducibility [43], becoming one of the most complete functionaltest for balance assessment in physical therapy [17] since it is a key descriptor ofthe postural control state of a subject as well as a good fall prediction tool [82, 96].

16 CHAPTER 2. LITERATURE REVIEW
Tinneti Test
Tinneti Test (TT), also known as Performance Oriented Mobility Assessment(POMA) [126], is a functional test comparable to BBS, and it is mainly usedfor balance and gait assessment in elderly people [127]. Tinneti test has been alsoapplied for balance assessment in patients with stroke or neurodegenerative dis-eases [25]. In contrast to BBS, TT evaluates static and dynamic balance functionof a subject independently, via a sequence of static balance tasks followed by awalking stage where the examiner scores different balance and gait features aslisted below:
1. Static balance aspects (Patient starts seated in chair)
(a) Sitting balance
(b) Rise from chair
(c) Attempt to rise
(d) Standing balance
(e) Balance after nudge
(f) Balance with eyes closed
(g) Turning 360◦
(h) Sitting down
2. Gait balance aspects (Patient starts walking at usual pace, then rapid pace)
(a) Attempts to start walking
(b) Step length and height
(c) Foot clearance
(d) Step symmetry
(e) Step continuity
(f) Deviation during path
(g) Trunk sway
(h) Walking time
Depending on the aspect under evaluation, each one may score between 0 − 1 or0 − 2, being 0 representative of a patient that is unable to perform certain taskor exhibit high irregularity in the evaluated aspect. The total score of the TT isobtained by the sum of all individual scores in a range from 0 to 28, and can beseparated in balance (0−16) and gait performance (0−12). The TT is a proficientfall predictor in elderly people [127], while it is also used as a mobility indicatorto track balance improvement or deterioration during physical therapy [25, 67].

2.2. POSTURAL CONTROL ASSESSMENT 17
2.2.3 Balance objective measures
Regardless of the skills of a physician, the balance measures obtained by directobservation during the execution of a functional balance always imply the sub-jectivity related to the interpretation of each particular expert, then affecting theresulting diagnosis. However, functional balance tests could provide accurate in-formation on the subject postural control state, since their exercises are represen-tative of his or her biomechanical performance. For this reason, a set of objectivemeasures are accepted by the medical community as representative indicators onthe equilibrium function of a subject during static and dynamic balance [83, 94](Figure 2.4). In this context, such objective measures show themselves as usefultools in different clinical rehabilitation scenarios, such as symptom characteriza-tion in specific diseases [55, 102], balance outcome after sever injury [56, 104, 9]and balance deterioration in elderly [14, 52, 39].
Center of gravity (COG)
In physics, the COG of an object is an unique point in the space defined as theaverage location of its weight (or mass) under a uniform gravitational field. TheCOG location can describe the translation and rotation of a rigid object dueto external forces applied to it [27]. In Biomechanics, the COG is a controlledvariable of the PCS, as it is the objective of the PCS to control the sway of theCOG projection onto the floor, in order to preserve equilibrium of the body byadapting its position and orientation, i.e. the posture [94]. Thus, given the humanbody is not a rigid structure, the location of the COG is described as the outputof a dynamical process that depends of the current posture as well as the massdistribution of the body in a PCS controlled process.
Despite the location of the COG is an objective measure, valuable for assessmentof balance and postural control, its measurement can not be performed directlybecause it is constantly changing its position during motion, even static balance.It is also strongly correlated with the mass distribution of a complex object as thehuman body, and there is an infinite number of postures to preserve the stanceposition, resulting in the same COG. However, a COG-based measure, called theline-of-gravity (LOG),i.e. the vertical two-dimensional projection of the COG ontothe floor, can be estimated accurately enough for biomedical applications by usingthe measures provided by a force platform [11].

18 CHAPTER 2. LITERATURE REVIEW
Figure 2.4: Visualization of the principal balance measures studied in biomechan-ics during a balance test. 3D scene (left), 2D projection (center) and measureconventions (right)
Base of support (BOS)
The BOS is defined as the smallest convex area beneath the body including everycontact point between the body and the supporting surface, e.g. the floor [115].In terms of balance, there is a strong relation between the LOG and the BOSas long as equilibrium can be ensured when the LOG remains within the area ofdetermined by the BOS. In physical therapy, the significance of the BOS dependson its shape as well as its size. For example, depending of the feet position, bodyis more prone to lose anterioposterior balance (e.g. during normal bipedestation)or mediolateral balance (e.g. during Tandem standing). In the same way, thereduction of the BOS surface, e.g. by closing the feet or standing on only onefoot, creates more adverse conditions for the PCS to hold equilibrium [94].
The determination of the size and shape of the BOS is normally handled by mereobservation of the feet position during a physical test. However, some deviceslike pressure sensor matrices can sense the pression produced by the body weighton every contact point of the body (usually the feet soles) against it [64]. Inconjunction with other devices in a MAL, the BOS can be accurately estimatedand related to the location of the projection of the COG to provide informationabout the balance ability of a subject as well as his or her risk of falling.

2.2. POSTURAL CONTROL ASSESSMENT 19
Ground reaction force
From the third law of Newton (classical mechanics), the ground reaction force isthat exerted by the supporting surface in opposition to the weight of an objectplaced on it [86]. For an inanimate object, the ground reaction force coincideswith the notion of normal force. However, for the human body case, this force isthe result of the body weight in addition to the muscular activity of the PCS tocontrol the COG in order to preserve the standing position [94].
The ground reaction force can be measured directly through a force platform andcan be represented in two different manners: as a directional force vector in athree-dimensional space, or a three-dimensional torque vector when a supportingpoint is established. The magnitude and direction of the ground reaction forcevector is highly influenced by weight of the body. However, their fluctuations arethe result of the activity of the PCS and provide relevant information for balanceassessment.
Center of pressure (COP)
The COP is the weighted average location of all applied forces of the body onto thesupporting surface as a whole [94], it can also defined as the point of applicationof the ground reaction force. As the ground reaction force is characteristic of thePCS activity, also is the COP when it comes to keep the COG within the BOS.According to Benda et al. [11], the COG and COP position depends on eachother in a closed-loop process where COG is the output variable and COP is thecontrol signal resulting of the actual position of the COG. Thus, the estimationof the COP can be considered an indirect measure of COG and has relevance forpostural control assessment.
In contrast to the COG, the position of the COP onto the supporting surfacecan be directly and accurately measured by using a force platform. Despite theCOP is an indirect estimation of the COG, in most of cases is considered a gooddescriptor to support balance state diagnosis. However there are several methodsin the literature intended to estimate the COG from COP data from a forceplatform, e.g. the works of Shimba et al. [116] and Benda et al. [11].
Inverse dynamics and kinematics
Inverse dynamics and inverse kinematics consist of the estimation of kinetic andkinematic variables, .e.g. forces, torques, accelerations, joint angles and ranges of

20 CHAPTER 2. LITERATURE REVIEW
motion, from known position and orientations of individual body segments via thesolution of an inverse problem [138]. For both dynamics and kinematics, the goalis to determine the causes (forces, displacements) producing a specific position ofthe body segments from the data provided by position markers in the body-surfacebeside the ground reaction forces, given by a force platform.
The solution of inverse dynamic and kinematic problems is a challenging task,since it usually imply an ill-posed formulation [77], so it is generally addressedby different optimization methods [77]. Different approaches have proposed undercertain assumptions and restrictions about geometry, structure and mass distribu-tion of the body [87, 77], alongside standardized marker sets for specific purposes[122]. Up to date, such models have been implemented as computational methodsin software suites and libraries for biomechanical analysis, e.g. OpenSim [40], andallows physicians and scientists to obtain inverse kinematic and dynamic measureswithout a deep understanding of the underlying mechanical model.
2.2.4 Stabilometry
COG trajectory along time is a good measure to describe the current state ofthe balance function during upright position, providing evidence about the PCScondition of a subject. In that sense, static stabilometry has been proposed as astandard technique to perform balance assessment through the analysis of COPsway signals, usually acquired by means of a force platform [114]. This is possiblebecause COP and COG trajectories are highly correlated, since COP reflects thebody neuromuscular activity in order to control the COG sway within the BOS[8, 11, 34].
Stabilometry is one of the objective methods commonly used in the clinical practicefor postural control assessment [79, 133], and has been applied in quantitativebalance characterization in people with physical disability [55, 102, 9] and theelderly [14, 52]. A frequent pattern observed by visual inspection of stabilograms isthe presence of larger COP sway trajectories in people with balance deterioration,in comparison to healthy subjects, as it is shown for elderly subjects in Figure 2.5.Additionally, this kind of visualization allows physicians to assess anteroposterioror mediolateral balance separately, supporting incoming therapy interventions.
Despite stabilograms are useful for objective balance assessment, they are proneto subjective evaluation, since it relies on the visual inspection performed by anexpert. Thus, in the literature related to computerized posturography, differentsignal processing methods has been applied to characterize COP sway trajecto-ries in a quantitative manner, in order to formulate and validate biomechanical

2.2. POSTURAL CONTROL ASSESSMENT 21
Figure 2.5: Center-of-pressure trajectories on a stabilogram for a young adult(left) and an elderly (right). Retrieved from https://www.researchgate.net/
publication/255791155
markers intended to support postural control diagnosis. Kaptein et al. [41] an-alyzed the COP trajectory energy by calculating the RMS value of the signal.Baratto et al. [10] reported sway-density plots obtained by counting the numberof consecutive samples falling in a circle of an specific radius as indicator of noisyand unstable COP signals. Similarly, Baszczyk et al. [8] quantified the chaoticbehavior of the COP sway by computing the fractal dimension in the range of[1, 2], as a representative measure of COP instability. Finally, the approach ofCollins et al. [34] interprets the COP sway as a random-walk involving two Brow-nian motions for different time intervals (short term and long term). This motioncan be characterized by diffusion coefficients for each spatial motion component,used alongside with the critical time interval between them as descriptors of thepostural control general mechanics.
The above mentioned processing methods are implemented as algorithms withinspecialized software tools in the context of computerized posturography. Com-putational methods allow researchers to process dense, high-resolution datasetsand/or to provide real-time stabilometry analysis. Thus, new methods for dataanalysis as well as postural data acquisition devices are being developed to provideaccurate markers supporting postural control assessment.

22 CHAPTER 2. LITERATURE REVIEW
2.3 Balance measurement devices
As an alternative to functional balance tests, Computerized Posturography (CP)comprises a set of techniques and methods based on electronic instrumentation toprovide objective and quantitative measures related to the postural control stateof a subject [133]. In most of cases, CP assessment is performed in motion analysislaboratories (MAL), which consist of a set of different sensors and devices able toaccurately acquire and digitize multiple kinematic and kinetic data associated tothe static and dynamic balance [46, 133, 79].
On the other hand, computer vision techniques allowed the development of newmotion tracking systems that does not require as much equipment as a MALsystem does, since they rely on robust computational algorithms for detection ofmotion. From those two principal approaches, a brief description of the technolog-ical devices used for the measurement and quantification of balance are presentedbelow.
2.3.1 Motion Analysis Laboratories
Motion analysis laboratory (MAL), or also called gait analysis laboratory, is theterm used to refer to a room equipped with variety of synchronized and integratedsensors designed to provide quantitative information about the body mechanicsof the human body, intended to study its kinematic and kinetic behaviour duringphysical activities such as standing, walking or sport gestures [136]. MAL systemsare usually acquired by medical or academic institutions since they are expensiveand frequently demand considerable space as well as trained personnel [26, 136].Nonetheless, MAL systems are considered the most accurate alternative for motiontracking as well as objective assessment of static and dynamic balance, and theyhave supported rigorous studies in motion disorder characterization [55, 102, 9]and balance deterioration by aging [14, 52].
In terms of MAL equipment, there are a considerable variety of available sensorand devices. However, depending of the nature of the signal to be measured, theycan be grouped in three main categories: motion tracking (kinematics), forcesand torques (kinetics) and inner body physiological data (biosignals). A briefdescription of the most representative devices for each category is presented asfollows.

2.3. BALANCE MEASUREMENT DEVICES 23
Figure 2.6: Infrared cameras tracking position markers and two force platformmeasuring ground-reaction forces for each foot in a motion analysis laboratory. Re-trieved from http://www.qualisys.com/applications/human-biomechanics/
gait-rehab/(modified with permission)
Marker-based motion tracking
The detection of motion in a MAL system is achieved by placing a set of static-oriented (usually infrarred) cameras, able to obtain the position of a point-of-interest in a three-dimensional space through computer stereo vision algorithms[124]. This operation can be performed using a minimum of two cameras; however,additional cameras provide multiple matching trials to reduce 3D reconstructionerrors and to prevent occlusions. The point-of-interest 3D location is achievedby adjusting the threshold of the camera to visualize only a set of infrarred orretroreflective markers placed in representative body surface positions, accordingto a marker-set model endorsed for a particular motion analysis task [122]. Theset of 3D digital points, can be arranged in a computer to construct a bodygeometry model, suitable for the estimation of kinematic measures such as velocity,acceleration and rotation of body segments via inverse kinematics methods [136,138].

24 CHAPTER 2. LITERATURE REVIEW
Reaction forces measurement
A force platform consist of a rectangular plate supported on a arrangment offour force gauges located in the corners of the plate [19], although some designspresent only three gauges in a triangular disposition [15]. When a directed force isapplied onto the surface of the plate, each gauge measure a portion of such force,in xyz coordinates, related to the point of application and its direction. Aftersome calculations, the values given by all four gauges can be used to estimatethe point of application of the force, a.k.a as the center-of-pressure (COP), themagnitude of the ground-reaction-force and the applied torque with respect to anspecific point (normally the center of the platform or one of the corners) [136].
An alternative for force platforms are the pressure matrices. This device consistof a 2D array of pressure pad sensors intended to measure the applied pressureindividually [2]. In contrast to the gauges in a force platform, the pressure padscan not measure the applied force as a vector but as a scalar value [2]. However themultiple pads are able to provide a real time estimation of the spatial distributionof the weight (often visualized as a heat map). COP and ground reaction forcescan also be estimated indirectly with a pressure matrix, although its accuracy isworse in comparison to a force platform [64].
Biosignals
The measurement of inner body signals, e.g. heart rate or body temperature, areusual complements to the PCS assessment, since they are not directly correlatedwith the balance ability of a subject, yet the information about muscular contrac-tion obtained through electromyography (EMG) can be very valuable for motionanalysis and balance assessment [136]. When dealing with inverse dynamics, thelack of data about individual forces exerted by different groups of muscles during atask makes the calculation of dynamic variables less robust, and prone to estima-tion error. In order to improve the system accuracy, EMG can be integrated withthe motion tracking system and the force platform to provide a more complete setof data inputs to feed a structural model of the body intended to provide detailedbody motion information mechanics[65, 23].
2.3.2 Markerless motion capture systems
Given the recent developments in computer vision algorithms for object detec-tion and tracking in video sequences [124], new markerless technologies for human

2.3. BALANCE MEASUREMENT DEVICES 25
motion tracking have emerged, mainly in the entertainment industry and biome-chanics [123, 37, 36]. Those systems do not require subjects to wear specializedtracking equipment, allowing motion capture in a more comfortable and naturalway, and performing tracking in environments where markers could be impracti-cal, e.g. underwater activities [119]. Methods for markerless motion capture canbe divided into two major categories, depending on the camera setup: multiplecameras and RGB-D cameras, even though there are some approaches using asingle color camera [97]. The development of low-cost RGB-D, game-oriented sys-tems s.a. Microsoft Kinect, have proved to be a better cost-effective solution inmost of cases [140].
Motion tracking from multiple cameras
The physical setup for a markerless motion tracking system based on multiplecameras is similar to that based on infrarred cameras and markers (See 2.3.1).A set of static-oriented cameras are positioned around a delimited workspace,recording the motion that occurs inside of it as digital video. However, unlikethe marker-based systems, each camera detects every visible point within its fieldof view, that normally includes the whole silhouette of the subject as well asthe background behind it. In order to achieve motion tracking, the system mustimplement three steps using the multiple video inputs provided by the differentview of the cameras [28].
The first step consists of a human segmentation process suppressing the back-ground from the scene and delimiting the human body; this process is usuallyperformed by using Visual Hull (VH) or Mixture of Gaussian (MOG) [37, 123]algorithms. Once the human silhouettes have been extracted, the silhouette ineach camera is represented a a set of regions or points able to be positioned in athree-dimensional space using stereovision from multiple cameras and multiviewalgorithms [76]. Finally, the system performs motion tracking for each region orpoint using tracking algorithms, s.a. optical flow [76]. The whole process can beimplemented in real time or after video acquisition, depending on the computa-tional cost.
One of the principal advantages of markerless systems, apart from comfortability,is that they are able to track the motion of a greater number of body surface pointsin comparison to the limited number of tracked points in marker-based systems.Tracking large point collections can be used for 3D reconstruction, producing re-alistic three-dimensional meshes for visual inspection of the subject movement ina virtual environment [28, 76]. In terms of kinematic measures, both systems(markerless and marker-based) perform very similar for detection of body posi-

26 CHAPTER 2. LITERATURE REVIEW
tion and orientation; however when it comes to rotations of individual segments,such as arms or legs, markerless systems performance becomes considerably worsethan their marker-based counterpart, since its detection is based on silhouettesegmentation where rotations are hard to recognize [28].
RGB-D cameras: Kinect device
A RGB-D device is a dual camera composed of a typical RGB color camera, aninfrared emitter and a depth sensor, so that the system can produce augmented3D images using depth information, i.e. depth images containing the distance ofa specific point in the scene to the sensor position [85]. The use of depth imagesallows background suppression and human segmentation at the same time, andin an easier way in comparison to methods based on traditional RGB cameras.Stereo vision from multiple cameras is not required since the depth informationprovided by RGB-D is enough to produce 3D reconstruction of the scene withinits field of view.
One of the most representative RGB-D systems is the Microsoft Kinect sensor.It was released in 2010 as a low-cost motion capture system aimed to establish anew way for people to interact with video games (XBox 360 in this case) usingonly body gestures [140]. Human pose recognition with Kinect is possible thanksto the implementation of a skeleton tracking, developed by Microsoft, by iden-tifying 3D positions of body joints from single depth images [117]. In 2012, therelease of drivers, libraries as well as skeleton tracking models for Kinect as freesoftware packages (i.e. Microsoft SDK [60] and OpenNI+NiTE [1]), triggered the
Figure 2.7: Microsoft Kinect components. Retrieved from: https://msdn.
microsoft.com/es-co/library/jj131033.aspx

2.3. BALANCE MEASUREMENT DEVICES 27
development of a wide variety of ad hoc computer applications supporting ges-ture recognition, human-computer-interaction and motion analysis. Since then,applications based on Kinect technology have been extended to different scenariosbeyond video games including: 3D scanning, virtual reality, e-learning, robotics,and physical rehabilitation, among others.
In physical rehabilitation, Kinect based applications became a trending researchtopic because of its low cost and portability . Some of these approaches just eval-uated the effect of the integration of Kinect-based video games into traditionalphysical therapy interventions, demonstrating promising results in physical dis-ability rehabilitation. Pompeu et al. [100] reported a positive impact in patientswith Parkinson disease who played Kinect Adventures R© in a frequent base. Alsoin the context of Parkinson disease, Galna et al. [48] described the design of acustom video game based on exercise (i.e. an exergame), to improve dynamic pos-tural equilibrium. In Multiple Sclerosis, Ortiz et al. [91] evaluated popular Kinectgames like Kinect Sports R© and Kinect Adventures R© to enhance postural controlby means of a routine based in gaming sessions of 20 minutes, 4 times per week.Other works in the literature approached cerebral palsy therapeutic support [29],cognitive rehabilitation [51], leudodistrophy treatment [129] and even cases wheredisability is caused by a stroke and therapy is used to recover motor functionality[30, 93].
Beyond rehabilitation, the problem of accurate gait and PCS diagnosis supportthrough video-based kinematics and posturography has also been addressed usingKinect for postural data acquisition. Most of these works evaluated the validity ofthe kinematic measures obtained from the Kinect skeleton tracking model. Gabelet al. [47] measured arm kinematics in terms of stride intervals against wearablesensors. Schmitz et al. [112] studied the accuracy of joint angles measures incomparison to a digital inclinometer; similar approaches were also presented byBonnechere et al. [20] and Sosa et al. [120] in terms of range of motion usingstereophotogrammetry and goniometry respectively, as ground-truth. In posturalcontrol, Clark et al. [32, 33] explored the validity of Kinect measures has by com-paring the accuracy of a MAL system and the skeleton tracking model of Kinect(for XBox 360 and XBox One versions), in terms of marker position error for bothsystems. A few works have gone beyond direct measures to propose the creationor modification of the Kinect skeleton model to provide more accurate kinematics.An interesting approach was presented by Schwarz et al. [113] using kinematicdata from pre-established anatomical landmarks along with geodesic distances tobuild a graph-based representation of the depth map of Kinect, capable of per-forming accurate body part tracking based on optical flow methods.
As a final remark, most of the works in the literature related to motion tracking

28 CHAPTER 2. LITERATURE REVIEW
and postural control analysis using Kinect data, are constrained to deal withkinematic measures since Kinect only provides body joint positions along time.However, Gonzalez et al. [49, 50] reported an evaluation of the COG estimationaccuracy based on kinematic data from Kinect, using the measures obtained witha Wii balance board as ground truth, with decent results, even this work did notpropose a COG estimation method using Kinect skeleton tracking.
Chapter 3
Objectives
3.1 General Objective
Propose a method for postural control assessment based on stabilometry mea-sures using a regression model and a Kinect-based skeleton tracking framework tosupport physical therapy procedures.
3.2 Specific Objectives
1. Propose a regression model to estimate center-of-gravity trajectories usingthe skeleton geometry defined in a Kinect tracking framework.
2. Implement a method to estimate center-of-gravity according to the kineticand kinematic postural control data acquired from subjects using a forceplatform in a motion analysis laboratory.
3. Validate the proposed model against the measures obtained with the motionanalysis laboratory and force platform in terms of the estimation of center-of-gravity.
4. Evaluate the acceptance of the prototype system among patients and clinicalpersonnel in a case study of diagnosis support in patients with MultipleSclerosis.
29

30 CHAPTER 3. OBJECTIVES

Chapter 4
Materials and Methods
The estimation of objective balance measures, particularly the COG position,has been matter of interest for medical and biomedical engineering communitiesover the last few decades, given its relevance in postural control assessment [94].Typical approaches for COG estimation rely on accurate measures provided byhigh precision systems, e.g. motion analysis laboratories, and the comprehensionof human body mechanics [94, 11, 116]. However, the increasing number of data-driven solutions in the recent literature and the availability of low-cost acquisitiondevices are strong motivations to propose a novel strategy for the estimation ofthe COG position and trajectory, based on the computational analysis of posturaldata collections.
This chapter presents a novel data-driven method for the estimation of projectedCOG positions and trajectories from postural data provided by a RGB-D camera(i.e. a Kinect device). This approach is based on the biomechanical relationshipbetween posture and COG, leading to a regression model as it is explained insection 4.1. Then, the model fitting process is presented in section 4.2, followinga typical machine learning pipeline for regression analysis, including dataset con-struction, model fitting, and model evaluation. Additionally, section 4.3 proposesa complementary evaluation of the method in terms of its application in a clinicalscenario, related to the system acceptance among subjects with physical disabilityand clinical staff.
31

32 CHAPTER 4. MATERIALS AND METHODS
4.1 Model formulation
In this work, the COG estimation is approached as a regression problem, usingthe digital postural measures provided by a Kinect sensor as input data. Theformulation of the proposed method is presented as follows: first, the acquisitionof postural data using the Kinect skeleton model is described. Then, the pro-posed regression model (i.e. an artificial neural network), based on the geometricproperties of the Kinect skeleton model, is explained in detail, regarding to therelation between posture and COG obtained from force platform data and theexperimental setup supporting the model fitting. Finally, the implementation ofthe regression model supervised fitting and evaluation is presented, in order toapproximate the relation of both variables and perform further COG estimations.
4.1.1 Postural data acquisition
As it is described in section 2.3.2, approximated postural measures can be obtainedusing a RGB-D camera, a cost-effective system in comparison to a traditional MALsystems. To do that, some types of RGB-D cameras can be integrated within askeleton tracking function, allowing to obtain the 3D position of different jointpositions real-time, according to a skeleton tracking model.
Skeleton tracking model
Figure 4.1 depicts a hierarchical structure of 20 joints yielded by the Kinect API,returning a simple representation of a human skeleton. This joint set defines 19body segments which can be tracked to perform gesture recognition in video-gamesand general purpose human-computer interfaces [117]. The estimation of COGpositions from this body structure representation is particularly challenging sinceit is quite simplistic and prone to occlusion artifacts in comparison to complexmarker models from motion analysis laboratories. However, a dataset with aconsiderable number of postural observations from the Kinect skeleton model cansupport accurate enough COG estimations via regression analysis.

4.1. MODEL FORMULATION 33
Figure 4.1: Kinect skeleton tracking model. Retrieved from: https:
//hughfernandez.com/2012/07/04/skeletons-el-desarrollo-de-una-
interfaz-verdaderamente-natural/
Kinect acquisition specifications
Referring to the postural data acquisition, Kinect technical specifications can besummarized as follows1:
• Effective view angle: 43◦vertical, 57◦horizontal
• Depth image resolution: 640× 480 pixels
• Effective working distance: 0.5 to 4.5 meters (2 ∼ 3 recommended)
• Depth data resolution: 11 bits (2048 units)
• Acquisition rate: 30 frames-per-second
• Data transmission: USB 2.0 (up to 35MB/sec)
1Additional Kinect technical data are included in Appendix A.

34 CHAPTER 4. MATERIALS AND METHODS
In accordance to these specifications, a fixed working distance of 2.5 meters wasestablished in order to reduce the scale variability among observations. The ef-fective field of view is then (2 · 2.5) tan(57/2) = 2.71 meters horizontally and(2·2.5) tan(43/2) = 1.96 meters vertically, while spatial resolution at such distanceis 1.96/480 ≈ 4 mm vertically, 2.71/640 ≈ 4 mm horizontally and 4.5/2048 ≈ 2mm depth.
Each observation consists of a vector of 63 values containing a frame counter, atimestamp, an user id (used to ensure the tracking was performed for the samesubject during the whole acquisition) and the 3D position in meters for each ofthe 20 joints within a coordinate system whose the origin lies in the center ofthe Kinect device position (Figure 4.7). The data acquisition rate is set to 30frames-per-second given the the USB 2.0 connection, but it requires a computerwith a high-end processor (Core i3 equivalent or superior) and exclusive access tothe USB hub bandwidth.
4.1.2 COG estimation by regression analysis
To perform COG position estimation from postural data, this approach adoptsthe PCS representation proposed by Massion [80] summarized in Figure 2.3. ThisPCS model involves different input signals, coming from vision, vestibular andsomatosensory systems, so that the CNS gets the relevant information to performbalance control. A simplified representation of the PCS, concerning only to thecontrol of the COG position, is shown in Figure 4.2 (a). So, the PCS takes a COGposition reference associated to a midpoint position within the BOS ensuring equi-librium preservation. Then, the CNS estimates the required posture adaptationbased on the difference between the actual COG position and the COG reference.On the next step, CNS sends multiple activation signals to muscles which, depend-ing on the dynamic response of the body, determines the position of the differentbody segments such as the trunk or the limbs. Finally, the position of the bodyand its mass-distribution determine the current COG position, sent as feedbackto CNS to recalculate the required pose in a closed-loop control process.
According to this representation, COG can be estimated from the body-massdistribution applied to the different positions for all body segments. Then, aneural network whose architecture is chosen to resemble the Kinect skeleton modelgeometry, is proposed as a regression model to estimate the projection of the COGfrom joint positions, as it is illustrated in Figure 4.2 (b).
An artificial neural network is, indeed, a well suited method for the above men-tioned regression problem, since its architecture can be adapted accordingly to

4.1. MODEL FORMULATION 35
Figure 4.2: System representation of the balance function where COG is related tothe position of body segments as observable variables. Wide gray arrows representmultiple simultaneous signals
the nature of the hierarchical structure of the body. Additionally, neural networkshave proved to be a remarkable approach to solve multiple regression and classifi-cation problems in variety of scenarios, e.g. time-series analysis, computer vision,speech and text processing [71, 73].
Artificial Neural Network model
Artificial neural networks (ANNs) are non-parametric estimators, able to performboth regression and classification tasks [6]. ANNs are inspired by the biologicalactivity of the brain related to information processing and learning tasks [6, 130].The basic processing units constituting ANNs are called ”neurons”, ”perceptrons”[6, 31] or ”nodes” under the graph theory terminology. Each node is a simplifiedversion of a biological neuron which activates at a certain output level, accordingto the linear combination of its inputs, following a nonlinear function:
yi(x,wi) = ϕ
d∑j=1
wij xj + wi0
where yi is the output of the i-th node, ϕ is a non-linear activation function,e.g. the sigmoid function, the hyperbolic tangent or the rectified linear function(ReLU), d is the number of inputs of the node, wij are the weights of the i-th

36 CHAPTER 4. MATERIALS AND METHODS
node to perform a weighted sum of the inputs xj plus an intercept value knownas bias unit wi0.
Additionally, multiple nodes, with different weights wi, can be arranged into alayer to produce multiple outputs which can be further processed by a subsequentlayer of nodes connected to the next layer, an so on. Such layout is commonlyknown as ”feed-forward”, one of the most common architectures in the machinelearning and deep learning contexts.
Each node output value can be calculated using the previous equation, however,since inputs and outputs can be represented as vectors, and the weights as ma-trices, it is possible to calculate the output vector for all node in a layer using itsmatricial form:
yk×1(xd×1,Wk×d, bk×1) = ϕ (Wx+ b)
where y is the output vector of a layer with k nodes, f is the non-linear activationfunction applied to every node element-wise, x is the input vector with d inputvalues, W is the matrix of weights with k rows associated to the d weights for eachnode, and b is a vector containing all the weights of the bias units in the layer.
In terms of a regression problem, given a set of target values y, the networkweights can be adjusted through an iterative gradient descent method, e.g. Ada-Grad, RMSprop or Adam [109], to minimize the error between target values y andestimations y according to an appropriate loss-function. By combining multiplenodes in a single layer, and then stacking multiple layers in a network, ANNscan achieve high-level representations of the input data, able to perform complexnon-linear calculations s.a. high-dimensional data fitting.
Neural network for COG estimation
The proposed neural network architecture consists of four layers (one input p, twohidden h1 and h2, and one output node y) following the hierarchical representationof the body from the Kinect skeleton model (Figure 4.3). To achieve posturaldata regression for COG estimation, input observations are represented as vectorscontaining 38 joint positions (px or pz) for only one spatial component, dependingon the coordinate of the COG to be estimated (x or z in platform coordinates).On the other hand, the target measures, intended to guide the network trainingprocess, are COG position coordinates (yx or yz), depending on the coordinatesestablished by the input data (px or pz). For this work, only one neural networkis used to estimate COG position along either x or z direction. So, from now on,input data will be referred as p and target measures as y, independently of theCOG position coordinate to be calculated.

4.1. MODEL FORMULATION 37
Figure 4.3: Proposed neural network architecture for COG estimation from theposition of the different body joints provided by the Kinect skeleton model
Based on such configuration for input data and target measures, each one of thelayers are detailed as follows. For the input layer p, the number of nodes (38 intotal) is determined by joint pairs defining each of the 19 segments . Since inputvector p obtained from Kinect skeleton tracking has only 20 position coordinates,a new vector p is defined by repeating and reorganizing the elements of p inpairs, according to the hierarchical structure of the Kinect skeleton model, asit is presented in Table 4.1. Additionally, although the input data are positioncoordinates, either in the x or z direction, all the values must correspond to thesame coordinate for an unique body posture. Then, COG estimation is made interms of the same coordinate system as the input p for a specific body posture.
Once the input data p has been rearranged in the input layer p, the nodes in thefirst hidden layer h1 perform a weighted average of each pair of input nodes toestimate the contribution of each joint about the COG position for all differentbody segments. For such reason, h1 is a partially-connected layer (Figure 4.3),and most of the values in the weight matrix W1 must be set to zero by adding aclipping matrix C, which is element-wise multiplied by W1 with no bias unit and
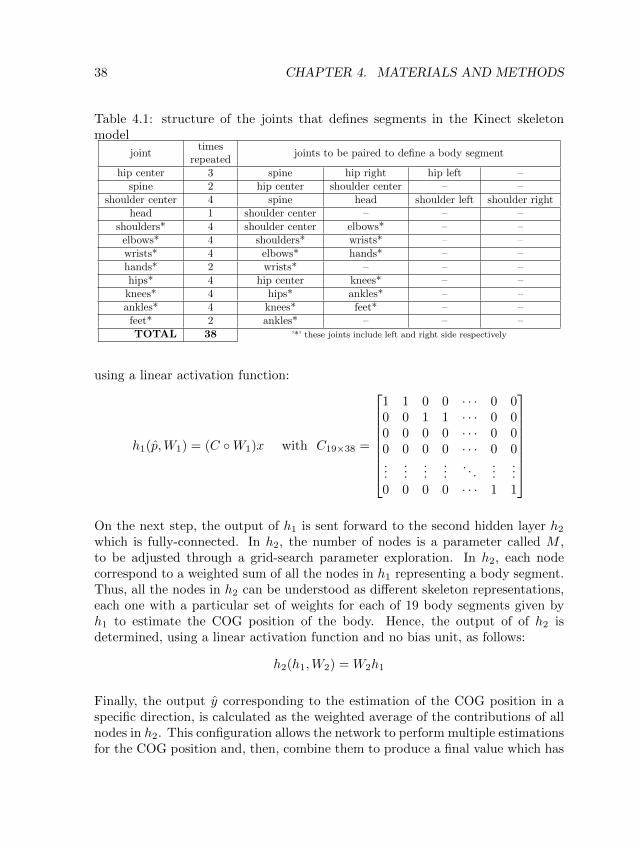
38 CHAPTER 4. MATERIALS AND METHODS
Table 4.1: structure of the joints that defines segments in the Kinect skeletonmodel
jointtimes
repeatedjoints to be paired to define a body segment
hip center 3 spine hip right hip left –spine 2 hip center shoulder center – –
shoulder center 4 spine head shoulder left shoulder righthead 1 shoulder center – – –
shoulders* 4 shoulder center elbows* – –elbows* 4 shoulders* wrists* – –wrists* 4 elbows* hands* – –hands* 2 wrists* – – –hips* 4 hip center knees* – –
knees* 4 hips* ankles* – –ankles* 4 knees* feet* – –
feet* 2 ankles* – – –TOTAL 38 ’*’ these joints include left and right side respectively
using a linear activation function:
h1(p,W1) = (C ◦W1)x with C19×38 =
1 1 0 0 · · · 0 00 0 1 1 · · · 0 00 0 0 0 · · · 0 00 0 0 0 · · · 0 0...
......
.... . .
......
0 0 0 0 · · · 1 1
On the next step, the output of h1 is sent forward to the second hidden layer h2which is fully-connected. In h2, the number of nodes is a parameter called M ,to be adjusted through a grid-search parameter exploration. In h2, each nodecorrespond to a weighted sum of all the nodes in h1 representing a body segment.Thus, all the nodes in h2 can be understood as different skeleton representations,each one with a particular set of weights for each of 19 body segments given byh1 to estimate the COG position of the body. Hence, the output of of h2 isdetermined, using a linear activation function and no bias unit, as follows:
h2(h1,W2) = W2h1
Finally, the output y corresponding to the estimation of the COG position in aspecific direction, is calculated as the weighted average of the contributions of allnodes in h2. This configuration allows the network to perform multiple estimationsfor the COG position and, then, combine them to produce a final value which has

4.2. EXPERIMENTAL SETUP 39
to be approximated to the target measure y. Depending on the number of nodesM in h2, the output y is calculated as follows:
y(h2,W3) =
M∑j=1
W3jh2j + b′
using a linear activation function and a bias unit b′ with a different value dependingon the component of the COG to be estimated (x or z in platform coordinates).
It can be observed that the layers h1, h2 and the output y have a linear activationfunction ϕ(x) = x. The selection of a linear output is consistent to the definitionof the center-of-gravity as the average of the spatial mass-distribution defining avolume (chapter 2). In a similar way, the absence of the bias unit in h1 and h2is consequence of the COG expression, which does not involve intercept coeffi-cients. However, the output node y has a bias unit whose weight value changesdepending of the coordinate of the COG to be estimated (yx or yz). This is be-cause of the position measures yielded by Kinect come from the frontal surfaceof the subject instead of an anatomically correct inner body position. Thus, theCOG estimations may be shifted in comparison to target measures and should becorrected.
4.2 Experimental setup
To estimate COG positions, the typical stages of a modeling method based ondata analysis, particularly a machine learning approach, were implemented. Thosestages include: the dataset construction, the model fitting and its validation. Forthis case, the data acquisition process is described in detail since data are not re-trieved from a public or third-party database, but requires to be constructed fromown measures obtained with a Kinect and a force platform in a motion analysislaboratory. Besides, the model fitting process follows some guidelines commonlyapplied for deep neural networks. After that, the best parameter combination isfound via cross-validation, a method widely used in data analytics ensuring a fairevaluation of the model in terms of the predicted measures.
4.2.1 Data acquisition and preprocessing
According to the neural network model described in section 4.1.2, the datasetmust involve a set of input observations p and set of target measures y to allow

40 CHAPTER 4. MATERIALS AND METHODS
the model to minimize the error between y and estimations y. As illustrated inFigure 4.4, the input observations correspond to the 3D joint positions yielded byKinect skeleton tracking model and the target measures are the COG positionsestimated from COP trajectories obtained from a force platform. Both types ofdata must be pre-processed in order to make them compatible in terms of spaceand time scale. Thus, a description of the acquisition and estimation of COGgroun-truth measures, as well as the spatial transformations applied to Kinectpostural data are described.
COG from COP measurements
To fit the regression model, proper ground-truth measures related to the COG po-sition must be acquired to obtain accurate estimations after model fitting process.Ideal ground-truth data are obtained by direct measurement using high accuracyexperimental devices. However, in the case of COG, this must be estimated froma motion analysis laboratory, since experimental COG values are not available.Nevertheless, the COP trajectories yielded by a force platform are high-resolutionand accurate signals that can be used to estimate actual COG positions onto thesupport surface. This is possible based on the biomechanical relationship between
Figure 4.4: Proposed model for the estimation of COG from position of jointsprovided by Kinect using COP trajectories obtained with a force platform astarget measures

4.2. EXPERIMENTAL SETUP 41
Figure 4.5: System representation of the balance function where COG is related tothe COP position as an observable variable. Wide gray arrows represent multiplesimultaneous signals
COG and COP (Figure 4.5).
From the PCS point of view, the CNS estimates a new pose to be adopted basedon the difference between actual COG position and the COG reference, then,it sends multiple activations to different groups of muscles. However, in thiscase, muscular activity is not observed through the position of body segmentsbut through the position of the average contribution of the ground reaction forcesexerted by the body, i.e. the COP. Finally, the COP and the ground reaction forcevector determine the COG position depending on the inertial resistance exhibitedby the body (Figure 4.5).
This relation between both variables has been studied in previous works to esti-mate the COG position from COP direct measures, s.a. Shimba [116] and Bendaet al. [11]. Shimba proposed the use of a set of dynamic equations relating COPposition, acceleration and the ground-reaction force vector to predict the move-ment of the COG. On the other hand, Benda et al. observed that, onto the surface,the COG trajectories look smoother than the COP, but with a similar path pat-tern that can be obtained through a low-pass filter, a moving-average in their ownimplementation.
Based on the work of Benda et al. [11], a moving-average with a period of T = 1 sis applied to the experimental COP trajectories obtained from the force platform

42 CHAPTER 4. MATERIALS AND METHODS
to produce high-resolution COG estimations:
COG[i] =1
N
N−1∑k=0
COP [i+ k] with N = 1000
Platform specifications
The COP data acquisition was performed using a force platform AMTI AccuGaitOptimized (Appendix E) whose specifications, in terms of COP, are listed below:
• Supporting area: 502 × 502 mm
• Maximum weight capacity: 1134 N ≈ 115 kg
• COP data resolution: 32 bit (floating point data representation)
• COP accuracy: 0.005 mm (0.01 %)
• Acquisition rate: up to 1000 Hz
• Data transmission: USB 2.0 (up to 35 MB/sec)
COP data preprocessing
Since the Kinect and the force platform are not time-synchronized during acqui-sition (See platform and Kinect technical specifications), a further pre-processingstage must be applied to subsample and interpolate COG target measures tomatch the to Kinect postural data acquisition rate.
Kinect sensor and force platform acquisition processes are independent of eachother, since they are connected to different computers and operated using differ-ent software. Furthermore, both systems start data acquisition with practically nodelays after clicking a ”start” button in their respective graphical user interfaces.So, it was necessary to implement two hardware mouse emulators using a micro-controller ATMega 32U4 (included in the Arduino-micro board), to be triggeredsimultaneously using an external button. Previous tests for this synchronizing de-vice showed that time differences between both emulators were below 5 ms, lowerthan Kinect sampling period (∼ 33 ms).
Even with a synchronized trigger system, there are still temporal mismatchesbetween the measures yielded by both devices due to their different acquisition

4.2. EXPERIMENTAL SETUP 43
Figure 4.6: Temporal mismatch between Kinect and force platform measures dueto the different sampling frequencies of both devices
rates (30 Hz and 1000 Hz for Kinect and platform respectively) as can be observedin Figure 4.6. To overcome such temporal offset, a new set of measures are builtupon subsampled COP trajectories in order to match the timestamps in the Kinectdata structure. To guarantee COG point sampling, they were interpolated usinga cubic spline, performed all across the COP points using the function interp1dfrom the scipy Python package [62].
Postural data preprocessing
Even with Kinect and platform signals properly synchronized, they are still spa-tially incompatible since joint positions and COP trajectories are referred to dif-ferent coordinate systems (Figure 4.7). Both of them use real units, i.e. meters,however, platform coordinate system is centered in the corner of the plaftorm withy axis perpendicular to the plane defined by the supporting surface (this is whythe COP is defined in terms of x and z coordinates). On the other hand, jointpositions given by Kinect use a coordinate system with the origin in the centerof the device, with its z axis pointing in the opposite direction from that of theplatform z axis. Additionally, subtle rotations are necessary because both Kinectorientation and tilt angle are manually adjusted. Then, an affine transformationis applied to the Kinect coordinate system in order to match the platform spatialreference. Such transformation consists of a rotation and a translation, performed

44 CHAPTER 4. MATERIALS AND METHODS
through a matricial product in homogeneous coordinates:
P3×1 = [R|t]3×4K4×1
where P is a vector with the 3D position of COG in platform coordinates, K isa vector with the 3D position of a Kinect joint in homogeneous coordinates, Ris the rotation matrix formed by 3 rows, corresponding to the coordinates (x,yand z) from the 3 platform axes (unit vectors) in the Kinect coordinate system,and t = −RC is the translation vector calculated from R and the platform originposition C in Kinect coordinates.
The position and orientation of each unit vector axis were obtained using a set ofthree reflective markers placed onto the platform and registered with Kinect priorto data acquisition process. One marker is placed in the origin of the platformcoordinate system C and the other two in the direction of x and y axis, the left zaxis is calculated as a cross product of x and y axes.
Figure 4.7: Position and orientation of the Kinect coordinate system in real-worldcoordinates with the origin in the force platform

4.2. EXPERIMENTAL SETUP 45
Upon pre-processing, COP and joint positions were referred to the platform coor-dinate system at a time resolution of 30 Hz (frames-per-second), according to theKinect acquisition rate. A visual inspection of this spatiotemporal calibration wasperformed on a set of videos showing the simultaneous evolution of experimentalCOP and postural data along a particular exercise, as shown in (Figure 4.8).
4.2.2 Subject sample for postural data acquisition
Both COG trajectory and postural data collections must be obtained simulta-neously from subjects during the execution of functional balance tests, in orderto support the model fitting and validation processes. Thus, it is necessary toacquire a significant number of observations to prevent potential biases and/orartifacts in the dataset. The following subsections describe the statistical guide-lines adopted to estimate the sample size and the selection criteria applied to theexercises supporting the acquisition process.
Figure 4.8: Visualization of COP trajectories and postural data after spatio-temporal preprocessing

46 CHAPTER 4. MATERIALS AND METHODS
Table 4.2: Weight and height statistics reported in literature for the selected studypopulation
Study GenderWeight (kg) Height (m)µ σ µ σ
Vargas et al. [131]Men (18-25) 64.1 9.8 1.72 0.07Women (18-25) 54.3 8.1 1.58 0.06
Estrada et al. [45]Men (20-29) 66.9 10.4 1.70 0.06Women (20-29) 56.6 8.9 1.57 0.06
Reference population
The target population consists of healthy subjects with ages between 18 and 25years. The sample size estimation was based on the body-mass-index (BMI) dis-tribution [68]. Two studies were found reporting Colombian biometric data (i.e.,weight and height, both needed to calculate BMI), focused on students between18 and 25 years old in Bogota-Colombia [131], and on working people between20 and 29 years old in Colombia [45]. The principal findings of these studies aresummarized in Table 4.2
Sample size estimation
Since the anthropometric statistics reported from literature are reported for menand women separately, they had to be unified through the combination of tworandom samples artificially generated from by using mean and standard deviationin Table 4.2, for men and women respectively. Then, a new set of parameters areestimated using the normfit function provided by MATLAB [81]. Finally, BMImean value and standard deviation are calculated by applying the BMI formulafor every observation of the generated sample:
BMI =Weight
(Height)2
Then, estimated mean and standard deviation values for BMI among people be-tween 18 and 25 years old were:
• µ = 21.68 and σ = 3.75 from the statistics of Vargas et al. [131]
• µ = 23.10 and σ = 4.18 from the statistics of Estrada et al. [45]

4.2. EXPERIMENTAL SETUP 47
These values are then used to estimate the sample size [98]:
n ≥ z2σ2
e2
where n is the estimated size of the sample, σ is the standard deviation of thevariable of interest, i.e. BMI, z is the value associated with the confidence intervalof a normal distributed variable (commonly z=1.96 for 95 % confidence), and eis the error tolerance, set to 7.5 % of the mean µ. Using this expression on theresults of Vargas et al. and Estrada et al., the following sample size estimationswere obtained:
n1 ≥1.962 ∗ 3.752
(0.075 ∗ 21.68)2≥ 21 and n2 ≥
1.962 ∗ 4.182
(0.075 ∗ 23.1)2≥ 23
Inclusion and exclusion criteria
For this study, subjects were chosen to meet the following requirements, in orderto perform reliable data acquisition sessions within a period of a few weeks andto provide appropriate balance measures for model fitting process.
Inclusion criteria: People between 18 and 25 years old, students of the Uni-versidad Central, able to hold TANDEM position during two minutes or morewithout assistance.
Exclusion criteria: People with anatomical abnormalities, amputations or aphysical disability condition affecting the ability to hold upright position for twominutes or more.
4.2.3 Data acquisition protocol
Selected exercises
Figure 4.9 shows the selected exercises to perform COP and postural data acquisi-tion for each subject in the study, directly extracted from standard balance tests:(1) standing unsupported during 30 second with wide supporting base, (2) stand-ing unsupported during 30 seconds with feet together, (3) standing unsupportedduring 30 second with closed eyes and feet together, (4) standing unsupported

48 CHAPTER 4. MATERIALS AND METHODS
Figure 4.9: Exercises included in the balance test for the generation of posturaldata
during 30 seconds with one foot in front, a.k.a Tandem position, (5) standingunsupported on one foot during 30 seconds, (6) perform forward functional reachtest 4 times without exceed one minute, (7) perform lateral functional reach test4 times without exceed one minute. Particularly, tasks [1,2,3,4,5] come from theBerg Balance Scale (BBS) [13] while tasks [6,7] correspond to the Forward andLateral Reach test [44, 21]. This set of seven physical tasks were selected takinginto account the following criteria:
• Exercises must be performed in frontal view respect to the Kinect with norotations or object interactions.
• Exercises must be performed within the area defined by the force platform,no gait tasks are allowed.
• The duration of each exercise can not exceed 1 minute.
The exercises from BBS provide narrow COG trajectories to test model accuracy

4.2. EXPERIMENTAL SETUP 49
within short regions. On the other hand, the execution of the functional reachtest yields wide COG trajectories, allowing the model to obtain COG estimationsover large regions within the area defined by the force platform.
Acquisition protocol
The proposed balance test was designed to be executed in approximately 10∼15minutes in order to perform data acquisition for 8∼10 subjects in a couple of hours.For the selected exercises, the acquisition process followed the steps described inProtocol 1.
Protocol 1 Balance test for acquisition of COP and postural data
1. Prior to any test, spatial calibration between Kinect and platform must be per-formed once, following the guidelines described in section 4.2.1.
2. For each test, an informed consent is given to the subject explaining the objectiveof the test, some recommendations and involved risks, e.g. falling during balancetest.
3. Check the subject meets the established inclusion and exclusion criteria.
4. The subject is positioned onto the platform in frontal view respect to the Kinect.
5. The acquisition systems (platform and Kinect) are checked in order to be readyto be triggered by the synchronizing starting device, i.e. the mouse emulators.
6. The first exercise is explained to the subject informing its correct execution andduration.
7. The subject starts the task execution at the same time Kinect and platform ac-quisition systems are triggered.
8. After the task is finished, the acquisition is stopped and exported to a file, thesubject can rest in standing position onto the platform.
9. Repeat steps 6 to 8 for each of the exercises in the test.
10. End the balance test for that subject. Next one must be ready to perform thesame acquisition protocol.
4.2.4 Model fitting and validation
In terms of model parameterization, ANNs might have a considerable numberof parameters to be adjusted in order to minimize the mismatch error betweenestimations y and target measures y. Thus, several assumptions must be made

50 CHAPTER 4. MATERIALS AND METHODS
in relation to the problem to be addressed, the computational cost or the struc-ture of the data, in order to reduce the configuration alternatives to a feasiblenumber of parameter combinations. The parameterization setup for the proposedneural network follows the usual recommendations about training deep-learningmodels [74, 12], in addition to some restrictions given by the nature of the re-gression problem. For this case, the model fitting is presented in two sections:the hyperparameter adjustment using experimental data, and the cross-validationsetup implemented to evaluate the performance of the model and to select thebest hyperparameter combination.
Hyperparameter tuning
To perform model fitting, an Adam optimizer [70] was selected to train the neuralnetwork, using a stochastic gradient descent approach, since it allows to adapt thegradient magnitude applied in network weight updating process, avoiding potentialdivergences. Additionally, a loss-function has to be defined, in order to quantifythe error between y and y. In this work, a mean-squared error between y and ywas selected:
L(y, y) =1
B
B∑i=1
(yi − yi)2 for a batch of B data observations
given such loss functions are widely used for regression problems in euclideanspaces while conforming the convexity requirements ensuring training convergence.
The parameter values providing the best possible performance (according to thefinal loss-function value) are commonly found by testing different parameter com-binations. For this work, a grid-search process was performed for the learningrate, α (magnitude of the weight correction in each iteration ), the batch size B(number of observations to calculate the error between y and y), and the epochs E(the number of network iterations over the entire training dataset). Additionally,the number of nodes M in layer h2 was also included in the grid-search configu-ration. In summary, the range of values assigned for each parameter is presentedbelow (1000 possible combinations).
• Learning rate (α): {1, 1e−1, 1e−2, 1e−3, 1e−4}• Batch size (B): {16, 32, 64, 128, 256}• Epochs (E): {100, 200, 500, 1000, 2000}• Number of nodes in h2 (M):{1, 2, 4, 8, 16, 32, 64, 128}
4.3. CASE STUDY: BALANCE ASSESSMENT IN MULTIPLE SCLEROSIS51
Cross-validation setup
To minimize the error between estimations y and target measures y, a trainedmodel can achieve a very complex representation of the data that may lead tooverfitting, i.e., the inability of the model to generalize the underlying structureof the data, leading to a poor performance when the trained model deal withnew observations. To avoid such phenomenon, dataset is usually partitioned intotraining and validation subsets. The first one allows model fitting, while the otheris used to evaluate the performance with unobserved data.
So, a leave-one-out cross-validation was performed using a data subset correspond-ing to the first 60 % of the subjects. In this leave-one-out setup, the data from13 subjects is used to fit the model, while the data from the remaining subjectallowed the resulting model evaluation. This process is performed iteratively, us-ing a different subject to provide validation data at each iteration. The overallperformance of this method (in terms of the loss-function) is the average acrossthe 14 possible combinations. This averaged measure was used to find the besthyperparameter combination by grid-search exploration.
The leftover 40 % of the subjects were used to provide the test data, in order toevaluate the estimation performance of the fitted model. The use of three datapartitions (train, validation and test) is a common technique in machine learningto perform reliable model performance evaluation, since the final hyperparameterconfiguration may be biased due to the repeated use of validation data along modelfitting.
4.3 Case study: balance assessment in MultipleSclerosis
This MSc Thesis belongs to a long term research project, intended to providebalance assessment support in clinical scenarios. So, a complementary qualitativeacceptance evaluation is proposed, for both physiotherapists and Multiple Sclerosispatients. This evaluation is carried out by surveying those groups, to explore theirreception of the proposed method and its related technological tools.
Clinical staff (physiotherapists) were asked to grade the contribution and func-tionality of the balance assessment provided by the model and its associated soft-ware implementation, while patients with a neurodegenerative disease evaluatedthe benefits of using real time visualization tools during the execution of balance

52 CHAPTER 4. MATERIALS AND METHODS
tests. For this study, the evaluation was focused on patients with Multiple Sclero-sis from Fundacion colombiana para la esclerosis multiple (FUNDEM) and a groupof physiotherapists from Universidad Manuela Beltran (Bogota, Colombia). Bothinstitutions were selected since they have a collaborative agreement with Universi-dad Central about the use of technological tools to support physical rehabilitationprocesses. The surveys for patients and physiotherapists are independent, withdifferent evaluation criteria as described below.
4.3.1 Balance test description
Subjects
For the selection of clinical personnel, undergraduate physiotherapy students fromUniversidad Manuela Beltran were invited to participate in the proposed casestudy to evaluate the use of a computational balance assessment tool in physi-cal disability. Participation of physiotherapists was voluntary and required theirattendance to two different sessions: a training course to perform balance dataacquisition using the postural acquisition software used for model fitting, and theevaluation of the estimated COG trajectories from patients in terms of balancefunction assessment.
Respecting to patients, they must be able to perform a similar balance test asthe one performed for model fitting process (Section 4.2.3). Thus, patients shouldmeet the following requirements for a proper balance test execution.
Inclusion criteria: Adult people with a Multiple Sclerosis condition with lessthan 20 years after onset, able to perform at least 3 exercises included in theproposed balance test without assistance. 20 years or less is recommendable sinceMultiple Sclerosis has not reached a severe condition.
Exclusion criteria: People unable to hold upright position without assistance,or with a cognitive limitation that might interfere with a proper understanding ofthe balance test execution.
Balance test description and protocol
The balance test for the case study must be able to be performed by patientswithout overexerting while following the instructions given by the specialist. This
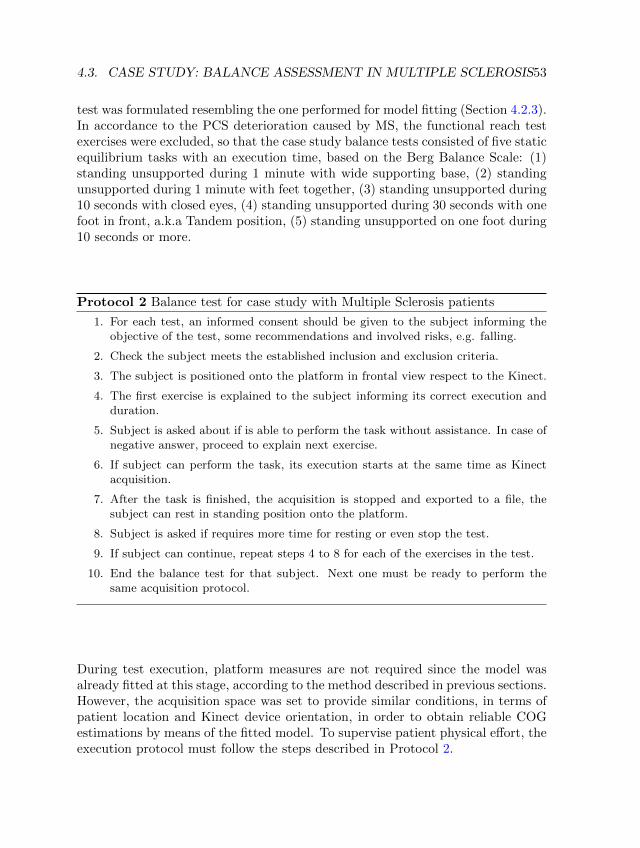
4.3. CASE STUDY: BALANCE ASSESSMENT IN MULTIPLE SCLEROSIS53
test was formulated resembling the one performed for model fitting (Section 4.2.3).In accordance to the PCS deterioration caused by MS, the functional reach testexercises were excluded, so that the case study balance tests consisted of five staticequilibrium tasks with an execution time, based on the Berg Balance Scale: (1)standing unsupported during 1 minute with wide supporting base, (2) standingunsupported during 1 minute with feet together, (3) standing unsupported during10 seconds with closed eyes, (4) standing unsupported during 30 seconds with onefoot in front, a.k.a Tandem position, (5) standing unsupported on one foot during10 seconds or more.
Protocol 2 Balance test for case study with Multiple Sclerosis patients
1. For each test, an informed consent should be given to the subject informing theobjective of the test, some recommendations and involved risks, e.g. falling.
2. Check the subject meets the established inclusion and exclusion criteria.
3. The subject is positioned onto the platform in frontal view respect to the Kinect.
4. The first exercise is explained to the subject informing its correct execution andduration.
5. Subject is asked about if is able to perform the task without assistance. In case ofnegative answer, proceed to explain next exercise.
6. If subject can perform the task, its execution starts at the same time as Kinectacquisition.
7. After the task is finished, the acquisition is stopped and exported to a file, thesubject can rest in standing position onto the platform.
8. Subject is asked if requires more time for resting or even stop the test.
9. If subject can continue, repeat steps 4 to 8 for each of the exercises in the test.
10. End the balance test for that subject. Next one must be ready to perform thesame acquisition protocol.
During test execution, platform measures are not required since the model wasalready fitted at this stage, according to the method described in previous sections.However, the acquisition space was set to provide similar conditions, in terms ofpatient location and Kinect device orientation, in order to obtain reliable COGestimations by means of the fitted model. To supervise patient physical effort, theexecution protocol must follow the steps described in Protocol 2.

54 CHAPTER 4. MATERIALS AND METHODS
4.3.2 Evaluation of acceptance
This qualitative evaluation consists of two independent surveys given to patientsand physiotherapists separately, each divided in two different parts. The firstsection evaluates the use of a technological tool for balance information acquisition.Subsequently, the second section examines the comprehension and relevance ofthe COG estimations given by the proposed regression model in terms of balanceassessment. Each of the surveys are further described below.
Survey for patients
The patient-oriented survey includes 6 questions, 3 of them to be answered af-ter balance test execution and the remaining 3 after discussing the test results(estimated COG trajectories). So, the first 3 questions evaluate the acceptanceof the Kinect and the data acquisition software during the balance test execu-tion in terms of comfortability, and potential benefits in comparison to traditionalbalance assessment sessions. On the other hand, last questions evaluate theirunderstanding about the COG trajectories explained by an expert and the contri-bution of objective balance measures to make physical rehabilitation proceduresmore attractive. The survey instrument was designed an applied as follows2:
1. Answer after balance test execution
(a) The test execution does require additional effort (physical or mental)in comparison to traditional assessment
(b) The use of technological tools makes balance test execution more at-tractive
(c) Which are the principal contributions about the use of technologicaltools for balance assessment
2. Answer after results presentation
(a) The presented results are understandable and can be associated withactual balance function state
(b) The visualization of objective measures makes the diagnosis from anexpert more understandable
(c) Assuming the permanent availability of these kind of tools in differ-ent scenarios. Which of the following actions would you be willing toperform in terms of physical rehabilitation?
2The complete format in Spanish is presented in Appendix C.

4.3. CASE STUDY: BALANCE ASSESSMENT IN MULTIPLE SCLEROSIS55
Survey for physicians
The instrument given to physiotherapists also has 6 questions, 3 to be answeredafter a balance test data acquisition, and 3 after a visual examination of theCOG trajectories yielded by the model, in terms of balance and postural controlassessment. First 3 questions assess the software usability to perform posturaldata acquisition and explore their opinion on the sufficiency of the acquired datato estimate balance measures. Last questions examines the comprehension of theobtained results after visual inspection and their potential contribution for balancefunction assessment in comparison to standard functional balance test such asBerg Balance Scale. In those last questions, clinical staff are also asked about theinclusion of new measures, or visualization elements, able to be constructed frompostural data, as expert hints for further development.
The corresponding questions are presented below3:
1. Answer after balance test execution
(a) Could you use the acquisition tool without significant interference incomparison to regular assessment procedures?
(b) Do you understand the nature and the relevance of the acquired mea-sures?
(c) Do you consider that acquired measures are representative of the pa-tient balance function?
2. Answer after results visual examination
(a) Do you consider the presented results useful and comprehensible?
(b) Do you think that presented results provide additional information tothe balance function assessment in comparison to traditional balancetest such as Berg Balance Scale?
(c) Would you add, modify or remove elements regarding to the presentedresults?
3The complete format in Spanish is presented in Appendix D.

56 CHAPTER 4. MATERIALS AND METHODS

Chapter 5
Results
This chapter presents the results and evaluation of the proposed model for COGestimation from postural data from Kinect skeleton tracking. The model evalu-ation was carried out following the common guidelines recommended for most ofthe regression methods, particularly those related to machine learning approaches.Such results are described in detail in the following sections, including sample anddataset descriptions, the parameter exploration leading to the fitted model (andits corresponding validation) and some representative examples of the COG tra-jectories estimated by the model. Additionally, the results corresponding to thecase study and the acceptance evaluation are presented at the end of this chapter,s.a. the COG trajectories estimated for balance tests applied to patients with MS,and the survey report.
5.1 Acquired postural data
5.1.1 Sample description
A group of 23 subjects (10 women and 13 men) from Universidad Central between18 and 25 years of age, were included in the study in accordance with the samplesize estimated in Section 4.2.2 (Table 5.1). The whole group of subjects weredivided into two subsets with 14 and 10 individuals, respectively, to perform thebalance test described Section 4.2.3. The data obtained from first group was usedfor model fitting via cross-validation, while the data from second group was used
57

58 CHAPTER 5. RESULTS
for testing.
Before to balance test execution, all subjects were asked to fulfill an informedconsent and inform its weight and height. The collected data is summarized inTable 5.1, agreeing with the statistical description reported by Estrada et al.[45] (Table 4.2). Thus, this representative sample provides significant posturaldata and experimental COP trajectories by a Kinect device and a force platformrespectively, in a motion analysis laboratory.
Table 5.1: Sample anthropometric description (weight and height) for data acqui-sition
subjectsWeight (kg) Height (m)
min max mean min max meanMen 13 58 74 62.25 1.55 1.79 1.71Women 10 45 65 53.9 1.48 1.67 1.58
5.1.2 Dataset description
Data acquisition process was carried out in two different sessions at Movylab,a motion analysis laboratory of Fundacion Universitaria de Ciencias de la Salud(Bogota, Colombia). For each session, the Kinect sensor position was set to matchthe coordinate system of the MAL according to its force platform (AMTI AccuGaitOptimized) using its corresponding acquisition software (VICON Nexus v2) toprovide properly aligned and synchronized measures with the support of the Kinectspatiotemporal calibration software developed for this work.
A summary of the dataset collected by using such experimental setup is presentedin Table 5.2, corresponding to 161 individual acquisition sequences (7 sequencesfor each of 23 subjects in the sample). Different filetypes were generated for differ-ent signal streams produced during data acquisition process. Each signal streamcorresponds to: the skeleton tracking data provided by Kinect (joint positions),the COP position yielded by the force platform (COP), and the resulting cal-ibrated joint and COG positions (joints + COG, as it is described in sections4.2.1 and 4.2.1). CSV is a standard format for tabular data commonly used toregister Kinect joint positions along time, TRC is a similar format intended tosupport joint movement visualization in OpenSim [40], MOT is the default VI-CON Nexus output format, containing the entire force platform data (e.g. COP,ground-reaction-forces and torques), and DAT files correspond to plain text tab-ular information, containing aligned postural and COP positions for x and z co-ordinates independently.

5.1. ACQUIRED POSTURAL DATA 59
Table 5.2: Postural information dataset from Kinect and platform measures afteracquisition process and offline alignment preprocessing
Measure Filetype Recordings Data size ObservationsRecording
time (total)joint
positions.csv 161 129.6 MB 164 173 5 132 s.trc 161 89.6 MB 164 173 5 132 s
COP .mot 161 patients 483.1 MB 5 128 239 5 128 sjoints + COG
(aligned).dat (x) 161 21.7 MB 158 455 4 953 s.dat (z) 161 31.6 MB 158 455 4 953 s
Table 5.3: Average duration, and number of observations per exercise in balancetest
ExerciseDuration in seconds
(mean, stdev)Observations
1 32.4 ±1.88 23 1132 31.9 ±1.05 22 7133 32.1 ±1.21 22 8884 32.5 ±1.63 23 1975 32.5 ±2.96 23 1916 30.3 ±12.94 21 3977 31.4 ±8.19 21 956
Total 158 455
Table 5.2 also shows the data size for each filetype, their respective number of ob-servations and the recording time. The ratio between the number of observationsand the total recording time (observations/time) approximates the acquisitionrate for Kinect and force platform respectively, i.e. 30 Hz and 1000 Hz respec-tively. The total recording time for Kinect and platform do not match; this isbecause the Kinect lower acquisition rate may introduce an additional frame (33ms) when platform acquisition has already stopped for each of 161 acquisitionsequences. Finally, the lower number of observations in the calibrated data (joints+ COG) due to the moving average filter, removing observations at the tails ofthe time signal (approx. one second, since period T = 1s for every sequence).
Regarding to the model fitting process, only calibrated postural data was used.Thus, Table 5.3 shows the average duration and standard deviation for each of theseven exercises described in Section 4.2.3, in addition to their respective numberof observations in aligned dataset (DAT files). Even though the exercise protocolspecifies that static equilibrium tasks (1 to 5) must last 30 seconds, and each

60 CHAPTER 5. RESULTS
subject was notified about the ending of the task, the acquisition was stoppedonce the subject had returned to resting position after a few seconds. On theother hand, forward and lateral reach test (6 and 7) exhibit a higher variability,since its duration was determined by the time each subject requires to perform4 repetitions, in that sense, some people ended in a shorter time whereas otherindividuals may last longer.
5.2 Model fitting and validation
To perform an integral evaluation of the proposed model, this section describesthe performance achieved by the model in different phases of the fitting process.First, the model accuracy (in terms of mean-squared error) for different combi-nations along the hyperparameter tuning via grid-search is reported. Then, therepresentation learned by the fitted model is analysed for the best hyperparametercombination, in the context of body-mass distribution to perform COG estima-tion. Finally, some of the COG trajectories estimated by the model are presentedin comparison to the trajectories obtained from ground-truth data for the sameacquisition sequence in each of the seven exercises described in the balance test(Section 4.2.3).
5.2.1 Model parameterization
The best hyperparameter selection for the neural network proposed in section4.1 was found by monitoring the mean-squared error achieved by the model fordifferent choices of the learning rate (α), batch size (B), training epochs (E) andnumber of nodes in h2 (M), using a grid-search method. This experimentation wascarried out by following the leave-one-out cross-validation (LOOCV) setup definedin section 4.2, for a total of 1000 different combinations (5(α)×5(B)×5(E)×8(M)).
First,the model behavior in function of the average mean-squared-error for allLOOCV validation folds is presented for an increasing number of nodes M andepochs E separately. After that, M and E are fixed, and the error for all the com-binations of the remaining α and B. A subset of representative hyperparametercombinations is presented in Table 5.4.
A plot of the validation error in function of the number of nodes averaged overall combinations of E, α and B is shown in Figure 5.1. It is remarkable thatthe lower number of nodes in h2, the better model performance. Similarly, a plotof the validation error versus epochs E, averaged over M , α and B, is displayed

5.2. MODEL FITTING AND VALIDATION 61
in Figure 5.2. As can be observed, the error decreases as the number of epochsincreases. However, no significant difference after 500 epochs is observed.
In accordance to these results, adequate choices for the number of epochs and h2nodes can be obtained in the range of E ≥ 500 and 1 ≤M ≤ 4. Based on the grid-search results, the optimal values for epochs and h2 nodes within the consideredranges were set to M = 1 and E = 2000, respectively. Fixing these values, theaverage error obtained across the validation fold for different combinations of αand B values is presented in Table 5.4.
Table 5.4 in conjunction with Figures 5.1 and 5.2 show that the model achieves agood performance (L(yv, yv) < 3 × 10⁻⁴) for different hyperparameter combina-tions within certain specific ranges. However, the best performance (L(yv, yv) =2.1× 10⁻⁴) was achieved for:
Figure 5.1: Average mean-squared error across LOOCV folds for different of num-ber of nodes in hidden layer h2

62 CHAPTER 5. RESULTS
Figure 5.2: Average mean-squared-error across LOOCV folds for different trainingepochs
• Learning rate = 0.01
• Number of nodes in third layer = 1
• Epochs = 2000
• Batch size = 256
Computational cost
The model implementation, and its corresponding cross-validation, were devel-oped in a Python v2.7.5 environment using the Tensorflow framework [3] on a64 bits GNU/Linux operating system (CentOS 7 distribution), running on a DellPowerEdge R720 processing server with an Intel Xeon E-2640 CPU (2.5 GHz, 24

5.2. MODEL FITTING AND VALIDATION 63
Table 5.4: Model average performance and standard deviation for different valuesof α and B with E = 2000 and M = 1. Error units are in square meters (m2)
learning rateα
batch sizeB
train errorL(yt, yt)
s.d.validation error
L(yv, yv)s.d.
1.0000 16 0.00144 0.00213 0.00149 0.002021.0000 32 0.00054 0.00053 0.00056 0.000461.0000 64 0.00036 0.00015 0.00036 0.000191.0000 128 0.00031 0.00016 0.00033 0.000171.0000 256 0.00029 0.00009 0.00030 0.000080.1000 16 0.00042 0.00019 0.00044 0.000190.1000 32 0.00037 0.00012 0.00040 0.000150.1000 64 0.00025 0.00003 0.00030 0.000140.1000 128 0.00025 0.00005 0.00024 0.000080.1000 256 0.00024 0.00004 0.00026 0.000080.0100 16 0.00023 0.00003 0.00026 0.000090.0100 32 0.00021 0.00002 0.00022 0.000050.0100 64 0.00021 0.00002 0.00023 0.000060.0100 128 0.00020 0.00001 0.00022 0.000070.0100 256 0.00019 0.00001 0.00021 0.000050.0001 16 0.00172 0.00004 0.00176 0.000320.0001 32 0.00134 0.00003 0.00138 0.000230.0001 64 0.00114 0.00002 0.00117 0.000210.0001 128 0.00102 0.00002 0.00105 0.000200.0001 256 0.00094 0.00002 0.00098 0.00019
cores) and 64 GB of RAM. The experimental results were exported as raw tabulardata into a CSV file, reporting both, mean and standard deviation for the trainingand validation errors, corresponding to each combination of α, B, M and E valuesin the grid-search setup.
The entire experimentation required 63.23 hours for 8 parallel jobs without GPUacceleration. It is important to notice that Tensorflow dynamically assigns theCPU load, including the required number of cores for a specific job.
5.2.2 Model performance
The model performance was evaluated using the test data partition from theoriginal calibrated dataset. Figure 5.3 shows the learning curve for the modelusing the best hyperparameter combination on the train and test data partitions.

64 CHAPTER 5. RESULTS
Following the LOOCV setup, this plot presents the mean-squared-error averageand its variability along epochs for the 14 LOOCV training folds and for the testingdataset (corresponding to the 40 % of the acquired data) previously excluded fromfitting process. As it can be observed in Figure 5.3, average error for both trainand test decreases quickly, and its variability is only appreciable for the 100 firstepochs. After that, the model average performance for both datasets is verysimilar until the end of the learning process yielding the following results:
• Average train error (L(yt, yt) = 1.96× 10⁻⁴) m2
• Average test error (L(yt, yt) = 3.04× 10⁻⁴) m2
Results for train, validation and test processes show that average error is consis-tently below 3× 10⁻⁴m2 ∼ 3cm2, so that estimated COG position is expected tolay within an region of approx. 1.73× 1.73cm2 around ground-truth COG.
After the hyperparameter tuning, it is possible to interpret the resulting regressionmodel as a body-mass distribution representation, since the model architecturewas proposed in correspondence to the Kinect skeleton tracking geometry [140](hence its the ability to generalize COG estimations for new, unseen posturaldata). So, the input weights for each node in the hidden layers can be visualizedto observe how the fitting process leads to a internal model representation for thecontribution of joints and, consequently, body segments, to the resulting COGestimation. Such visualization is presented in Figure 5.4, and it is explained indetail as follows (positive and negative weight sums are drawn in blue and redrespectively):
• Figure 5.4 (a), the 38 non-zero weights in W1, associated to the 19 pairsof joints defining a body segment in the first hidden layer, are drawn as20 circle shaped marks. Each circle has a radius r = k1
∑√W1(i,j) for all
W1(i,j) corresponding to the same joint. The square-root is included suchthat the circle area is proportional to the sum of the weights, being k1 ascaling factor for visualization purposes.
• Figure 5.4 (b), since M = 1, the weight matrix W2 in second hidden layeronly has 19 values corresponding to body segments contributions. Suchvalues are drawn as solid lines with width w = k2W2(n) for n = 1, 2, 3, ...19,being k2 a scaling factor.
• Figure 5.4 (c), weights for joints and segments are drawn together. Sincepositive weights in W1 are multiplied with negative weights in W2 and vicev-ersa, all the contributions are considered negative and drawn in red.
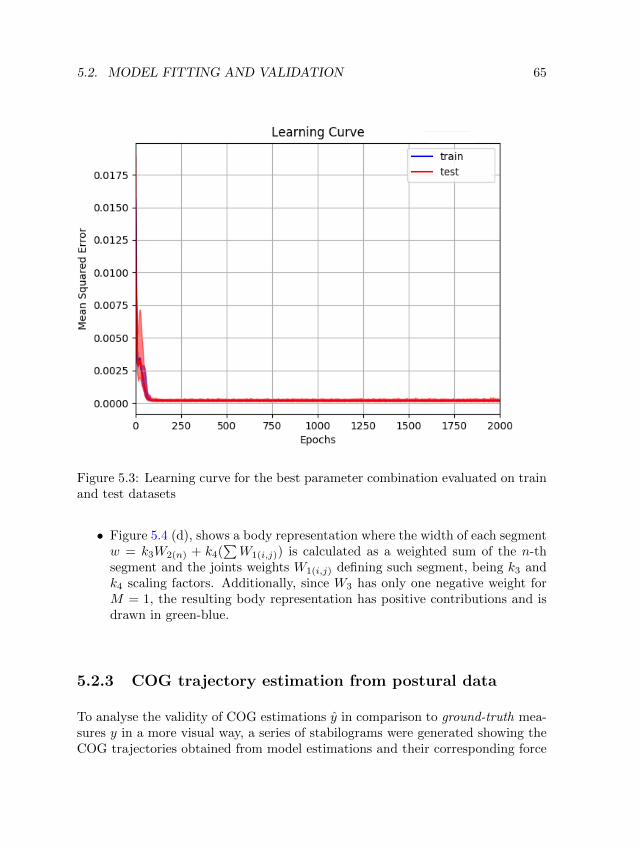
5.2. MODEL FITTING AND VALIDATION 65
Figure 5.3: Learning curve for the best parameter combination evaluated on trainand test datasets
• Figure 5.4 (d), shows a body representation where the width of each segmentw = k3W2(n) + k4(
∑W1(i,j)) is calculated as a weighted sum of the n-th
segment and the joints weights W1(i,j) defining such segment, being k3 andk4 scaling factors. Additionally, since W3 has only one negative weight forM = 1, the resulting body representation has positive contributions and isdrawn in green-blue.
5.2.3 COG trajectory estimation from postural data
To analyse the validity of COG estimations y in comparison to ground-truth mea-sures y in a more visual way, a series of stabilograms were generated showing theCOG trajectories obtained from model estimations and their corresponding force

66 CHAPTER 5. RESULTS
Figure 5.4: Intermediate and final model body representation obtained after fit-ting. h1 (a), h2 (b), both hidden layers (c), and final output (d). Each bodyfigure was generated according to the corresponding weights values in the network(positive values are drawn in green-blue and negative in red).
platform measures, respectively. Each of the reported trajectories corresponds tothe same exercise in the balance test (section 4.2.3): standing on two feet withwide supporting base (Figure 5.5), standing with feet together (Figure 5.6), stand-ing with feet together and closed eyes (Figure 5.7), standing in TANDEM position(Figure 5.8), standing on one foot (Figure 5.9), forward reach (Figure 5.10) andlateral reach (Figure 5.11).
For each task, 4 representative examples were selected, and their respective stabilo-grams were generated for the area defined by the AMTI Accugait force platform(50×50cm) in accordance with the platform coordinate system (Figure 4.7). Sincesome trajectories are enclosed in a small region, a zoom-view was added to eachstabilogram if necessary, to perform a detailed visual inspection and comparison.In all cases, ground-truth COG trajectories obtained from force platform data aredrawn in blue, whereas estimated trajectories produced by the model are drawnin red.
Respecting to the COG trajectory shape and position for each of stabilograms inFigures 5.5 to 5.11, there are some remarkable features. In first place, the meandistance between the ground-truth and COG estimated trajectories is relatively

5.3. CASE STUDY RESULTS 67
small in comparison to their sway amplitude. Additionally, the estimation error isconstant in average along paths and does not depend on the sway amplitude, whilethe shape for each estimated COG trajectory is quite similar to its correspondingground-truth counterpart. This is particularly noticeable in presence of broad curlsrelated to wide sway events.
Stabilogram computing time The resulting stabilograms for all 161 acquisi-tion sequences in the dataset were generated offline using the same computationalplatform described in Section 5.2.1. However, only one job was assigned instead ofthe 8 jobs assigned for the hyperparameter exploration. Under such configuration,all stabilograms were obtained after 83 seconds of computing time (0.515 secondsper sequence in average).
5.3 Case study results
The results of the case study described in section 4.3 provide additional informa-tion about the model performance in a clinical scenario. Particularly, such resultsare described in terms of the estimated COG trajectories to support objectivebalance assessment in people with a physical disability condition, as well as theacceptance of the proposed method as a technological tool to be used by patientsand clinical personnel in the context of physical rehabilitation.
For this case, a group of six patients with Multiple Sclerosis from FUNDEM wereenrolled in the study (Table 5.5), which were assessed by two physiotherapistsfrom Universidad Manuela Beltran operating the same Kinect-based acquisition
Table 5.5: Gender, age and time since MS onset for each of the patients includedin the case study
Patient GenderAge
(years)Years afterMS onset
1 female 43 52 female 55 173 female 50 154 female 46 85 male 35 106 male 63 18
average 48.67 11.3

68 CHAPTER 5. RESULTS
tool described in Section 4.1, without the need of a force platform (due to themodel is already fitted). After acquisition, the data was processed by the neuralnetwork model implemented in the server machine used for experimentation, then,the estimated COG trajectories are presented to physiotherapists for their visualexamination and PCS state description.
In terms of the subjects included in case study, the information presented in Table5.5 show a predominance of women, with a time after onset no greater than 20years, in accordance to the prevalence and symptomatology described for MultipleSclerosis in the literature review. Respecting to the physiotherapists present inthe study, one is a undergraduate student and the other is a teacher with animportant clinical experience.
5.3.1 COG trajectories for patients
One important component in the case study is the generation of postural measures,i.e. stabilograms, with a low-cost acquisition tool, such as Kinect, able to supportthe objective assessment of balance function in people with a physical impairment.In that context, all the MS patients performed a set of 5 static balance exercises(Section 4.3.1) while being recorded by the Kinect sensor in presence of at leastone physiotherapist.
The data collected by Kinect was then processed by the regression model to pro-duce a set of stabilograms (Figures 5.12 and 5.13) for patients 1 to 6 presentedin Table 5.5; 28 stabilograms were obtained since two of the patients were notable to perform the last exercise (i.e. standing on one foot), due to the balancedeterioration (these are labelled as “no data” in Figures 5.12 and 5.13). In allcases, stabilograms were plotted over a specific area of 8× 8cm2 to visualize swaypaths in detail, as well as to make direct comparison among the exercises for asingular subject or one exercise for different patients.
As expected, the COG trajectories obtained from patients exhibit wider swaypaths in comparison to those previously obtained for healthy subjects. It can alsobe observed that some stabilograms lie out of the limits defined by an 8 × 8cm2
area corresponding to the presence of momentary strong posture compensationsduring exercise execution or the inability to hold the standing position for therequired time.

5.3. CASE STUDY RESULTS 69
Table 5.6: Survey results for patients after performing balance testQuestion Answer choices Results
The test execution does require additionaleffort (physical or mental) in comparisonto traditional assessment?
No, it was easier to perform 0No, it demands the same effort 5Yes, it can be performed with more effort 1Yes, it can not be completed 0
The use of technological tools makesbalance test execution more attractive?
Yes, completely agree 6Does not make any difference to me 0No, their use is troublesome 0No, their use can be dangerous 0
Which are the principal contributionsabout the use of technological tools forbalance assessment?
Use of new technologies 5Visual feedback 3A playful atmosphere 2System portability 1High benefit-cost ratio 0Others 0
5.3.2 User acceptance survey
Survey results for patients
Patients were also asked to fulfill the survey instrument, consisting of a set of threequestions (Table 5.6) to examine their reception to the inclusion of technologicaltools during balance assessment sessions. Later, after a brief discussion with theirphysiotherapist on the stabilogram results, patients were requested to answer threefurther questions (Table 5.7) to know how the presented measures may contributeto the awareness of their own balance state.
Results in Table 5.6 reveal that, in most cases, the introduction of a technologicaltool does not imply less effort by the patients to perform balance test. In justone case, the patient felt that balance test execution was harder using the Kinectdevice. However, all patients agreed on the inclusion of technology makes thetest execution more attractive and they pointed out some advantages such asthe introduction of new technology (5 of 6 agreed), visual-feedback about theircurrent performance (3 of 6 agreed), a playful atmosphere (2 of 6 agreed) and theportability of the system (1 of 6 agree).
Additionally, the results in Table 5.7 show that all the patients were able to fullyunderstand their balance performance in function of the presented stabilogramsand, in most of cases, such representation makes diagnosis easier to understand.Finally, the patients expressed some of the potential advantages of this technolog-ical approaches in the support of their therapeutic procedures, including: atten-dance to more regular therapy sessions (6 of 6 agree), a better attitude to perform

70 CHAPTER 5. RESULTS
therapy sessions (5 of 6 agree), spending more time in a each therapy session (3of 6 agree), performing more demanding sessions (3 of 6 agree), performing phys-ical exercises at home (3 of 6 agree), and recommending technology supportedprocedures to others (3 of 6 agree).
Survey results for clinical personnel
On the other hand, the physiotherapists who participated in this study were askedto answer some questions about the potential benefits of the proposed technologyfor objective balance function assessment. After the training session, intended tolearn the manipulation of the Kinect-based acquisition system, they were askedabout the usability of the software for postural data acquisition, as well as theircomprehension regarding to the reported measures (Table 5.8). Upon visual in-spection of the stabilograms yielded by the model, the remaining questions inthe survey were performed to know the specialist point of view about the util-ity, understandability and completeness of the measures in the context of balanceassessment.
Results in Table 5.8 show that a training session was needed to manipulate the ac-quisition system efficiently without interfering a traditional assessment procedure.Yet, both physiotherapists were able to understand the nature and relevance ofthe obtained measures for balance assessment. However, just one of them considerpostural data as a representative measure of balance, whereas the other one felt
Table 5.7: Survey results for patients after seeing stabilogram results explainedby an expert
Question Answer choices Results
The presented results are understandableand can be associated with actualbalance function state?
Yes, results were completely understood 6Yes, results were generally understood 0No, results were hard to understood 0No, results were not understood at all 0
The visualization of objective measuresmakes the diagnosis from an expert moreunderstandable?
Yes, completely agree 5Yes, partially 1No, visualization might be not necessary 0No, they are inconsistent with diagnosis 0
Which of the following actions would yoube willing to perform in terms of physicalrehabilitation?
More regular therapy sessions 6Spend more time in each therapy session 3Perform more demanding therapy sessions 3Perform physical exercise at home 3Perform therapy sessions with better attitude 5Recommend therapy supported by technology 3Others 0

5.3. CASE STUDY RESULTS 71
Table 5.8: Survey results for clinical personnel after postural data acquisitiontraining session
Question Answer choices Results
Could you use the acquisition tool withoutsignificant interference in comparison toregular assessment procedures?
Yes, the tool is easy to use 0Yes, it can be used efficiently after training 2It can not be used properly 0No, it can not be sued at all 0
Do you understand the nature and therelevance of the acquired measures?
Yes, I understand their nature and relevance 2I only understand the nature of measure 0I only understand the relevance for diagnosis 0No, measures can not be understood 0
Do you consider that acquired measuresare representative of the patient balancefunction?
Yes, measures are fully representative 1Yes, in conjunction with other measures 1No, they are insufficient to assess balance 0No, they do not provide any useful information 0
Table 5.9: Survey results for clinical personnel after visual inspection of estimatedstabilograms
Question Answer choices Results
Do you consider the presented resultsuseful and comprehensible?
Yes, they are useful and easy to understand 0They are useful but hard to understand 2They are comprehensible but not useful 0Results are incomprehensible and not useful 0
Do you think that presented results provideadditional information to the balance functionassessment in comparison to traditionalbalance test such as Berg Balance Scale?
Yes, they enhance assessment in high degree 0Yes, they enhance assessment moderately 2No, they provide the same information 0No, they do not provide relevant information 0
Would you add, modify or remove elementsregarding to the presented results?
Yes, What? 1No 1
that measures are only representative of the balance function in conjunction withcomplementary measures.
Furthermore, concerning to stabilogram interpretation, the results in Table 5.9 in-dicates that both physiotherapists agree on the visualization of COG trajectoriesare useful and provide an enhancement of balance assessment, although in a mod-erate degree, since stabilograms are hard to be interpreted visually. Additionally,there one of the physiotherapist suggested a modification to the stabilogram visu-alization, consisting on the incorporation of additional guidelines to make spatialinterpretation more clear.
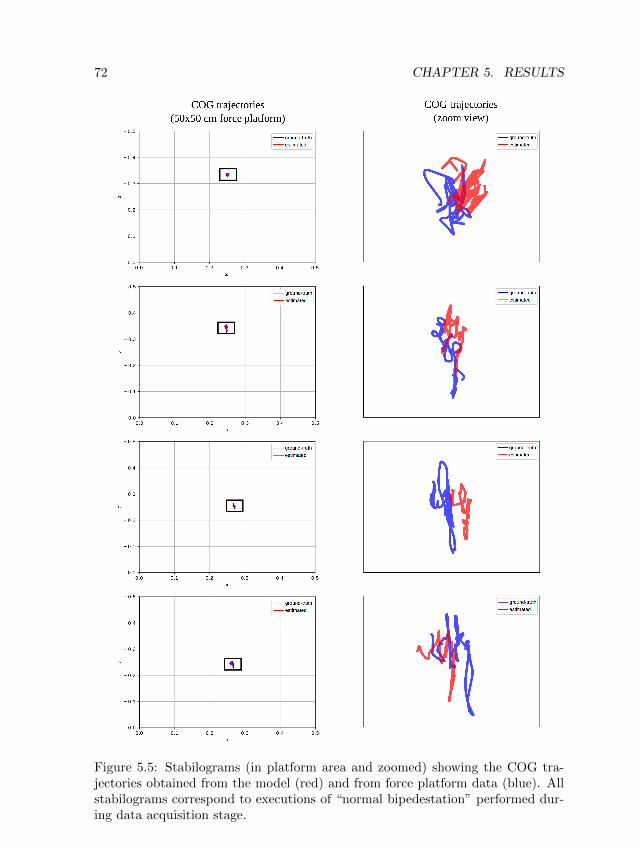
72 CHAPTER 5. RESULTS
0.0 0.1 0.2 0.3 0.4 0.5
x
� 0.5
� 0.4
� 0.3
� 0.2
� 0.1
0.0
z
ground-truth
estimated
0.0 0.1 0.2 0.3 0.4 0.5
x
� 0.5
� 0.4
� 0.3
� 0.2
� 0.1
0.0
z
original
predicted
0.0 0.1 0.2 0.3 0.4 0.5
x
� 0.5
� 0.4
� 0.3
� 0.2
� 0.1
0.0
z
original
predicted
0.0 0.1 0.2 0.3 0.4 0.5
x
� 0.5
� 0.4
� 0.3
� 0.2
� 0.1
0.0
z
original
predicted
original
predicted
Figure 5.5: Stabilograms (in platform area and zoomed) showing the COG tra-jectories obtained from the model (red) and from force platform data (blue). Allstabilograms correspond to executions of “normal bipedestation” performed dur-ing data acquisition stage.

5.3. CASE STUDY RESULTS 73
0.0 0.1 0.2 0.3 0.4 0.5
x
� 0.5
� 0.4
� 0.3
� 0.2
� 0.1
0.0
z
original
predicted
0.0 0.1 0.2 0.3 0.4 0.5
x
� 0.5
� 0.4
� 0.3
� 0.2
� 0.1
0.0
z
original
predicted
0.0 0.1 0.2 0.3 0.4 0.5
x
� 0.5
� 0.4
� 0.3
� 0.2
� 0.1
0.0
z
original
predicted
0.0 0.1 0.2 0.3 0.4 0.5
x
� 0.5
� 0.4
� 0.3
� 0.2
� 0.1
0.0
z
original
predicted
original
predicted
original
predicted
original
predicted
original
predicted
COG trajectories
(50x50 cm force platform)
COG trajectories
(zoom view)
Figure 5.6: Stabilograms (in platform area and zoomed) showing the COG tra-jectories obtained from the model (red) and from force platform data (blue). Allstabilograms correspond to executions of “bipedestation with feet together” per-formed during data acquisition stage.

74 CHAPTER 5. RESULTS
0.0 0.1 0.2 0.3 0.4 0.5
x
� 0.5
� 0.4
� 0.3
� 0.2
� 0.1
0.0
z
original
predicted
Figure 5.7: Stabilograms (in platform area and zoomed) showing the COG tra-jectories obtained from the model (red) and from force platform data (blue). Allstabilograms correspond to executions of “bipedestation with feet together andclosed eyes” performed during data acquisition stage.

5.3. CASE STUDY RESULTS 75
0.0 0.1 0.2 0.3 0.4 0.5
x
� 0.5
� 0.4
� 0.3
� 0.2
� 0.1
0.0
z
original
predicted
original
predicted
original
predicted
original
predicted
original
predicted
COG trajectories
(50x50 cm force platform)
COG trajectories
(zoom view)
0.0 0.1 0.2 0.3 0.4 0.5
x
� 0.5
� 0.4
� 0.3
� 0.2
� 0.1
0.0
z
original
predicted
0.0 0.1 0.2 0.3 0.4 0.5
x
� 0.5
� 0.4
� 0.3
� 0.2
� 0.1
0.0
z
original
predicted
0.0 0.1 0.2 0.3 0.4 0.5
x
� 0.5
� 0.4
� 0.3
� 0.2
� 0.1
0.0
z
original
predicted
Figure 5.8: Stabilograms (in platform area and zoomed) showing the COG tra-jectories obtained from the model (red) and from force platform data (blue). Allstabilograms correspond to executions of “TANDEM position” performed duringdata acquisition stage.

76 CHAPTER 5. RESULTS
0.0 0.1 0.2 0.3 0.4 0.5
x
� 0.5
� 0.4
� 0.3
� 0.2
� 0.1
0.0
z
original
predicted
original
predicted
original
predicted
original
predicted
original
predicted
COG trajectories
(50x50 cm force platform)
COG trajectories
(zoom view)
0.0 0.1 0.2 0.3 0.4 0.5
x
� 0.5
� 0.4
� 0.3
� 0.2
� 0.1
0.0
z
original
predicted
0.0 0.1 0.2 0.3 0.4 0.5
x
� 0.5
� 0.4
� 0.3
� 0.2
� 0.1
0.0
z
original
predicted
0.0 0.1 0.2 0.3 0.4 0.5
x
� 0.5
� 0.4
� 0.3
� 0.2
� 0.1
0.0
z
original
predicted
Figure 5.9: Stabilograms (in platform area and zoomed) showing the COG tra-jectories obtained from the model (red) and from force platform data (blue). Allstabilograms correspond to executions of “monopedestation” performed duringdata acquisition stage.

5.3. CASE STUDY RESULTS 77
0.0 0.1 0.2 0.3 0.4 0.5
x
� 0.5
� 0.4
� 0.3
� 0.2
� 0.1
0.0
z
original
predicted
original
predicted
original
predicted
original
predicted
original
predicted
COG trajectories
(50x50 cm force platform)
COG trajectories
(zoom view)
0.0 0.1 0.2 0.3 0.4 0.5
x
� 0.5
� 0.4
� 0.3
� 0.2
� 0.1
0.0
z
original
predicted
0.0 0.1 0.2 0.3 0.4 0.5
x
� 0.5
� 0.4
� 0.3
� 0.2
� 0.1
0.0
z
original
predicted
0.0 0.1 0.2 0.3 0.4 0.5
x
� 0.5
� 0.4
� 0.3
� 0.2
� 0.1
0.0
z
original
predicted
Figure 5.10: Stabilograms (in platform area and zoomed) showing the COG tra-jectories obtained from the model (red) and from force platform data (blue). Allstabilograms correspond to executions of “forward reach test” performed duringdata acquisition stage.

78 CHAPTER 5. RESULTS
COG trajectories
(50x50 cm force platform)
0.0 0.1 0.2 0.3 0.4 0.5
x
� 0.5
� 0.4
� 0.3
� 0.2
� 0.1
0.0
z
original
predicted
0.0 0.1 0.2 0.3 0.4 0.5
x
� 0.5
� 0.4
� 0.3
� 0.2
� 0.1
0.0
z
original
predicted
0.0 0.1 0.2 0.3 0.4 0.5
x
� 0.5
� 0.4
� 0.3
� 0.2
� 0.1
0.0
z
original
predicted
0.0 0.1 0.2 0.3 0.4 0.5
x
� 0.5
� 0.4
� 0.3
� 0.2
� 0.1
0.0
z
original
predicted
Figure 5.11: Stabilograms (in platform area and zoomed) showing the COG tra-jectories obtained from the model (red) and from force platform data (blue). Allstabilograms correspond to executions of “lateral reach test” performed duringdata acquisition stage.

5.3. CASE STUDY RESULTS 79
0.20
0.22
0.24
0.26
0.28
x
0.02
0.00
0.02
0.04
0.06
z
0.20
0.22
0.24
0.26
0.28
x
0.02
0.00
0.02
0.04
0.06
z
0.22
0.24
0.26
0.28
0.30
x
0.02
0.00
0.02
0.04
0.06
z
0.30
0.32
0.34
0.36
0.38
x
0.18
0.16
0.14
0.12
0.10
z
0.26
0.28
0.30
0.32
0.34
x
0.00
0.02
0.04
0.06
0.08
z
Patien
t 1
0.26
0.28
0.30
0.32
0.34
x
0.16
0.18
0.20
0.22
0.24
z
0.26
0.28
0.30
0.32
0.34
x
0.16
0.18
0.20
0.22
0.24
z
0.24
0.26
0.28
0.30
0.32
x
0.14
0.16
0.18
0.20
0.22
z
0.40
0.42
0.44
0.46
0.48
x
0.14
0.16
0.18
0.20
0.22
z
0.40
0.42
0.44
0.46
0.48
x
0.14
0.16
0.18
0.20
0.22
z
Patien
t 2
0.28
0.30
0.32
0.34
0.36
x
0.02
0.00
0.02
0.04
0.06
z
0.34
0.36
0.38
0.40
0.42
x
0.00
0.02
0.04
0.06
0.08
z
0.34
0.36
0.38
0.40
0.42
x
0.00
0.02
0.04
0.06
0.08
z
0.28
0.30
0.32
0.34
0.36
x
0.12
0.14
0.16
0.18
0.20
z
Patien
t 3
0.30
0.32
0.34
0.36
0.38
x
0.20
0.22
0.24
0.26
0.28
z
stand
ing
wid
e base
stand
ing
feet togeth
er
standin
g
closed
eyes
TA
ND
EM
standin
g
one fo
ot
no
data
Figu
re5.12:
Patien
ts1
to3

80 CHAPTER 5. RESULTS
Patien
t 4
Patien
t 5
Patien
t 6
standin
g
wid
e base
standin
g
feet togeth
er
standin
g
closed
eyes
TA
ND
EM
standin
g
one fo
ot
0.12
0.14
0.16
0.18
0.20
x
0.12
0.10
0.08
0.06
0.04
z
0.18
0.20
0.22
0.24
0.26
x
0.06
0.04
0.02
0.00
0.02
z
0.16
0.18
0.20
0.22
0.24
x
0.00
0.02
0.04
0.06
0.08
z
0.10
0.12
0.14
0.16
0.18
x
0.18
0.20
0.22
0.24
0.26
z
0.04
0.06
0.08
0.10
0.12
x
0.20
0.22
0.24
0.26
0.28
z
0.20
0.22
0.24
0.26
0.28
x
0.08
0.06
0.04
0.02
0.00
z
0.16
0.18
0.20
0.22
0.24
x
0.10
0.08
0.06
0.04
0.02
z
0.24
0.26
0.28
0.30
0.32
x
0.10
0.08
0.06
0.04
0.02
z
0.20
0.22
0.24
0.26
0.28
x
0.02
0.04
0.06
0.08
0.10
z
0.40
0.42
0.44
0.46
0.48
x
0.14
0.16
0.18
0.20
0.22
z
0.28
0.30
0.32
0.34
0.36
x
0.14
0.12
0.10
0.08
0.06
z
0.28
0.30
0.32
0.34
0.36
x
0.10
0.08
0.06
0.04
0.02
z
0.30
0.32
0.34
0.36
0.38
x
0.12
0.10
0.08
0.06
0.04
z
0.26
0.28
0.30
0.32
0.34
x
0.10
0.08
0.06
0.04
0.02
z
0.26
0.28
0.30
0.32
0.34
x
0.02
0.00
0.02
0.04
0.06
z
no
data
Figu
re5.13:
Patien
ts4
to6

5.3. CASE STUDY RESULTS 81
it

82 CHAPTER 5. RESULTS

Chapter 6
Discussion and Future Work
6.1 Model fitting and testing
This work proposes a novel method to obtain reliable COG-based stabilometrymeasures using a low cost acquisition system, based on postural data from theKinect skeleton tracking model. The proposed approach successfully adopted afeed-forward neural network regression model, whose architecture was chosen tofollow the geometry given by the skeleton simplified representation in the API ofthe Kinect SDK. This regression model was trained by using the actual value ofthe COP provided by the force platform of a Motion Analysis Laboratory1.
Given the different nature of COG (estimated by the model) and COP (directexperimental measures), it was necessary to get an approximation of the COGvalues from the experimental COP data to serve as ground-truth for the modelfitting process. Such approximation was performed by a low pass filter, as it isproposed in the work of Benda et al. [11]. A coordinate system alignment wasalso carried out by using affine spatial transformations according to the spatialcalibration protocol of the motion analysis laboratory. Both Kinect and forceplatform signals were synchronized, while the platform stream (at 1 kHz) wasdownsampled to match the Kinect acquisition rate (30 Hz, corresponding to itsframe rate).
The dataset construction, supporting the regression model fitting, was based on a
1MovyLab, Hospital San Jose Infantil, Bogota (Colombia).
83

84 CHAPTER 6. DISCUSSION AND FUTURE WORK
sample size estimation in correspondence with the Colombian biometric statisticaldescription presented in the works of Estrada et al. [45] and Vargas et al. [131].Then, a sample of 23 voluntary subjects (10 female and 13 male, with ages between18 and 25 years) allowed an error tolerance of 7.5 % at a confidence interval of 95%. These subjects performed a balance test consisting of 7 exercises (5 for staticbalance, 2 for functional reach), while their postural data and COP were acquiredby the Kinect-based system and the force platform, simultaneously. The resultingdata, after the above mentioned preprocessing, was organized in the fashion ofthe attribute-relation file format (ARFF), yet preserving a raw representation inplain text.
To perform the model fitting, the data corresponding to 14 subjects, i.e. 14acquisition sequences, was used to obtain the best parameter combination of themodel via leave-one-out cross-validation and a grid-search exploration, obtainingan average MSE of 1.96 cm2 for training, 2.1 cm2 for validation. Once the bestcombination was found, the data corresponding to the remaining 9 subjects wasused for testing, obtaining an MSE of 3.04 cm2, so that the error in the estimationof the COG position lies over an area of 1.73× 1.73 cm2, approximately.
The grid-search process also yielded a significant number of additional hyperpa-rameter combinations achieving a similar performance to that exhibited by thebest neural network configuration. Such behavior was observed in the decreasingaverage error curve shown in Figure 5.3 where the MSE remains below 3 cm2 after100 epochs for the training set. An analogous trend was found for certain param-eter combinations of α, M and B as it can be seen in Table 5.4. Even though, thebest performance was achieved for a learning rate α = 0.01, a batch size B = 256,a number of epochs E = 2000 and just one node in layer h2, i.e. M = 1.
It is remarkable that having only one node in h2, the neural network model isable to represent the direct contribution of each body joint and segment positionin relation to the COG location. In fact, Figure 5.4 shows that the resultingmodel inner representation resembles a well-proportioned body-mass distribution,suitable for COG estimation from the joint positions defined in the Kinect skeletontracking model. This is a relevant feature of the learning process, since neuralnetwork weights were randomly initialized, and their value update along trainingwas only restricted to the common constraints defined in the Adam optimizeralgorithm and the clipping matrix in h1.
The ability of the best model to approximate COG trajectories was evaluatedby comparing the COG ground-truth stabilograms against the COG estimationsyielded by the model. Figures 5.5 to 5.11 show that the shape properties of the ofthe ground-truth trajectories (blue curves) are mostly preserved by the COG tra-

6.2. CASE STUDY RESULTS 85
jectory estimations (red curves). However, the estimated paths are usually noisierthan those acquired from the force platform. This can be mainly attributed toKinect skeleton tracking artifacts in the acquisition process related to technologyimplementation constraints (e.g. occlusions). The resulting trajectories are alsoshorter than the ground-truth in a small factor. This is possibly related to a slightscale underestimation in the regression method.
Nevertheless, COG estimation error mainly corresponds to the mean separationbetween ground-truth and estimated COG trajectories (probably because Kinectjoint positions are taken from body frontal surface rather than actual internallocations). In addition, as the COG sway increases, e.g. for functional reach ex-ercises, the relative error between trajectories gets lower, that means, error is notproportional to the sway amplitude. In contrast, the scale and the path patternexhibited by both trajectories are quite similar for most of the cases. Given theerror has a strong contribution from the joint displacement of estimated trajec-tories respect to their corresponding ground-truth, the obtained COG estimationsare suitable to perform objective balance assessment. Indeed, stabilogram charac-terization is often performed by analysing the subject sway around its own spatialreference instead of the absolute position in the working space.
6.2 Case study results
In addition to the model results discussed in the previous section, this work in-cluded a preliminary case study to approach the potential contributions of themethod associated to the model under study in an clinical scenario. In fact, theunderlying motivation of this work is related to the development of tools and mea-sures able to provide objective diagnosis and disease progression tracking supportfor people involved in physical rehabilitation processes, i.e. patients with physicaldisabilities and the clinical staff in charge of their treatment.
In this context, a subsequent stage of postural data acquisition and stabilogramgeneration was performed on six patients with diagnosis of Multiple Sclerosis fromFUNDEM2, assisted by two physiotherapists during the execution of a functionalbalance test. The corresponding evaluation was carried out by analysing the COGtrajectories estimated by the model beside the results of two independent surveys,fulfilled by both patients and physiotherapists.
For patients, the introduction of this type of technological systems does not rep-resent a physical aid to improve balance ability, but a tool able to provide an
2Fundacion Colombiana para la Esclerosis Multiple

86 CHAPTER 6. DISCUSSION AND FUTURE WORK
attractive and entertaining environment that makes therapy sessions more bear-able. This is an important result from the patient oriented survey, since thepositive impact of physical rehabilitation as it contributes to palliate physical de-terioration, highly depends on the consistency and regularity of diagnostic andtherapeutic sessions. Furthermore, there are some additional features that canbe provided by the Kinect-based technology such as the mirror-effect, which hasshown to improve therapeutic effectiveness in physical rehabilitation processes.System portability also allows postural data analysis in a variety of scenarios out-side specialized laboratories, such as home or consulting rooms.
Respect to the balance performance report, based on the analysis of COG trajec-tories, the patient feedback was quite positive. In summary, patients consideredtheir corresponding stabilograms as a helpful visual aid to understand their ownfunction balance state. This information could stimulate their performance inmore rigorous therapy sessions with a better disposition, as it was declared by thepatients in the survey.
On the other hand, for clinical staff involved in physical rehabilitation, the oper-ation of the proposed system to perform postural data acquisition does not implyhigh skills to be used properly, though, it requires some previous training. Ad-ditionally, the survey suggested that estimated stabilograms as balance functionassessment support were hard to interpret by direct visual inspection if used alone.This result was not completely unexpected given that stabilograms do not con-stitute a balance function biomarker by itself. Hence, it involves high levels ofsubjectivity that may be related to the way COG trajectories are visualized.
6.3 Future work
Incoming stages of development involves the exploration of different regressionmodels, such as deep learning architectures using multimodal postural data anda higher network complexity. The weight initialization of the neural networkcan also be assigned to a predefined body-mass distribution standardized modelinstead of the current approach based on random values, potentially leading to abody representation closer to a real anatomical structure.
Model performance can also be improved by using a more sophisticated skeletonmodel, able to perform a more realistic tracking of the posture and movement of asubject. This could be addressed in the short term by using the skeleton trackingmodel offered by the Kinect v2 acquisition hardware and software developmenttoolkit. Alternatively, future approaches could involve anatomical and acquisition

6.3. FUTURE WORK 87
corrections to the current skeletal representation.
In terms of the model output utility in clinical applications, the resulting sta-bilogram might be enhanced by further characterization of the COG trajectories,such as diffusion coefficients or fractal dimension, among others. Such numeri-cal descriptors could allow the formulation of biomechanical markers for posturalcontrol assessment in physical disability scenarios.
Finally, COG trajectory estimations could be implemented in real time for im-mediate specialist analysis for diagnosis support. Such real time version couldeven support the development of virtual reality based rehabilitation protocols, in-tended to reinforce patient adherence to the therapeutic intervention and takingadvantage of the visual feedback related to the mirror effect.

88 CHAPTER 6. DISCUSSION AND FUTURE WORK

Bibliography
[1] OpenNI User Guide. http://openni.ru/, November 2010.
[2] Pressure mat sensors datasheet. http://docs-europe.
electrocomponents.com/webdocs/124a/0900766b8124ab49.pdf, 2015.
[3] Martın Abadi, Ashish Agarwal, Paul Barham, Eugene Brevdo, ZhifengChen, Craig Citro, Greg S. Corrado, Andy Davis, Jeffrey Dean, MatthieuDevin, Sanjay Ghemawat, Ian Goodfellow, Andrew Harp, Geoffrey Irving,Michael Isard, Yangqing Jia, Rafal Jozefowicz, Lukasz Kaiser, ManjunathKudlur, Josh Levenberg, Dandelion Mane, Rajat Monga, Sherry Moore,Derek Murray, Chris Olah, Mike Schuster, Jonathon Shlens, Benoit Steiner,Ilya Sutskever, Kunal Talwar, Paul Tucker, Vincent Vanhoucke, Vijay Va-sudevan, Fernanda Viegas, Oriol Vinyals, Pete Warden, Martin Wattenberg,Martin Wicke, Yuan Yu, and Xiaoqiang Zheng. TensorFlow: Large-scalemachine learning on heterogeneous systems, 2015. Software available fromtensorflow.org.
[4] Luz Helena Lugo Agudelo and Vanessa Seijas. La discapacidad en colombia:una mirada global. Revista Colombiana de Medicina Fısica y Rehabilitacion,22(2):164–179, 2012.
[5] J Eric Ahlskog. Does vigorous exercise have a neuroprotective effect inparkinson disease? Neurology, 77(3):288–294, 2011.
[6] Ethem Alpaydin. Introduction to machine learning. MIT press, 2014.
[7] Alzheimer’s Association et al. 2013 alzheimer’s disease facts and figures.Alzheimer’s & dementia, 9(2):208–245, 2013.
[8] Janusz W B3aszczyk and W3odzimierz Klonowski. Postural stability andfractal dynamics. Acta Neurobiol. Exp, 61:105–112, 2001.
89

90 BIBLIOGRAPHY
[9] Jennifer Baltich, Jackie Whittaker, Vinzenz Von Tscharner, Alberto Nettel-Aguirre, Benno M Nigg, and Carolyn Emery. The impact of previous kneeinjury on force plate and field-based measures of balance. Clinical Biome-chanics, 30(8):832–838, 2015.
[10] Luigi Baratto, Pietro G Morasso, Cristina Re, and Gino Spada. A new lookat posturographic analysis in the clinical context: sway-density versus otherparameterization techniques. Motor control, 6(3):246–270, 2002.
[11] Brian J Benda, PO Riley, and DE Krebs. Biomechanical relationship be-tween center of gravity and center of pressure during standing. IEEE Trans-actions on Rehabilitation Engineering, 2(1):3–10, 1994.
[12] Yoshua Bengio. Practical recommendations for gradient-based training ofdeep architectures. In Neural networks: Tricks of the trade, pages 437–478.Springer, 2012.
[13] Katherine Berg, Sharon Wood-Dauphine, JI Williams, and David Gayton.Measuring balance in the elderly: preliminary development of an instrument.Physiotherapy Canada, 41(6):304–311, 1989.
[14] Katherine O Berg, Brian E Maki, Jack I Williams, Pamela J Holliday, andSharon L Wood-Dauphinee. Clinical and laboratory measures of posturalbalance in an elderly population. Archives of physical medicine and rehabil-itation, 73(11):1073–1080, 1992.
[15] G Bizzo, N Guillet, A Patat, and PM Gagey. Specifications for buildinga vertical force platform designed for clinical stabilometry. Medical andBiological Engineering and Computing, 23(5):474–476, 1985.
[16] Sandra E Black, Brian E Maki, and Geoff R Fernie. Aging, imbalance andfalls. The vestibulo-ocular reflex and vertigo, pages 317–335, 1993.
[17] Lisa Blum and Nicol Korner-Bitensky. Usefulness of the berg balance scale instroke rehabilitation: a systematic review. Physical therapy, 88(5):559–566,2008.
[18] Linda D Bogle Thorbahn and Roberta A Newton. Use of the berg balancetest to predict falls in elderly persons. Physical therapy, 76(6):576–583, 1996.
[19] Flemming Bonde-Petersen. A simple force platform. European journal ofapplied physiology and occupational physiology, 34(1):51–54, 1975.
BIBLIOGRAPHY 91
[20] Bruno Bonnechere, Bart Jansen, P Salvia, H Bouzahouene, L Omelina, Fe-dor Moiseev, Victor Sholukha, Jan Cornelis, Marcel Rooze, and S Van SintJan. Validity and reliability of the kinect within functional assessment ac-tivities: comparison with standard stereophotogrammetry. Gait & posture,39(1):593–598, 2014.
[21] Sandra Brauer, Yvonne Burns, and Prudence Galley. Lateral reach: a clin-ical measure of medio-lateral postural stability. Physiotherapy Research In-ternational, 4(2):81–88, 1999.
[22] David J Brooks. Parkinson’s disease: diagnosis. Parkinsonism & relateddisorders, 18:S31–S33, 2012.
[23] Thomas S Buchanan, David G Lloyd, Kurt Manal, and Thor F Besier. Esti-mation of muscle forces and joint moments using a forward-inverse dynamicsmodel. Medicine & Science in Sports & Exercise, 37(11):1911–1916, 2005.
[24] Karen Caeyenberghs, Alexander Leemans, Monique Geurts, Tom Taymans,Catharine Vander Linden, Bouwien Smits-Engelsman, Stefan Sunaert, andStephan P Swinnen. Brain-behavior relationships in young traumatic braininjury patients: Dti metrics are highly correlated with postural control.Human brain mapping, 31(7):992–1002, 2010.
[25] Jennifer Canbek, George Fulk, Leah Nof, and John Echternach. Test-retestreliability and construct validity of the tinetti performance-oriented mobilityassessment in people with stroke. Journal of Neurologic Physical Therapy,37(1):14–19, 2013.
[26] Bruce Carse, Barry Meadows, Roy Bowers, and Philip Rowe. Affordableclinical gait analysis: An assessment of the marker tracking accuracy of anew low-cost optical 3d motion analysis system. Physiotherapy, 99(4):347–351, 2013.
[27] Glenn Research Center. Center of gravity. https://www.grc.nasa.gov/
www/k-12/airplane/cg.html, 2015. Online; accessed 05-november-2017.
[28] Elena Ceseracciu, Zimi Sawacha, and Claudio Cobelli. Comparison of mark-erless and marker-based motion capture technologies through simultaneousdata collection during gait: proof of concept. PloS one, 9(3):e87640, 2014.
[29] Yao-Jen Chang, Wen-Ying Han, and Yu-Chi Tsai. A kinect-based upperlimb rehabilitation system to assist people with cerebral palsy. Research indevelopmental disabilities, 34(11):3654–3659, 2013.

92 BIBLIOGRAPHY
[30] Jessica Cheung, Melissa Maron, Sandy Tatla, and Tal Jarus. Virtual real-ity as balance rehabilitation for children with brain injury: A case study.Technology and Disability, 25(3):207–219, 2013.
[31] M Bishop Christopher. PATTERN RECOGNITION AND MACHINELEARNING. Springer-Verlag New York, 20016.
[32] Ross A Clark, Yong-Hao Pua, Karine Fortin, Callan Ritchie, Kate E Web-ster, Linda Denehy, and Adam L Bryant. Validity of the microsoft kinectfor assessment of postural control. Gait & posture, 36(3):372–377, 2012.
[33] Ross A Clark, Yong-Hao Pua, Cristino C Oliveira, Kelly J Bower, ShamalaThilarajah, Rebekah McGaw, Ksaniel Hasanki, and Benjamin F Mentiplay.Reliability and concurrent validity of the microsoft xbox one kinect forassessment of standing balance and postural control. Gait & posture,42(2):210–213, 2015.
[34] James J Collins and Carlo J De Luca. Open-loop and closed-loop control ofposture: a random-walk analysis of center-of-pressure trajectories. Experi-mental brain research, 95(2):308–318, 1993.
[35] A. Compston and A. Coles. Multiple sclerosis. Lancet, 372(9648):1502–1517,Oct 2008.
[36] Stefano Corazza, Emiliano Gambaretto, Lars Mundermann, and Thomas PAndriacchi. Automatic generation of a subject-specific model for accuratemarkerless motion capture and biomechanical applications. IEEE Transac-tions on biomedical engineering, 57(4):806–812, 2010.
[37] Stefano Corazza, Lars Muendermann, AM Chaudhari, T Demattio, ClaudioCobelli, and Thomas P Andriacchi. A markerless motion capture systemto study musculoskeletal biomechanics: Visual hull and simulated annealingapproach. Annals of biomedical engineering, 34(6):1019–1029, 2006.
[38] B Daza, RH Caiaffa, BJ Arteta, RV Echeverrıa, Z Ladron de Guevara,M Escamilla, et al. Estudio neuroepidemiologico en juan de acosta, atlantico,colombia. Acta Med Colomb, 17:324, 1992.
[39] Maartje H de Groot, Hanna C van der Jagt-Willems, Jos PCM van Campen,Willem F Lems, Jos H Beijnen, and Claudine JC Lamoth. A flexed posturein elderly patients is associated with impairments in postural control duringwalking. Gait & posture, 39(2):767–772, 2014.

BIBLIOGRAPHY 93
[40] Scott L Delp, Frank C Anderson, Allison S Arnold, Peter Loan, AymanHabib, Chand T John, Eran Guendelman, and Darryl G Thelen. Open-sim: open-source software to create and analyze dynamic simulations ofmovement. IEEE transactions on biomedical engineering, 54(11):1940–1950,2007.
[41] IO DIRECTIONS. Standardization in platform stabilometry being a partof posturography. Agressologie, 24(7):321–326, 1983.
[42] Cailbhe Doherty, Eamonn Delahunt, Brian Caulfield, Jay Hertel, John Ryan,and Chris Bleakley. The incidence and prevalence of ankle sprain injury: asystematic review and meta-analysis of prospective epidemiological studies.Sports medicine, 44(1):123–140, 2014.
[43] Stephen Downs, Jodie Marquez, and Pauline Chiarelli. The berg balancescale has high intra-and inter-rater reliability but absolute reliability variesacross the scale: a systematic review. Journal of physiotherapy, 59(2):93–99,2013.
[44] Pamela W Duncan, Debra K Weiner, Julie Chandler, and Stephanie Stu-denski. Functional reach: a new clinical measure of balance. Journal ofgerontology, 45(6):M192–M197, 1990.
[45] Jairo M Estrada, Jesus Antonio P Camacho, Marıa Teresa C Restrepo, andCarlos Mario M Parra. Parametros antropometricos de la poblacion laboralcolombiana. Revista de la Facultad Nacional de Salud Publica, pages 112–139, 1998.
[46] JM Furman. Posturography: uses and limitations. Bailliere’s clinical neu-rology, 3(3):501–513, 1994.
[47] Moshe Gabel, Ran Gilad-Bachrach, Erin Renshaw, and Assaf Schuster. Fullbody gait analysis with kinect. In Engineering in Medicine and BiologySociety (EMBC), 2012 Annual International Conference of the IEEE, pages1964–1967. IEEE, 2012.
[48] Brook Galna, Dan Jackson, Guy Schofield, Roisin McNaney, Mary Web-ster, Gillian Barry, Dadirayi Mhiripiri, Madeline Balaam, Patrick Olivier,and Lynn Rochester. Retraining function in people with parkinson’s dis-ease using the microsoft kinect: game design and pilot testing. Journal ofneuroengineering and rehabilitation, 11(1):60, 2014.
[49] Alejandro Gonzalez, Mitsuhiro Hayashibe, and Philippe Fraisse. Estimationof the center of mass with kinect and wii balance board. In Intelligent Robots

94 BIBLIOGRAPHY
and Systems (IROS), 2012 IEEE/RSJ International Conference on, pages1023–1028. IEEE, 2012.
[50] Alejandro Gonzalez, Mitsuhiro Hayashibe, and Philippe Fraisse. Subject-specific center of mass estimation for in-home rehabilitation–kinect-wiiboard vs. vicon-force plate. In Converging Clinical and Engineering Re-search on Neurorehabilitation, pages 705–709. Springer, 2013.
[51] D Gonzalez-Ortega, FJ Dıaz-Pernas, Mario Martınez-Zarzuela, and MiriamAnton-Rodrıguez. A kinect-based system for cognitive rehabilitation ex-ercises monitoring. Computer methods and programs in biomedicine,113(2):620–631, 2014.
[52] Klaus Hauer, Mathias Pfisterer, Christine Weber, Nikolai Wezler, MattiasKliegel, and Peter Oster. Cognitive impairment decreases postural controlduring dual tasks in geriatric patients with a history of severe falls. Journalof the American Geriatrics Society, 51(11):1638–1644, 2003.
[53] Martin Heine, Marc B Rietberg, Erwin EH Van Wegen, IGL Van D Port, andGert Kwakkel. Exercise therapy for fatigue in multiple sclerosis. CochraneDatabase Syst Rev, 7, 2012.
[54] Roger L. Albin. Henry L. Paulson. Huntington’s disease: Clinical feauresand routes to therapy. 2011.
[55] Talia Herman, Aner Weiss, Marina Brozgol, Nir Giladi, and Jeffrey M Haus-dorff. Gait and balance in parkinson’s disease subtypes: objective measuresand classification considerations. Journal of neurology, 261(12):2401–2410,2014.
[56] Jay Hertel, WE Buckley, and Craig R Denegar. Serial testing of postural con-trol after acute lateral ankle sprain. Journal of athletic training, 36(4):363,2001.
[57] Fay B Horak. Clinical measurement of postural control in adults. Physicaltherapy, 67(12):1881–1885, 1987.
[58] Fay B Horak. Clinical assessment of balance disorders. Gait & Posture,6(1):76–84, 1997.
[59] Alison Hosey. Huntington’s disease: Pathogenesis and treatment.
[60] Abhijit Jana. Kinect for windows SDK programming guide. Packt PublishingLtd, 2012.
BIBLIOGRAPHY 95
[61] Joseph Jankovic. Parkinson’s disease: clinical features and diagnosis. Jour-nal of Neurology, Neurosurgery & Psychiatry, 79(4):368–376, 2008.
[62] Eric Jones, Travis Oliphant, Pearu Peterson, et al. SciPy: Open sourcescientific tools for Python, 2001. [Online; accessed march 10th (2018)].
[63] James O Judge, Mary B King, Robert Whipple, Jonathan Clive, and Leslie IWolf son. Dynamic balance in older persons: effects of reduced visual andproprioceptive input. The Journals of Gerontology Series A: Biological Sci-ences and Medical Sciences, 50(5):M263–M270, 1995.
[64] Yihwan Jung, Moonki Jung, Kunwoo Lee, and Seungbum Koo. Groundreaction force estimation using an insole-type pressure mat and joint kine-matics during walking. Journal of biomechanics, 47(11):2693–2699, 2014.
[65] Gary Kamen and Electromyographic Kinesiology. Research methods inbiomechanics. Champaign, IL, Human Kinetics Publ, 2004.
[66] Eric R Kandel, James H Schwartz, Thomas M Jessell, Steven A Siegelbaum,A James Hudspeth, et al. Principles of neural science, fifth edition, volume 4.McGraw-hill New York, 2012.
[67] Deb A Kegelmeyer, Anne D Kloos, Karen M Thomas, and Sandra K Kostyk.Reliability and validity of the tinetti mobility test for individuals withparkinson disease. Physical Therapy, 87(10):1369–1378, 2007.
[68] Ancel Keys, Flaminio Fidanza, Martti J Karvonen, Noburu Kimura, andHenry L Taylor. Indices of relative weight and obesity. International journalof epidemiology, 43(3):655–665, 2014.
[69] A Khasnis, RM Gokula, et al. Romberg’s test. Journal of postgraduatemedicine, 49(2):169, 2003.
[70] Diederik P Kingma and Jimmy Ba. Adam: A method for stochastic opti-mization. arXiv preprint arXiv:1412.6980, 2014.
[71] Martin Langkvist, Lars Karlsson, and Amy Loutfi. A review of unsuper-vised feature learning and deep learning for time-series modeling. PatternRecognition Letters, 42:11–24, 2014.
[72] Jean A Langlois, Wesley Rutland-Brown, and Marlena M Wald. The epi-demiology and impact of traumatic brain injury: a brief overview. TheJournal of head trauma rehabilitation, 21(5):375–378, 2006.
[73] Yann LeCun, Yoshua Bengio, and Geoffrey Hinton. Deep learning. nature,521(7553):436, 2015.
96 BIBLIOGRAPHY
[74] Yann LeCun, Leon Bottou, Genevieve B Orr, and Klaus-Robert Muller.Efficient backprop. In Neural networks: Tricks of the trade, pages 9–50.Springer, 1998.
[75] Eric J Lenze, Joan C Rogers, Lynn M Martire, Benoit H Mulsant, Bruce LRollman, Mary Amanda Dew, Richard Schulz, and Charles F Reynolds.The association of late-life depression and anxiety with physical disability:a review of the literature and prospectus for future research. The AmericanJournal of Geriatric Psychiatry, 9(2):113–135, 2001.
[76] Yebin Liu, Carsten Stoll, Juergen Gall, Hans-Peter Seidel, and ChristianTheobalt. Markerless motion capture of interacting characters using multi-view image segmentation. In Computer Vision and Pattern Recognition(CVPR), 2011 IEEE Conference on, pages 1249–1256. IEEE, 2011.
[77] Xiaolei Lv, Jinxiang Chai, and Shihong Xia. Data-driven inverse dynamicsfor human motion. ACM Transactions on Graphics (TOG), 35(6):163, 2016.
[78] Brian E Maki and William E McIlroy. Postural control in the older adult.Clinics in geriatric medicine, 12(4):635–658, 1996.
[79] Martina Mancini and Fay B Horak. The relevance of clinical balance as-sessment tools to differentiate balance deficits. European journal of physicaland rehabilitation medicine, 46(2):239, 2010.
[80] Jean Massion. Postural control system. Current opinion in neurobiology,4(6):877–887, 1994.
[81] Matlab statistics and machine learning toolbox, 2014. The MathWorks,Natick, MA, USA.
[82] Susan W Muir, Katherine Berg, Bert Chesworth, and Mark Speechley. Useof the berg balance scale for predicting multiple falls in community-dwellingelderly people: a prospective study. Physical therapy, 88(4):449–459, 2008.
[83] MP Murray, A Seireg, and RC Scholz. Center of gravity, center of pressure,and supportive forces during human activities. Journal of Applied Physiol-ogy, 23(6):831–838, 1967.
[84] Lewis M Nashner. Practical biomechanics and physiology of balance. Bal-ance Function Assessment and Management, page 431, 2014.
[85] Joao F Nunes, Pedro M Moreira, and Joao Manuel RS Tavares. Humanmotion analysis and simulation tools: A survey. In Handbook of Researchon Computational Simulation and Modeling in Engineering, pages 359–388.IGI Global, 2016.

BIBLIOGRAPHY 97
[86] Oxford Dictionary of Sports Science & Medicine. ground reaction force.http://www.answers.com/topic/ground-reaction-force, 2011.
[87] J Ojeda, J Martınez-Reina, and J Mayo. The effect of kinematic constraintsin the inverse dynamics problem in biomechanics. Multibody System Dy-namics, 37(3):291–309, 2016.
[88] World Health Organization. World report on disability. 2011.
[89] World Health Organization et al. International classification of impairments,disabilities, and handicaps: a manual of classification relating to the conse-quences of disease, published in accordance with resolution wha29. 35 of thetwenty-ninth world health assembly, may 1976. 1980.
[90] World Health Organization et al. Atlas: multiple sclerosis resources in theworld 2008. 2008.
[91] Rosa Ortiz-Gutierrez, Roberto Cano-de-la Cuerda, Fernando Galan-del Rıo,Isabel Marıa Alguacil-Diego, Domingo Palacios-Cena, and Juan CarlosMiangolarra-Page. A telerehabilitation program improves postural controlin multiple sclerosis patients: a spanish preliminary study. Internationaljournal of environmental research and public health, 10(11):5697–5710, 2013.
[92] Susan B O’Sullivan and Thomas J Schmitz. Physical rehabilitation. ed.Philadelphia, PA: FA Davis Company, 2007.
[93] Jessica M Paavola, Kory E Oliver, and Ksenia I Ustinova. Use of x-boxkinect gaming console for rehabilitation of an individual with traumaticbrain injury: A case report. Journal of Novel Physiotherapies, 3(01):1–6,2013.
[94] Riann M Palmieri, Christopher D Ingersoll, Marcus B Stone, and B AndrewKrause. Center-of-pressure parameters used in the assessment of posturalcontrol. Journal of Sport Rehabilitation, 11(1):51–66, 2002.
[95] Sılvia Leticia Pavao, Adriana Neves dos Santos, Marjorie Hines Woollacott,and Nelci Adriana Cicuto Ferreira Rocha. Assessment of postural control inchildren with cerebral palsy: a review. Research in developmental disabili-ties, 34(5):1367–1375, 2013.
[96] Vanessa Vieira Pereira, Roberto Alcantara Maia, and Sonia Maria Cesarde Azevedo Silva. The functional assessment berg balance scale is bettercapable of estimating fall risk in the elderly than the posturographic balancestability system. Arquivos de neuro-psiquiatria, 71(1):5–10, 2013.

98 BIBLIOGRAPHY
[97] Patrick Perez, Carine Hue, Jaco Vermaak, and Michel Gangnet. Color-basedprobabilistic tracking. Computer vision—ECCV 2002, pages 661–675, 2002.
[98] Cesar Perez Lopez. Muestreo estadistico. conceptos y problemas resueltos.Technical report, Universidad Complutense de Madrid, Madrid (Espana);Instituto de Estudios Fiscales, Madrid (Espana)., 2005.
[99] Cristy Phillips, Mehmet Akif Baktir, Devsmita Das, Bill Lin, and AhmadSalehi. The link between physical activity and cognitive dysfunction inalzheimer disease. Physical therapy, 95(7):1046–1060, 2015.
[100] JE Pompeu, LA Arduini, AR Botelho, MBF Fonseca, SM AL-VARENGA ANTI Pompeu, C Torriani-Pasin, and JE Deutsch. Feasibil-ity, safety and outcomes of playing kinect adventures!TM for people withparkinson’s disease: a pilot study. Physiotherapy, 100(2):162–168, 2014.
[101] A Pradilla, A Vesga, E Boris, Fidias E Leon-Sarmiento, Diego A Roselli,Leonelo E Bautista, Luis Morillo, Carlos S Uribe, Yuri Takeuchi, JorgeDaza, et al. Estudio neuroepidemiologico nacional (epineuro) colombiano.2003.
[102] Jana Lizrova Preiningerova, Klara Novotna, Jan Rusz, Lucie Sucha, EvzenRuzicka, and Eva Havrdova. Spatial and temporal characteristics of gait asoutcome measures in multiple sclerosis (edss 0 to 6.5). Journal of neuro-engineering and rehabilitation, 12(1):14, 2015.
[103] Parvin Raji. Functional balance tests. Bimonthly Audiology-Tehran Univer-sity of Medical Sciences, 21(4):1–9, 2012.
[104] Bryan L Riemann and Kevin M Guskiewicz. Effects of mild head injury onpostural stability as measured through clinical balance testing. Journal ofathletic training, 35(1):19, 2000.
[105] Moritz Heinrich Romberg. Lehrbuch der nervenkrankheiten des menschen,volume 1. Duncker, 1840.
[106] Martin Romero, Carlos Arango, Nelson Alvis, Juan Camilo Suarez, andAristides Duque. Costos de la esclerosis multiple en colombia. Value inHealth, 14(5):S48–S50, 2011.
[107] Christopher A Ross and Sarah J Tabrizi. Huntington’s disease: from molec-ular pathogenesis to clinical treatment. The Lancet Neurology, 10(1):83–98,2011.

BIBLIOGRAPHY 99
[108] Laurence Z Rubenstein. Falls in older people: epidemiology, risk factors andstrategies for prevention. Age and ageing, 35(suppl 2):ii37–ii41, 2006.
[109] Sebastian Ruder. An overview of gradient descent optimization algorithms.arXiv preprint arXiv:1609.04747, 2016.
[110] Brooke Salzman. Gait and balance disorders in older adults. Am FamPhysician, 82(1):61–68, 2010.
[111] JL Sanchez, C Aguirre, OM Arcos-Burgos, I Jimenez, M Jimenez, F Leon,J Pareja, G Pradilla, B Uribe, CS Uribe, et al. Prevalencia de la esclerosismultiple en colombia. Rev Neurol, 31(12):1101–1103, 2000.
[112] Anne Schmitz, Mao Ye, Robert Shapiro, Ruigang Yang, and Brian Noehren.Accuracy and repeatability of joint angles measured using a single cameramarkerless motion capture system. Journal of biomechanics, 47(2):587–591,2014.
[113] Loren Arthur Schwarz, Artashes Mkhitaryan, Diana Mateus, and NassirNavab. Human skeleton tracking from depth data using geodesic distancesand optical flow. Image and Vision Computing, 30(3):217–226, 2012.
[114] Fabio Scoppa, Roberto Capra, Michele Gallamini, and Riccardo Shiffer.Clinical stabilometry standardization: basic definitions–acquisition interval–sampling frequency. Gait Posture, 37(2):290–292, 2013.
[115] Garima Gedamkar Scott Buxton Sheik Abdul Khadir, Rachael Lowe. Base ofSupport. https://www.physio-pedia.com/Base_of_Support, 2011. On-line; accessed 05-november-2017.
[116] Takeshi Shimba. An estimation of center of gravity from force platform data.Journal of Biomechanics, 17(1):5359–5760, 1984.
[117] Jamie Shotton, Toby Sharp, Alex Kipman, Andrew Fitzgibbon, Mark Finoc-chio, Andrew Blake, Mat Cook, and Richard Moore. Real-time human poserecognition in parts from single depth images. Communications of the ACM,56(1):116–124, 2013.
[118] Anne Shumway-Cook and Marjorie H Woollacott. Motor control: translatingresearch into clinical practice. Lippincott Williams & Wilkins, 2007.
[119] Amanda P Silvatti, Pietro Cerveri, Thiago Telles, Fabio AS Dias, Guido Ba-roni, and Ricardo ML Barros. Quantitative underwater 3d motion analysisusing submerged video cameras: accuracy analysis and trajectory recon-struction. Computer methods in biomechanics and biomedical engineering,16(11):1240–1248, 2013.

100 BIBLIOGRAPHY
[120] German D Sosa, Juanita Sanchez, and Hugo Franco. Improved front-viewtracking of human skeleton from kinect data for rehabilitation supportin multiple sclerosis. In Signal Processing, Images and Computer Vision(STSIVA), 2015 20th Symposium on, pages 1–7. IEEE, 2015.
[121] Christine Stadelmann. Multiple sclerosis as a neurodegenerative disease:pathology, mechanisms and therapeutic implications. Current opinion inneurology, 24(3):224–229, 2011.
[122] Matthew C. Streicher. Kinematic comparison of marker set techniques usedin biomechanical analysis. Master’s thesis, University of Akron, UnitedStates, 2007.
[123] Elif Surer, Andrea Cereatti, Enrico Grosso, and Ugo Della Croce. A marker-less estimation of the ankle–foot complex 2d kinematics during stance. Gait& Posture, 33(4):532–537, 2011.
[124] Richard Szeliski. Computer vision: algorithms and applications. SpringerScience & Business Media, 2010.
[125] Reisuke H Takahashi, Toshitaka Nagao, and Gunnar K Gouras. Plaqueformation and the intraneuronal accumulation of β-amyloid in alzheimer’sdisease. Pathology International, 2017.
[126] Mary E Tinetti. Performance-oriented assessment of mobility problems inelderly patients. Journal of the American Geriatrics Society, 34(2):119–126,1986.
[127] Mary E Tinetti. Preventing falls in elderly persons. N Engl j Med,2003(348):42–49, 2003.
[128] Bruce D Trapp and Klaus-Armin Nave. Multiple sclerosis: an immune orneurodegenerative disorder? Annu. Rev. Neurosci., 31:247–269, 2008.
[129] Alper Murat Ulaslı, Utku Turkmen, Hasan Toktas, and Ozlem Solak. Thecomplementary role of the kinect virtual reality game training in a patientwith metachromatic leukodystrophy. PM&R, 6(6):564–567, 2014.
[130] Marcel van Gerven and Sander Bohte. Artificial neural networks as modelsof neural information processing. Frontiers Media SA, 2018.
[131] Melier Vargas-Zarate, Fabiola Becerra-Bulla, and Edgar Prieto-Suarez.Evaluacion antropometrica de estudiantes universitarios en bogota, colom-bia. Revista de salud Publica, 10(3), 2008.

BIBLIOGRAPHY 101
[132] Christopher L Vaughan, Brian L Davis, CO Jeremy, et al. Dynamics ofhuman gait. 1999.
[133] Jasper E Visser, Mark G Carpenter, Herman van der Kooij, and Basti-aan R Bloem. The clinical utility of posturography. Clinical Neurophysiol-ogy, 119(11):2424–2436, 2008.
[134] Theo Vos, Ryan M Barber, Brad Bell, Amelia Bertozzi-Villa, Stan Biryukov,Ian Bolliger, Fiona Charlson, Adrian Davis, Louisa Degenhardt, DanielDicker, et al. Global, regional, and national incidence, prevalence, and yearslived with disability for 301 acute and chronic diseases and injuries in 188countries, 1990-2013: a systematic analysis for the global burden of diseasestudy 2013. The Lancet, 386(9995):743, 2015.
[135] Francis O Walker. Huntington’s disease. The Lancet, 369(9557):218–228,2007.
[136] Michael W Whittle. Gait analysis: an introduction. Butterworth-Heinemann, 2014.
[137] Brie Williams, Anna Chang, C Landefeld, Cyrus Ahalt, Rebecca Conant,and Helen Chen. Current Diagnosis and Treatment: Geriatrics 2E. McGrawHill Professional, 2014.
[138] David A Winter. Biomechanics of human movement with applications tothe study of human locomotion. Critical reviews in biomedical engineering,9(4):287–314, 1984.
[139] Anne B Young, Ira Shoulson, John B Penney, Simon Starosta-Rubinstein,Fidela Gomez, Helen Travers, Maria A Ramos-Arroyo, S Robert Snodgrass,Ernesto Bonilla, Humberto Moreno, et al. Huntington’s disease in venezuelaneurologic features and functional decline. Neurology, 36(2):244–244, 1986.
[140] Zhengyou Zhang. Microsoft kinect sensor and its effect. IEEE multimedia,19(2):4–10, 2012.

102 BIBLIOGRAPHY

Appendix A
Kinect technicalspecifications
The following information was retrieved from the Kinect programming guide avail-able in the Microsoft Developer Network website (https://msdn.microsoft.com/es-co/library/jj131033.aspx).
103

104 APPENDIX A. KINECT TECHNICAL SPECIFICATIONS
Kinect for Windows Sensor Components andSpecifications
Kinect for Windows 1.5, 1.6, 1.7, 1.8
Inside the sensor case, a Kinect for Windows contains:
• An RGB camera that stores three channel data in a 1280x960 resolution. Thismakes capturing a color image possible.
• An infrared (IR) emitter and an IR depth sensor. The emitter emits infraredlight beams and the depth sensor reads the IR beams reflected back to thesensor. The reflected beams are converted into depth information measuringthe distance between an object and the sensor. This makes capturing a depthimage possible.
• A multi-array microphone, which contains four microphones for capturing sound.Because there are four microphones, it is possible to record audio as well as findthe location of the sound source and the direction of the audio wave.
• A 3-axis accelerometer configured for a 2G range, where G is the accelerationdue to gravity. It is possible to use the accelerometer to determine the currentorientation of the Kinect.

105
Specifications for the Kinect
Kinect Array SpecificationsViewing angle 43◦vertical by 57◦horizontal field of viewVertical tilt range ±27◦
Frame rate (depthand color stream)
30 frames per second (FPS)
Audio format 16-kHz, 24-bit mono pulse code modulation (PCM)
Audio inputcharacteristics
A four-microphone array with 24-bit analog-to-digitalconverter (ADC) and Kinect-resident signal processingincluding acoustic echo cancellation and noisesuppression
Accelerometercharacteristics
A 2G/4G/8G accelerometer configured for the 2G range,with a 1◦accuracy upper limit.
The resolution of the depth stream is dependent on the frame rate, and is specified bythe DepthImageFormat Enumeration enumeration. Similarly, the resolution of thecolor stream is specified by the ColorImageFormat Enumeration enumeration.

106 APPENDIX A. KINECT TECHNICAL SPECIFICATIONS

Appendix B
AMTI AccuGait Optimizedplatform specifications
The following information was retrieved from the technical overview for the Ac-cuGait Optimized force platform available in the AMTI official website: http:
//www.amti.biz/PDFs/ACG-O.pdf
107

www.AMTI.biz | [email protected]
Portable Gait & Balance Platform
OVERVIEW AMTI's AccuGait Optimized™ multi-axis force platform is a portable solution for quantifying human gait and balance. The AccuGait’s innovative, patented design is accurate, economical, and easy to use with AMTI's powerful NetForce / BioAnalysis software. The plug & play USB interface automatically synchronizes multiple platforms and eliminates external power supplies. AccuGait Optimized attains unprecedented levels of accuracy for measuring Center of Pressure, forces and moments, as well as dramatic reductions in crosstalk. This breakthrough in performance is made possible by AMTI’s unique precision grid calibration technology. This new level of accuracy enables clinicians to make better patient measurements, and enables researchers to perform better science based on more accurate input data. The
levels of accuracy achieved with AccuGait Optimized are a quantum leap over previous technologies used in the biomechanics industry.
SYSTEM FEATURES Multi-Component Measurement Forces: Fx, Fy, Fz Moments: Mx, My, Mz Digital Output Plug & play USB 2.0 interface automatically synchronizes up to 12 AccuGait Optimized force platforms. High Overload Protection One-piece sensor element provides extremely high overload protection on all axes.
Unprecedented Accuracy Better Data for Better Science
Plug & Play USB Interface

www.AMTI.biz | [email protected]
Portable - No Mounting Necessary Just place the platform on a flat surface and use. Portable Walkway Available AMTI's portable walkway is a convenient flooring solution for the AccuGait Optimized™.
SOFTWARE
Plug-and-play integration with major motion capture systems
Free NetForce™ data acquisition application with subject database
C++ SDK for developers upon request
LabVIEW instrument driver upon request
Multiple product integration - automatically synchronizes with other AMTI USB acquisition products
Seamlessly integrates with AMTI's software applications:
BioAnalysis
Balance Clinic
Balance Trainer
UNPRECEDENTED ACCURACY
Better Data for Better Science
AMTI’s precision grid calibration technology optimizes each AccuGait Optimized force platform’s accuracy. By taking 1275 measurements in a grid pattern and using the points for calibration, enormous improvements in accuracy and reductions in crosstalk are realized – typically 5X better! The result: clinicians and researchers can perform better science from better data. In fact, force platforms are the very basis of clinical analysis and research involving gait, balance, sports performance, and biomechanics, so force platform accuracy matters.
AccuGait Optimized force platforms are calibrated with 5 separate force values for each of 255 locations across the platform’s surface. This automated process applies the forces with a positional accuracy of 0.005mm. Force / moment accuracy, linearity, hysteresis and crosstalk are all measured, and measuring accuracy is verified using NIST-traceable weights with an accuracy of 0.01%.
Optimizing Grid Calibration

www.AMTI.biz | [email protected]
UNPRECEDENTED ACCURACY (cont.) The plots below show measured accuracy and crosstalk after optimization. The optimization process yields a dramatic improvement in performance.
Optimized
Center of Pressure Accuracy
Fz Accuracy
Fz to Fx Crosstalk
Optimized
Optimized

www.AMTI.biz | [email protected]
Fz Capacity, lb (N) 300 (1334) Fx, Fy Capacity, lb (N) 100 (450) Mz Capacity, in-lb (Nm) 750 (85) Resultant Moment Capacity- √(Mx2+My2), in-lb (Nm)
2000 (226)
Fz Natural Frequency 150 Hz Fx, Fy Natural Frequency 140 Hz Dimensions, in (mm) 1.79 X 19.75 X 19.75 (45.5 X 502 X 502) Weight, lb (kg) 25 (11.4) Digital Data Rate 10 – 1000 data sets per second, user selectable Interface USB 2.0 Device Synchronization Automatic; ultra-low jitter External Sync Signal Active = low volts, switch to ground
Inactive = high volts, open circuit with internal pull up resistor. Protected to ± 10V. 1K Ohm input resistance.
Digital Data Transmission 32 bit floating point data containing 6 measurement channels, IEEE format
Power Supply USB-powered, 380mA Computer Requirements USB 2.0 port, Windows 7, 1024 Mb RAM, 1.7 GHz Filters Fixed 100 Hz 3rd order analog Software Force Platform Capacity
NetForce™: up to 12 force platforms (USB hubs required) BioAnalysis™: up to 4 force platforms (USB hub required)
CE Certification CE Compliant – Medical Grade – Passed AAMI/ES 60601-1, CAN/CSA C22.2 #60601-1, IEC 60601-1, & IEC 60601-1-6
SPECIFICATIONS
ACG-O Data Sheet -rev. 4
AMTI is ISO 9001:2008 & ISO 13485:2003 Certified
Specifications are subject to change without notice.

112APPENDIX B. AMTI ACCUGAIT OPTIMIZED PLATFORM SPECIFICATIONS

Appendix C
Acceptance survey forpatients
The present survey is written in Spanish since all the subject included in thestudy were Spanish speakers. Additionally, this survey was divided in two partsin accordance to the following guidelines:
• Questions 1 to 3 are fulfilled just after the subjects finishes the balance testfor data acquisition
• Questions 4 to 6 are fulfilled once the test balance results are explained tothe subject by an expert.
113

114 APPENDIX C. ACCEPTANCE SURVEY FOR PATIENTS
EVALUACION DEL USO DE LA HERRAMIENTA SKTRACKSCOMO SOPORTE AL DIAGNOSTICO DE LA FUNCION DEBALANCE EN PACIENTES CON ESCLEROSIS MULTIPLE
EVALUACION PARA PACIENTES
1. ¿La realizacion de la prueba demando un incremento notable de esfuerzo(fısico o de concentracion) en comparacion al diagnostico tradicional? (Unicarespuesta)
• No, fue incluso mas sencilla de realizar que las tradicionales.
• No, es el mismo esfuerzo que realizo normalmente durante una pruebade equilibrio o de esfuerzo fısico.
• Si, la realizacion de la prueba demanda un mayor esfuerzo que laspruebas fısicas normales.
• Si, la prueba es tan demandante que no fue posible realizarla.
2. ¿Considera que el uso de este tipo de herramientas tecnologicas hace que larealizacion las pruebas fısicas seas mas atractiva? (Unica respuesta)
• Si, este tipo de herramientas hace las sesiones mas atractivas de realizar.
• No del todo, lo que ofrece este tipo de herramientas no es mas intere-sante que lo que ofrece la terapia tradicional.
• No, este tipo de herramientas no es llamativa, incluso incomoda o mo-lesta para la realizacion de la prueba.
• No, incluso considero que el uso de este tipo de herramientas puedeafectarme fısicamente en alguna ocasion.
3. ¿Cuales cree que son los principales aportes del uso de herramientas tec-nologicas interactivas al momento en que los pacientes realizan pruebasfısicas de balance? (Seleccione una o mas de una)
• El uso de nuevas tecnologıas en rehabilitacion fısica.
• Retroalimentacion visual (Ver su desempeno en tiempo real).
• Un ambiente ludico (de juego) a la hora de realizar pruebas.
• Portabilidad (la posibilidad de ver esta herramienta en un consultorioo en casa).
• Relacion costo-beneficio.
• Otros?

115
• Ninguno.
4. ¿Comprende los resultados presentados y puede relacionarlos con su capaci-dad de mantener el equilibrio? (Unica respuesta)
• Si, la informacion es clara acerca de mi desempeno en la prueba y micapacidad de balance.
• Si parcialmente, comprendo solo una parte de la informacion presentadacon respecto a mi desempeno y capacidad de balance.
• No totalmente, entiendo la informacion presentada pero no siento quetenga que ver con mi condicion actual de balance.
• No, no comprendo la informacion presentada con respecto a mi de-sempeno en la prueba y mi capacidad de balance.
5. ¿Cree que, con la visualizacion de los resultados de la prueba, se puedecomprender mejor el diagnostico por parte del experto? (Unica respuesta)
• Si, la presentacion de resultados facilita mucho la comprension del di-agnostico por parte del experto.
• Si, la presentacion de resultados facilita en parte la comprension deldiagnostico por parte del experto.
• No, la presentacion de los resultados no es necesaria. Es suficiente conla opinion del experto.
• No, los resultados presentados y lo que me dice el experto es confusoy/o contradictorio.
6. Si en un futuro, el uso de este tipo herramientas interactivas estuvieradisponible permanentemente en diferentes espacios ¿Cuales de las siguientesacciones realizarıa probablemente? (Seleccione una o mas de una)
• Aceptarıa realizar sesiones de diagnostico o terapia con mayor frecuen-cia.
• Aceptarıa realizar sesiones de diagnostico o terapia de mayor duracion.
• Aceptarıa realizar sesiones de diagnostico o terapia mas exigentes.
• Realizarıa ejercicios por mi cuenta para mejorar mi desempeno en elmomento de tener una sesion de diagnostico o terapia.
• Realizarıa las pruebas fısicas con mejor animo y disposicion.
• Invitarıa a mas personas para que fueran evaluadas con este tipo deherramientas.
• Otras?
• No harıa ninguna de las anteriores.

116 APPENDIX C. ACCEPTANCE SURVEY FOR PATIENTS

Appendix D
Acceptance survey formedical staff
The present survey is in Spanish since all the subject included in the study wereSpanish speakers. Additionally, this survey was divided in two parts in accordanceto the following guidelines:
• Questions 1 to 3 are fulfilled according to the experience using the SKtrackssoftware for postural data acquisition.
• Questions 4 to 6 are fulfilled after inspection, interpretation and presentationof stabilogram results yielded by the proposed method.
117

118 APPENDIX D. ACCEPTANCE SURVEY FOR MEDICAL STAFF
EVALUACION DEL USO DE LA HERRAMIENTA SKTRACKSCOMO SOPORTE AL DIAGNOSTICO DE LA FUNCION DEBALANCE EN PACIENTES CON ESCLEROSIS MULTIPLE
EVALUACION PARA PERSONAL MEDICO
1. ¿Pudo usar la herramienta sin que representara una interferencia significativacon respecto a la realizacion de un diagnostico tradicional? (Unica respuesta)
• Si, la herramienta es intuitiva y facil de usar, no interfiere con la real-izacion del diagnostico en absoluto, o al menos no de forma significativa.
• Si, aunque requiere conocimiento previo y/o practica para usarla sinque interfiera con el diagnostico significativamente.
• No del todo, el uso de la herramienta interfiere con el diagnostico, yasea por dificultad para usarla, o por que requiere realizar una serie detareas adicionales que no realizaba normalmente.
• No, no pude usar la herramienta aun con las instrucciones dadas.
2. ¿El significado y la naturaleza de las medidas adquiridas por la herramientason comprensibles? (Unica respuesta)
• Si, entiendo el tipo de medidas adquiridas y su relacion con el controlpostural.
• Si, entiendo el tipo de medidas pero no su relacion con el control pos-tural.
• No, no comprendo las medidas aunque se que son usadas para la eval-uacion del control postural.
• No, no comprendo las medidas ni como pueden ayudar a diagnosticarel control postural.
3. ¿Considera que las medidas adquiridas son representativas del estado delpaciente en terminos de control postural? (Unica respuesta)
• Si, las medidas adquiridas pueden ser suficientes para conocer el estadode balance del paciente desde un punto de vista general.
• Si, aunque complementando con medidas obtenidas a traves de otrosprocedimientos.
• No, aunque las medidas se relacionan con balance, no son suficientespara un diagnostico basico.
• No, las medidas no arrojan informacion relevante para un diagnostico.

119
4. ¿Considera util y comprensible la informacion presentada acerca de los re-sultados que ofrece la herramienta? (Unica respuesta)
• Si, la informacion presentada resume de forma sencilla el desempenodel paciente en terminos de control postural.
• Si, la informacion se relaciona con el desempeno del paciente en terminosde control postural. Pero no es facil de interpretar.
• Si, comprendo los resultados facilmente, pero no se relaciona con larealidad que observe en cuanto al desempeno del paciente en terminosde control postural.
• No, la informacion presentada no es posible de interpretar.
5. ¿Considera que la informacion presentada aporta informacion adicional a laevaluacion del paciente en comparacion a los test de balance tradicionales,como el Test de Berg? (Unica respuesta)
• Si, la informacion presentada es altamente detallada y enriquece alta-mente el diagnostico que ofrecen los test tradicionales.
• Si, la informacion presentada contiene suficientes datos de interes quecomplementan el diagnostico que ofrecen los test de balance tradi-cionales.
• No totalmente, la informacion presentada es similar a la obtenida conun test de balance pero representada en una forma visual y/o numerica.
• No, la informacion presentada no aporta informacion nueva en com-paracion a los test de balance tradicionales.
6. ¿Agregarıa, modificarıa o eliminarıa elementos con respecto a los resultadospresentados? (Unica respuesta)
• No, los elementos presentados son suficientes para un diagnostico gen-eral del control postural de un paciente.
• Si, desde mi punto de vista, hay otras medidas de interes que la her-ramienta podrıa arrojar para generar un reporte mas completo y detal-lado (mencionelas).

120 APPENDIX D. ACCEPTANCE SURVEY FOR MEDICAL STAFF

Appendix E
Published works
Throughout the development of this project, partial results have been presented inmedical and engineering proceedings and are also available as papers in differentacademic databases such as IEEE Xplore and Springer. Since 2015, a total ofthree works have been presented and published. The following list shows the titleof the work, the year of publication and the event where it as presented, also thefirst page in attached to this appendix as a preview.
• (2015). Improved front-view tracking of human skeleton from Kinect datafor rehabilitation support in Multiple Sclerosis. Signal Processing, Imagesand Computer Vision (STSIVA). - IEEE Xplore.
• (2016). Evaluation of computer vision based objective measures for comple-mentary balance function description and assessment in multiple sclerosis.VII Latin American Congress on Biomedical Engineering CLAIB 2016 -Springer.
• (2017). Postural Control Assessment in Multiple Sclerosis by Diffusion Anal-ysis on Kinect Skeleton Data. Workshop on Engineering Applications -Springer
121

Improved front-view tracking of human skeleton from Kinect datafor rehabilitation support in Multiple Sclerosis
German D. Sosa Juanita Sanchez∗ Hugo Franco†
Abstract
Multiple Sclerosis (MS) is an auto-immune, inflamma-tory disease of the Central Nervous System (CNS), con-sisting in the progressive demyelinization of axonal fibers.Given its degenerative nature, MS treatment faces complexchallenges for both pharmaceutical and therapeutic inter-ventions. Indeed, patients with diagnostic of multiple scle-rosis will require continuous rehabilitation for life in orderto reduce the progression rate of the disease. However, toassess the actual impact of the particular therapeutic inter-vention is a difficult process with important implications inthe choice of a treatment pathway. Objective measurements(response time, velocity, range of motion -ROM-, etc.) ofpatient performance could enhance the patient state infor-mation available for therapeutic decision making, in a con-tinuous evaluation scenario.
This work presents a first step in the design of a low-costcomputer-vision based framework (using KinectTM) for theobjective measurement of multiple sclerosis patient func-tional performance1. A real-time front-view detection of hu-man skeleton was implemented to track patient motion andmeasure the ROM for neck, shoulder, elbow, hip and kneejoints. Preliminary measurements on four control subjects(two males, two females) were performed and the systemaccuracy was evaluated against traditional static diagnos-tic measurements (goniometer).
1. INTRODUCTION
Multiple sclerosis is an inflammatory disease of the Cen-tral Nervous System, resulting from the progressive destruc-tion of the axon myelin sheath [17]. The etiology of such
∗J. Sanchez is with the programa de Fisioterapia, Universidaddel Rosario, 45435, Bogota, Colombia. juanita.sanchez aturosario.edu.co†G. Sosa and H. Franco are with the Dept. de Inge-
nierıa de Sistemas, Universidad Central, 110321, Bogota, Colombia.{gsosar,hfrancot} at ucentral.edu.co
1In collaboration with the Foundation for Multi-ple Sclerosis (FUNDEM), Bogota D.C. (Colombia),http://www.fundacionfundem.com/
process is still unknown and subject of intense debate withinthe specialized community, regarding if it is an autoimmuneor neurodegenerative disorder [25].
Nevertheless, MS is among the most common CentralNervous System inflammatory disease in humans and doesnot have a cure. In Colombia, the multiple sclerosis preva-lence to December 31st, 2002 was 4.41/100.000 (C.I. 95%),5.98/100.000 for females (C.I. 95%) and 2.71/100.000 formales (C.I. 95%). For people with ages between 15 and74 years, this prevalence rises to 6.12/100.000 [23]. There-fore, Colombian women are more prone than men to de-velop multiple sclerosis in a ratio of 1.9 : 3.1.
1.1. Treating multiple sclerosis
The physiopathology of Multiple Sclerosis demands for-life continuous physical rehabilitation on patients to palliatethe impairment rate along the disease progress [7]. Somerecent studies has stated that, to get an observable benefit inthe patient condition, it is necessary to provide patients withtherapeutic intervention at least 1 to 4 times a week [10].
This need for an intensive therapeutic intervention topreserve patient functionality emerges as a major chal-lenge, given the progressive (and commonly irreversible)loss on patient abilities to address common day activities[24], such as those involved in longer displacements fromhis/her house to the rehabilitation center. Furthermore, dueto the personal calamity of suffering an incurable diseaseand the damage on high level functions of the CNS, it isusual that MS patients develop a co-morbid Major Depres-sion [22], among other related conditions. Then, follow-ing the disease progression by frequent, detailed, objectiveassessment of patient condition (i.e. periodical measure-ments of joint ROMs by goniometer) is not always feasiblesince it would demand long sessions for diagnostic eval-uation, an exhausting procedure for a physically impairedperson. Technological tools enhancing the availability andaccessibility of standard clinical evaluation [12] and thera-peutic intervention [7,10,24] procedures could greatly helpMS patients to actively participate in their own treatment.
978-1-4673-9461-1/15/$31.00 c©2015 IEEE

Abstract— Multiple Sclerosis is a neurodegenerative–autoimmune disorder caused by a demyelination process of theaxonal tracts within the Central Nervous System. This conditionwill increasingly affect cognitive, perceptual, motor and evenvital life functions at different rates. Sensorimotor impairmentshave an increasing impact in the patient functionality, alteringbasic abilities e.g. static and dynamic equilibrium, whosepreservation is an important therapeutic goal. The assessmentof the state and progression of the associated disabilities is arelevant issue in the election and adjustment of a rehabilitationpathway.
This work presents an exploratory study on the use of an-gular kinematic variables as objective descriptors for MultipleSclerosis diagnostic support, comparing its behavior against thescore values for a subset of five equilibrium tests within the BergBalance Scale. These values were estimated using a computervision-based framework integrating data from a Kinect sensorand the NiTE skeleton model. This version of the frameworkprovides angular measures for mediolateral and anteroposte-rior balance. To evaluate this quantitative approach, a sampleof six patients with diagnosis of Multiple Sclerosis, and able tomaintain the standing position, performed all five balance testswhile both mediolateral and anteroposterior angles were regis-tered along each of them and compare its behaviour against thecorresponding evaluation using the standard Berg Balance Scalescores assigned by a physiotherapist.
I INTRODUCTION
Multiple Sclerosis (MS) is a neurodegenerative autoim-mune disorder of the Central Nervous System (CNS) re-lated to disability [1] caused by the emergence of focal areasof inflammatory demyelination causing symptoms like limbweakness, gait ataxia, pharestesia, neck flexion, etc [1]. De-spite MS does not significantly reduces life expectancy, it de-mands for life physical rehabilitation in order to mitigate in-creasing impairments which usually reduce the ability of thepatient to carry out common-day tasks involving motor fac-ulties. Indeed, MS is the major cause of non-traumatic neuro-logical disability [2], with an average prevalence of 30 cases
per 100.000 habitants with ages between 5 and 80 years. InColombia, this prevalence is around 5 cases per 100.000 habi-tants [3]. MS is then considered an orphan disease with rel-evant challenges s.a. the difficulties to obtain a prompt yetprecise diagnosis, lack of information for patients and fami-lies, limited or expensive therapeutic options, etc.
It has been shown that regular therapy sessions on MS pa-tients has a positive impact on disability progression alongtime [4], normally requiring between 1 to 4 interventions perweek depending on the current patient condition. However, itis usually accepted that as MS progresses, sessions becomelonger and more frequent, turning the rehabilitation processinto an exhausting procedure affecting the patient adherence,which compromises its own impact. So, medical communityis adopting technological tools to support both diagnosis andtherapeutic intervention, integrating Natural User Interfaces(NUI) –e.g. Kinect– into the rehabilitation pathway.
The design and adjustment of therapeutic pathways re-quire the adoption of a reliable set of anthropometric andbiomechanical descriptors allowing the clinical staff to pro-vide a correct diagnosis and to determine the current stateof a specific patient along the disease progression. Up todate, physiatrists and physical therapists use several indexesand scales to describe the patient performance specifically,for equilibrium and balance. Thus, It is usual to find imple-mentations built upon the Tinneti Scale, the Timed ”Up-and-Go” or the Berg Balance Scale (BBS [5]). Such descriptorshave been validated and adopted as standard clinical proce-dures,but their design involves subjective ordinal scores makethem prone to a high inter-specialist variability and lack ofprecision and detail to support medical decisions.
This work presents a low-cost computer-vision basedframework using the Kinect©sensor designed to acquire –inreal-time– angular measures for mediolateral balance and an-teroposterior balance during the execution of a subset of bal-ance tests from the BBS. This system is intended to providean objective description of the patient performance for eachtest and, then, evaluate its reliability according to its corre-spondence to the evaluation carried out by an expert (physio-therapist) using the BBS standard protocol.
Evaluation of computer vision based objective measures for complementary balance function description and assessment in Multiple Sclerosis
© Springer Nature Singapore Pte Ltd. 2017 377I. Torres et al. (eds.), VII Latin American Congress on Biomedical Engineering CLAIB 2016, Bucaramanga, Santander, Colombia, October 26th -28th, 2016, IFMBE Proceedings 60, DOI: 10.1007/978-981-10-4086-3_95
German D. Sosa1, Juanita Sanchez2, Xiomary Bermudez3, Angelica Ramırez1 and Hugo Franco1
1 Universidad Central, 110311 Bogota, D.C. Colombia2 Universidad del Rosario, Facultad de Ciencias de la Salud, 111221 Bogota, D.C., Colombia
3 Fundacion para la Esclerosis Mutltiple (FUNDEM), 111221 Bogota, D.C., Colombia

Postural Control Assessment in MultipleSclerosis by Diffusion Analysis on Kinect
Skeleton Data
German D. Sosa1, Albert Montenegro1, Juanita Sanchez3,Xiomary Bermudez2, Angelica Ramırez1, and Hugo Franco1(B)
1 Universidad Central, 110311 Bogota, [email protected]
2 Fundacion para la Esclerosis Mutltiple (FUNDEM), Bogota, Colombia3 Facultad de Ciencias de la Salud, Universidad Manuela Beltran,
111221 Bogota, Colombia
Abstract. Multiple Sclerosis (MS) is a central nervous system diseasewidely known for being a non-reversible degeneration process that affectsyoung adults as well as elder people. Such disease affects the equilib-rium function of the postural control system required to perform vitaltasks such as walking or hold upright position. To palliate the long-termeffects associated to MS, physicians perform therapeutic interventionson patients in order to preserve their motor capabilities as best as pos-sible. In order to evaluate the effectiveness of therapeutic interventions,representative measurements or scores are used to assess the actual stateof each patient. This work presents an exploratory approach to providequantitative mediolateral and anteroposterior balance descriptors in MSthrough Diffusion Analysis on balance data acquired with a low-costcomputational system using a Kinect device. The obtained results werecompared against a subset of exercises of the Berg Balance Scale.
Keywords: Multiple Sclerosis · Postural control · Kinect · Balance ·Diffusion analysis
1 Introduction
Multiple Sclerosis (MS) is an autoimmune inflammatory disease of the CentralNervous System (CNS) caused by the presence of focal areas of inflammatorydemyelination of the white matter in the brain and spinal chord [1], described asan autonomous neurodegenerative process, similar to that observed in Alzheimerthat causes irreversible neural damage [2]. Some of the most common symptomsof MS are cognitive impairment as well as hypoesthesia and spasticity of mus-cles [3], producing a disorder of the postural control system (PCS) equilibriumfunctions, required to perform walking or even hold upright position [4]. Due toits irreversible nature, most of patients with MS have no full recovery of theirsymptoms, while they tend to increase over lifetime.
c© Springer International Publishing AG 2017J.C. Figueroa-Garcıa et al. (Eds.): WEA 2017, CCIS 742, pp. 625–637, 2017.DOI: 10.1007/978-3-319-66963-2 55