regional strategic safety plan summary...
TRANSCRIPT

REGIONAL STRATEGIC SAFETY PLAN Summary Report
North Florida Transportation Planning Organization 1022 Prudential Drive
Jacksonville, FL 32207
December 2012
North Florida TPO Regional Strategic Safety Plan
Summary Report
Executive Summary Investments in safety improvements will save lives, time and money. Traffic crashes unnecessarily claim the lives of the residents of North Florida each year. More people die from traffic crashes each year than homicides. From 2005-2010 there were 1,288 fatalities from crashes versus 715 murders in the four-county metropolitan area. During that same time an additional 81,404 persons were injured in vehicle crashes. Based on data provided by the Texas Transportation Institute, crashes cause 53 percent of all delays or 13 hours per resident each year in our region in lost economic productivity. The economic costs of all traffic crashes exceeded $5 billion annually in medical costs, lost productivity, travel delays, workplace costs, insurance costs, and legal costs. These economic losses are approximately 8 percent of the $60.3 billion gross domestic product of the metropolitan statistical area. These losses in lives and economic productivity negatively contribute to the region’s economic competitiveness and quality of life. This Strategic Safety Plan identifies priority locations (corridors and intersections) that were determined to be of the most significant concern for the safety of the drivers and vulnerable road users (bicyclists and pedestrians). These locations were identified based on the severity of the crashes using the economic cost of the crashes and the total frequency of crashes. The top 20 crash locations for several contributing causes were identified including: careless and aggressive driving, intersection crashes, lane departure crashes and impaired driving. The crash histories were also analyzed based on age for young drivers (15-20 years old) and mature drivers (65 years and older). The 20-highest ranked locations based on the severity of crashes included segments of, and intersections with, Blanding Boulevard (SR 21), 103rd Street/Timuquana Road (SR 134), I-295, Ricker Road, Harlow Boulevard, Firestone Road, Old Middleburg Road, Morse Avenue, Rampart Road, Normandy Boulevard (SR 228), Collins Road, Doctors Inlet (CR 220) and Russell Road (CR 209). When the total frequency of crashes was considered (without weighting for the severity of crashes), the following additional priority corridors and intersections were identified: US 90/SR 212 Beach Boulevard, SR 10 Atlantic Boulevard, SR 115 Southside Boulevard, JTB (SR 202) and University Boulevard (SR 109). Contributing factors that account for the heavy weighting of corridors in west Duval and northern Clay County are result of congestion levels, a high frequency of careless and aggressive driving, and the age of the roadways which were constructed with different engineering standards and access management criteria that exist today. Other potential contributing factors identified as part of this study where insufficient data was available to determine if they were statistically significant included an older vehicle fleet and the lower use of seatbelts which contributes to increased severity of crashes. Construction projects are currently planned on many of the highest ranked priority corridors and intersections support selecting these projects for early funding. Many of these projects include reconstruction, widening, resurfacing, signalization and access management improvements. Additional consideration of the need for safety improvements should be considered as part of these projects. The following goals were established to address safety in the planning process of the North Florida TPO 5 percent reduction in fatal and injury crashes 5 percent reduction in the crash rate Advance safety funding for projects on priority corridors and intersections
Specific strategies and tactics were identified to support these goals including education, enforcement, engineering and emergency management. For example, several of the priority intersections identified are candidates for red-light cameras by the Jacksonville Sherriff’s Office. Additional benefits evaluations (before and after studies) of these programs are needed to consider the effectiveness of the strategies and to monitor progress toward achieving these goals. Increased emphasis on safety as part of the planning and selection of projects is needed. Specifically, many safety improvements can be implemented with relatively lower costs and provide high benefit cost ratios. However, funding for these projects can take many years under the traditional planning process. Developing a flexible, reliable funding source so projects can be programmed on annual basis is recommended.
North Florida TPO Regional Strategic Safety Plan
Summary Report i
Table of Contents Table of Contents ........................................................................................................................................................... i List of Appendices .......................................................................................................................................................... i List of Figures ................................................................................................................................................................. i List of Tables .................................................................................................................................................................. i 1. Introduction ............................................................................................................................................................... 1 1.1 Background ...................................................................................................................................................... 1 1.2 Purpose ............................................................................................................................................................ 1 1.3 Study Area ........................................................................................................................................................ 1 2. Goals, Objectives and Strategies ............................................................................................................................... 3 3. Crash Analysis Summary ........................................................................................................................................... 8 4. Contributing Factors .................................................................................................................................................. 9 5. High Priority Corridors and Intersections .................................................................................................................. 9 6. Summary .................................................................................................................................................................. 18
List of Appendices Appendix A – Data Collection and Analysis Report Appendix B – Crash Data Summary – Florida State Highway System and Local Roadway Crashes Appendix C – Crash Severity Maps for Issues Appendix D – Crash Hot-Spot and Cold-Spot Location for Issues – Weighting Scheme 1 Appendix E – Crash Hot-Spot and Cold-Spot Location for Issues – Weighting Scheme 2 Appendix F – Crash Hot-Spot Temperature Charts for Issues – Weighting Scheme 1 Appendix G – Crash Hot-Spot Temperature Charts for Issues – Weighting Scheme 2 Appendix H – Field Review Notes
List of Figures Figure 1: North Florida TPO Regional Boundary Map ................................................................................................... 2 Figure 2: High Priority Corridors (Hot-Spot and Frequency Analysis) ......................................................................... 16 Figure 3: High Priority Intersections (Hot-Spot and Frequency Analysis) ................................................................... 17
List of Tables Table 1:Objectives, Strategies, Performace Measures and Benchmarks ..................................................................... 4 Table 2: Regional Crash Severity, Costs, and Rates ...................................................................................................... 8 Table 3: Significant Contributing Factors for Crashes ................................................................................................... 9 Table 4: Distracted Driving Contributing Factors .......................................................................................................... 9 Table 5: Priority Corridors Based on Hot-Spot Crash Analysis .................................................................................... 10 Table 6: Priority Intersections Based on Hot-Spot Crash Analysis .............................................................................. 12 Table 7: Priority Corridors Based on Crash Frequency ............................................................................................... 13 Table 8: Priority Intersections Based on Crash Frequency ......................................................................................... 14

North Florida TPO Regional Strategic Safety Plan
Summary Report 1
1. Introduction
1.1 Background Traffic crashes unnecessarily claim the lives of North Florida residents each year. More people die from traffic crashes each year than homicides. From 2005-2010 there were 1,288 fatalities resulted from crashes versus 715 murders in the four-county metropolitan area. During that same time an additional 81,404 persons were injured in vehicle crashes. Based on data provided by the Texas Transportation Institute, crashes cause 53 percent of all delays or 13 hours per resident each year in our region in lost economic productivity. The economic costs of all traffic crashes exceeded $5 billion annually in medical costs, lost productivity, travel delays, workplace costs, insurance costs, and legal costs. These economic losses are approximately 8 percent of the $60.3 billion gross domestic product of the metropolitan statistical area. These losses in lives and economic productivity negatively contribute to the region’s economic competitiveness and quality of life.
1.2 Purpose This project is to develop a regional safety plan for the North Florida Transportation Planning Organization (TPO) planning boundaries. The regional safety plan aligns strategies, objectives and prioritizes safety investments within the region to ensure resources are dedicated to reducing fatalities and injuries within the North Florida metropolitan area.
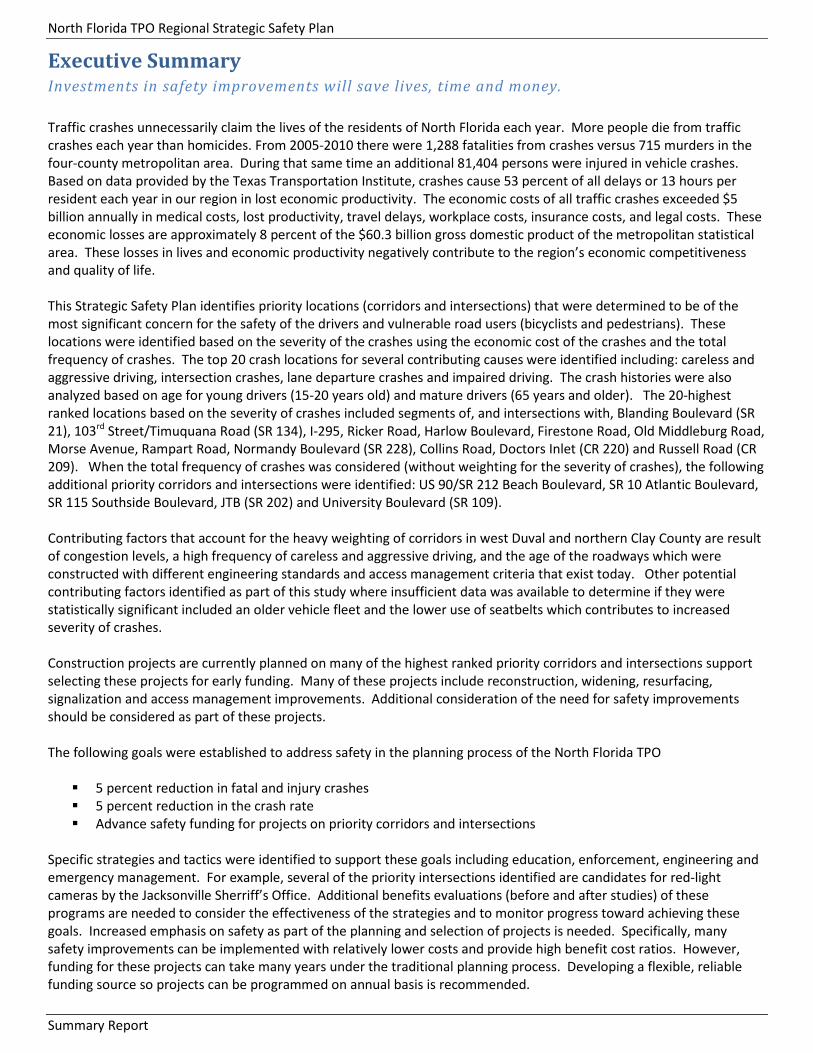
1.3 Study Area The North Florida TPO planning boundary incorporates Duval, St. Johns, Clay, and Nassau counties. The crash data analysis was performed for the entire North Florida region. Figure 1 shows the North Florida TPO regional boundary map.
0 2 41 Miles
North Florida TPO Regional Boundary Map
±LEGEND
North Florida TPO BoundaryMajor RoadsWater Bodies
County BoundariesClayDuvalNassauSt. JohnsOther Counties
NASSAU
DUVAL
CLAY
ST. JOHNS
Figure 1
Page 2
North Florida TPO Regional Strategic Safety Plan
Summary Report 3
2. Goals, Objectives and Strategies The following goals were established as part of this strategic safety plan: Reduce the crash rate and the number of severe crashes (fatal or injury) by 5 percent in the North Florida region
by the year 2020 Identify priority corridors and intersection where safety is a significant concern. Recommend strategies for funding safety related projects.
Table 1 provides a summary of the specific strategies organized in the areas of education, enforcement, emergency response and engineering. The current status in implementing these strategies and tactics is also included in the table.

North Florida TPO Regional Strategic Safety Plan
Summary Report 4
Table 1: Objectives, Strategies, Performance Measures and Benchmarks Area for Improvement
Objective Strategy Performance Measure
and Benchmark Current Status
Education
Enhance driver awareness and behavior
• Implement three strategic and targeted education programs in the next five years. Argyle area aggressive driving Distracted driving for younger drivers Safety for vulnerable road users in targeted
areas
5% reduction in crash rate by 2020. The Argyle Area Aggressive Driving Campaign (CareMore) is underway.
Enhance education for incident responders
• Promote and expand use of the Time4Safety program.
Increase in the number of first responders who have participated in Time4Safety Training or National Traffic Incident Management Training by 10% by 2015.
Time4Safety is being taught at the Florida law enforcement and fire/rescue academies and as part of the NTIMC training courses.
Improve the content of driver education courses
• Add information on the risks of distraction and make information relevant to teens available through print media to capture teen’s attention.
• Communicate consequences of poor driving choices.
• Implement innovative programs based on safety data.
• Increase the use of peer education programs.
Reduce teen and distracted crash rate within the North Florida region by 5% by 2020.
North Florida TPO web site for safety shall be enhanced to provide this information. Recommend working with stakeholders to design and implement an education campaign.
Education on the use of helmet
• Promote helmet us for the vulnerable roadway user groups and potentially conduct education and public information bulletin on helmet use.
Reduce the vulnerable roadway users’ fatal crash rate by 5% by 2020.
Several education and safety programs are on-going with the North Florida Bicycle Club.
Enforcement Reduce red-light running
• Assess priority locations and deploy at high crash frequency locations. Red-light running cameras Confirmation signals
Reduce the red light running crash rate by 5% by 2020.
Working with law enforcement to target specific locations for enforcement and to prioritize red light running locations.
• Conduct before and after studies to assess the effectiveness of red light running and confirmation signals.
Determine the effectiveness of the strategies implemented by conducting three before and after studies by 2015.
The Jacksonville Sherriff’s office is planning to install red light running cameras in 2012.
North Florida TPO Regional Strategic Safety Plan
Summary Report 5
Area for Improvement
Objective Strategy Performance Measure
and Benchmark Current Status
Enforcement
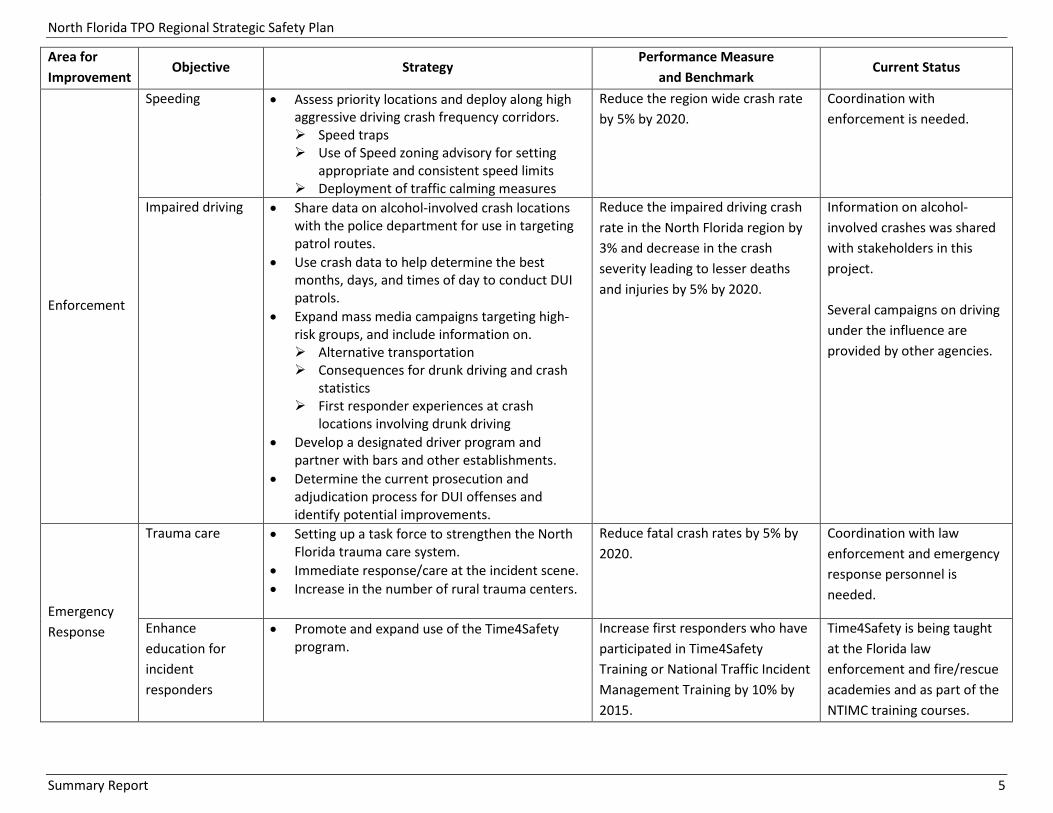
Speeding • Assess priority locations and deploy along high aggressive driving crash frequency corridors. Speed traps Use of Speed zoning advisory for setting
appropriate and consistent speed limits Deployment of traffic calming measures
Reduce the region wide crash rate by 5% by 2020.
Coordination with enforcement is needed.
Impaired driving • Share data on alcohol-involved crash locations with the police department for use in targeting patrol routes.
• Use crash data to help determine the best months, days, and times of day to conduct DUI patrols.
• Expand mass media campaigns targeting high-risk groups, and include information on. Alternative transportation Consequences for drunk driving and crash
statistics First responder experiences at crash
locations involving drunk driving • Develop a designated driver program and
partner with bars and other establishments. • Determine the current prosecution and
adjudication process for DUI offenses and identify potential improvements.
Reduce the impaired driving crash rate in the North Florida region by 3% and decrease in the crash severity leading to lesser deaths and injuries by 5% by 2020.
Information on alcohol-involved crashes was shared with stakeholders in this project. Several campaigns on driving under the influence are provided by other agencies.
Emergency Response
Trauma care • Setting up a task force to strengthen the North Florida trauma care system.
• Immediate response/care at the incident scene. • Increase in the number of rural trauma centers.
Reduce fatal crash rates by 5% by 2020.
Coordination with law enforcement and emergency response personnel is needed.
Enhance education for incident responders
• Promote and expand use of the Time4Safety program.
Increase first responders who have participated in Time4Safety Training or National Traffic Incident Management Training by 10% by 2015.
Time4Safety is being taught at the Florida law enforcement and fire/rescue academies and as part of the NTIMC training courses.

North Florida TPO Regional Strategic Safety Plan
Summary Report 6
Area for Improvement
Objective Strategy Performance Measure
and Benchmark Current Status
Engineering
Roadway design • Apply design principles, if adhered to, are intended to provide a safe highway design.
• Convey the importance of roadway safety factors for design teams during the design phase of a project to achieve a safe highway design.
Reduce the region wide crash rate by 5% by 2020.
FDOT and local agencies are active in focusing on safety related improvements.
Access management
• Improved the access management along the priority corridors identified.
• Follow the FDOT access management standards for new or on-going roadway design projects.
Reduce the region wide or lane departure crash rate by 5% by 2020.
FDOT and local agencies are active in focusing on safety related improvements.
Speed limits • Assess priority locations and deploy along high aggressive driving crash frequency corridors. Use of Speed zoning advisory for setting
appropriate and consistent speed limits. Deployment of traffic calming measures
Reduce the region wide crash rate by 5% by 2020.
Coordination with FDOT Traffic Operations is needed.
Other mode conflicts
• Provide for multimodal provision on new or existing on-going roadway projects.
• Improve existing sidewalks and build new sidewalks in the priority locations for better pedestrian access.
• Provide designated bike-lanes along roadways within the North Florida TPO region.
Reduce the region wide or vulnerable road users crash rate by 5% by 2020.
Current activities are underway through Safety Studies with FDOT.
Sight distance • Provide enhanced sight distance along high crash frequency corridors. Remove obstructions within the sight
triangles Provide adequate sight distance along rural
highways for safe passing of vehicles
Reduce the region wide or lane departure crash rate by 5% by 2020.
FDOT and local agencies are active in focusing on safety related improvements.
Pavement markings
• Provide enhanced pavement markings along high crash frequency corridors. Provide or replace worn reflective pavement
markers Provide shoulder rumble strips to alert
traffic
Reduce the region wide or lane departure crash rate by 5% by 2020.
FDOT and local agencies are active in focusing on safety related improvements.
Clearance intervals
• Provide adequate clearance intervals for intersections following the FDOT’s Traffic Engineering Manual procedure.
Reduce the region wide or intersection crash rate by 5% by 2020.
FDOT and local agencies are active in focusing on safety related improvements.

North Florida TPO Regional Strategic Safety Plan
Summary Report 7
Area for Improvement
Objective Strategy Performance Measure
and Benchmark Current Status
Engineering
Permitted to protected turns
• Convert the existing permitted turn movements into protected turn movements at the priority locations based on justification procedure prescribed by ITE’s Traffic Engineering Handbook, Page 295.
Reduce in the region wide or intersection crash rate by 5% by 2020.
FDOT and local agencies are active in focusing on safety related improvements.
Other
Enhance the quality and reliability of crash data
• Provide enhanced technology to improve the accuracy of data.
• Integrate crash data with the roadway geometric data to provide a better understanding of the nature of the crash.
• Aid in the development of safety improvements that accurately address the regions safety problems.
Implement improved data collection and reporting with FHP & FDLE by 2015.
Continued efforts are on-going for law enforcement and other agencies to enhance crash data collection.
Continued coordinate between safety stakeholder groups
• Improve communication among the enforcement, engineering and driver education communities.
• Increase public education on proper driving skills.
• Identify effective strategies to improve roadway safety.
Participation of safety personnel in North Florida TPO TAC.
Representatives of FDOT Planning are currently involved.

North Florida TPO Regional Strategic Safety Plan
Summary Report 8
3. Crash Analysis Summary As part of developing the regional safety plan, a Data Collection and Analysis Report was prepared for the North Florida TPO. The Data Collection and Analysis Report presents a detailed summary of the crash data. It also identifies regional safety issues and locates priority corridors and intersections with safety problems. The crash data was obtained from the Florida Department of Transportation (FDOT) Safety Office. The crash data provided was for six years from 2005 to 2010 and includes the Florida State Highway System (SHS) and local roadways. This Summary Report summarizes the analysis and findings from the Data Collection and Analysis Report, provides a list of priority corridors and intersections for safety funding and recommends a strategic plan for implementation by the North Florida TPO. A total of 110,497 crashes occurred in the last six years (2005-2010). Of these crashes: 71,668 crashes occurred on the State Highway System 38,829 crashes occurred on the local roadways
These crashes involved: 1,173 fatal crashes 52,915 injury crashes 56,409 property damage only (PDO) crashes
The economic cost of these crashes was estimated to be $20 billion or an average of $3.33 billion per year. Approximately $13.7 billion (or 68.5%) of the costs occurred on the State Highway System and $6.3 billion (or 31.5%) occurred on the local roadways.1
Table 2 provides a summary of the results from the crash data analysis. The average crash rate on highways in the North Florida TPO planning area is less than the Florida statewide average. The total number of crashes, economic value of the crashes and the crash rates (crashes per million vehicle miles traveled) declined for the last six years from 1.26 in 2005 to 1.10 in 2010. However, safety continues to be a significant issue within North Florida based on the number of lives lost, number of injuries and the social costs of crashes.
Table 2: Regional Crash Severity, Costs, and Rates
Year PDO Injury Fatality Total
Crashes Crash Cost
(in millions)
Vehicle Miles Traveled (VMT)
(in 1,000) Crash Rate
2005 10,039 9,315 222 19,576 $ 3,621.99 42,429 1.26 2006 9,553 9,265 198 19,016 $ 3,454.22 44,142 1.18 2007 9,965 9,179 242 19,386 $ 3,717.86 44,107 1.20 2008 9,150 8,568 191 17,909 $ 3,246.78 42,514 1.15 2009 9,005 8,601 165 17,771 $ 3,087.55 42,129 1.16 2010 8,697 7,987 155 16,839 $ 2,880.66 42,036 1.10 Total 56,409 52,915 1,173 110,497 $ 20,009.06 257,357 1.18
Source: HNTB 1 The total economic cost of these crashes was estimated based on the crash severity type - such as property damage only (PDO), injury, and fatality. The individual costs of each crash severity type according to the FDOT’s Roadside Safety Analysis program are shown below:
1. Fatal crash cost: $6,380,000 2. Injury crash cost (average of all injury types): $229,777 3. PDO crash cost: $6,500
North Florida TPO Regional Strategic Safety Plan
Summary Report 9
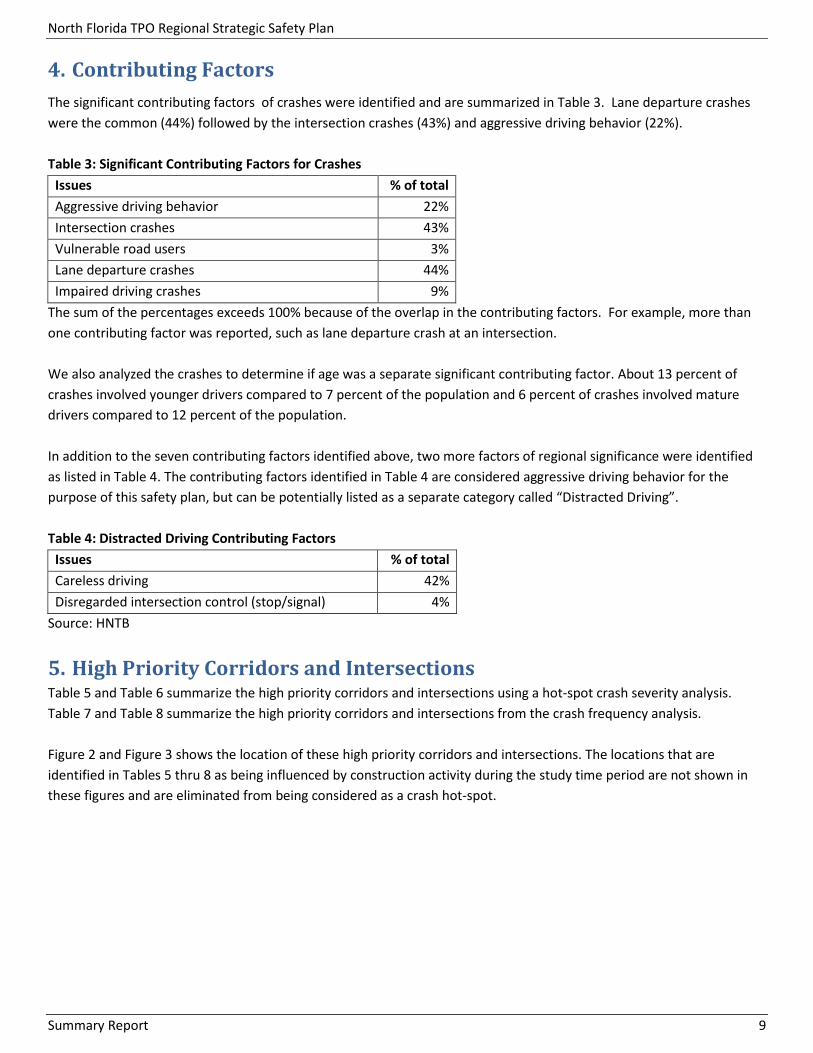
4. Contributing Factors The significant contributing factors of crashes were identified and are summarized in Table 3. Lane departure crashes were the common (44%) followed by the intersection crashes (43%) and aggressive driving behavior (22%). Table 3: Significant Contributing Factors for Crashes
Issues % of total Aggressive driving behavior 22% Intersection crashes 43% Vulnerable road users 3% Lane departure crashes 44% Impaired driving crashes 9%
The sum of the percentages exceeds 100% because of the overlap in the contributing factors. For example, more than one contributing factor was reported, such as lane departure crash at an intersection. We also analyzed the crashes to determine if age was a separate significant contributing factor. About 13 percent of crashes involved younger drivers compared to 7 percent of the population and 6 percent of crashes involved mature drivers compared to 12 percent of the population. In addition to the seven contributing factors identified above, two more factors of regional significance were identified as listed in Table 4. The contributing factors identified in Table 4 are considered aggressive driving behavior for the purpose of this safety plan, but can be potentially listed as a separate category called “Distracted Driving”. Table 4: Distracted Driving Contributing Factors
Issues % of total Careless driving 42% Disregarded intersection control (stop/signal) 4%
Source: HNTB
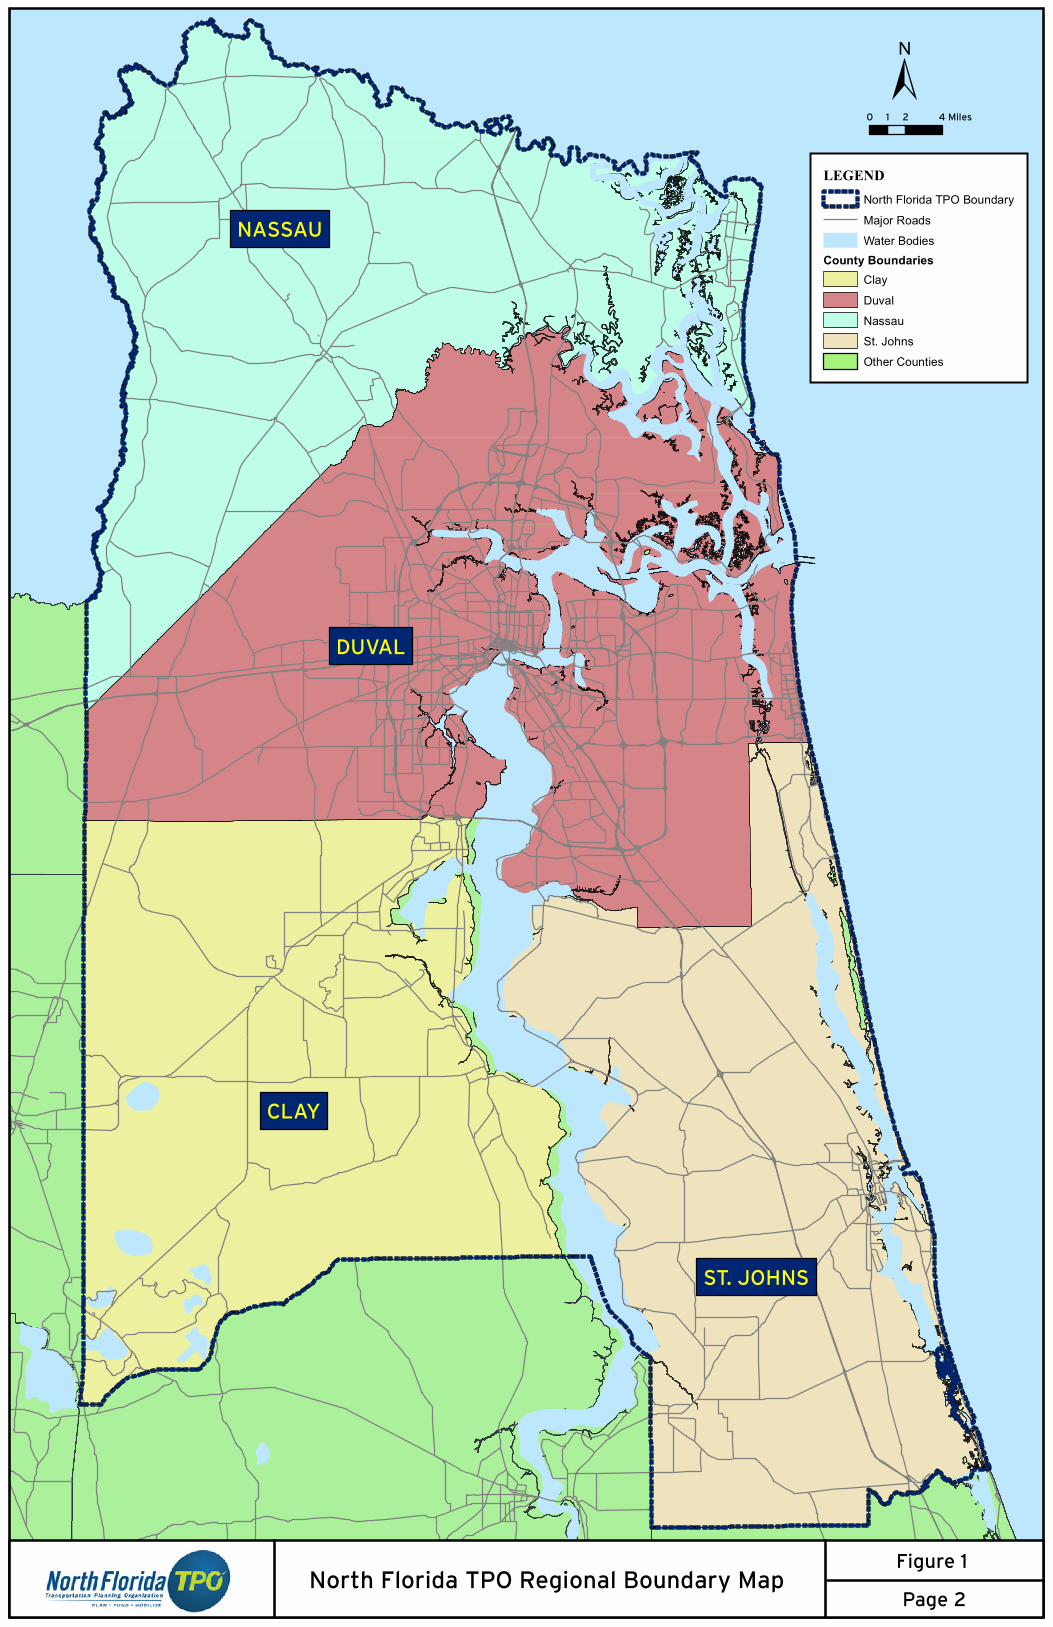
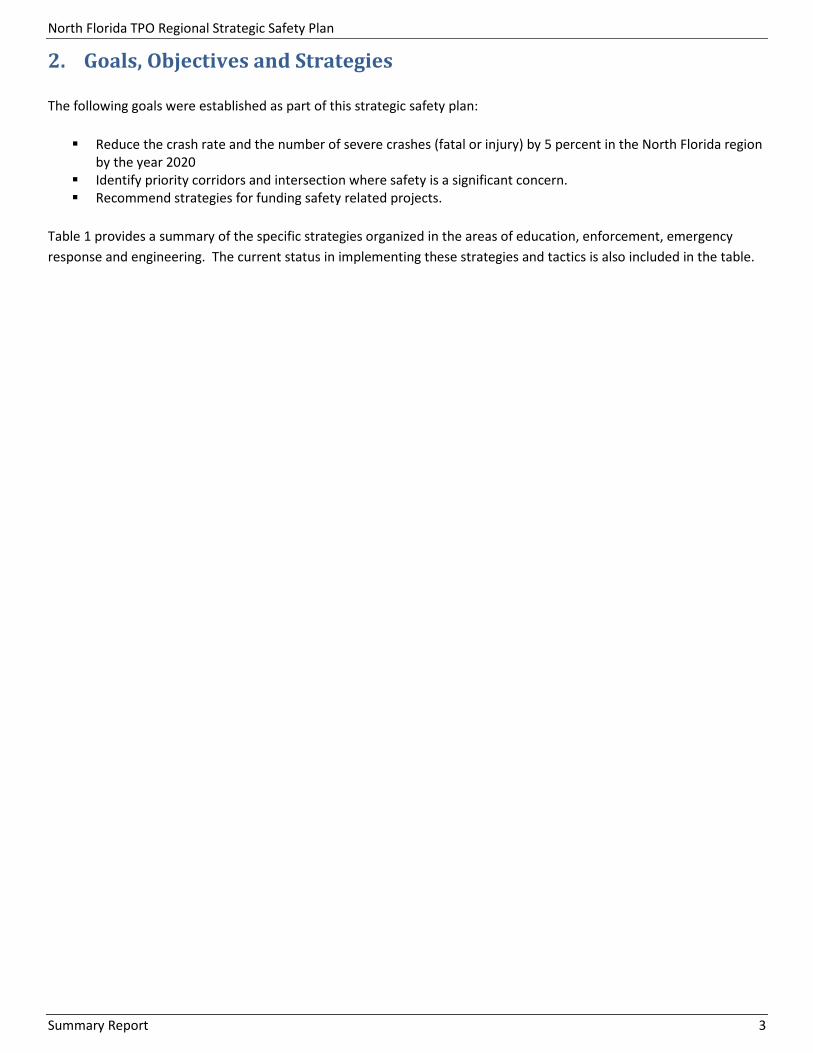
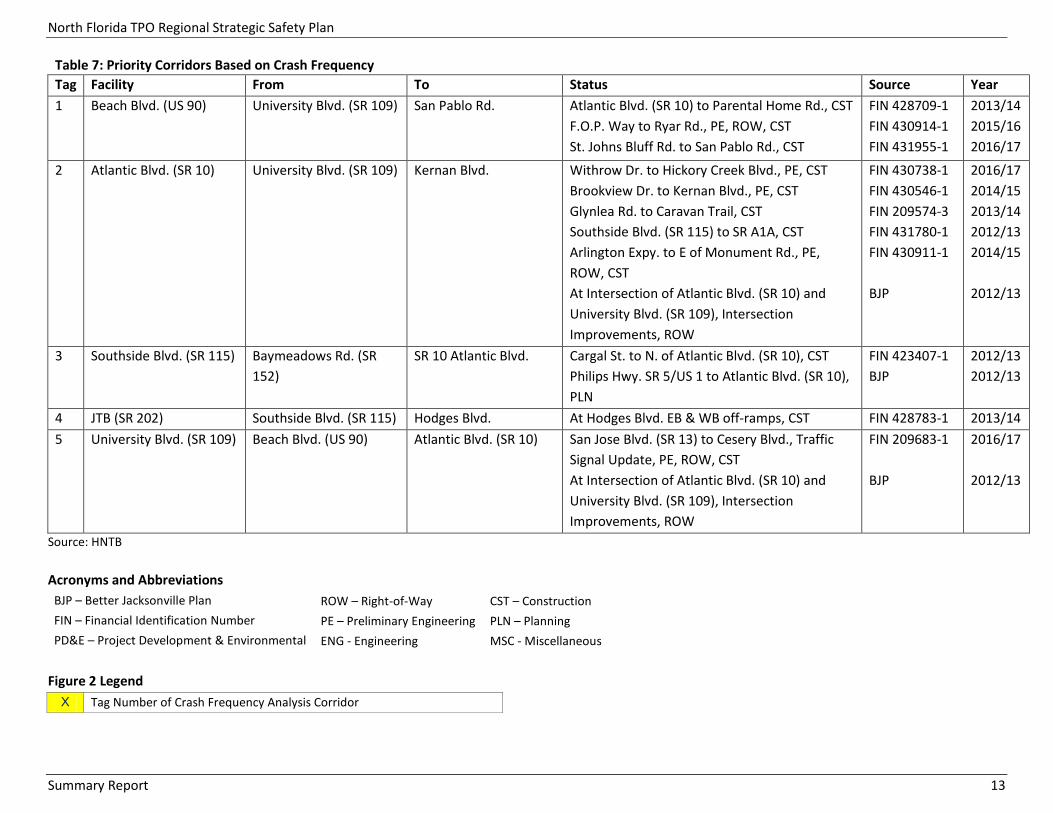
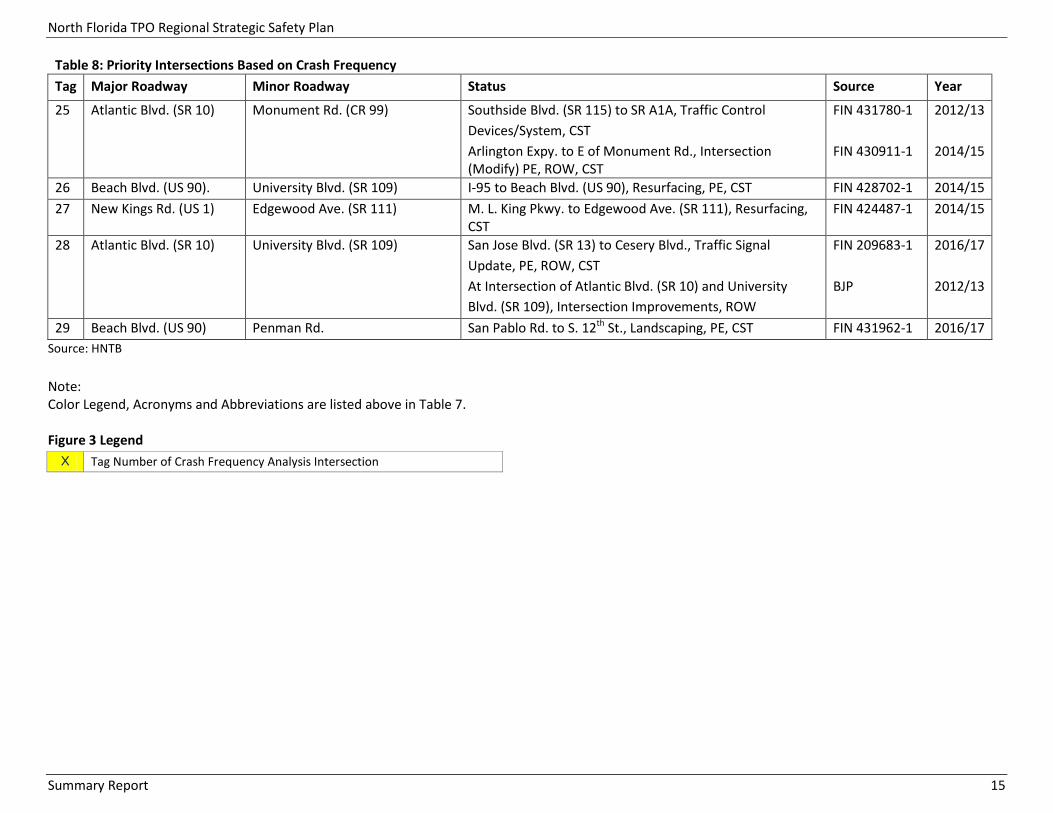
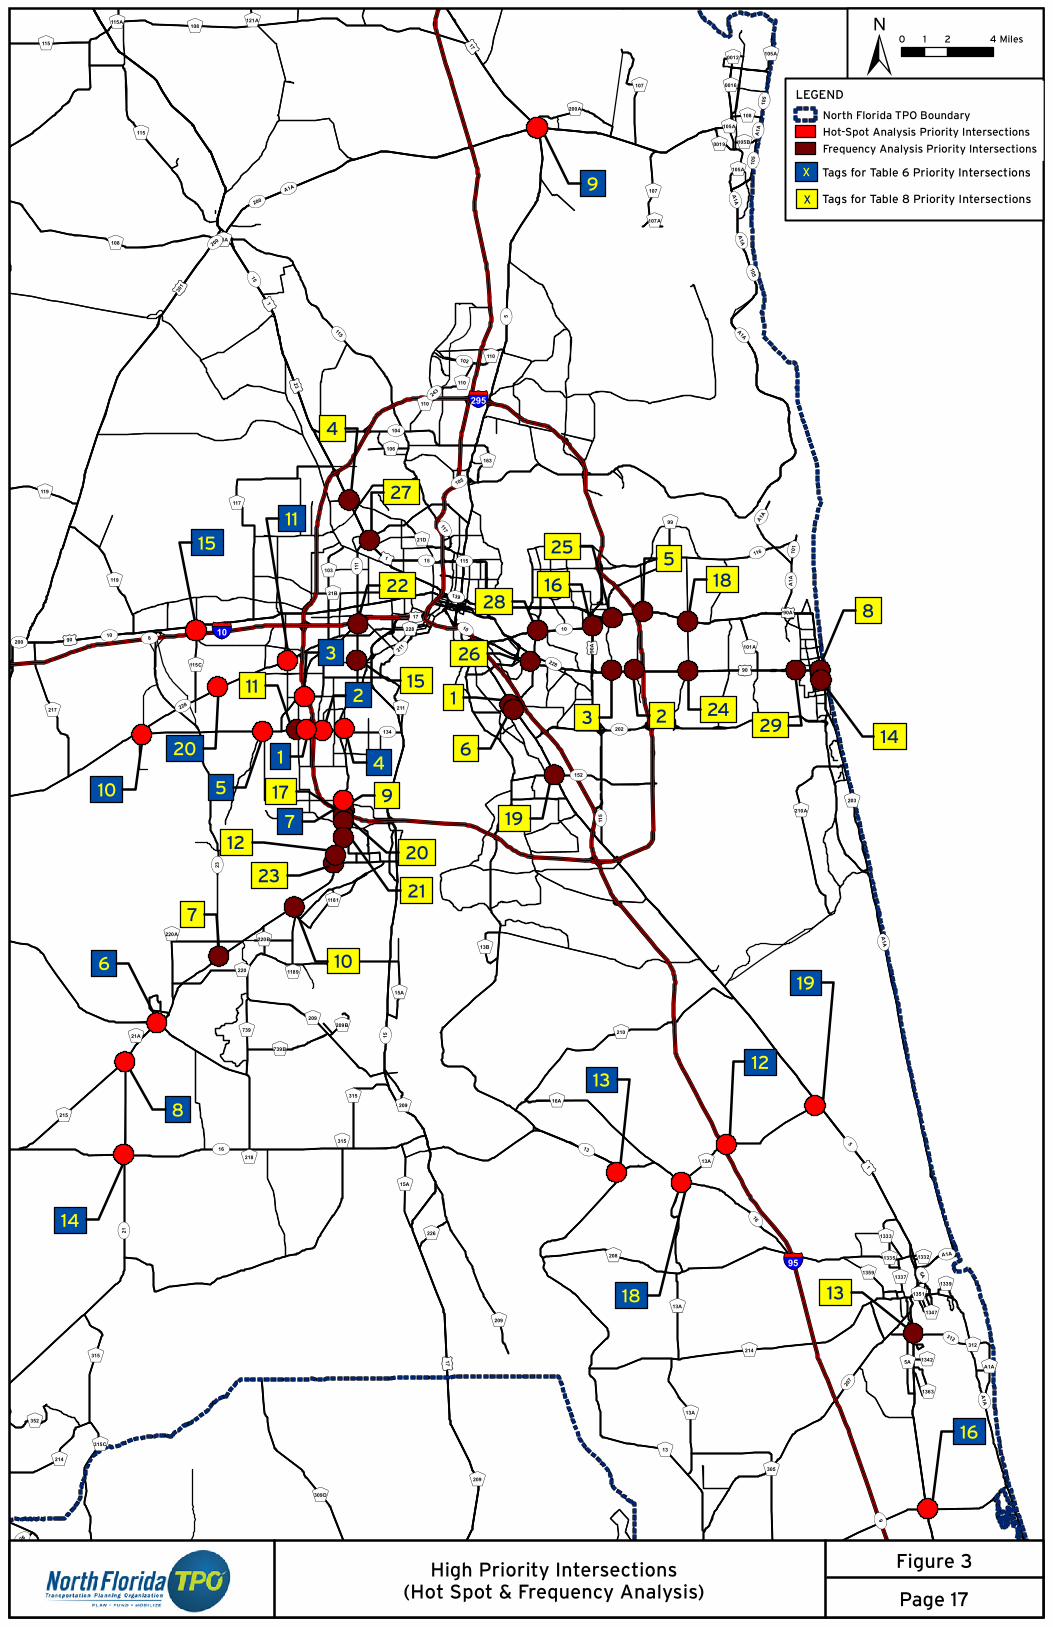
5. High Priority Corridors and Intersections Table 5 and Table 6 summarize the high priority corridors and intersections using a hot-spot crash severity analysis. Table 7 and Table 8 summarize the high priority corridors and intersections from the crash frequency analysis. Figure 2 and Figure 3 shows the location of these high priority corridors and intersections. The locations that are identified in Tables 5 thru 8 as being influenced by construction activity during the study time period are not shown in these figures and are eliminated from being considered as a crash hot-spot.

North Florida TPO Regional Strategic Safety Plan
Summary Report 10
Table 5: Priority Corridors Based on Hot-Spot Crash Analysis Tag Facility From To Status Source Year 1 Wilson Blvd. (SR 208) Fouraker Rd. Lane Ave. (SR 103) Construction complete BJP 2 Blanding Blvd. SR 21 Argyle Forest Blvd. US 17 Roosevelt Blvd. Intersection Improvements at Collins Rd., SR
134 103rd Street and Cedar Hills Blvd. ENG and ROW
BJP 2013/14
3 103rd St. (SR 134) Normandy Blvd. (SR 228) Wesconnett Blvd. Daniel Terrace to Cardan Rd. in PE, CST Old Middleburg Rd. to Wesconnett Blvd. CST
FIN 209692-5 FIN 430067-1
2011/12 2012/13
4 I-295/SR 9A Old St Augustine Rd. SR 228 Normandy Blvd. Wilson Blvd. Interchange CST Morse Ave. to I-10 Drainage Improvements CST Dunn Ave. Interchange CST
FIN 429751-2 FIN 213251-4 FIN 429751-1
2013/14 2013/14 2013/14
5 Ricker Rd. Old Middleburg Rd. 103rd St. (SR 134) to BFCR (SR 23) ROW BJP 2015/16 6 Harlow Blvd. 103rd St. (SR 134) Blanding Blvd. (SR 21) 7 Firestone Rd. Morse Ave. Wilson Blvd. (SR 208) 8 Old Middleburg Rd. 103rd St. (SR 134) Lane Ave. (SR 103) 103rd St. (SR 134) to BFCR (SR 23) ROW BJP 2014/15 9 Blanding Blvd. (SR 21) Old Jennings Rd. Argyle Forest Blvd. Hall-Boree intersection CST
Resurface Knight Boxx Rd. to Kingsley Ave. CST CR 218 to Long Bay Rd. Add Lanes PE
FIN 208130-2 FIN 428698-1 FIN 208211-5
2011/12 2013/14 2011/12
10 I-295/SR 9A Normandy Blvd. (SR 228) Lem Turner Rd. (SR 115) Normandy Blvd. Interchange CST I-10 to I-95 North ITS CST I-10 to Commonwealth Ave. ROW Pritchard Rd. Interchange CST Commonwealth Ave. to Trout River 3R CST Dunn Ave. Interchange CST
FIN 427204-1 FIN 213238-4 FIN 213259-1 FIN 416953-2 FIN 426983-1 FIN 429751-1
2013/14 2011/12 2013/14 2011/12 2012/13 2013/14
11 Morse Ave. Ricker Rd. Jammes Rd. Construction planned, not funded BJP 12 Rampart Rd. Argyle Forest Blvd. Park City Dr. Construction planned, not funded BJP 13 Normandy Blvd. (SR 228) Chaffee Rd. I-295 I-295 Southbound interchange CST FIN 427204-1 2013/14 14 Collins Rd. Schindler Dr. Rampart Rd. Schindler Dr. to Westport Rd. CST
Westport Rd. to Rampart Rd. CST BJP BJP
2014/15 2014/15
15 SR 228 Normandy Blvd. I-295 Cassat Ave. (SR 111) I-295 Southbound interchange CST Cassat Ave. Transit Enhancements CST
FIN 427204-1 FIN 421698-2
2013/14 2011/12
16 Doctors Inlet Rd. (CR 220) Blanding Blvd. (SR 21) College Dr. (CR 224) SR 21 Blanding Blvd. Intersection ROW FIN 208211-3 2011/12 17 Wesconnett Blvd. Blanding Blvd. (SR 21) Blanding Blvd. (SR 21) Construction complete
North Florida TPO Regional Strategic Safety Plan
Summary Report 11
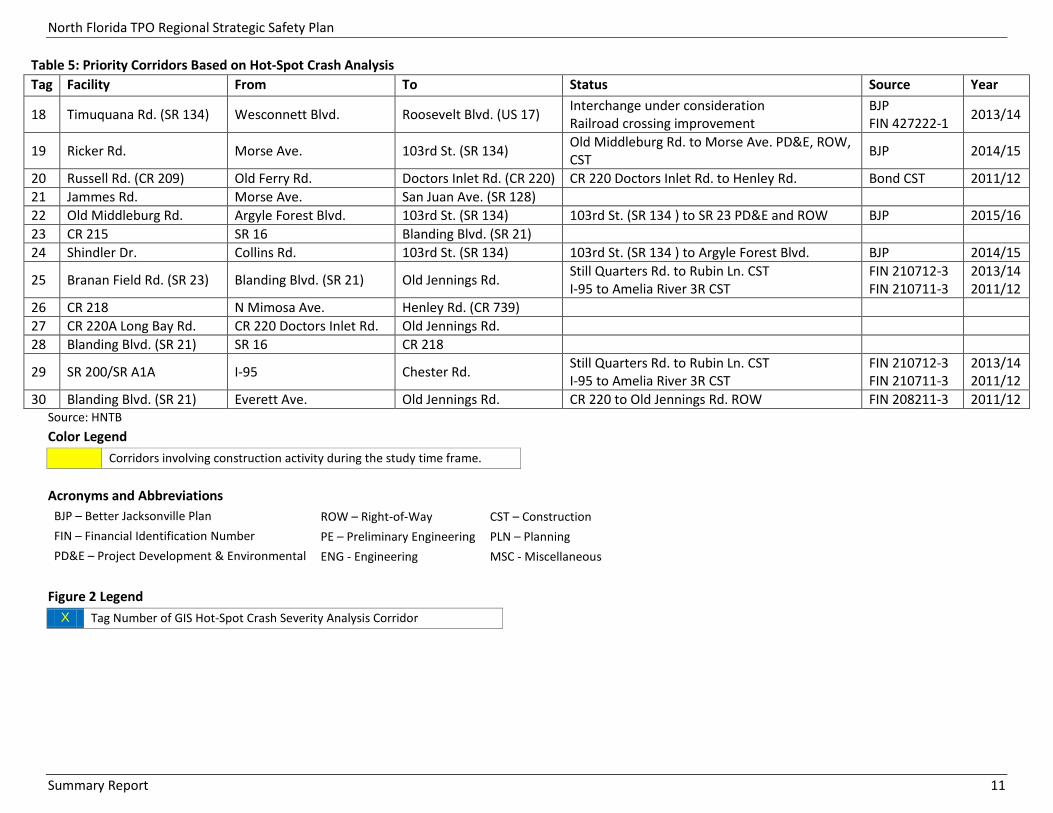
Table 5: Priority Corridors Based on Hot-Spot Crash Analysis Tag Facility From To Status Source Year
18 Timuquana Rd. (SR 134) Wesconnett Blvd. Roosevelt Blvd. (US 17) Interchange under consideration Railroad crossing improvement
BJP FIN 427222-1 2013/14
19 Ricker Rd. Morse Ave. 103rd St. (SR 134) Old Middleburg Rd. to Morse Ave. PD&E, ROW, CST BJP 2014/15
20 Russell Rd. (CR 209) Old Ferry Rd. Doctors Inlet Rd. (CR 220) CR 220 Doctors Inlet Rd. to Henley Rd. Bond CST 2011/12 21 Jammes Rd. Morse Ave. San Juan Ave. (SR 128) 22 Old Middleburg Rd. Argyle Forest Blvd. 103rd St. (SR 134) 103rd St. (SR 134 ) to SR 23 PD&E and ROW BJP 2015/16 23 CR 215 SR 16 Blanding Blvd. (SR 21) 24 Shindler Dr. Collins Rd. 103rd St. (SR 134) 103rd St. (SR 134 ) to Argyle Forest Blvd. BJP 2014/15
25 Branan Field Rd. (SR 23) Blanding Blvd. (SR 21) Old Jennings Rd. Still Quarters Rd. to Rubin Ln. CST I-95 to Amelia River 3R CST
FIN 210712-3 FIN 210711-3
2013/14 2011/12
26 CR 218 N Mimosa Ave. Henley Rd. (CR 739) 27 CR 220A Long Bay Rd. CR 220 Doctors Inlet Rd. Old Jennings Rd. 28 Blanding Blvd. (SR 21) SR 16 CR 218
29 SR 200/SR A1A I-95 Chester Rd. Still Quarters Rd. to Rubin Ln. CST I-95 to Amelia River 3R CST
FIN 210712-3 FIN 210711-3
2013/14 2011/12
30 Blanding Blvd. (SR 21) Everett Ave. Old Jennings Rd. CR 220 to Old Jennings Rd. ROW FIN 208211-3 2011/12 Source: HNTB Color Legend
Corridors involving construction activity during the study time frame. Acronyms and Abbreviations
BJP – Better Jacksonville Plan ROW – Right-of-Way CST – Construction FIN – Financial Identification Number PE – Preliminary Engineering PLN – Planning PD&E – Project Development & Environmental ENG - Engineering MSC - Miscellaneous
Figure 2 Legend
X Tag Number of GIS Hot-Spot Crash Severity Analysis Corridor
North Florida TPO Regional Strategic Safety Plan
Summary Report 12
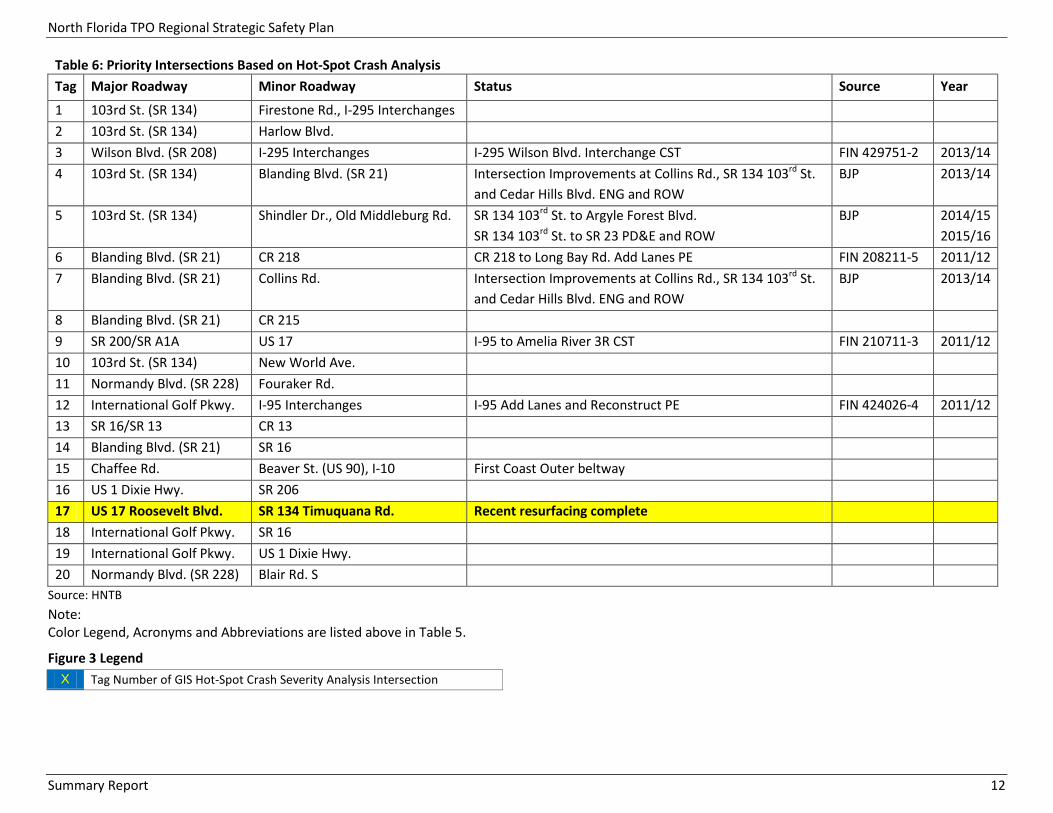
Table 6: Priority Intersections Based on Hot-Spot Crash Analysis Tag Major Roadway Minor Roadway Status Source Year
1 103rd St. (SR 134) Firestone Rd., I-295 Interchanges 2 103rd St. (SR 134) Harlow Blvd. 3 Wilson Blvd. (SR 208) I-295 Interchanges I-295 Wilson Blvd. Interchange CST FIN 429751-2 2013/14 4 103rd St. (SR 134) Blanding Blvd. (SR 21) Intersection Improvements at Collins Rd., SR 134 103rd St.
and Cedar Hills Blvd. ENG and ROW BJP 2013/14
5 103rd St. (SR 134) Shindler Dr., Old Middleburg Rd. SR 134 103rd St. to Argyle Forest Blvd. SR 134 103rd St. to SR 23 PD&E and ROW
BJP 2014/15 2015/16
6 Blanding Blvd. (SR 21) CR 218 CR 218 to Long Bay Rd. Add Lanes PE FIN 208211-5 2011/12 7 Blanding Blvd. (SR 21) Collins Rd. Intersection Improvements at Collins Rd., SR 134 103rd St.
and Cedar Hills Blvd. ENG and ROW BJP 2013/14
8 Blanding Blvd. (SR 21) CR 215 9 SR 200/SR A1A US 17 I-95 to Amelia River 3R CST FIN 210711-3 2011/12 10 103rd St. (SR 134) New World Ave. 11 Normandy Blvd. (SR 228) Fouraker Rd. 12 International Golf Pkwy. I-95 Interchanges I-95 Add Lanes and Reconstruct PE FIN 424026-4 2011/12 13 SR 16/SR 13 CR 13 14 Blanding Blvd. (SR 21) SR 16 15 Chaffee Rd. Beaver St. (US 90), I-10 First Coast Outer beltway 16 US 1 Dixie Hwy. SR 206 17 US 17 Roosevelt Blvd. SR 134 Timuquana Rd. Recent resurfacing complete 18 International Golf Pkwy. SR 16 19 International Golf Pkwy. US 1 Dixie Hwy. 20 Normandy Blvd. (SR 228) Blair Rd. S
Source: HNTB Note: Color Legend, Acronyms and Abbreviations are listed above in Table 5.
Figure 3 Legend X Tag Number of GIS Hot-Spot Crash Severity Analysis Intersection
North Florida TPO Regional Strategic Safety Plan
Summary Report 13
Table 7: Priority Corridors Based on Crash Frequency Tag Facility From To Status Source Year 1 Beach Blvd. (US 90) University Blvd. (SR 109) San Pablo Rd. Atlantic Blvd. (SR 10) to Parental Home Rd., CST
F.O.P. Way to Ryar Rd., PE, ROW, CST St. Johns Bluff Rd. to San Pablo Rd., CST
FIN 428709-1 FIN 430914-1 FIN 431955-1
2013/14 2015/16 2016/17
2 Atlantic Blvd. (SR 10) University Blvd. (SR 109) Kernan Blvd. Withrow Dr. to Hickory Creek Blvd., PE, CST Brookview Dr. to Kernan Blvd., PE, CST Glynlea Rd. to Caravan Trail, CST Southside Blvd. (SR 115) to SR A1A, CST Arlington Expy. to E of Monument Rd., PE, ROW, CST At Intersection of Atlantic Blvd. (SR 10) and University Blvd. (SR 109), Intersection Improvements, ROW
FIN 430738-1 FIN 430546-1 FIN 209574-3 FIN 431780-1 FIN 430911-1 BJP
2016/17 2014/15 2013/14 2012/13 2014/15 2012/13
3 Southside Blvd. (SR 115) Baymeadows Rd. (SR 152)
SR 10 Atlantic Blvd. Cargal St. to N. of Atlantic Blvd. (SR 10), CST Philips Hwy. SR 5/US 1 to Atlantic Blvd. (SR 10), PLN
FIN 423407-1 BJP
2012/13 2012/13
4 JTB (SR 202) Southside Blvd. (SR 115) Hodges Blvd. At Hodges Blvd. EB & WB off-ramps, CST FIN 428783-1 2013/14 5 University Blvd. (SR 109) Beach Blvd. (US 90) Atlantic Blvd. (SR 10) San Jose Blvd. (SR 13) to Cesery Blvd., Traffic
Signal Update, PE, ROW, CST At Intersection of Atlantic Blvd. (SR 10) and University Blvd. (SR 109), Intersection Improvements, ROW
FIN 209683-1 BJP
2016/17 2012/13
Source: HNTB Acronyms and Abbreviations
BJP – Better Jacksonville Plan ROW – Right-of-Way CST – Construction FIN – Financial Identification Number PE – Preliminary Engineering PLN – Planning PD&E – Project Development & Environmental ENG - Engineering MSC - Miscellaneous
Figure 2 Legend
X Tag Number of Crash Frequency Analysis Corridor

North Florida TPO Regional Strategic Safety Plan
Summary Report 14
Table 8: Priority Intersections Based on Crash Frequency Tag Major Roadway Minor Roadway Status Source Year
1 Philips Hwy. (SR 5/US 1) University Blvd. (SR 109) University Blvd. (SR 109 ) to I-95, Resurfacing, CST FIN 428706-1 2013/14 2 Beach Blvd. (US 90) St. Johns Bluff Rd. St. Johns Bluff Rd. to San Pablo Rd., Landscaping, CST FIN 431955-1 2016/17 3 Beach Blvd. (US 90) Forest Blvd. 4 New Kings Rd. (US 1) Moncrief Rd. 5 Atlantic Blvd. (SR 10) St. Johns Bluff Rd. Southside Blvd. (SR 115 ) to SR A1A, Traffic Control
Devices/System, CST FIN 431780-1 2012/13
6 Philips Hwy. (SR 5/US 1) Bowden Rd. 7 Blanding Blvd. (SR 21) Branan Field Rd. (SR 23) Blanding Blvd. (SR 21 ) to Duval C/L, New Road, PE, CST FIN 430565-1 2012/13 8 Beach Blvd. (US 90) 3rd St. (SR A1A) 34th Ave. to Atlantic Blvd. (SR 10), ITS System, CST FIN 430072-1 2013/14 9 Blanding Blvd. (SR 21) I-295 NB Off Ramp 10 Blanding Blvd. (SR 21) College Dr. (CR 224) Knight Boxx Rd. to Kingsley Ave., Resurfacing, CST FIN 428698-1 2016/17 11 103rd St. (SR 134) Ricker Rd. Old Middleburg Rd. to Wesconnett Blvd., CST FIN 430067-1 2012/13 12 Blanding Blvd. (SR 21) Arora Blvd. 13 Dixie Hwy. (US 1) SR 312 14 3rd St. S (SR A1A) 2nd Ave. S 34th Ave. to Atlantic Blvd. (SR 10), ITS System, CST FIN 430072-1 2013/14 15 Cassat Ave. (SR 111) Park St. Blanding Blvd. (SR 21) to Edgewood Ave. (SR 111), Traffic
Signal Update, PE, ROW FIN 209565-2 2016/17
16 Atlantic Blvd. (SR 10) Southside Blvd. (SR 115) Cargal St. to N. of Atlantic Blvd. (SR 10), CST Philips Hwy. (SR 5/US 1) to Atlantic Blvd. (SR 10), PLN
FIN 423407-1 BJP
2012/13 2012/13
17 Blanding Blvd. (SR 21) Youngerman Circle 18 Atlantic Blvd. (SR 10) Kernan Blvd. Southside Blvd. (SR 115) to SR A1A, Traffic Control
Devices/System, CST FIN 431780-1 2012/13
19 Philips Hwy. (SR 5/US 1) SR 152 Baymeadows Rd. I-95 to Baymeadows Rd. (SR 152), Resurfacing, CST San Jose Blvd. (SR 13) to Bayberry Rd., Resurfacing, PE, CST
FIN 423408-1 FIN 428704-1
2013/14 2013/14
20 Blanding Blvd. (SR 21). Argyle Forest Blvd. 21 Blanding Blvd. (SR 21) Wells Rd. 22 SR 111 Cassat Ave. I-10 EB Off Ramp Blanding Blvd. (SR 21) to Edgewood Ave. (SR 111), Traffic
Signal Update, PE, ROW I-10 to Beaver St. (US 90), Resurfacing, CST
FIN 209565-2 FIN 424485-1
2016/17 2014/15
23 Blanding Blvd. (SR 21) Kingsley Ave. (SR 224) Knight Boxx Rd. to Kingsley Ave., Resurfacing, CST FIN 428698-1 2016/17 24 Beach Blvd. (US 90) Kernan Blvd. St. Johns Bluff Rd. to San Pablo Rd., Landscaping, CST FIN 431955-1 2016/17
North Florida TPO Regional Strategic Safety Plan
Summary Report 15
Table 8: Priority Intersections Based on Crash Frequency Tag Major Roadway Minor Roadway Status Source Year
25 Atlantic Blvd. (SR 10) Monument Rd. (CR 99) Southside Blvd. (SR 115) to SR A1A, Traffic Control Devices/System, CST Arlington Expy. to E of Monument Rd., Intersection (Modify) PE, ROW, CST
FIN 431780-1 FIN 430911-1
2012/13 2014/15
26 Beach Blvd. (US 90). University Blvd. (SR 109) I-95 to Beach Blvd. (US 90), Resurfacing, PE, CST FIN 428702-1 2014/15 27 New Kings Rd. (US 1) Edgewood Ave. (SR 111) M. L. King Pkwy. to Edgewood Ave. (SR 111), Resurfacing,
CST FIN 424487-1 2014/15
28 Atlantic Blvd. (SR 10) University Blvd. (SR 109) San Jose Blvd. (SR 13) to Cesery Blvd., Traffic Signal Update, PE, ROW, CST At Intersection of Atlantic Blvd. (SR 10) and University Blvd. (SR 109), Intersection Improvements, ROW
FIN 209683-1 BJP
2016/17 2012/13
29 Beach Blvd. (US 90) Penman Rd. San Pablo Rd. to S. 12th St., Landscaping, PE, CST FIN 431962-1 2016/17 Source: HNTB Note: Color Legend, Acronyms and Abbreviations are listed above in Table 7. Figure 3 Legend
X Tag Number of Crash Frequency Analysis Intersection

2
3
4
5
6
7
8
29
10
11
12
13
14
15
16
18
19
20
9
21
22
23
24
25
26
27
28
30
3
2
1
4
5
IJ108
IJ218
IJ214
IJ315
IJ13A
IJ117
IJ210
IJ121
IJ115
IJ209
IJ13
IJ309D
IJ210A
IJ305
IJ16A
IJ220
IJ203
IJ208
IJ217
IJ215
IJ99
IJ115A
IJ1181
IJ119
IJ107
IJ220A
IJ352
IJ200A
IJ15A
IJ739
IJ5A
IJ21B
IJ103
IJA1A
IJ121A
IJ1363
IJ315C
IJ1189
IJ1351
IJ1162
IJ101A
IJ1333
IJ116
IJ13B
IJ163
IJ105A
IJ21D
IJ1177
IJ110
IJ1359
IJ226
IJ1365
IJ106
IJ1335
IJ1339
IJ0019
IJ1337
IJ1353
IJ220B
IJ1179
IJ1340
IJ0012
IJ105B
IJ1354
IJ1332
IJ107A
IJ21A
IJ109A
IJ1187
IJ312
IJ0016
IJ212
IJ115
IJ110
IJ105A
IJ209
IJ105A
IJ214
IJ315
IJ108
IJ315
IJ115AIJ119
IJ107
IJ15A
IJ13A
IJ105A
IJ13A
IJ209
IJ220
IJ108
IJ315
IJ15A
IJ110
§̈¦295
§̈¦95
ST9
ST5
ST21
ST15
ST A1A
ST13
ST10
ST16
ST228
ST200
ST8ST115
ST105
ST207
ST202ST134
ST23
ST116
ST111
ST104
ST152
ST10A
ST109
ST139
ST103
ST312
ST224
ST100
ST113
ST126
ST5A
ST102
ST117
ST101
ST115A
ST243
ST114
ST16
ST15
ST15
STA1A
STA1A
ST10
STA1A
STA1A
ST105
STA1A
ST200
ST109
ST105
ST5
ST115
ST115
ST 105
STA1A
ST105
ST A1A
STA1A
£¤ 17
£¤23£¤1
£¤90
£¤90A
£¤301
£¤90
£¤1
£¤301
£ ¤90A
£¤1
£¤1
£¤17
High Priority Corridors(Hot-Spot & Frequency Analysis)
Figure 2
0 2 41 Miles±LEGEND
North Florida TPO Boundary
Hot-Spot Analysis Priority Corridors
Frequency Analysis Priority CorridorsX
X
Tags for Table 5 Priority Corridors
Tags for Table 7 Priority Corridors
Page 16
4
123
5
6
7
8
1429
917
20
2123
12
10
11
27
22
15
19
26
28
24
1816
25
13
10
15
13
3
12
1
16
4
5
11
8
18
6
7
9
14
19
2
20
IJ108
IJ218
IJ214
IJ315
IJ309D
IJ13A
IJ117
IJ210
IJ115
IJ209
IJ13
IJ210A
IJ305
IJ16A
IJ220
IJ203
IJ208
IJ217
IJ215
IJ99
IJ1181
IJ119
IJ107
IJ220A
IJ200A
IJ207A
IJ15A
IJ115A
IJ739
IJ5A
IJ21B
IJ115C
IJ103
IJA1A
IJ1363
IJ352
IJ315C
IJ1189
IJ1351
IJ101A
IJ211
IJ1333
IJ13B
IJ163
IJ105A
IJ739B
IJ21D
IJ110
IJ1359
IJ226
IJ106
IJ1335
IJ209B
IJ1339
IJ0019
IJ1337
IJ228
IJ220B
IJ0012
IJ105B
IJ1332
IJ121A
IJ107A
IJ21A
IJ1342
IJ1347
IJ312
IJ0016
IJ209
IJ105A
IJ110
IJ108
IJ209
IJ209
IJ115
IJ315
IJ108
IJ315
IJ119
IJ107
IJ15A
IJ13A
IJ105A
IJ13A
IJ214
IJ209
IJ13
IJ15A
IJ315
IJ110
§̈¦295
§̈¦95
§̈¦10
ST9
ST5
ST21
ST A1A
ST15
ST13
ST207
ST10ST200
ST16
ST228
ST8
ST115
ST105
ST202ST134
ST23
ST116
ST111
ST104
ST152
ST139
ST312
ST211
ST5A
ST102
ST117
ST101
ST26
ST243
ST10
ST115ST15
ST10
ST105
STA1ASTA1A
STA1A
ST5
ST15
STA1A
ST A1A
ST105
ST200
STA1A
ST115
ST16
ST200
STA1A
ST228
STA1A
ST105
STA1A
£¤1
£¤ 17
£¤ 23
£¤90
£¤301
£¤90A
£¤90
£ ¤90A
£¤1
£¤17
£¤17
£¤1
High Priority Intersections(Hot Spot & Frequency Analysis)
Figure 3
0 2 41 Miles±X
X
Tags for Table 6 Priority Intersections
Tags for Table 8 Priority Intersections
LEGEND
North Florida TPO Boundary
Hot-Spot Analysis Priority Intersections
Frequency Analysis Priority Intersections
Page 17
North Florida TPO Regional Strategic Safety Plan
Summary Report 18
6. Summary During the North Florida Regional Strategic Safety Plan process, stakeholders were engaged in identifying transportation safety priority corridors and intersection. This process was supported by a performance measures based approach using data provided by FDOT. Based on the data, recommendations were made regarding locations to consider as part of a list of priority safety corridors and intersections. Projects are included in the Transportation Improvement Program today that address many of the locations where safety issues were identified. As part of the continuing planning process, the North Florida TPO should update the safety plan to refine the list of priority corridors and intersections and to track progress toward achieving the goals, objectives, performance measures and benchmarks identified within this plan. This safety effort will require the North Florida TPO to champion the process to ensure that progress is measured, both in executing the strategy and measuring its impact on safety. We recommend safety be considered in preparing the annual List of Priority Projects. As safety implementation moves forward, refinement will occur and the process will improve. By staying focused on the goals we set in our Strategic Safety Plan, the residents of North Florida can save lives, time and money.