2015-16 strategic regional analysis
TRANSCRIPT

2015-16
Strategic Regional Analysis EXECUTIVE SUMMARY
February 1, 2016 Revised April 12, 2016
OUSD SRA 2015-16 SRA1516_ExecutiveSummary_v1_R041216.pptx/.pdf
1

Table of Contents Section Page
Strategic Regional Analysis (SRA) 2015-16: EXECUTIVE SUMMARY
What’s new in SRA 2015-16 3
Background 7
5 Regions Defined 8
I. Region & Schools 10
II. School Environment 12
III. Demographics and Enrollment 13
IV. School Performance 17
V. School Choice/Assignment/Enrollment 18
VI. Live/Go 23
VII. School Programs 24
VIII. Building Conditions 30
IX. Teacher Retention 31
OUSD SRA 2015-16 2
Strategic Regional Analysis 2015-16 authored by Oakland Unified School District – Research Assessment and Data (RAD) division. Jean Wing, Executive Director-RAD, [email protected]; Susan Lindell Radke, Mapping Analytics Specialist-RAD , [email protected]; Kaia Vilberg, Strategic Fellow-RAD, [email protected].

3
Strategic Regional Analysis (SRA) 2015-16
• Full Service Community School District: • Map and count of OUSD district-run community schools with a Community Schools Manager (OUSD staff or lead agency partner)
• Demographics & Enrollment: • Additional enrollment data from 5 of 7 Alameda County-authorized charter schools • Ethnicity, home language, and English learner student enrollment from 42 of 44 charter schools • Attrition/Transition data broken down by student ethnicity
• School Choice/Assignment/Enrollment: • Count of students applying on-time, late, or filing no application • Percent of students who could not continue in current school because of end of grade span • Schools with the highest and lowest demand • Analysis of choice option for K-8 and grade 6-12 grade span schools • Count of districtwide student live/go patterns across grade spans
• School Programs: • Early Childhood Education
• Pre-Kindergarten enrollment and capacity • Transitional Kindergarten enrollment and projections
• College & Career “Linked Learning” Pathway Programs • Regional map of students and share of students at each school enrolled in career pathway programs • Inclusion of Project Lead the Way schools
• Newcomer Programs in Secondary Schools • Count, percent and map of newcomer students by region and district-run secondary school • Current and projected capacity for 2016-17 • Count by region of unaccompanied minors
• Programs for Exceptional Children • Count, percent and map of students receiving Special Education Services across all levels of service (e.g., Resource, Inclusion, different types
of Special Day Classes, etc.). • Teacher Retention
• Annual retention rates for teachers returning to the same district-run school, by region, by year, and by 5-year average. • Appendices:
• Regional detail of choice, live/go and teacher retention data.
2014-15 marked the first iteration of the Strategic Regional Analysis (SRA). Each year, the SRA is updated with current year data and analyses, and also includes new data.
What’s new in SRA 2015-16:
OUSD SRA 2015-16

• Regions & Schools: shows all OUSD district-run schools, OUSD-authorized charter schools, and Alameda County-authorized charter schools in each region of Oakland. It also shows schools with Community School Managers as OUSD moves toward a Full Service Community District.
• School Environment/Place Matters: compares stress factors in the neighborhood where each school is located. Environmental stress factors are measured across all regions and schools.
• Demographics & Enrollment: describes the number and demographics of students attending OUSD district-run schools and OUSD and Alameda County-authorized charter schools.
• Capture gap: describes the gap between the number of school-aged children living in a region and the number of students attending OUSD district-run and OUSD and Alameda County-authorized charter schools.
• Transition gap: describes the rate of students leaving district-run schools in the transition from grade 5 to 6, and grade 8 to 9. The attrition rate indicates a need for quality middle school and high school options to attract and retain students.
• Performance gap: identifies gaps in performance of schools in each region.
• School choice: identifies most chosen and least chosen district-run schools, and looks at enrollment patterns for families participating in the choice lottery.
OUSD SRA 2015-16 4
Strategic Regional Analysis (SRA) 2015-16
• The Strategic Regional Analysis (SRA) is a factual, data-driven, key planning document that supports the OUSD Strategic Priorities in the Pathway to Excellence – 2015-2020. Our goal is to ensure that we are good stewards of our schools and are expanding our portfolio of quality schools.
• In every area of our city, we must provide our families and community with access to a quality school. Our School Performance Framework will anchor and level-set our expectations around quality.
• The SRA details the current state of school performance, demographics, enrollment patterns, school programs, choice, and capacity by region, and identifies the gaps for each. This document is intended to identify the areas in need of additional resources to improve the quality options available to increase student achievement.
• The SRA will inform how we fund, support, and resource our schools.
• The Call for Quality Schools invites applicants to propose innovative ways to improve and expand the number of quality school options in different regions. It addresses gaps identified in the SRA.
5 OUSD SRA 2015-16
Strategic Regional Analysis (SRA) 2015-16

What it is … • A starting point for discussion
• Factual (quantitative) data on the state of our district
• An objective look at our district’s portfolio of schools
• Showcases the need for urgency and for expanding quality options in every neighborhood
• Information for the Pathway to Excellence to inform recommendations
6 OUSD SRA 2015-16
What it is not … • Intended to blame teachers, leaders, or
communities for the information in the SRA
• Meant to answer every question or capture the complete picture
• A conclusion to discussion
It is the district’s responsibility to address: Access, Equity, Quality, and Resources to improve the outcomes for students. We are all needed in this pursuit of Excellence!
Strategic Regional Analysis (SRA) 2015-16

BACKGROUND 2000 - Present
• Declining enrollment of combined OUSD district-run schools (86 schools) and OUSD charter schools (37 schools) – from 55,000 to 49,000 since 2000.
• Demographic shifts have reduced the proportion of African American students from 48% to 29% in district-run schools, while Latino enrollment has grown from 29% to 41% over the same period. Many more English language learners (Latino, Asian, Arab) are expanding in Central, East, and West Oakland. Newcomer students are increasing, including unaccompanied minors from Central America.
• 2001-2007: New small school creation, mostly in Central and East regions with equity goal to relieve overcrowding and provide quality schools in the heartlands. Many of these schools outperformed the schools they replaced, and contributed to Oakland’s status as the “most improved large, urban district in California.” With declining enrollment and Options/Choice, some schools have become unsustainably small.
• Charter schools: Oakland has seen a rapid increase in the number of charter schools, including 6 conversions of district-run schools to OUSD or Alameda County charter schools since 2005. There were 9 OUSD charters in 2000-01, and today there are 37 OUSD charters and 7 Alameda County charters – totaling 44.
7 OUSD SRA 2015-16

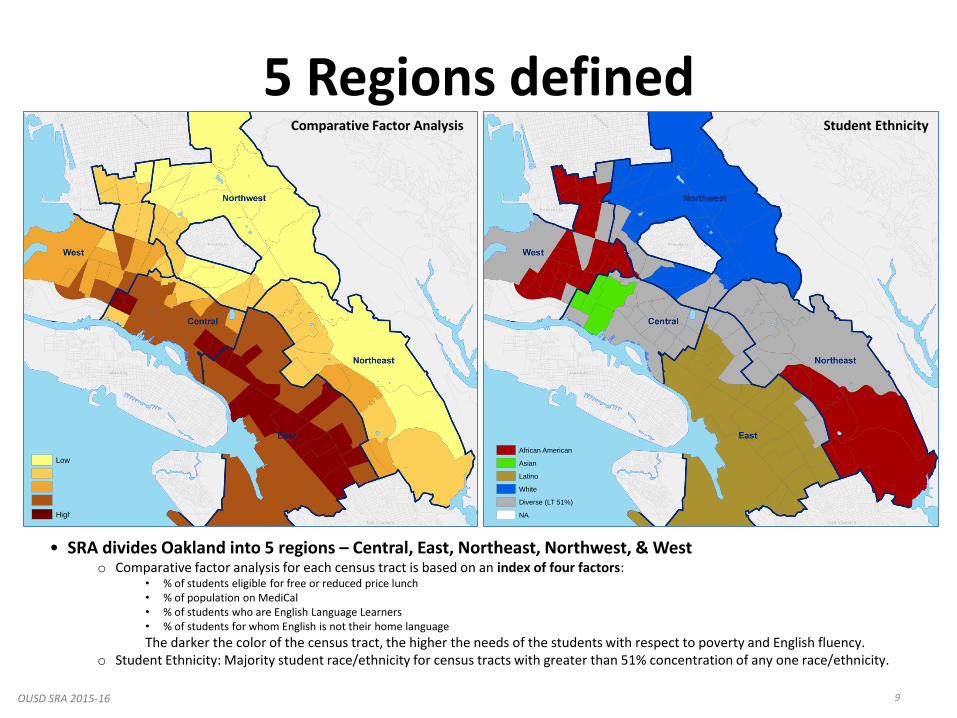
5 Regions defined A central purpose of the Strategic Regional Analysis (SRA) is to provide a picture of where we have quality schools and where we do not. The SRA will help guide our planning so that all students, including those with the highest need, have full access to high quality schools from pre-K-12 within their neighborhoods and region. The SRA is about equity and access. In determining the boundaries, we looked at whether there were shared factors for students and families living in different parts of Oakland with respect to income/poverty, language, race/ethnicity and culture. The five SRA regions – West, Northwest, Central, Northeast, and East – allow for the particular assets and needs of different communities to be visible within the larger citywide discussion about quality public school programs and facilities in every part of Oakland. Note: The East Region is by far the largest in enrollment, and can be divided into at least 2 sub-regions in future subregional analyses.
OUSD SRA 2015-16 8
5 Regions defined
• SRA divides Oakland into 5 regions – Central, East, Northeast, Northwest, & West o Comparative factor analysis for each census tract is based on an index of four factors:
• % of students eligible for free or reduced price lunch • % of population on MediCal • % of students who are English Language Learners • % of students for whom English is not their home language
The darker the color of the census tract, the higher the needs of the students with respect to poverty and English fluency. o Student Ethnicity: Majority student race/ethnicity for census tracts with greater than 51% concentration of any one race/ethnicity.
Low
High
African American
Asian
Latino
White
Diverse (LT 51%)
NA
Comparative Factor Analysis Student Ethnicity
OUSD SRA 2015-16 9

EXECUTIVE SUMMARY
I. Regions & Schools
• 130 district-run public schools and charter public schools in Oakland • West: 19 schools • Northwest: 16 schools • Central: 18 schools • Northeast: 22 schools • East: 55 schools
• 6 new charter schools opened in 2015-16
• Charter schools comprise larger share of public schools in East and West Regions
• 23 district-run community schools have Community School Managers
OUSD SRA 2015-16 10

Community Schools leverage community partnerships and resources so that our campuses become hubs of support and opportunity for students, families, and community members.
Through this approach, our schools become better equipped to break down barriers to achievement and tap into the unique talents and gifts of every student, teacher, and staff member in our district.
MISSION Oakland Unified School District (OUSD) will build a Full-Service Community District focused on high academic achievement while serving the whole child, eliminating inequity, and providing each child with excellent teachers, every day.
VISION All OUSD students will find joy in their academic experience while graduating with the skills to ensure they are caring, competent, fully informed, critical thinkers who are prepared for college, career, and community success.
SCHOOL REGION
2015-16 SCHOOLS WITH COMMUNITY SCHOOL MANAGER
2016-17 NEW
Central 6
East 11 +5
Northeast 0
Northwest 2 +1
West 4
TOTAL 23 +6
EXECUTIVE SUMMARY
I. Regions & Schools • Full Service Community District
11 OUSD SRA 2015-16
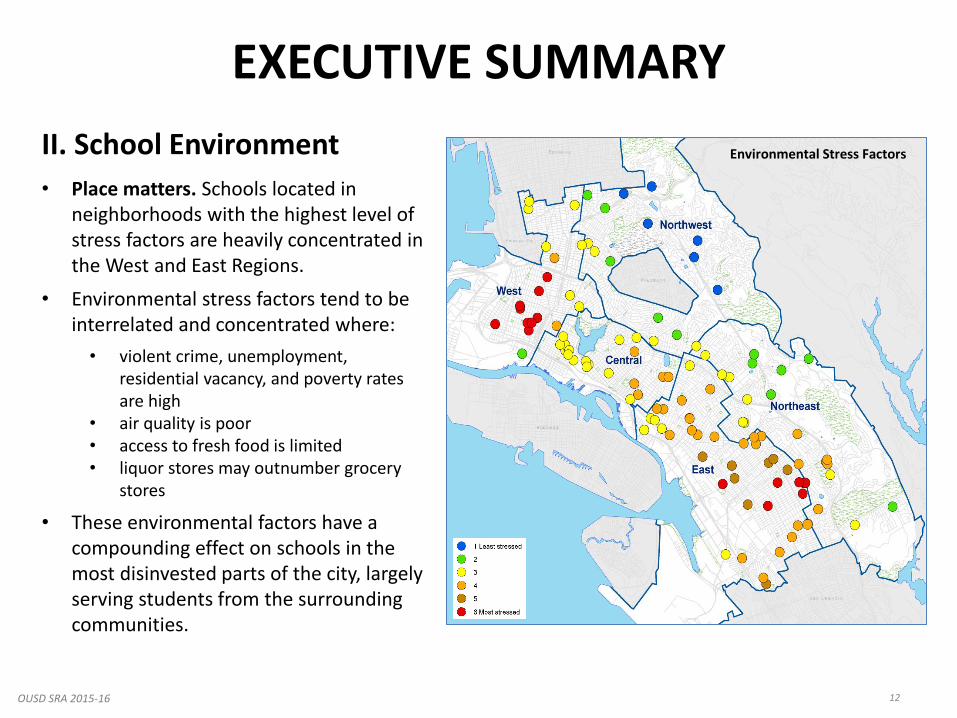
II. School Environment
• Place matters. Schools located in neighborhoods with the highest level of stress factors are heavily concentrated in the West and East Regions.
• Environmental stress factors tend to be interrelated and concentrated where:
• violent crime, unemployment, residential vacancy, and poverty rates are high
• air quality is poor • access to fresh food is limited • liquor stores may outnumber grocery
stores
• These environmental factors have a compounding effect on schools in the most disinvested parts of the city, largely serving students from the surrounding communities.
12 OUSD SRA 2015-16
Environmental Stress Factors
EXECUTIVE SUMMARY

III. Demographics & Enrollment*
• Enrollment: Over the past six years, combined enrollment in OUSD district-run and OUSD charter schools has stabilized at about 48,000, with an increase to 49,000 in 2015-16. The increase was in the charter sector.
• Demographics: • The largest racial/ethnic group remains Latino (43.6%),and
the second largest is African American, decreasing from 30.5% to 26.5% over the past four years.
• English Learners decreased from 32.2% to 28.9% since 2014-15, largely due to increased English fluency reclassification, in spite of increase of newcomer students.
• Capture Rate • Percent of school-aged children enrolled in public district-run
or charter schools in Oakland = 73.3% • Kindergarten has highest capture rate at 92.7% • 35% of 5th grade students in district-run schools enroll in a
non-district-run school for 6th grade. In the Northwest Region, the attrition rate is 50%.
13 OUSD SRA 2015-16
4,814
4,815 - 5,299
5,300 - 5,501
5,502 - 7,613
7,614 - 25,873
2015-16 Enrollment
2011-12 2012-13 2013-14 2014-15 2015-16
Capture Rate
79.1% 69.8% 72.3% 70.9% 73.3%
0
10,000
20,000
30,000
40,000
50,000
60,000
70,000
2011-12 2012-13 2013-14 2014-15 2015-16
TK-12 charter school enrollment (Oakland Residents)
TK-12 OUSD district-run school enrollment (OaklandResidents)
TK-12 pool (Oakland Residents 2010 Census)
TK-12 Capture Rate
EXECUTIVE SUMMARY
1PEC (Off-site): Programs for Exceptional Students include students with disabilities who attend non-public schools, home & hospital, young adult, and infant and pre-K special programs.
OUSD ALAMEDA COUNTY
STUDENT REGION DISTRICT-RUN CHARTER CHARTER PEC1 PROG-
RAMS TOTAL % Change 2014-15 to 2015-16
Central 6,079 1,301 117 116 7,613 14.7% 4.93% East 17,889 6,541 1,000 443 25,873 50.1% 8.00% Northeast 4,040 944 185 130 5,299 10.3% 5.96% Northwest 4,233 421 74 86 4,814 9.3% 5.69% West 4,173 1,158 52 118 5,501 10.6% 5.82% Outside Oakland 511 1,504 272 0 2,287 4.4% 6.52% Address not found 150 108 8 31 297 0.6% TOTAL 37,075 11,977 1,708 924 51,684 6.78% % SCHOOL TYPE 71.7% 23.2% 3.3% 1.8% 100.0%
*2015-16 enrollment counts include all OUSD district-run and OUSD-authorized charter schools, and 5 of 7 Alameda County-authorized charter schools. Prior year’s enrollment counts did not include Alameda County charter schools. Source: Aeries Student Information System - OUSD District-Run students; Rosters of charter students from individual charter schools.
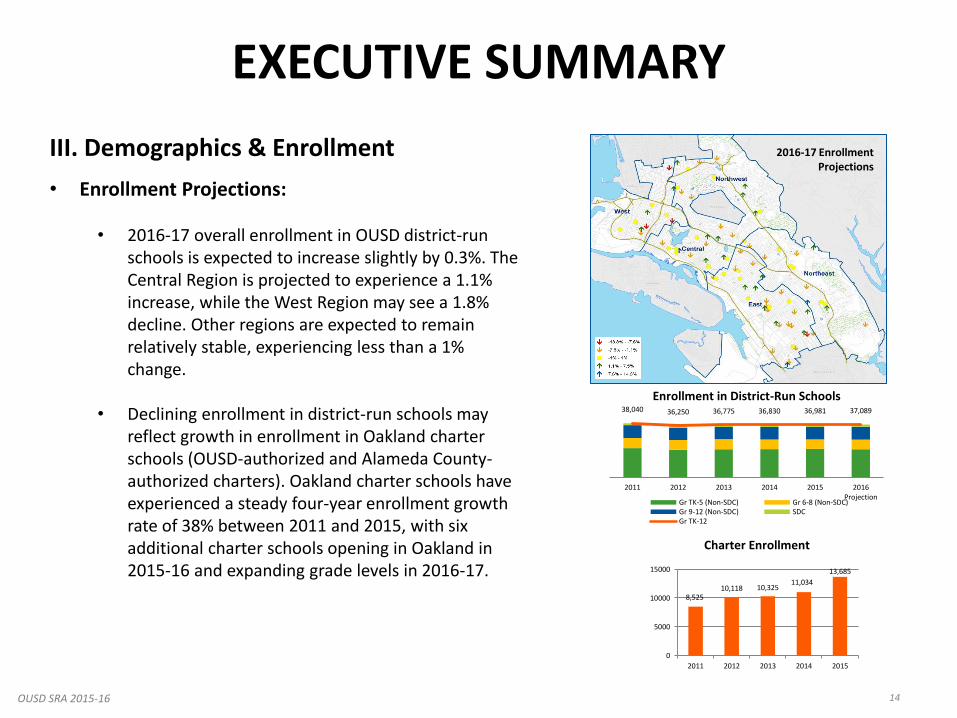
III. Demographics & Enrollment
• Enrollment Projections:
• 2016-17 overall enrollment in OUSD district-run schools is expected to increase slightly by 0.3%. The Central Region is projected to experience a 1.1% increase, while the West Region may see a 1.8% decline. Other regions are expected to remain relatively stable, experiencing less than a 1% change.
• Declining enrollment in district-run schools may reflect growth in enrollment in Oakland charter schools (OUSD-authorized and Alameda County-authorized charters). Oakland charter schools have experienced a steady four-year enrollment growth rate of 38% between 2011 and 2015, with six additional charter schools opening in Oakland in 2015-16 and expanding grade levels in 2016-17.
14 OUSD SRA 2015-16
8,525 10,118 10,325
11,034
13,685
0
5000
10000
15000
2011 2012 2013 2014 2015
Charter Enrollment
38,040 36,250 36,775 36,830 36,981 37,089
2011 2012 2013 2014 2015 2016Projection
Enrollment in District-Run Schools
Gr TK-5 (Non-SDC) Gr 6-8 (Non-SDC)Gr 9-12 (Non-SDC) SDCGr TK-12
2016-17 Enrollment Projections
EXECUTIVE SUMMARY
*East region scale 3x other regions to account for greater number of students
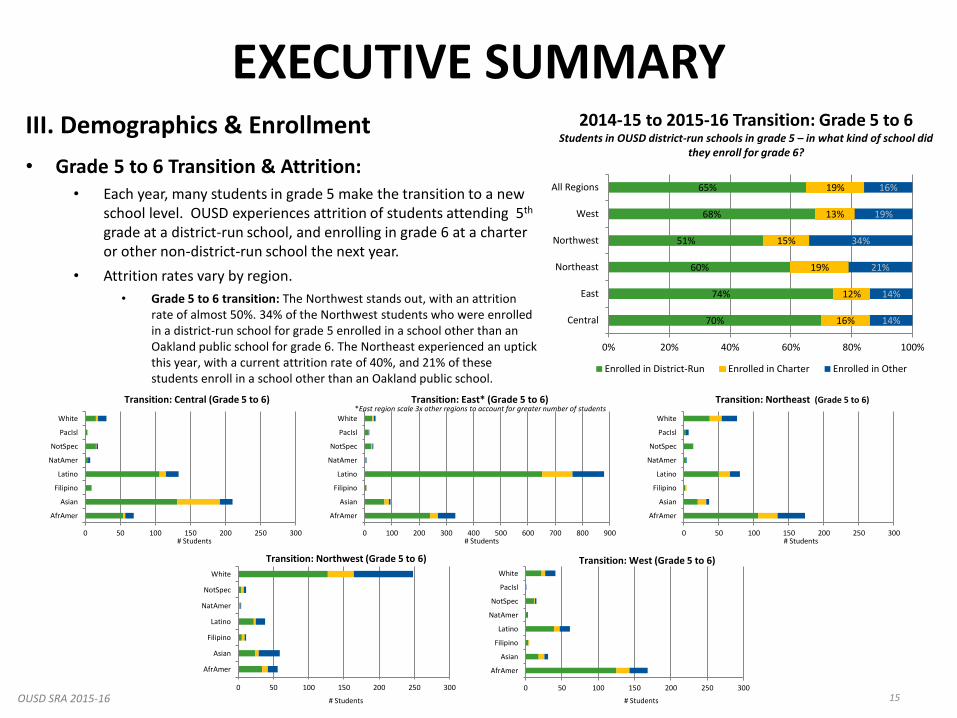
III. Demographics & Enrollment
• Grade 5 to 6 Transition & Attrition: • Each year, many students in grade 5 make the transition to a new
school level. OUSD experiences attrition of students attending 5th grade at a district-run school, and enrolling in grade 6 at a charter or other non-district-run school the next year.
• Attrition rates vary by region.
• Grade 5 to 6 transition: The Northwest stands out, with an attrition rate of almost 50%. 34% of the Northwest students who were enrolled in a district-run school for grade 5 enrolled in a school other than an Oakland public school for grade 6. The Northeast experienced an uptick this year, with a current attrition rate of 40%, and 21% of these students enroll in a school other than an Oakland public school.
15 OUSD SRA 2015-16
2014-15 to 2015-16 Transition: Grade 5 to 6 Students in OUSD district-run schools in grade 5 – in what kind of school did
they enroll for grade 6?
EXECUTIVE SUMMARY
70%
74%
60%
51%
68%
65%
16%
12%
19%
15%
13%
19%
14%
14%
21%
34%
19%
16%
0% 20% 40% 60% 80% 100%
Central
East
Northeast
Northwest
West
All Regions
Enrolled in District-Run Enrolled in Charter Enrolled in Other
0 50 100 150 200 250 300
AfrAmer
Asian
Filipino
Latino
NatAmer
NotSpec
PacIsl
White
Transition: Central (Grade 5 to 6)
0 100 200 300 400 500 600 700 800 900
AfrAmer
Asian
Filipino
Latino
NatAmer
NotSpec
PacIsl
White
Transition: East* (Grade 5 to 6)
0 50 100 150 200 250 300
AfrAmer
Asian
Filipino
Latino
NatAmer
NotSpec
PacIsl
White
Transition: Northeast (Grade 5 to 6)
0 50 100 150 200 250 300
AfrAmer
Asian
Filipino
Latino
NatAmer
NotSpec
White
Transition: Northwest (Grade 5 to 6)
0 50 100 150 200 250 300
AfrAmer
Asian
Filipino
Latino
NatAmer
NotSpec
PacIsl
White
Transition: West (Grade 5 to 6)
# Students # Students # Students
# Students # Students

16
EXECUTIVE SUMMARY 2014-15 to 2015-16 Transition: Grade 8 to 9
Students in OUSD district-run schools in grade 8 – in what kind of school did they enroll for grade 9?
85%
72%
76%
65%
79%
75%
2%
9%
5%
2%
4%
6%
13%
19%
19%
33%
17%
19%
0% 20% 40% 60% 80% 100%
Central
East
Northeast
Northwest
West
All Regions
Enrolled in District-Run Enrolled in Charter Enrolled in Other
III. Demographics & Enrollment
• Grade 8 to 9 Transition & Attrition: • Each year, many students in grade 8 make the transition to a new
school level. OUSD experiences attrition of students attending 8th grade at a district-run school, and enrolling in grade 9 at a charter or other non-district-run school the next year.
• Attrition rates vary by region. • Grade 8 to 9 transition: About one out of four students in a district-run
school for grade 8 enrolled in a non-district-run school for grade 9. The Northwest stands out, with an attrition rate of 35%, followed by the East at 28%. 33% of the Northwest students who attended a district-run school in grade 8 enrolled in a school other than an Oakland public school for grade 9, compared to 19% in the East.
0 50 100 150 200 250 300
AfrAmer
Asian
Filipino
Latino
NatAmer
NotSpec
PacIsl
White
Transition: Central (Grade 8 to 9)
0 100 200 300 400 500 600 700 800 900
AfrAmer
Asian
Filipino
Latino
NatAmer
NotSpec
PacIsl
White
Transition: East* (Grade 8 to 9)
0 50 100 150 200 250 300
AfrAmer
Asian
Filipino
Latino
NatAmer
NotSpec
PacIsl
White
Transition: Northeast (Grade 8 to 9)
0 50 100 150 200 250 300
AfrAmer
Asian
Filipino
Latino
NotSpec
White
Transition: Northwest (Grade 8 to 9)
0 50 100 150 200 250 300
AfrAmer
Asian
Filipino
Latino
NotSpec
White
Transition: West (Grade 8 to 9)
# Students # Students # Students
# Students # Students
*East region scale 3x other regions to account for greater number of students

IV. School Performance
The SRA requires a set of school quality indicators that are common to both district-run schools and charter schools in Oakland. In 2016-17, the SRA will utilize a School Performance Framework that includes multiple measures of academic performance and growth, as well as measures of school culture/climate and social emotional learning. In the meantime, the SRA uses indicators reported by the California Department of Education.
The 2014-15 Interim school quality index is based on the most recent available annual data reported by the state for a small number of key indicators. They are:
2012-13 Similar Schools Ranking 2012-13 Academic Performance Index (API) 2012-13 Cohort Graduation Rate (High Schools only) 2012-13 A-G Completion Rate (High Schools only)
The API, graduation rate, and A-G rate were standardized to range from 1-10 (deciles) like the state’s Similar Schools Rank. The 1-10 range for graduation and A-G rates were based on the performance of a high school relative to other OUSD high schools. An average was taken and rounded to come up with the final score.
17 OUSD SRA 2015-16
NOTE: The 2014-15 Interim School Quality Index is not a measure of current school performance and growth. Because the State based Similar Schools Rankings and Academic Performance largely on the California Standards Test (CST) results, and the CST was discontinued after 2012-13, these are the most recent available results. The California Department of Education did not report Academic Performance Index (API) scores or Similar Schools Rankings based on the new Smarter Balanced (SBAC) state test. In Fall 2017, the School Performance Framework will replace the Interim School Quality Index.
2014-15 Interim School Quality Index
EXECUTIVE SUMMARY
V. School Choice/Assignment/Enrollment
• School CHOICE:
• OUSD has a school choice lottery each year for district-run schools. Most applications are submitted for Kindergarten, grade 6, and grade 9 – entry years for elementary, middle, and high school levels.
• On average, two thirds of the students living in Oakland who are currently enrolled in grades TK/K, 6, and 9 submitted on-time applications for the choice lottery, and about 20% did not submit any application. Under 13% of families submitted late applications after the lottery.
• On-time application rates vary by region. For example, the East region has only slightly fewer families with no TK/K application than it has on-time applications; while in the Northwest, 86% of families submitted on-time applications for TK/K.
18 OUSD SRA 2015-16
SRA Region On-time Late No application
Central 383 116 146
East 798 471 611
Northeast 263 72 120
Northwest 496 44 38
West 199 95 122
Unknown 50 19 20
Total 2,189 817 1,057
SRA Region On-time Late No application
Central 289 15 53
East 883 63 291
Northeast 174 12 66
Northwest 209 5 19
West 187 13 44
Unknown 31 5 8
Total 1,773 113 481
SRA Region On-time Late No application
Central 309 22 12
East 732 61 94
Northeast 184 17 22
Northwest 211 7 6
West 181 20 40
Unknown 35 2 1
Total 1,652 129 175
Grade K students
Grade 6 students
Grade 9 students
EXECUTIVE SUMMARY

V. School Choice/Assignment/Enrollment
• Choosing schools in neighborhood or region – The rate of families choosing first-choice schools in their neighborhood or region also varies by region.
• More than 9 out of 10 families living in the Northwest region choose schools in their region at grades TK/K, 6, and 9, and more than 6 out of 10 choose a school in their neighborhood attendance area for grades TK/K and 6.
• Almost three out of four families in the West region chose a school outside their region for TK/K, and less than one out of ten chose a school in the West region for grade 9.
17 OUSD SRA 2015-16
FAMILIES CHOOSING A SCHOOL IN THEIR NEIGHBORHOOD OR REGION AS THEIR FIRST CHOICE:
GRADES K, 6, & 9
Grade K, 6, 9 Students: Region of Residence
1st choice in region
1st choice in neighborhood Total
Central 545 430 975
East 1775 692 2467
Northeast 263 179 442
Northwest 1278 785 2063
West 197 246 443
EXECUTIVE SUMMARY
44.2%
60.0%
29.5%
93.4%
26.2%
34.9%
23.4%
20.1%
57.4%
32.8%
0% 20% 40% 60% 80% 100%
Central
East
NorthE
NorthW
West

V. School Choice/Assignment/Enrollment
• Highest and lowest first-choice applications
• District-run schools with the highest number of first-choice are concentrated in the Northwest and Central regions. There are no lowest choice schools in the Northwest or Central regions.
• District-run schools with the lowest number of first-choice applications are concentrated in the East and West regions.
• There are no highest choice schools in the West region, and none in the East region at the elementary level, though notably there are two highest choice schools for grade 6 in the East.
• Highest and lowest demand (ratio of first-choice applications to enrollment)
• Looking at the demand provides a way to identify schools that receive many more applications than seats for enrollment. The Northwest region has the most schools with a high demand.
• All East region schools with high demand are for grade 6 or grade 9, or both, and three out of four are gradespan schools (6-12 gradespans). There are no high demand schools in the East for TK/K.
• Low demand schools are concentrated in the East region, followed by the West region.
20 OUSD SRA 2015-16
Highest and lowest number of first-
choice applications
EXECUTIVE SUMMARY
Highest and lowest demand

V. School Choice/Assignment/Enrollment
• School ASSIGNMENT
• On-time applications are assigned a school based on the lottery criteria and process, and on the enrollment capacity of schools with the highest ratio of first-choice applications to enrollment.
• A majority of applicants across all regions are assigned to their first-choice school. The Northwest has the highest rates, with close to 8 out of 10 applicants assigned to their first-choice schools for grades TK/K, 6, and 9.
• However, some applicants are assigned to none of their choices, including more than one out of four TK/K applicants in the West and Northeast regions.
21 OUSD SRA 2015-16
Students assigned to their 1st choice according to region where they live
% of students who applied on time
Students assigned to none of their choices according to region where they live
% of students who applied on time
EXECUTIVE SUMMARY
73.1%
80.0%
56.2%
76.0%
56.4%
78.0%
73.9%
70.6%
80.3%
85.8%
63%
52%
68%
78%
78%
0% 20% 40% 60% 80% 100%
Central
East
NorthE
NorthW
West
Grade K
Grade 6
Grade 9
14.6%
11.4%
33.3%
14.3%
31.8%
7.5%
12.8%
16.3%
7.8%
5.5%
12.0%
16.0%
12.2%
13.4%
8.8%
0% 20% 40% 60% 80% 100%
Central
East
NorthE
NorthW
West
Grade K
Grade 6
Grade 9

V. School Choice/Assignment/Enrollment • School ENROLLMENT
• A majority of school choice applicants at grades TK/K, 6, and 9 ultimately enroll in the assigned district-run school. However, this varies across grades and regions.
• TK/K students attend assigned school at the highest rates, though more than 11% of students living in the Northwest or East regions who were assigned to their first-choice school ultimately did not enroll in any district-run school.
• There is an even higher percentage of students in grades 6 and 9 who were assigned to their first-choice school but ultimately did not enroll in any district-run school. The rate goes from a low of 13.8% in the East to a high of 35% in the Northwest for grade 6, and from a low of 8.5% in Central to a high of 26.2% in the Northwest for grade 9.
20 OUSD SRA 2015-16
WHERE DO STUDENTS WHO APPLIED TO THE LOTTERY ON TIME ULTIMATELY ENROLL? GRADES K, 6, & 9
Grade K, 6, & 9 Students: Region of Residence
attends assigned OUSD
school attends non-assigned
OUSD school attends charter unknown Total
Central 843 126 109 151 1229
East 1839 338 310 462 2949
Northeast 480 107 99 204 890
Northwest 826 62 93 388 1369
West 463 90 64 133 750
EXECUTIVE SUMMARY
68.6%
62.4%
53.9%
60.3%
61.7%
10.3%
11.5%
12.0%
4.5%
12.0%
8.9%
10.5%
11.1%
6.8%
8.5%
12.3%
15.7%
22.9%
28.3%
17.7%
0% 20% 40% 60% 80% 100%
Central
East
NorthE
NorthW
West
attends assigned OUSD school
attends non-assigned OUSD school
attends charter
unknown

VI. Live/Go Patterns – District-wide
• Nearly equal numbers of students in district-run elementary, middle, and high schools are attending the school in their attendance area, or attending a district-run school outside their attendance area.
• Live/Go patterns (where students live, where they go to school) vary by Region and grade level.
• 13,935 students are attending a district-run or charter school that draws students citywide, and does not have a geographic attendance area.
• Students are travelling a total of 131,823 miles each way to school every day.
23 OUSD SRA 2015-16
Live/Go: students attend district-run schools in their attendance area
Live/Not Go: students attend district-run schools outside their attendance area
Citywide: students attend either district-run or charter school that does not align with a geographic attendance area
PEC: students in Programs for Exceptional Children with disabilities who attend non-public schools, home & hospital, young adult, and infant and pre-K special programs
0
2,000
4,000
6,000
8,000
10,000
12,000
TK-5 G6-8 G9-12 PEC
LIVE/GO LIVE/NOT GO CITYWIDE
PEC OUTSIDE OAKLAND ADDRESS NOT FOUND
EXECUTIVE SUMMARY

VII. School Programs
• Early Childhood Education: Pre-Kindergarten
• OUSD Pre-K programs provide affordable, state-subsidized early childhood education for who are at least 3 years old and meet eligibility requirements.
• 29 pre-K sites in 2015-16
• 1,320 students enrolled at 90.3% of capacity
• Early Childhood Education: Transitional Kindergarten
• OUSD Transitional Kindergarten is a one-year program that includes students turning five years old between September 2 and December 2. These students enter Kindergarten the following school year.
• 44 TK sites at district-run and charter elementary schools
24 OUSD SRA 2015-16
EXECUTIVE SUMMARY

VII. School Programs College & Career “Linked Learning” Pathways
25 OUSD SRA 2015-16
Linked Learning Pathway School Sites: Industry Sector
# Students Enrolled
Khepera Pathway (African American Male Achievement) 41
Agriculture and Natural Resources 188
Arts, Media & Entertainment 542
Building Trades and Construction 227
Business and Finance 130
College Preparatory (AVID Pathway) 110
Education, Child Development and Family Services 177
Energy, Environment and Utilities 323
Fashion and Interior Design 136
Health Science and Medical Technology 647
Hospitality, Tourism and Recreation 83
Information and Communication Technology 330
Marketing Sales and Service 164
Public Service 285
Engineering and Design 631
West Oakland Stem Corridor1
(P) Project Lead The Way1
TOTAL 4,014
S
College & Career “Linked Learning”
Pathways
REGION/STUDENT # PATHWAY STUDENTS
# GRADE 9-12 STUDENTS % PATHWAY STUDENTS
Central 790 1,632 48.4%
East 2,018 4,725 42.7%
Northeast 398 1,049 37.9%
Northwest 302 760 39.7%
West 421 1,164 36.2%
Outside Oakland 85 179 47.5%
TOTAL 4,014 9,509 42.2%
1Student counts do not include 1,166 elementary and middle school students in the West Oakland STEM Corridor participating in Project Lead The Way. McClymonds and Oakland High School students participating in Project Lead The Way are accounted for in the Engineering and Design industry sector student counts.
EXECUTIVE SUMMARY

VII. School Programs
• Dual Language Programs
• Dual language programs are designed to support student achievement of full bilingualism, biliteracy, and cross-cultural competency. Content area instruction is provided in both English and the target language, with at least 50 percent of instruction in the target language. These programs can facilitate intellectual flexibility and higher academic achievement for students, and increase multicultural awareness for students and families.
• The largest number of dual language programs are in the East region and in the Central region bordering on the East. There is one Mandarin (Chinese) two-way dual language immersion program in the West region.
26 OUSD SRA 2015-16
EXECUTIVE SUMMARY

EXECUTIVE SUMMARY VII. School Programs
• Newcomer Programs in Secondary Schools
• A newcomer is a non-U.S. born student with a home language other than English, and who has been in the U.S. for less than three years.
• Oakland’s newcomer population is growing, and to date includes some 300 unaccompanied minors from Central America.
• Newcomer students who enter school at the secondary level need special instruction and support to access middle school and high school course content while learning a new language.
• 1,741 newcomer secondary students attend OUSD district-run schools and are enrolled in Newcomer programs. The number of newcomer students at the secondary level varies by region.
• The largest number (936) live in the East region, and include two out of three unaccompanied minors.
• Central region has the highest percentage (7.7%) of newcomer students who live in the region and attend district-run middle schools and high schools.
27 OUSD SRA 2015-16
STUDENT REGION
# NEWCOMER STUDENTS
% OF NEWCOMER
OUSD
% OF OUSD STUDENTS IN DISTRICT-RUN
SCHOOLS
# UNACCOMP-
ANIED MINORS
Central 470 27.0% 7.7% 52
East 936 53.8% 5.2% 205
Northeast 74 4.3% 1.8% 10
Northwest 38 2.2% 0.9% 0
West 164 9.4% 3.9% 12
Address not found 59 3.4% 8.6% 18
TOTAL 1,741 100.0% 4.7% 297
Newcomerstudents persq. mile
0 - 12
13 - 42
43 - 77
78 - 117
118 - 171
172 - 236
237 - 308
309 - 397
398 - 506
507 - 632
School NewcomerCapacity
10
50
100
300
# change

VII. School Programs Programs for Exceptional Children
28 OUSD SRA 2015-16
8
Resource
Inclusion
Mild/Moderate SDC
Moderate/Severe SDC
Mental Health SDC
Hearing/Visual Impaired
Special Education Programs at each school
64
Inclusion
Mild/Moderate SDC
Moderate/Severe SDC
Mental Health SDC
Hearing/Visual Impaired
Students enrolled in Special Education Programs at each school (excluding Resource)
63% 6%
14%
12%
4%
1%
Resource*
Inclusion
Mild-Moderate:MM SDCs Reading Clinic SDCs
Moderate-Severe SDCModerate SDCs MS SDCs TACLE
Mental Health:CE SDCs ICE SDCs
Vision and Hearing Impaired
Program Type # Students % of Total SDC and Inclusion
% of Total Students Receiving Special Ed
Services (including RSP)
Resource* 3,249 n/a 63.0%
Inclusion 310 16.2% 6.0%
Mild-Moderate: MM SDCs Reading Clinic Special Day Class 739 38.7% 14.3%
Moderate-Severe Special Day Class Moderate SDCs MS SDCs TACLE 600 31.4% 11.6%
Mental Health: CE SDCs ICE SDCs 223 11.7% 4.3%
Vision and Hearing Impaired Programs 39 2.0% 0.8%
TOTAL ALL STUDENTS WITH SPECIAL ED SERVICES 5,160
TOTAL SDC/INCLUSION STUDENTS 1,911
* RSP numbers estimated based on AERIES coding
EXECUTIVE SUMMARY

VII. School Programs
• School-Based Health Centers
• In 2015-16, OUSD has 16 school-based health centers located in district-run schools, half in the East Region where the student population is the largest.
• School-based health centers provide medical, dental, and other health services on-site, during the school day.
• In 2015-16, some health centers expanded services to students at nearby schools. For example, Roosevelt Middle School’s health center now serves Garfield Elementary students as well, and the health center at the Elmhurst Community Prep/Alliance campus now also serves students from New Highland Elementary and RISE Community School.
• These health centers are an important part of becoming a Full Service Community District.
29 OUSD SRA 2015-16
EXECUTIVE SUMMARY

VIII. Building Conditions
30 OUSD SRA 2015-16
*OUSD facilities building conditions data as of 2012 Facilities Master Plan (awaiting modernization update); condition rating weighted by building square footage. Non- OUSD building conditions data for some charters schools as of Spring 2015.
Most school interior and exterior facilities are in moderate to good condition. Three sites have fair interior or exterior conditions.
EXECUTIVE SUMMARY
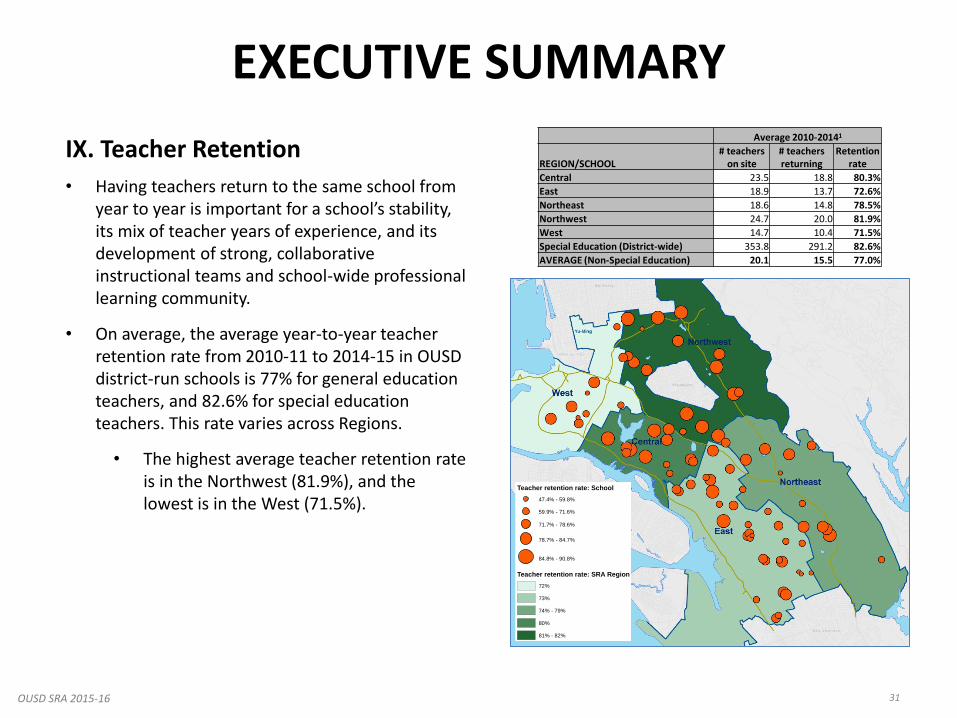
IX. Teacher Retention
31 OUSD SRA 2015-16
Average 2010-20141
REGION/SCHOOL # teachers
on site # teachers returning
Retention rate
Central 23.5 18.8 80.3%
East 18.9 13.7 72.6%
Northeast 18.6 14.8 78.5%
Northwest 24.7 20.0 81.9%
West 14.7 10.4 71.5%
Special Education (District-wide) 353.8 291.2 82.6%
AVERAGE (Non-Special Education) 20.1 15.5 77.0%
• Having teachers return to the same school from year to year is important for a school’s stability, its mix of teacher years of experience, and its development of strong, collaborative instructional teams and school-wide professional learning community.
• On average, the average year-to-year teacher retention rate from 2010-11 to 2014-15 in OUSD district-run schools is 77% for general education teachers, and 82.6% for special education teachers. This rate varies across Regions.
• The highest average teacher retention rate is in the Northwest (81.9%), and the lowest is in the West (71.5%).
Teacher retention rate: School
47.4% - 59.8%
59.9% - 71.6%
71.7% - 78.6%
78.7% - 84.7%
84.8% - 90.8%
Teacher retention rate: SRA Region
72%
73%
74% - 79%
80%
81% - 82%
EXECUTIVE SUMMARY