regional report on the impact of climate … · regional report on the impact of climate change on...
TRANSCRIPT
REGIONAL REPORT ON THE IMPACT OF CLIMATE CHANGE ON THE TOURISM SECTOR
____________ This document has been reproduced without formal editing.
LIMITED LC/CAR/L.263
4 June 2010 ORIGINAL: ENGLISH
Economic Commission for Latin America and the Caribbean Subregional Headquarters for the Caribbean
Acknowledgement The Economic Commission for Latin America and the Caribbean (ECLAC) Subregional Headquarters for
the Caribbean wishes to acknowledge the assistance of Dr. Sandra Sookram, Consultant, in the
preparation of this report.
CONTENTS
Executive Summary ........................................................................................................................ i Introduction...................................................................................................................................... 1 I. REVIEW OF THE LITERATURE .................................................................................. 4 II. MODELLING TOURISM DEMAND IN THE CARIBBEAN ......................................... 6 A. The tourism demand function: a review of the literature..................................... 6
B. Data........................................................................................................................ 7 C. Methodology and empirical model ...................................................................... 7
III. RESULTS ......................................................................................................................... 10 IV. FORECASTING THE COST OF CLIMATE CHANGE................................................. 12 A. Forecasted impacts at nine tourist destinations in the Caribbean ....................... 12 B. Projections for extreme events............................................................................ 14 C. Methodology....................................................................................................... 14 D. Results.................................................................................................................. 15 V. ADAPTATION AND MITIGATION STRATEGIES .................................................... 17 A. Adaptation strategies........................................................................................... 17 B. Mitigation strategies ........................................................................................... 21 VI. CONCLUSION ................................................................................................................ 23 References..................................................................................................................................... 24

Executive Summary
The main aim of this study is to estimate the economic impact of climate change on nine countries in the Caribbean basin: Aruba, Barbados, Dominican Republic, Guyana, Jamaica, Montserrat, Netherlands Antilles, Saint Lucia and Trinidad and Tobago.
A typical tourism demand function, with tourist arrivals as the dependent variable, is used in the
analysis. To establish the baseline, the period under analysis is 1989-2007 and the independent variables are destination country GDP per capita and consumer price index, source country GDP, oil prices to proxy transportation costs between source and destination countries.
At this preliminary stage the climate variables are used separately to augment the tourism demand function to establish a relationship, if any, among the variables.
Various econometric models (single OLS models for each country, pooled regression, GMM
estimation and random effects panel models) were considered in an attempt to find the best way to model the data.
The best fit for the data (1989-2007) is the random effects panel data model augmented by both
climate variables, i.e. temperature and precipitation. Projections of all variables in the model for the 2008-2100 period were done using forecasting
techniques. Projections for the climate variables were undertaken by INSMET. The cost of climate change to the tourism sector was estimated under three scenarios: A2, B2 and
BAU (the mid-point of the A2 and B2 scenarios). The estimated costs to tourism for the Caribbean subregion under the three scenarios are all very
high and ranges from US$43.9 billion under the B2 scenario to US$46.3 billion under the BAU scenario.

INTRODUCTION
Tourism1 is an important source of economic growth in the Caribbean. Indeed, it is one of the most important industrial sectors in some countries in the subregion. Figure 1 demonstrates the importance of tourism for some countries in the Caribbean subregion. Indeed, the figure shows that while tourism income is a large part of Gross National Income (GNI) for Aruba, Saint Lucia and Barbados, it contributes very little to the GNI of Guyana, Dominican Republic and Montserrat. In addition, with regard to the Trinidad and Tobago economy, the contribution of tourism to GNI has been quite negligible.
Furthermore, its significance to any one country increases in accordance with the quantity of tourism-related services associated with the sector. The World Tourism Organization (UNWTO) has declared that international tourism figures increased by 2% during 2007, and has predicted that the number of international tourists will reach the 1.6 billion mark by the year 2020.2
Figure 1: Tourism Income as a% of Gross National Income
What needs to be considered is how many of those potential tourists would visit the Caribbean and what impact climate change would have on that figure. There is no doubt that climate is an important influence on the tourism sector. Numerous studies that analyze climate data indicate that our climate is changing, for example, the average global temperature has increased by approximately 0.6ºC during the twentieth century. More than that, the rate of increase in air temperature in the Caribbean subregion has exceeded the international mean (Mimura et al., 2007).
1 According to the World Tourism Organization, tourism can be defined as “the activities of persons traveling to and staying in places outside their usual environment for not more than one consecutive year.” 2 See WTO website: http://www.unwto.org/index.php

2
This study attempts to determine the possible impact of climate change on nine Caribbean countries, 3 using tourist arrivals, climate (represented by temperature and precipitation) and other economic data for the 1989-2007 period. A key objective is to estimate the economic impact of climate change on tourism income under two climate change scenarios (A2 and B2). The main objective of this study is to suggest adaptation and mitigation strategies for the tourism sectors of these countries.
According to Braun et al. (1999), environmental factors are key components when tourists choose a holiday destination. There is convincing evidence to show that the world’s climate will continue to change during this century. Future variations in temperature and other aspects associated with climate change will have differing effects on different regions worldwide. Table 1 shows the major impacts of climate change and their implications for tourism destinations. It is highly likely that most of these direct effects of climate change, and their subsequent indirect effects, would have an impact on the Caribbean subregion.
There are many studies on the demand for tourism and modelling tourism demand. This study uses a typical tourism model and expands the model to include two climatic variables: temperature and precipitation. The model is then used to forecast the likely impact of changes in temperature and precipitation on the countries in the study.
Table 1 Main impacts of climate change and their implications for tourism
Impact Implications for Tourism
Warmer temperatures Altered seasonality, heat stress for tourists, cooling costs, changes in: plant-wildlife-insect populations and distribution range, infectious disease ranges
Decreasing snow cover and shrinking glaciers
Lack of snow in winter sport destinations, increased snow-making costs, shorter winter sports seasons, aesthetics of landscape reduced
Increasing frequency and intensity of extreme storms
Risk for tourism facilities, increased insurance costs/loss of insurability, business interruption costs
Reduced precipitation and increased evaporation in some regions
Water shortages, competition over water between tourism and other sectors, desertification, increased wildfires threatening infrastructure and affecting demand
Increased frequency of heavy precipitation in some regions
Flooding damage to historic architectural and cultural assets, damage to tourism infrastructure, altered seasonality (beaches, biodiversity, river flow)
Sea level rise Coastal erosion, loss of beach area, higher costs to protect and maintain waterfronts and sea defenses
Sea surface temperature rise Increased coral bleaching and marine resource and aesthetic degradation in dive and snorkel destinations
Changes in terrestrial and marine biodiversity
Loss of natural attractions and species from destinations, higher risk of diseases in tropical-subtropical countries
More frequent and larger forest fires
Loss of natural attractions, increase of flooding risk, damage to tourism infrastructure
Soil changes (e.g. moisture levels, erosion and acidity)
Loss of archaeological assets and other natural resources, with impacts on destination attractions.
Source: WTO-UNEP-WMO (2008) Climate Change and Tourism: Responding to Global Challenges
3 The countries are: Aruba, Barbados, the Dominican Republic, Guyana, Jamaica, Montserrat, the Netherlands Antilles, Saint Lucia, and Trinidad and Tobago.

3
This study is organized as follows: section I reviews the literature related to tourism and climate change; section II outlines the methodology followed in the study; section III presents the results; section IV examines some of the mitigation and adaptation strategies; and section V examines the Special Report on Emission Scenarios (SRES) emission scenarios, with particular reference to A2 and B2.

4
I. REVIEW OF THE LITERATURE
According to Scott et al. (2004), the interrelationship between the weather and tourism has featured in studies dating from the 1930s. In 1936, for example, Selke wrote on the geographic aspects of the German tourist trade. So far, these studies have been few and only in recent times has the literature on tourism started to increase. These tourism studies, as stated by Hamilton and Tol (2007), focused mainly on economic factors and did not include climate variables in the modelling process. The studies had short time-horizons, and climate was taken to be a constant variable. However, there is much evidence to show that climate will change in the long run, and that this change is being hastened by human activities.
More recently, researchers have begun to include climatic variables and, in some cases, a tourism climatic index. One of the first studies on climate change and tourism demand employed temperature to estimate the effect of forecasted changes in temperature on the ski industry in Switzerland (Koenig and Abegg, 1997). The study revealed that, under the present conditions, with prevailing temperature and a snow line of 1,200 m, 4 there was an 85% chance that there would be snow to keep the industry functioning. However, if temperatures were to increase by 2ºC, then only 65% of all Swiss ski areas would be snow reliable. This would clearly have serious implications for the growth of that sector of the industry.
The increasing volume of literature on the impact of climate on tourism demand is due to the recognition that a more precise modelling of tourism demand must include weather and climate, since they are significant influences on the tourism industry. The climatic factors identified as having the most impact on tourism are temperature, sunshine, radiation, precipitation, wind, humidity and fog (Stern, 2006; Hamilton and Lau, 2004). Those factors are significant both to the tourist’s assessment of his or her health and well-being, and to the tourism industry. It is, therefore, essential that those elements be measured and evaluated, since they form an important resource for tourism.
The literature associating climate with tourism implies that changes in climate are likely to affect both the length of the season for tourists and the expected environment. The literature has shown that temperature could potentially have positive implications for the length of the season and for the environment, while other studies have found results to indicate that it has negative implications for tourism. Lise and Tol (2002), using cross-section data, undertook a cross-section analysis on tourists originating in Organization for Economic Cooperation and Development countries and found that the optimal temperature for their destination countries ranged from 21ºC to 24ºC. The implication of this finding is that the predicted increasing global temperatures in certain regions of the world would have devastating effects on the tourist industries of those countries. Hamilton et al. (2005) used a simulation model to investigate the effects of climate change on international tourism using the A1B scenario.5 They found that international tourism is expected to increase in the coming decades, but may become sluggish later on in the century.
Another study, Berrittella et al. (2006), used a computable general equilibrium model to measure the potential effects of climate change. They employed two pathways to capture the impact of climate change, namely, modifications in the composition of final consumption, and international income transfers. The rationale was that spending by visitors has an impact on consumption and income transfers in the domestic economy. The Berrittella et al. (2006) study predicted that, at the international level, 4 In this study it was mentioned that Pfund (1993) illustrated that a minimum altitude of 1,200 m. (the line of snow reliability) is necessary for the ski industry to be a feasible undertaking. 5 The A1 emission scenario is outlined briefly in table 8. The A1B scenario is a subset of the A1 scenarios and emphasizes the technological element of the A1 scenarios; in particular A1B incorporates a balanced weighting on all energy sources.
5
changes in climate would eventually lead to a loss in welfare, and that that loss would be disproportionately spread across the various regions of the world.
Temperature is considered to be the most important climate variable in the analysis of tourism demand because, outside a certain range, it affects comfort. There is evidence to show that other weather parameters are also important, for example, rain, wind and hours of sunshine (Scott and McBoyle, 2006). If any of these parameters is to be included in the analysis of tourism flows, it must be included as a determinant or in an index. Many studies include both temperature and precipitation to examine the impact of climate on tourism demand (for example, see Scott and McBoyle, 2006).
There have been very few studies on the impact of climate change on tourism demand in the Caribbean. One noteworthy microanalysis by Uyarra et al. (2005) examines the significance of environmental characteristics in influencing the choices made by tourists. The study used a self-administered questionnaire on tourists visiting Bonaire and Barbados – 316 from Bonaire and 338 from Barbados. The study established that warm temperatures, clear waters and low health risks were the main environmental attributes important to tourists visiting the islands. The study found that visitors to Bonaire placed additional importance on marine wild life attributes, while tourists going to Barbados had a preference for certain beach characteristics. Uyarra et al. (2005) examined the impact of climate change by asking respondents about the likelihood of their returning to these islands in the event of coral bleaching and sea level rise. They found that more than 80% of the visitors to Bonaire and Barbados would be expected not to return to the islands in the event of these occurrences. Mather et al. (2005) examined the attraction of the Caribbean as a tourist destination for travellers from North America. This study established that the Caribbean subregion is likely to be less attractive to tourists due to factors such as increased temperatures, beach erosion, deterioration of reef quality and greater health risks.
The climate change variables being used in this study (temperature and precipitation) are considered to be significant determinants of tourism in the Caribbean for important reasons. Trenberth et al. (2007) have highlighted the fact that temperatures in the Caribbean region have been warming at a rate ranging from 0.0ºC to 0.5ºC per decade for the period 1971-2000. In a related study, Peterson et al. (2002) have reported that, in the Caribbean the percentage of days with cold temperatures has decreased since the 1950s, while the percentage of days with very warm maximum or minimum temperatures has increased significantly. In relation to precipitation, it was found that the number of heavy rainfall occurrences has been on the increase (Trenberth et al. 2007).
6
III. MODELLING TOURISM DEMAND IN THE CARIBBEAN
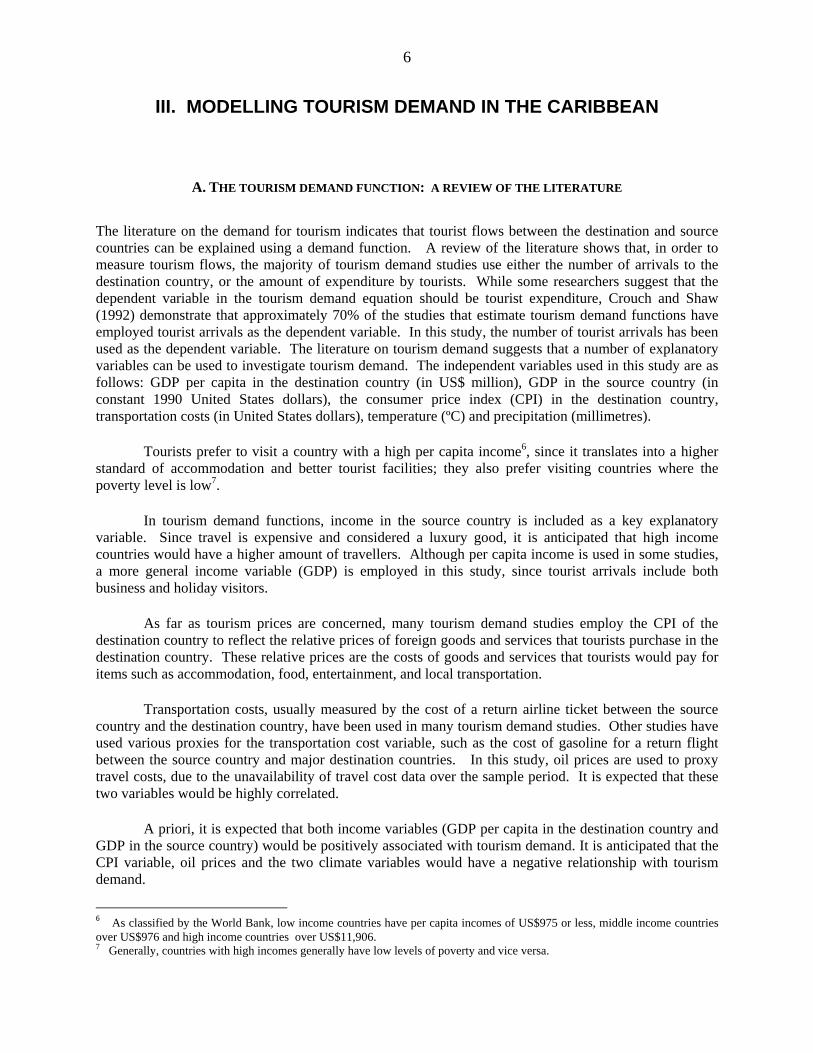
A. THE TOURISM DEMAND FUNCTION: A REVIEW OF THE LITERATURE
The literature on the demand for tourism indicates that tourist flows between the destination and source countries can be explained using a demand function. A review of the literature shows that, in order to measure tourism flows, the majority of tourism demand studies use either the number of arrivals to the destination country, or the amount of expenditure by tourists. While some researchers suggest that the dependent variable in the tourism demand equation should be tourist expenditure, Crouch and Shaw (1992) demonstrate that approximately 70% of the studies that estimate tourism demand functions have employed tourist arrivals as the dependent variable. In this study, the number of tourist arrivals has been used as the dependent variable. The literature on tourism demand suggests that a number of explanatory variables can be used to investigate tourism demand. The independent variables used in this study are as follows: GDP per capita in the destination country (in US$ million), GDP in the source country (in constant 1990 United States dollars), the consumer price index (CPI) in the destination country, transportation costs (in United States dollars), temperature (ºC) and precipitation (millimetres).
Tourists prefer to visit a country with a high per capita income6, since it translates into a higher standard of accommodation and better tourist facilities; they also prefer visiting countries where the poverty level is low7.
In tourism demand functions, income in the source country is included as a key explanatory variable. Since travel is expensive and considered a luxury good, it is anticipated that high income countries would have a higher amount of travellers. Although per capita income is used in some studies, a more general income variable (GDP) is employed in this study, since tourist arrivals include both business and holiday visitors.
As far as tourism prices are concerned, many tourism demand studies employ the CPI of the destination country to reflect the relative prices of foreign goods and services that tourists purchase in the destination country. These relative prices are the costs of goods and services that tourists would pay for items such as accommodation, food, entertainment, and local transportation.
Transportation costs, usually measured by the cost of a return airline ticket between the source country and the destination country, have been used in many tourism demand studies. Other studies have used various proxies for the transportation cost variable, such as the cost of gasoline for a return flight between the source country and major destination countries. In this study, oil prices are used to proxy travel costs, due to the unavailability of travel cost data over the sample period. It is expected that these two variables would be highly correlated.
A priori, it is expected that both income variables (GDP per capita in the destination country and GDP in the source country) would be positively associated with tourism demand. It is anticipated that the CPI variable, oil prices and the two climate variables would have a negative relationship with tourism demand.
6 As classified by the World Bank, low income countries have per capita incomes of US$975 or less, middle income countries over US$976 and high income countries over US$11,906. 7 Generally, countries with high incomes generally have low levels of poverty and vice versa.
7
B. DATA
Several sources were used to collect the data used in the study. Information on tourist arrivals was obtained from the Caribbean Tourism Organization (Sean Smith, Statistical Specialist, pers. comm,). The income variables and the CPI were collected from the International Financial Statistics website (http://www.imfstatistics.org/imf/). Oil prices were obtained from the InflationData.com website (http://www.inflationdata.com) and the two climate variables (temperature and precipitation) were obtained from the Department of Geography Center for Climatic Research of the University of Delaware.
C. METHODOLOGY AND EMPIRICAL MODEL
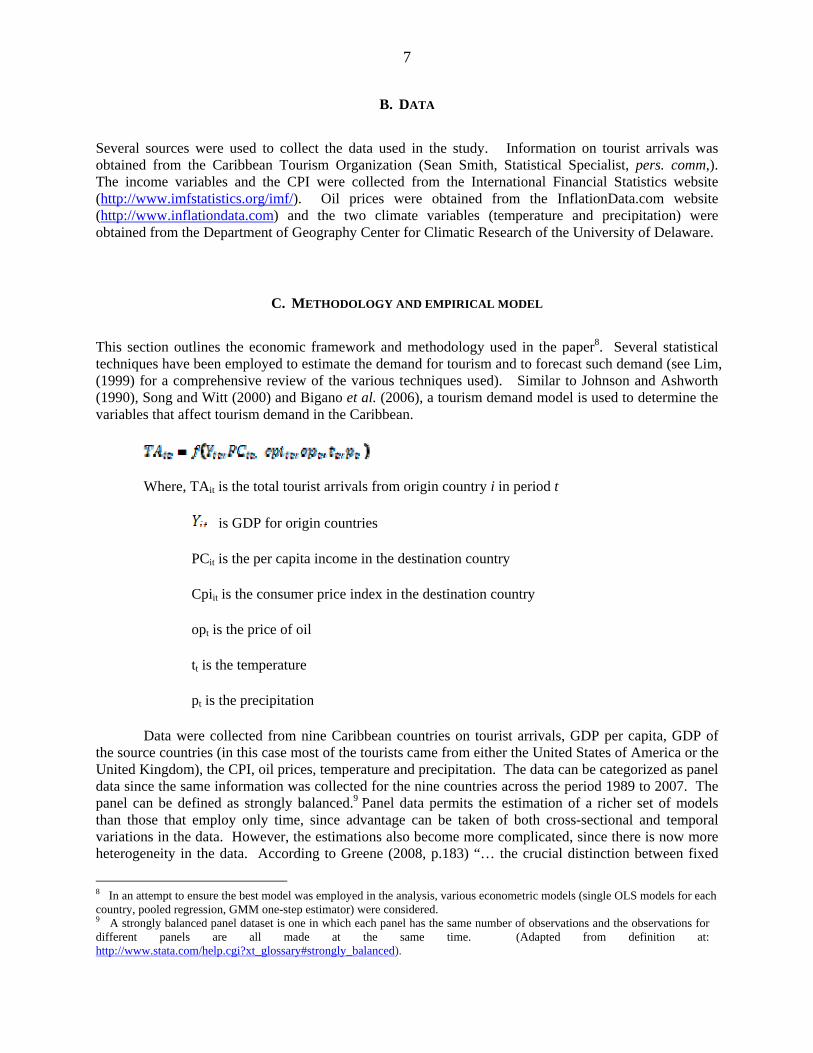
This section outlines the economic framework and methodology used in the paper8. Several statistical techniques have been employed to estimate the demand for tourism and to forecast such demand (see Lim, (1999) for a comprehensive review of the various techniques used). Similar to Johnson and Ashworth (1990), Song and Witt (2000) and Bigano et al. (2006), a tourism demand model is used to determine the variables that affect tourism demand in the Caribbean.
Where, TAit is the total tourist arrivals from origin country i in period t
is GDP for origin countries
PCit is the per capita income in the destination country
Cpiit is the consumer price index in the destination country
opt is the price of oil
tt is the temperature
pt is the precipitation
Data were collected from nine Caribbean countries on tourist arrivals, GDP per capita, GDP of the source countries (in this case most of the tourists came from either the United States of America or the United Kingdom), the CPI, oil prices, temperature and precipitation. The data can be categorized as panel data since the same information was collected for the nine countries across the period 1989 to 2007. The panel can be defined as strongly balanced.9 Panel data permits the estimation of a richer set of models than those that employ only time, since advantage can be taken of both cross-sectional and temporal variations in the data. However, the estimations also become more complicated, since there is now more heterogeneity in the data. According to Greene (2008, p.183) “… the crucial distinction between fixed
8 In an attempt to ensure the best model was employed in the analysis, various econometric models (single OLS models for each country, pooled regression, GMM one-step estimator) were considered. 9 A strongly balanced panel dataset is one in which each panel has the same number of observations and the observations for different panels are all made at the same time. (Adapted from definition at: http://www.stata.com/help.cgi?xt_glossary#strongly_balanced).

8
and random effects is whether the unobserved individual effect embodies elements that are correlated with the regressors in the model, not whether these effects are stochastic or not.” The Hausman test was used to determine whether or not the model should be one that takes into consideration fixed effects or random effects of the data. The results indicate that the random effects model should be employed, in other words, an insignificant p-value was obtained (p-value > 0.05). The random effects model is employed, which uses a weighted average of the between- and within- variation in the data, and can accommodate within-unit serial correlation. The random effects panel data model of tourism demand (log-log specification) employed in this study is assumed to take the following form:
where, is tourist arrivals in the nine destination Caribbean countries (i = country; t = time)
is the coefficient for the six independent variables
is per capita income for the destination country
is Gross Domestic Product for origin countries
is the Consumer Price Index for the destination countries
is the price of oil (proxy for travel cost)
is the temperature in the destination countries
is the precipitation in the destination countries
is the intercept
is the combined time series and cross-section error components
is the cross-section, or country-specific error component
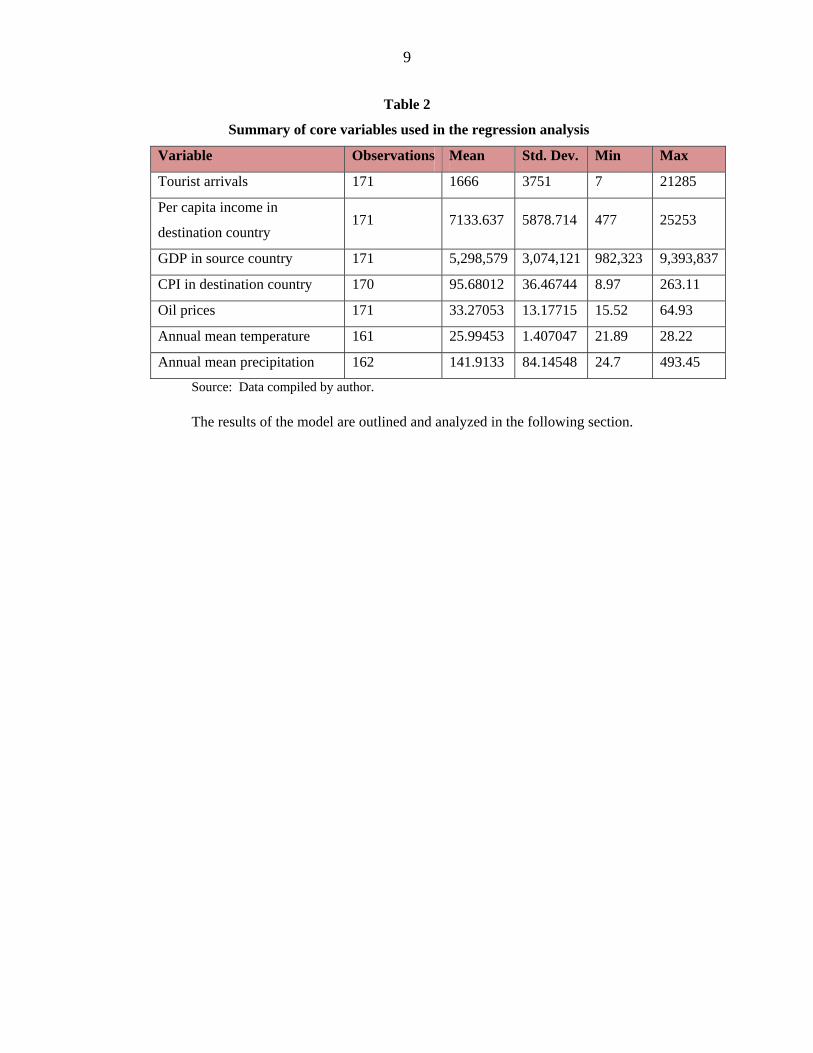
The double log model, reported by Lim (1999), is one of the more popular model specifications. The variables (in level) used in the model are summarized in table 2. The data indicate that, in the present sample of nine Caribbean countries, the average annual number of tourist arrivals over the period 1989 to 2007 was 166,600 persons. The average price of a barrel of oil was US$33.27. The temperature variable is significant: the annual mean temperature experienced is 26ºC. The study by Lise and Tol (2002) found that the optimal temperature for comfort ranged between 21ºC and 24ºC, with the optimal temperature for tourists from the countries of major interest to the Caribbean (the United States of America or the United Kingdom) being approximately 23ºC. The average temperature of the Caribbean is a solid 3ºC higher than the optimal temperature for tourism of its major source countries.
9
Table 2
Summary of core variables used in the regression analysis
Variable Observations Mean Std. Dev. Min Max
Tourist arrivals 171 1666 3751 7 21285
Per capita income in
destination country 171 7133.637 5878.714 477 25253
GDP in source country 171 5,298,579 3,074,121 982,323 9,393,837
CPI in destination country 170 95.68012 36.46744 8.97 263.11
Oil prices 171 33.27053 13.17715 15.52 64.93
Annual mean temperature 161 25.99453 1.407047 21.89 28.22
Annual mean precipitation 162 141.9133 84.14548 24.7 493.45
Source: Data compiled by author.
The results of the model are outlined and analyzed in the following section.
10
III. RESULTS
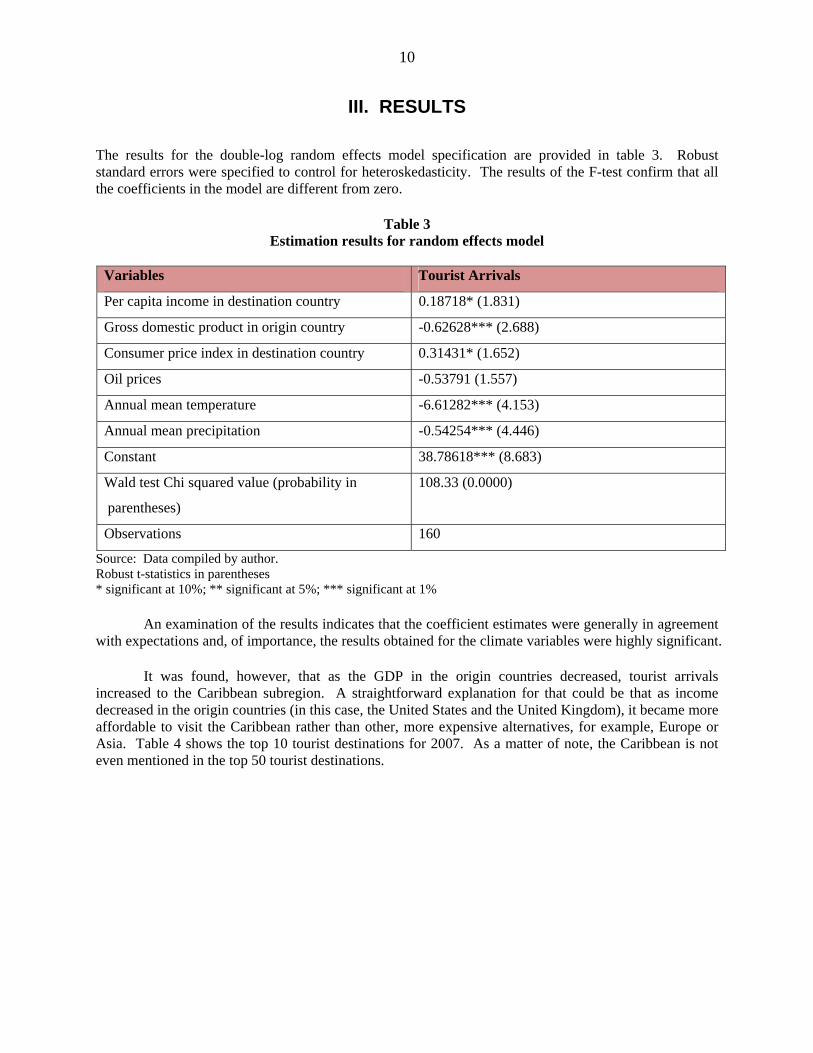
The results for the double-log random effects model specification are provided in table 3. Robust standard errors were specified to control for heteroskedasticity. The results of the F-test confirm that all the coefficients in the model are different from zero.
Table 3 Estimation results for random effects model
Variables Tourist Arrivals
Per capita income in destination country 0.18718* (1.831)
Gross domestic product in origin country -0.62628*** (2.688)
Consumer price index in destination country 0.31431* (1.652)
Oil prices -0.53791 (1.557)
Annual mean temperature -6.61282*** (4.153)
Annual mean precipitation -0.54254*** (4.446)
Constant 38.78618*** (8.683)
Wald test Chi squared value (probability in
parentheses)
108.33 (0.0000)
Observations 160
Source: Data compiled by author. Robust t-statistics in parentheses * significant at 10%; ** significant at 5%; *** significant at 1%
An examination of the results indicates that the coefficient estimates were generally in agreement with expectations and, of importance, the results obtained for the climate variables were highly significant.
It was found, however, that as the GDP in the origin countries decreased, tourist arrivals increased to the Caribbean subregion. A straightforward explanation for that could be that as income decreased in the origin countries (in this case, the United States and the United Kingdom), it became more affordable to visit the Caribbean rather than other, more expensive alternatives, for example, Europe or Asia. Table 4 shows the top 10 tourist destinations for 2007. As a matter of note, the Caribbean is not even mentioned in the top 50 tourist destinations.

11
Table 4 Top ten tourist destinations for 2007
Country Tourist Arrivals
(millions) France 81.9 Spain 59.2 United States 56.0 China 54.7 Italy 43.7 United Kingdom 30.7 Germany 24.4 Ukraine 23.1 Turkey 22.2 Mexico 21.4
Source: UNWTO World Tourism Barometer 4(2), 2008
It was also found that, as the CPI in the destination country increases, so do tourist arrivals. Again, this could be because the Caribbean, even with increasing prices, provides a still cheaper alternative than other tourist destinations.
The expected results were received for the two climate variables: essentially, as temperatures increase, tourist arrivals decrease. Similarly, as rainfall increases, tourist arrivals decrease. This has grim implications for tourist arrivals to the Caribbean due the predicted increases in temperature under the various weather scenarios put forward by the Intergovernmental Panel on Climate Change (IPCC) in their SRES. The results of the model indicate that precipitation is expected to affect tourism to a much smaller degree than temperature (the model yielded a temperature coefficient of -6.61, whereas the precipitation coefficient was -0.54254). Furthermore, according to the IPCC predictions, precipitation is expected to decline in certain Caribbean countries. The literature on tourism demand has pointed to the fact that tourists prefer dry holiday locations rather than wet ones (Lise and Tole, 2002), therefore, according to the results of the model, as the climate changes in some countries and less precipitation is observed, the impact on tourism would be positive.
12
IV. FORECASTING THE COST OF CLIMATE CHANGE
A. FORECASTED CLIMATE CHANGE IMPACTS AT NINE TOURIST DESTINATIONS IN THE CARIBBEAN
The estimated tourism demand model satisfied demand theory, passed the various hypothesis tests, and reported significant results. The next stage of the analysis requires that the demand model be used to make forecasts for the rest of this century for the Caribbean countries under study.
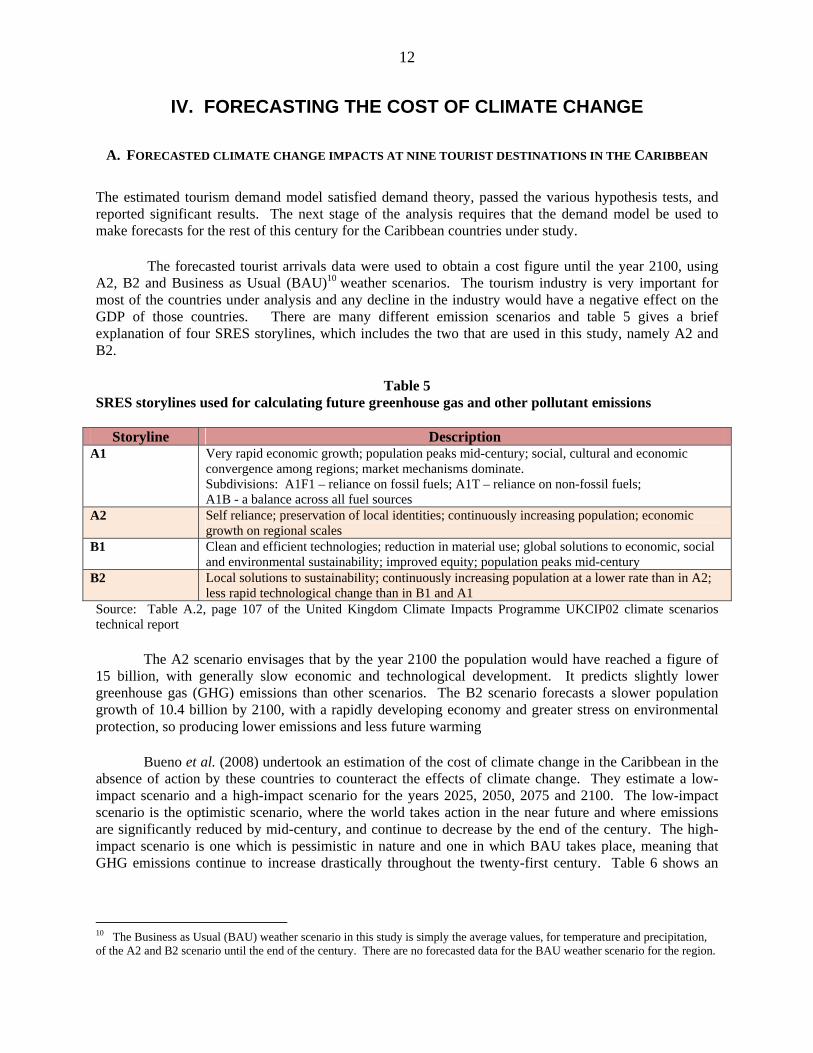
The forecasted tourist arrivals data were used to obtain a cost figure until the year 2100, using A2, B2 and Business as Usual (BAU)10 weather scenarios. The tourism industry is very important for most of the countries under analysis and any decline in the industry would have a negative effect on the GDP of those countries. There are many different emission scenarios and table 5 gives a brief explanation of four SRES storylines, which includes the two that are used in this study, namely A2 and B2.
Table 5 SRES storylines used for calculating future greenhouse gas and other pollutant emissions
Storyline Description A1 Very rapid economic growth; population peaks mid-century; social, cultural and economic
convergence among regions; market mechanisms dominate. Subdivisions: A1F1 – reliance on fossil fuels; A1T – reliance on non-fossil fuels; A1B - a balance across all fuel sources
A2 Self reliance; preservation of local identities; continuously increasing population; economic growth on regional scales
B1 Clean and efficient technologies; reduction in material use; global solutions to economic, social and environmental sustainability; improved equity; population peaks mid-century
B2 Local solutions to sustainability; continuously increasing population at a lower rate than in A2; less rapid technological change than in B1 and A1
Source: Table A.2, page 107 of the United Kingdom Climate Impacts Programme UKCIP02 climate scenarios technical report
The A2 scenario envisages that by the year 2100 the population would have reached a figure of 15 billion, with generally slow economic and technological development. It predicts slightly lower greenhouse gas (GHG) emissions than other scenarios. The B2 scenario forecasts a slower population growth of 10.4 billion by 2100, with a rapidly developing economy and greater stress on environmental protection, so producing lower emissions and less future warming
Bueno et al. (2008) undertook an estimation of the cost of climate change in the Caribbean in the absence of action by these countries to counteract the effects of climate change. They estimate a low-impact scenario and a high-impact scenario for the years 2025, 2050, 2075 and 2100. The low-impact scenario is the optimistic scenario, where the world takes action in the near future and where emissions are significantly reduced by mid-century, and continue to decrease by the end of the century. The high-impact scenario is one which is pessimistic in nature and one in which BAU takes place, meaning that GHG emissions continue to increase drastically throughout the twenty-first century. Table 6 shows an
10 The Business as Usual (BAU) weather scenario in this study is simply the average values, for temperature and precipitation, of the A2 and B2 scenario until the end of the century. There are no forecasted data for the BAU weather scenario for the region.

13
extract of the table presented in their study.11 The data in the table reveal that under both the high- and low-impact scenarios, all of the Caribbean countries have much to lose in the tourism industry.
Table 6 Cost of low-impact and high- impact scenarios for tourism in selected Caribbean countries
Low-impact scenario
(US$ billion)
High-impact scenario
(US$ billion)
Country GDP
(US$
billion) 2025 2050 2075 2100 2025 2050 2075 2100
Aruba 2.35 0.02 0.04 0.06 0.08 0.10 0.20 0.30 0.40
Barbados 2.54 0.02 0.03 0.05 0.07 0.09 0.17 0.26 0.35
Dominican
Republic
20.52 0.07 0.14 0.21 0.28 0.36 0.71 1.07 1.43
Jamaica 8.77 0.04 0.07 0.11 0.15 0.18 0.37 0.55 0.74
Montserrat 0.03 0.00 0.00 0.00 0.00 0.00 0.00 0.00 0.00
Netherlands
Antilles
2.70 0.02 0.04 0.06 0.07 0.09 0.18 0.28 0.37
Saint Lucia 0.70 0.01 0.01 0.02 0.02 0.03 0.05 0.08 0.11
Trinidad and
Tobago
12.61 0.01 0.02 0.02 0.03 0.04 0.08 0.12 0.16
Source: Bueno et al. (2008)
Using low- and high-impact climate scenarios,12 and examining the impact of rising temperatures in the subregion (12 Caribbean Community countries), a study by Margaree Consultants Limited (2002) suggests that, on an annual basis, for the low-impact scenario the Caribbean stands to lose US$715 million in tourist expenditure, while for the high-impact scenario tourism expenditures are reduced by US$1,430 million. In terms of the cost to tourist facilities due to sea level rise,13 it was determined that on an annual basis it would cost US$9 million, and US$80 million, to replace hotels due to sea level rise under the low- and high-impact weather scenarios, respectively. An evaluation of the loss in tourism income due to the loss of beaches and ecosystems was also carried out in the same study, by examining the fraction of beach area lost in conjunction with the amount that tourists spend on enjoying the ‘sun, sea and sand’. At an annual rate, the loss would be US$550 million in the low-case scenario and US$2.4 billion in the high-case scenario.
11 Guyana was not included in the Bueno et al. (2008) study. 12 Figures for temperature were based on the Intergovernmental Panel on Climate Change (IPCC) Third Assessment Report (2001) - an increase of 2°C for the low-impact scenario and an increase of 3.3°C for the high-impact scenario. 13 According to the estimates by Margaree Consultants Limited (2002), the sea level is expected to rise between 0.5 (low impact scenario) and 2.0 (high impact scenario) metres by 2100.

14
B. PROJECTIONS FOR EXTREME EVENTS
In this section of the paper, projections regarding extreme events are made using three weather scenarios: A2, B2 and BAU.
C. METHODOLOGY
A tourism demand model was used to estimate the costs of temperature and precipitation on the tourism sector in the nine Caribbean countries. This model and results of the model, as relates to the effects of temperature and precipitation, were outlined in section III of this paper. Costing of the climate change effects required forecasting of the variables in the model: per capita income and CPI of the Caribbean countries included in the study, GDP of the source or origin countries (primarily the United States and United Kingdom), oil prices, and the temperature and precipitation of the nine countries. Forecasts up to the year 2100 of these non-climatic variables are not available for any of the nine countries. Therefore, forecasting techniques were employed to estimate these variables. With respect to the climate variables, forecasts for both variables were received from the Institute of Meteorology in Cuba (INSMET). The predictions from INSMET were obtained from the European Centre Hamburg Model, an atmospheric general circulation model developed at the Max Planck Institute for Meteorology. The annual cost of climate change impacts to 2100 is estimated in United States dollars, using 2007 as the comparator and base year. To expand, the income from tourism was forecasted using the tourism model and the ARIMA forecast modelling technique. These forecasted income figures were then used to generate the cost from changes in the climate using 2007 as the comparator year. Additionally, the costs generated were then expressed in constant 2007 United States dollars. This method is frequently used in the literature (for example, (see Haites, 2002) and is considered standard.
However, apart from temperature and precipitation and its effects on the tourism sector, there are other climate variables that have the potential to negatively affect the tourism sector, in particular, increases in the occurrence of extreme events, sea level rise, and extreme destruction of ecosystems due to ocean acidification. Due to lack of data, the methodology used for this part of the study was adopted from Toba (2009). These costs do not take into consideration the indirect costs (for example, the loss of employment) associated with changes in temperature and precipitation, extreme events, sea level rise and ecosystem destruction. It must be noted that most of the results obtained from existing research on economic effects of climate change in the Caribbean are not directly comparable to each other and to this study, since many variations exist with respect to the number of countries used in the studies, the sectors examined, and the data and methodologies employed.
15
D. RESULTS
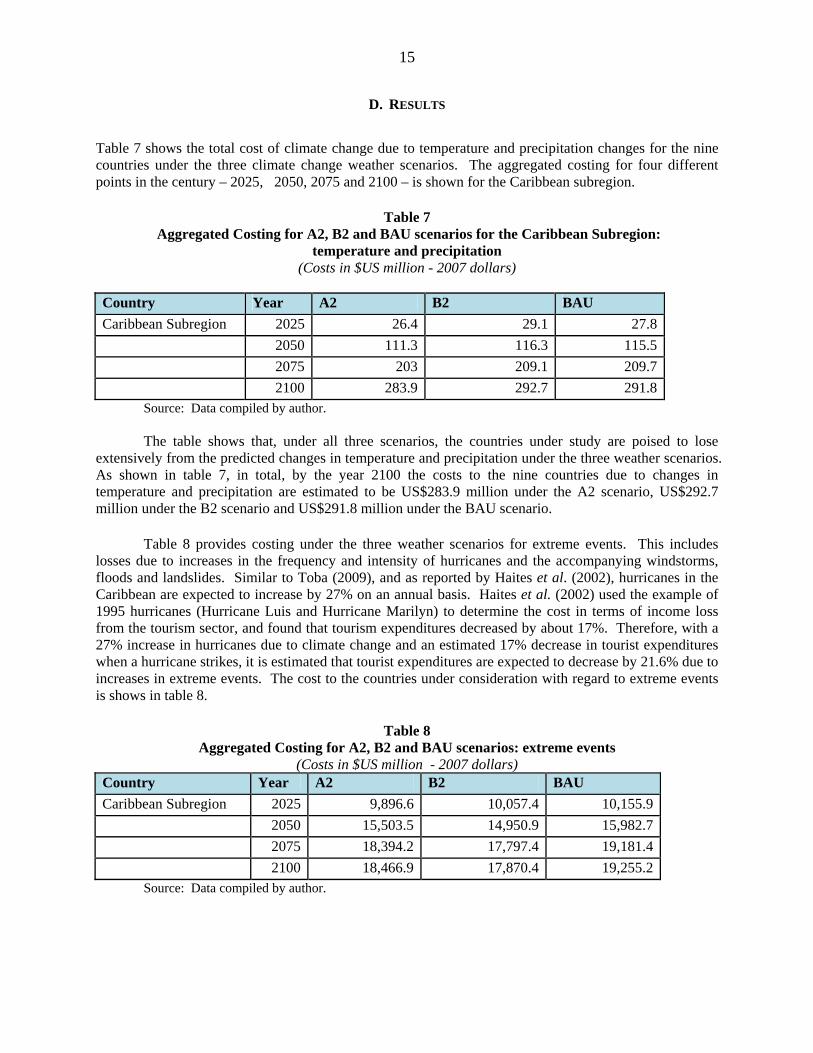
Table 7 shows the total cost of climate change due to temperature and precipitation changes for the nine countries under the three climate change weather scenarios. The aggregated costing for four different points in the century – 2025, 2050, 2075 and 2100 – is shown for the Caribbean subregion.
Table 7 Aggregated Costing for A2, B2 and BAU scenarios for the Caribbean Subregion:
temperature and precipitation (Costs in $US million - 2007 dollars)
Country Year A2 B2 BAU Caribbean Subregion 2025 26.4 29.1 27.8 2050 111.3 116.3 115.5 2075 203 209.1 209.7 2100 283.9 292.7 291.8
Source: Data compiled by author. The table shows that, under all three scenarios, the countries under study are poised to lose
extensively from the predicted changes in temperature and precipitation under the three weather scenarios. As shown in table 7, in total, by the year 2100 the costs to the nine countries due to changes in temperature and precipitation are estimated to be US$283.9 million under the A2 scenario, US$292.7 million under the B2 scenario and US$291.8 million under the BAU scenario.
Table 8 provides costing under the three weather scenarios for extreme events. This includes losses due to increases in the frequency and intensity of hurricanes and the accompanying windstorms, floods and landslides. Similar to Toba (2009), and as reported by Haites et al. (2002), hurricanes in the Caribbean are expected to increase by 27% on an annual basis. Haites et al. (2002) used the example of 1995 hurricanes (Hurricane Luis and Hurricane Marilyn) to determine the cost in terms of income loss from the tourism sector, and found that tourism expenditures decreased by about 17%. Therefore, with a 27% increase in hurricanes due to climate change and an estimated 17% decrease in tourist expenditures when a hurricane strikes, it is estimated that tourist expenditures are expected to decrease by 21.6% due to increases in extreme events. The cost to the countries under consideration with regard to extreme events is shows in table 8.
Table 8 Aggregated Costing for A2, B2 and BAU scenarios: extreme events
(Costs in $US million - 2007 dollars) Country Year A2 B2 BAU Caribbean Subregion 2025 9,896.6 10,057.4 10,155.9 2050 15,503.5 14,950.9 15,982.7 2075 18,394.2 17,797.4 19,181.4 2100 18,466.9 17,870.4 19,255.2
Source: Data compiled by author.
16
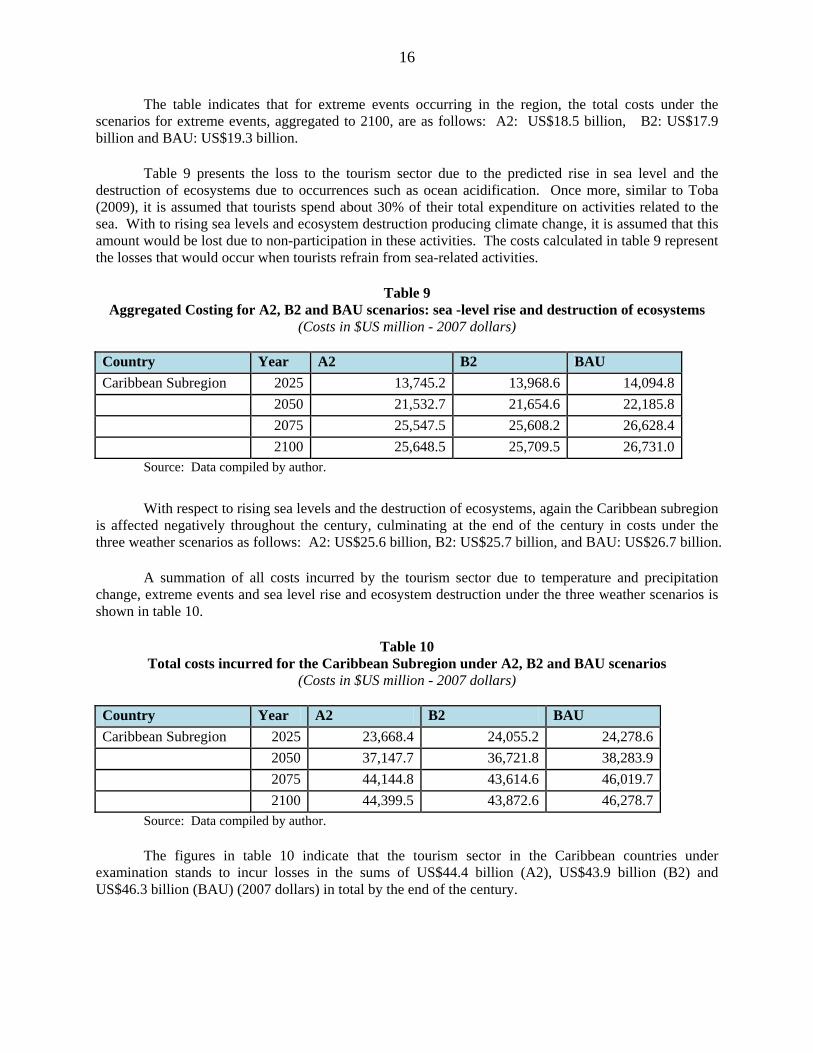
The table indicates that for extreme events occurring in the region, the total costs under the scenarios for extreme events, aggregated to 2100, are as follows: A2: US$18.5 billion, B2: US$17.9 billion and BAU: US$19.3 billion.
Table 9 presents the loss to the tourism sector due to the predicted rise in sea level and the destruction of ecosystems due to occurrences such as ocean acidification. Once more, similar to Toba (2009), it is assumed that tourists spend about 30% of their total expenditure on activities related to the sea. With to rising sea levels and ecosystem destruction producing climate change, it is assumed that this amount would be lost due to non-participation in these activities. The costs calculated in table 9 represent the losses that would occur when tourists refrain from sea-related activities.
Table 9 Aggregated Costing for A2, B2 and BAU scenarios: sea -level rise and destruction of ecosystems
(Costs in $US million - 2007 dollars)
Country Year A2 B2 BAU Caribbean Subregion 2025 13,745.2 13,968.6 14,094.8 2050 21,532.7 21,654.6 22,185.8 2075 25,547.5 25,608.2 26,628.4 2100 25,648.5 25,709.5 26,731.0
Source: Data compiled by author.
With respect to rising sea levels and the destruction of ecosystems, again the Caribbean subregion is affected negatively throughout the century, culminating at the end of the century in costs under the three weather scenarios as follows: A2: US$25.6 billion, B2: US$25.7 billion, and BAU: US$26.7 billion.
A summation of all costs incurred by the tourism sector due to temperature and precipitation change, extreme events and sea level rise and ecosystem destruction under the three weather scenarios is shown in table 10.
Table 10 Total costs incurred for the Caribbean Subregion under A2, B2 and BAU scenarios
(Costs in $US million - 2007 dollars)
Country Year A2 B2 BAU Caribbean Subregion 2025 23,668.4 24,055.2 24,278.6 2050 37,147.7 36,721.8 38,283.9 2075 44,144.8 43,614.6 46,019.7 2100 44,399.5 43,872.6 46,278.7
Source: Data compiled by author.
The figures in table 10 indicate that the tourism sector in the Caribbean countries under examination stands to incur losses in the sums of US$44.4 billion (A2), US$43.9 billion (B2) and US$46.3 billion (BAU) (2007 dollars) in total by the end of the century.
17
V. ADAPTATION AND MITIGATION STRATEGIES
A. ADAPTATION STRATEGIES
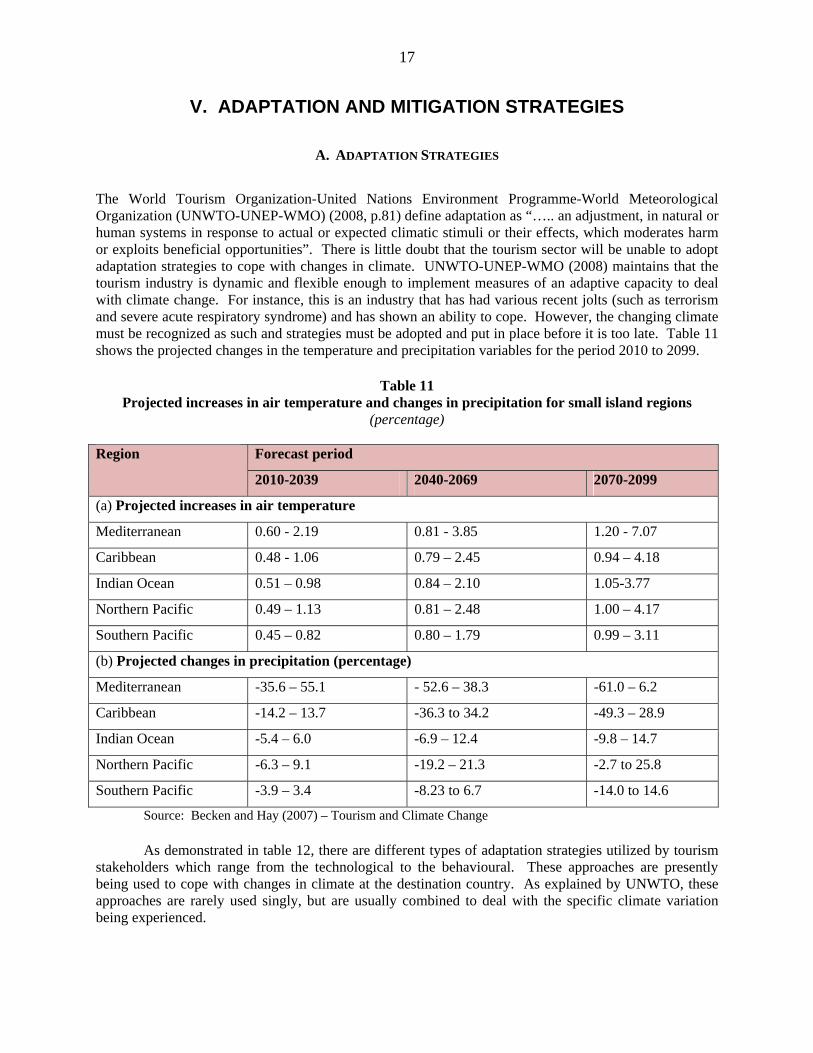
The World Tourism Organization-United Nations Environment Programme-World Meteorological Organization (UNWTO-UNEP-WMO) (2008, p.81) define adaptation as “….. an adjustment, in natural or human systems in response to actual or expected climatic stimuli or their effects, which moderates harm or exploits beneficial opportunities”. There is little doubt that the tourism sector will be unable to adopt adaptation strategies to cope with changes in climate. UNWTO-UNEP-WMO (2008) maintains that the tourism industry is dynamic and flexible enough to implement measures of an adaptive capacity to deal with climate change. For instance, this is an industry that has had various recent jolts (such as terrorism and severe acute respiratory syndrome) and has shown an ability to cope. However, the changing climate must be recognized as such and strategies must be adopted and put in place before it is too late. Table 11 shows the projected changes in the temperature and precipitation variables for the period 2010 to 2099.
Table 11 Projected increases in air temperature and changes in precipitation for small island regions
(percentage)
Forecast period Region
2010-2039 2040-2069 2070-2099
(a) Projected increases in air temperature
Mediterranean 0.60 - 2.19 0.81 - 3.85 1.20 - 7.07
Caribbean 0.48 - 1.06 0.79 – 2.45 0.94 – 4.18
Indian Ocean 0.51 – 0.98 0.84 – 2.10 1.05-3.77
Northern Pacific 0.49 – 1.13 0.81 – 2.48 1.00 – 4.17
Southern Pacific 0.45 – 0.82 0.80 – 1.79 0.99 – 3.11
(b) Projected changes in precipitation (percentage)
Mediterranean -35.6 – 55.1 - 52.6 – 38.3 -61.0 – 6.2
Caribbean -14.2 – 13.7 -36.3 to 34.2 -49.3 – 28.9
Indian Ocean -5.4 – 6.0 -6.9 – 12.4 -9.8 – 14.7
Northern Pacific -6.3 – 9.1 -19.2 – 21.3 -2.7 to 25.8
Southern Pacific -3.9 – 3.4 -8.23 to 6.7 -14.0 to 14.6
Source: Becken and Hay (2007) – Tourism and Climate Change
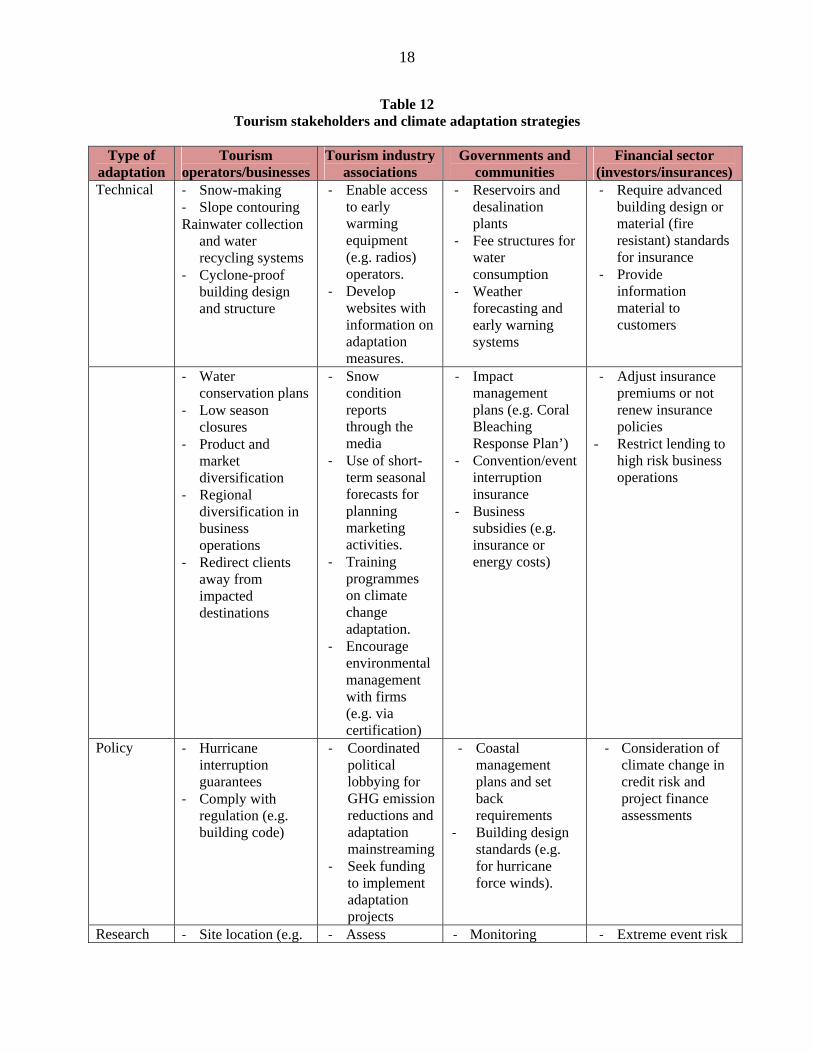
As demonstrated in table 12, there are different types of adaptation strategies utilized by tourism stakeholders which range from the technological to the behavioural. These approaches are presently being used to cope with changes in climate at the destination country. As explained by UNWTO, these approaches are rarely used singly, but are usually combined to deal with the specific climate variation being experienced.
18
Table 12 Tourism stakeholders and climate adaptation strategies
Type of
adaptation Tourism
operators/businesses Tourism industry
associations Governments and
communities Financial sector
(investors/insurances) Technical ‐ Snow-making
‐ Slope contouring Rainwater collection
and water recycling systems
‐ Cyclone-proof building design and structure
‐ Enable access to early warming equipment (e.g. radios) operators.
‐ Develop websites with information on adaptation measures.
‐ Reservoirs and desalination plants
‐ Fee structures for water consumption
‐ Weather forecasting and early warning systems
‐ Require advanced building design or material (fire resistant) standards for insurance
‐ Provide information material to customers
‐ Water conservation plans
‐ Low season closures
‐ Product and market diversification
‐ Regional diversification in business operations
‐ Redirect clients away from impacted destinations
‐ Snow condition reports through the media
‐ Use of short-term seasonal forecasts for planning marketing activities.
‐ Training programmes on climate change adaptation.
‐ Encourage environmental management with firms (e.g. via certification)
‐ Impact management plans (e.g. Coral Bleaching Response Plan’)
‐ Convention/event interruption insurance
‐ Business subsidies (e.g. insurance or energy costs)
‐ Adjust insurance premiums or not renew insurance policies
- Restrict lending to high risk business operations
Policy ‐ Hurricane interruption guarantees
‐ Comply with regulation (e.g. building code)
‐ Coordinated political lobbying for GHG emission reductions and adaptation mainstreaming
‐ Seek funding to implement adaptation projects
‐ Coastal management plans and set back requirements
‐ Building design standards (e.g. for hurricane force winds).
‐ Consideration of climate change in credit risk and project finance assessments
Research ‐ Site location (e.g. ‐ Assess ‐ Monitoring ‐ Extreme event risk
19
north facing slopes, higher elevations for ski areas)
awareness of businesses and tourists, as well as knowledge gaps.
programs (.e.g. predict bleaching or avalanche risk, beach water quality)
exposure
Education ‐ Water conservation education for employees and guests
‐ Public education campaign
‐ Water conservation campaigns
‐ Campaigns on the dangers of UV radiation
‐ Educate/inform potential and existing customers
Behavioural ‐ Real-time webcams of snow conditions
‐ GHG emission offset programs
‐ GHG emission offset programs
‐ Water conservation initiatives
‐ Extreme event recovery marketing
‐ Good practice in-house.
Source: World Trade Organization (2008)
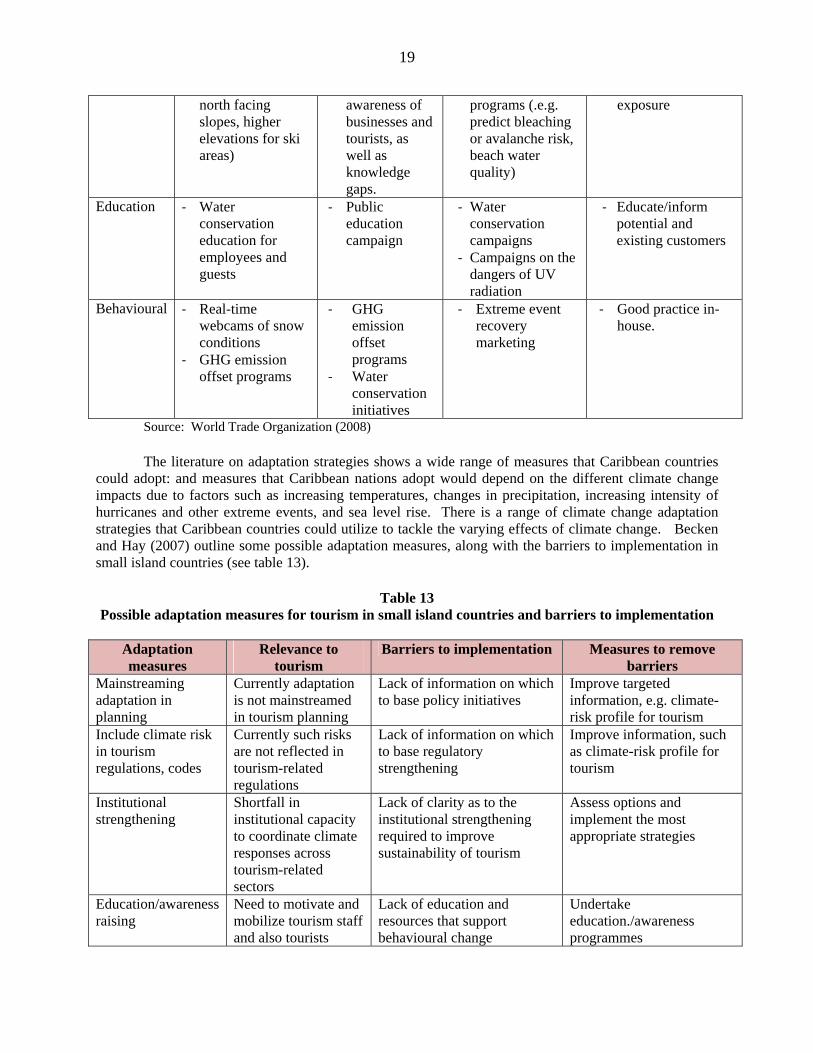
The literature on adaptation strategies shows a wide range of measures that Caribbean countries could adopt: and measures that Caribbean nations adopt would depend on the different climate change impacts due to factors such as increasing temperatures, changes in precipitation, increasing intensity of hurricanes and other extreme events, and sea level rise. There is a range of climate change adaptation strategies that Caribbean countries could utilize to tackle the varying effects of climate change. Becken and Hay (2007) outline some possible adaptation measures, along with the barriers to implementation in small island countries (see table 13).
Table 13 Possible adaptation measures for tourism in small island countries and barriers to implementation
Adaptation measures
Relevance to tourism
Barriers to implementation Measures to remove barriers
Mainstreaming adaptation in planning
Currently adaptation is not mainstreamed in tourism planning
Lack of information on which to base policy initiatives
Improve targeted information, e.g. climate-risk profile for tourism
Include climate risk in tourism regulations, codes
Currently such risks are not reflected in tourism-related regulations
Lack of information on which to base regulatory strengthening
Improve information, such as climate-risk profile for tourism
Institutional strengthening
Shortfall in institutional capacity to coordinate climate responses across tourism-related sectors
Lack of clarity as to the institutional strengthening required to improve sustainability of tourism
Assess options and implement the most appropriate strategies
Education/awareness raising
Need to motivate and mobilize tourism staff and also tourists
Lack of education and resources that support behavioural change
Undertake education./awareness programmes

20
Shade provision and crop diversification
Additional shade increases tourist comfort
Lack of awareness of growing heat stress for people and crops
Identify, evaluate and implement measures to reduce heat stress
Reduce tourism pressures on coral
Reefs are a major tourist attraction
Reducing pressures without degrading tourist experience
Improve off-island tourism waste management
Reduce tourism pressures on other marine resources
Increased productivity of marine resources increases well-being of tourism-dependent communities
Unsustainable harvesting practices and lack of enforcement of regulations and laws
Strengthen community-based management of marine resources, including land-based issues
‘Soft’ coastal protection
Many valuable tourism assets at growing risk from coastal erosion
Lack of credible options that have been demonstrated and accepted
Demonstration of protection for tourism assets and communities
Improved insurance cover
Growing likelihood that tourists and operators will make insurance claims
Lack of access to affordable insurance
Ensure insurance sector is aware of actual risk levels and adjust premiums
Desalination, rainwater catchments and storage
Tourist resorts are major consumers of fresh water
Lack of information on future security of freshwater supplies
Provide and ensure utilization of targeted information, based on climate risk profile.
Drainage and pumping systems
Important services for tourist resorts and for tourism-dependent communities
Wasteful practices; lack of information to design adequate systems
Provide and ensure utilization of targeted information, based on climate risk profile.
Enhanced design and siting standards
Many valuable tourism assets at growing risk from climate extremes
Lack of information needed to strengthen design and siting standards.
Provide and ensure utilization of targeted information.
Tourism activity/product diversification
Need to reduce dependency of tourism on ‘sun, sea and sand’
Lack of credible alternatives that have been demonstrated and accepted
Identify and evaluate alternative activities and demonstrate their feasibility.
Source: Becken and Hay (2007) – Tourism and Climate Change
The Stern Review (2006) has emphasized that it is more cost effective to implement techniques that are proactive rather than reactive, and to support no-regrets measures. In the event that there is no major change in climate, the proactive, no-regrets strategies will still be valuable and economical. As an example, the literature on climate change risk assessment of tourism operators (Elsasser and Burki, 2002; Scott et al. 2002; Becken, 2004) has revealed that they have minimal knowledge of climate change and that there is a subsequent lack of long-term planning in the event of future climate changes. This indicates that there is an urgent need to educate and ensure that tourism policymakers, who formulate policies for both the private and public sectors, are aware that the climate is changing and that the tourism industry has to adapt to the change or face decline.
An estimation of the cost of adaptation is a complex one which depends significantly on the determinants of the adaptive capacity of countries in the Caribbean subregion. The IPCC (2001), drawing from Smit et al. (1999), categorized determinants of adaptive capacity, including issues such as the
21
availability of technological resources, the organization of essential institutional and decision-making bodies, the stock of human and social capital, information management, and public perception.
A. MITIGATION STRATEGIES
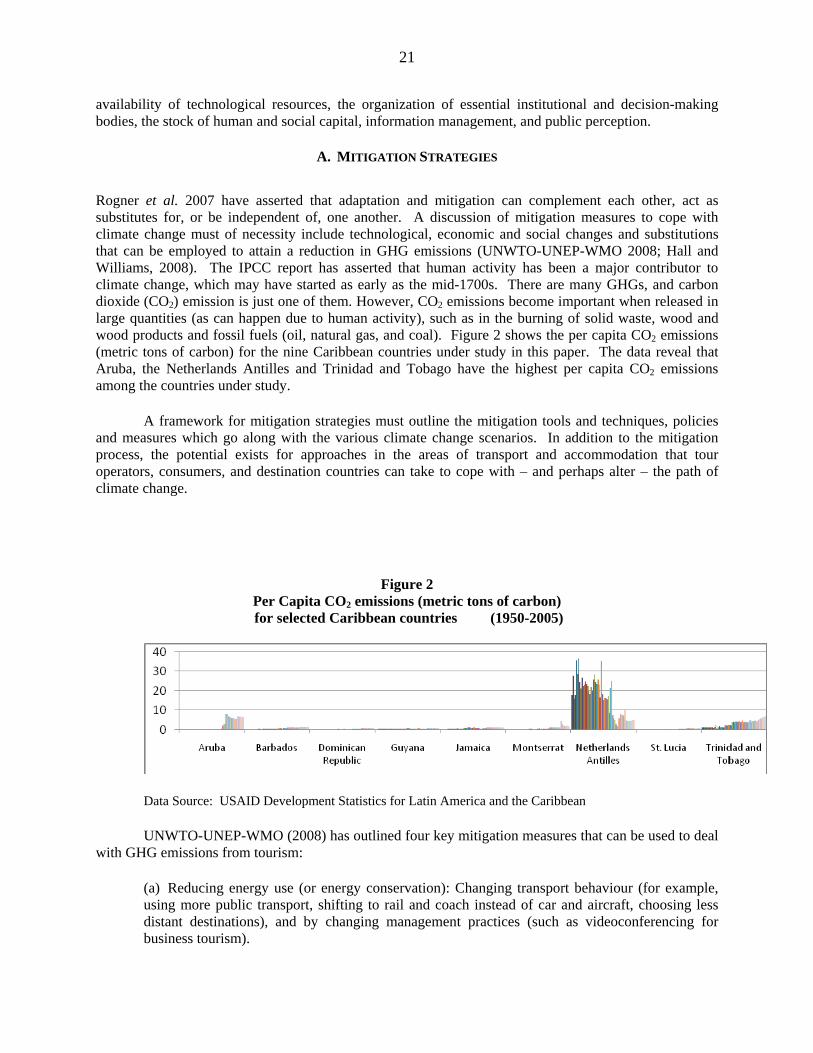
Rogner et al. 2007 have asserted that adaptation and mitigation can complement each other, act as substitutes for, or be independent of, one another. A discussion of mitigation measures to cope with climate change must of necessity include technological, economic and social changes and substitutions that can be employed to attain a reduction in GHG emissions (UNWTO-UNEP-WMO 2008; Hall and Williams, 2008). The IPCC report has asserted that human activity has been a major contributor to climate change, which may have started as early as the mid-1700s. There are many GHGs, and carbon dioxide (CO2) emission is just one of them. However, CO2 emissions become important when released in large quantities (as can happen due to human activity), such as in the burning of solid waste, wood and wood products and fossil fuels (oil, natural gas, and coal). Figure 2 shows the per capita CO2 emissions (metric tons of carbon) for the nine Caribbean countries under study in this paper. The data reveal that Aruba, the Netherlands Antilles and Trinidad and Tobago have the highest per capita CO2 emissions among the countries under study.
A framework for mitigation strategies must outline the mitigation tools and techniques, policies and measures which go along with the various climate change scenarios. In addition to the mitigation process, the potential exists for approaches in the areas of transport and accommodation that tour operators, consumers, and destination countries can take to cope with – and perhaps alter – the path of climate change.
Figure 2
Per Capita CO2 emissions (metric tons of carbon) for selected Caribbean countries (1950-2005)
Data Source: USAID Development Statistics for Latin America and the Caribbean
UNWTO-UNEP-WMO (2008) has outlined four key mitigation measures that can be used to deal with GHG emissions from tourism:
(a) Reducing energy use (or energy conservation): Changing transport behaviour (for example, using more public transport, shifting to rail and coach instead of car and aircraft, choosing less distant destinations), and by changing management practices (such as videoconferencing for business tourism).
22
(b) Improving energy efficiency: The use of new and innovative technology to decrease energy demand (usually by carrying out the same operation with a lower energy input). (c) Increasing the use of renewable or carbon neutral energy: Substituting fossil fuels with energy sources that are not finite and that cause lower emissions, such as biomass, and hydro-, wind- and solar energy. (d) Sequestering CO2 through carbon sinks: CO2 can be stored in biomass (for example, through afforestation and deforestation), in aquifers or oceans, and in geological sinks (such as depleted gas fields). Indirectly this option can have relevance to the tourism sector, considering that most developing countries and small island developing States that rely on air transport for their tourism-driven economies are biodiversity-rich areas with important biomass CO2 storage function. Environmentally-oriented tourism can play a key role in the conservation of these natural areas.
An estimation of the costs associated with mitigative action (for example, abatement costs) depends critically on the potential of the tourism sector to implement processes associated with mitigation. Auton (2008) summarized four phases that the tourism sector can implement to mitigate tourism sector impact on climate, as follows:
(a) The elimination of GHG emissions by circumventing activities that can be avoided without significant change to the tourist experience
(b) The reduction of GHG emissions by focusing on energy efficiency
(c) The substitution of practices that accounts for large GHG emissions with practices that have a lower carbon footprint
(d) The offsetting of any remaining emissions so as to achieve full carbon neutrality.
Some of these mitigation actions can include measures such as: use of fuel-efficient cars by tour operators, hotels and resorts, employing channels such as effective ventilation and appropriate roofing to reduce temperature in buildings, new buildings designed with the conservation of energy in mind, and the use of more efficient lighting and energy efficient appliances (less electricity use).
23
VI. CONCLUSION
In this study, tourism demand was modelled for nine Caribbean countries. The model was then used to predict the impact of climate change on the tourism sector under three weather scenarios (A2, B2 and BAU) until the end of the century. The results of this research provide prove that the tourism sector of the subregion’s economies would be affected profoundly by climate change. It is, therefore, very important that Caribbean countries adapt and mitigate against impending climate change to promote and sustain growth in the tourism sector. To undertake this task, governments in the subregion must come together to formulate policy which would ensure that the sector remains sustainable.
The estimation of costs undertaken in this study would have benefited greatly from country-specific data for extreme events and sea level rise due to climate change. Until such data is available, costing figures from existing studies would have to be used to ensure that climate variables are taken into consideration and included in any study that examines the impact of climate change on the tourism sector in the region. It is essential that governments and policymakers become involved in the process, perhaps at a very early stage, since climate change is an environmental and, ultimately, a developmental problem. One clear advantage of participation by these stakeholders is the recognition and acknowledgement that for researchers to generate more accurate estimation of costs, data must be made available to these practitioners in the field.
It is necessary that further work in this area involve a thorough investigation of adaptation and mitigation strategies and the costs of implementing such strategies in the Caribbean subregion. With the formulation of mitigation and adaptation strategies and the appropriate policies in place, the tourism sector can play a key role in dealing with climate change and encouraging sustainable growth in the sector.
24
Bibliography
Auton, G.P. (2008), “Mitigating risk in adaptation strategies for climate change and sustainability in the tourism industry: a global perspective”, presented at the Jeju Forum for Global Sustainability, Korea. Available at: http://74.125.93.132/search?q=cache:JND55K5Q808J:www.icleikorea.or.kr/board/bbs/download.php%3Fbo_table%3Ddoc_data%26wr_id%3D5%26no%3D1+Mitigating+Risk+in+Adaptation+Strategies+for+Climate+Change+and+Sustainability+in+the+Tourism+Industry:+A+Global+Perspective&cd=1&hl=en&ct=clnk
Becken, S. and J. Hay (2007), Tourism and Climate Change – Risks and Opportunities, Channel View Publications, Cleveland, Ohio, United States of America.
Becken, S. (2004), “How tourists and tourism experts perceive climate change and forest carbon sinks”, Journal of Sustainable Tourism 12 (4): 332-345.
Berrittella, M. and others (2006), “A General Equilibrium analysis of climate change impacts on tourism”, Tourism Management 27: 913-924.
Bigano, A. and others (2006), “Economy-wide estimates of the implications of climate change” in A joint analysis for sea level rise and tourism, Nota di lavaro 135.06, Fondazione Eni Enrico Mattei.
Braun, O.L. and others (1999), “Potential impacts of climate change effects on preferences for tourism destinations. A psychological pilot study”, Climate Research 11: 247–254.
Bueno, R. and others (2008), “The Caribbean and climate change: the cost of inaction”, Stockholm Environment Institute (US Center) and Global Development and Environment Institute (Tufts University).
Crouch, G.I. and R.N. Shaw, (1992), “International tourism demand: A meta-analysis integration of research findings”, in Choice and Demand in Tourism, Ed. P. Johnson and B. Thomas, pp. 175-207, Mansell, London.
Elsasser, H. and R. Burki (2002), “Climate change as a threat to tourism in the Alps”, Climate Research 20: 253-257.
Greene, W.H. (2008), Econometric Analysis (6th ed.), Prentice Hall, U.S.A.
Hall, C.M. and A.M. Williams (2008), Tourism and Innovation, London, Routledge.
Haites, E. and others (2002), “Assessment of the impact of climate change on CARICOM countries”, Environmentally and Socially Sustainable Development – Latin America and Caribbean Region, The World Bank, available at http://www.margaree.ca/reports/ClimateChangeCARICOM.pdf
Hamilton, J.M. and R.S.J. Tol (2007), “The impact of climate change on recreation and tourism”, Working Paper FNU52, Hamburg University Centre for Marine and Climate Research, Hamburg.
25
Hamilton, J.M. and M.A. Lau (2004), “The role of climate information in tourism destination choice”, Working Paper FNU56, Hamburg University Centre for Marine and Climate Research, Hamburg.
Hamilton, J.M., D.J. Maddison and R.S.J. Tol (2005),” Effects of climate change on international tourism”, Climate Research 29: 245-254.
Intergovernmental Panel on Climate Change (IPCC) (2001), Climate change 2001: Synthesis Report, Intergovernmental Panel on Climate Change, Geneva.
Johnson, P. and J. Ashworth (1990), “Modelling tourism demand: A summary review”, Leisure Studies, 9 (2): 145-161.
Koenig, U. and B. Abegg (1997), “Impacts of climate change on winter tourism in the Swiss Alps”, Journal of Sustainable Tourism 5 (1): 46 – 58.
Lim, C. (1999), “A meta-analysis review of international tourism demand”, Journal of Travel Research 37: 273-284.
Lise, W. and R.S.J. Tol (2002), “Impact of climate on tourist demand”, Climate Change 55: 429-449.
Mather, S., D.Viner and G.Todd (2005), “Climate and policy changes: their implications for international tourism flows”, in M.C. Hall and J. Higham (eds), Tourism, Recreation and Climate Change, Channel View Publications, Great Britain.
Mimura, N. and others (2007), “Small islands. Climate change 2007: impacts, adaptation and vulnerability”, Contributions of Working Group II to the Fourth Assessment Report of the Intergovernmental Panel on Climate Change, M.L. Parry, O.F. Canziani, J.P. Palutikof, P.J. van der Linden and C.E. Hanson, (eds.), pp. 786-716, Cambridge University Press, Cambridge, United Kingdom.
Rogner, H. and others (2007), “Introduction”, in Climate Change 2007: Mitigation, contribution of Working Group III to the Fourth Assessment Report of the Intergovernmental Panel on Climate Change, B. Metz, O.R. Davidson, P.R. Bosch, R. Dave, L.A. Meyer (eds.), Cambridge University Press, Cambridge, United Kingdom..
Scott, D. and G. McBoyle (2006), “Climate change adaptation in the ski industry”, Mitigation and Adaptation Strategies to Global Change 12: 1411-1431.
Scott, D., G. McBoyle and M. Schwartzentruber (2004), “Climate change and the distribution of climatic resources for tourism in North America”, Climate Research 27 (2) pp. 105-117.
Scott, D. and others (2002), “The vulnerability of winter recreation to climate change in Ontario’s Lakelands tourism region”, Department of Geography Publication Series Occasional Paper 18, University of Waterloo, Waterloo, Ontario.
Smit, B. and others (1999), “The science of adaptation: a framework for assessment”, Mitigation and Adaptation Strategies for Global Change, 4: 199 – 213.
Song, H. and S.F. Witt (2000), “Tourism demand modelling and forecasting”, Modern Econometric Approaches, Oxford, Pergamon.
26
Stern, N. (2006), “The economics of climate change”, The Stern Review, Cambridge University Press, Cambridge, United Kingdom.
Toba, N. (2009),“Potential economic impacts of climate change in the Caribbean Community”, in W. Vergara (ed), Assessing the potential consequences of climate destabilization in Latin America, Latin America and Caribbean Region Sustainable Development Working paper 32. The World Bank, Washington, D.C.
Trenberth, K.E. and others (2007), “Observations: surface and atmospheric climate change”, Climate Change 2007: The Physical Science Basis. Contribution of Working Group I to the Fourth Assessment Report of the Intergovernmental Panel on Climate Change, pp. 235-336, S. Solomon, D. Qin, M. Manning, Z. Chen, M. Marquis, K.B. Averyt, M. Tignor and H.L. Miller, (eds.), Cambridge University Press, Cambridge, United Kingdom.
United Nations World Tourism Organization (UNWTO), United Nations Environment Programme (UNEP) and World Meteorological Organization (WMO) (2008), “Climate change and tourism: responding to global challenges”, (prepared by Scott, D. and others), UNWTO, Madrid, and UNEP, Paris.
Uyarra, M.C. and others (2005), “Island-specific preferences of tourists for environmental features: implications of climate change for tourism-dependent States”, Environmental Conservation 32 (1): pp 11–19.