regional moment tensor solutions for source-type ... moment tensor solutions for source-type...
TRANSCRIPT
II-92 | IRIS CoRe PRoPoSal 2010 | Volume I I | non-eaRTHQuaKe SeISmIC SouRCeS
Regional Moment Tensor Solutions for Source-Type Identification: The Crandall Canyon Mine CollapseDouglas Dreger (Berkeley Seismological Laboratory), Sean Ford (Lawrence Livermore National Laboratory), William Walter (Lawrence Livermore National Laboratory)
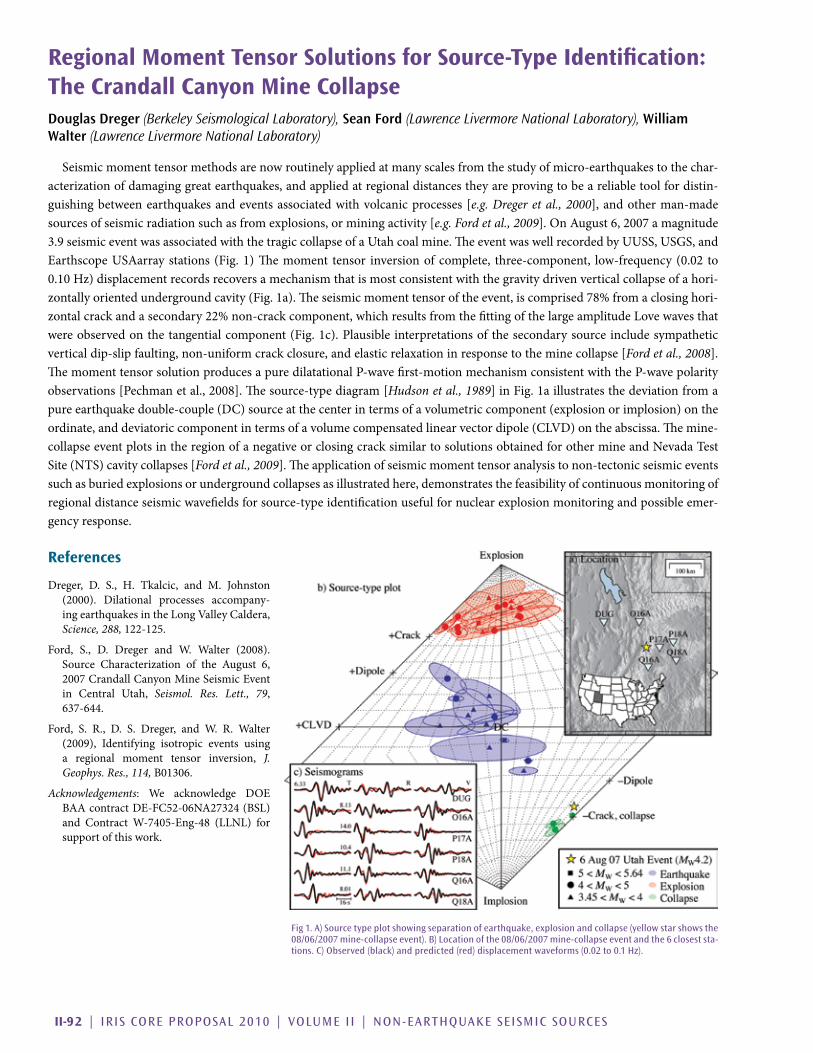
Seismic moment tensor methods are now routinely applied at many scales from the study of micro-earthquakes to the char-acterization of damaging great earthquakes, and applied at regional distances they are proving to be a reliable tool for distin-guishing between earthquakes and events associated with volcanic processes [e.g. Dreger et al., 2000],andotherman-madesources of seismic radiation such as from explosions, or mining activity [e.g. Ford et al., 2009].OnAugust6,2007amagnitude3.9seismiceventwasassociatedwiththetragiccollapseofaUtahcoalmine.TheeventwaswellrecordedbyUUSS,USGS,andEarthscopeUSAarray stations (Fig.1)Themoment tensor inversionofcomplete, three-component, low-frequency (0.02 to0.10Hz)displacementrecordsrecoversamechanismthatismostconsistentwiththegravitydrivenverticalcollapseofahori-zontallyorientedundergroundcavity(Fig.1a).Theseismicmomenttensoroftheevent,iscomprised78%fromaclosinghori-zontalcrackandasecondary22%non-crackcomponent,whichresultsfromthefittingofthelargeamplitudeLovewavesthatwereobservedonthetangentialcomponent(Fig.1c).Plausible interpretationsofthesecondarysourceincludesympatheticvertical dip-slip faulting, non-uniform crack closure, and elastic relaxation in response to the mine collapse [Ford et al., 2008].ThemomenttensorsolutionproducesapuredilatationalP-wavefirst-motionmechanismconsistentwiththeP-wavepolarityobservations[Pechmanetal.,2008].Thesource-typediagram[Hudson et al., 1989]inFig.1aillustratesthedeviationfromapureearthquakedouble-couple(DC)sourceatthecenterintermsofavolumetriccomponent(explosionorimplosion)ontheordinate,anddeviatoriccomponentintermsofavolumecompensatedlinearvectordipole(CLVD)ontheabscissa.Themine-collapseeventplotsintheregionofanegativeorclosingcracksimilartosolutionsobtainedforothermineandNevadaTestSite(NTS)cavitycollapses[Ford et al., 2009].Theapplicationofseismicmomenttensoranalysistonon-tectonicseismiceventssuch as buried explosions or underground collapses as illustrated here, demonstrates the feasibility of continuous monitoring of regional distance seismic wavefields for source-type identification useful for nuclear explosion monitoring and possible emer-gency response.
References
Dreger, D. S., H. Tkalcic, and M. Johnston(2000). Dilational processes accompany-ingearthquakesintheLongValleyCaldera,Science, 288, 122-125.
Ford, S., D. Dreger and W. Walter (2008).Source Characterization of the August 6,2007 Crandall Canyon Mine Seismic Event in Central Utah, Seismol. Res. Lett., 79, 637-644.
Ford, S. R., D. S. Dreger, and W. R. Walter(2009), Identifying isotropic events usinga regional moment tensor inversion, J. Geophys. Res., 114, B01306.
Acknowledgements: We acknowledge DOEBAAcontractDE-FC52-06NA27324(BSL)and ContractW-7405-Eng-48 (LLNL) forsupport of this work.
fig 1. a) Source type plot showing separation of earthquake, explosion and collapse (yellow star shows the 08/06/2007 mine-collapse event). b) location of the 08/06/2007 mine-collapse event and the 6 closest sta-tions. C) observed (black) and predicted (red) displacement waveforms (0.02 to 0.1 Hz).
IRIS CoRe PRoPoSal 2010 | Volume I I | non-eaRTHQuaKe SeISmIC SouRCeS | I I -93
Source Analysis of the Memorial Day Explosion, Kimchaek, North KoreaSean R. Ford (Lawrence Livermore National Laboratory), William R. Walter (Lawrence Livermore National Laboratory), Douglas S. Dreger (Berkeley Seismological Laboratoy)
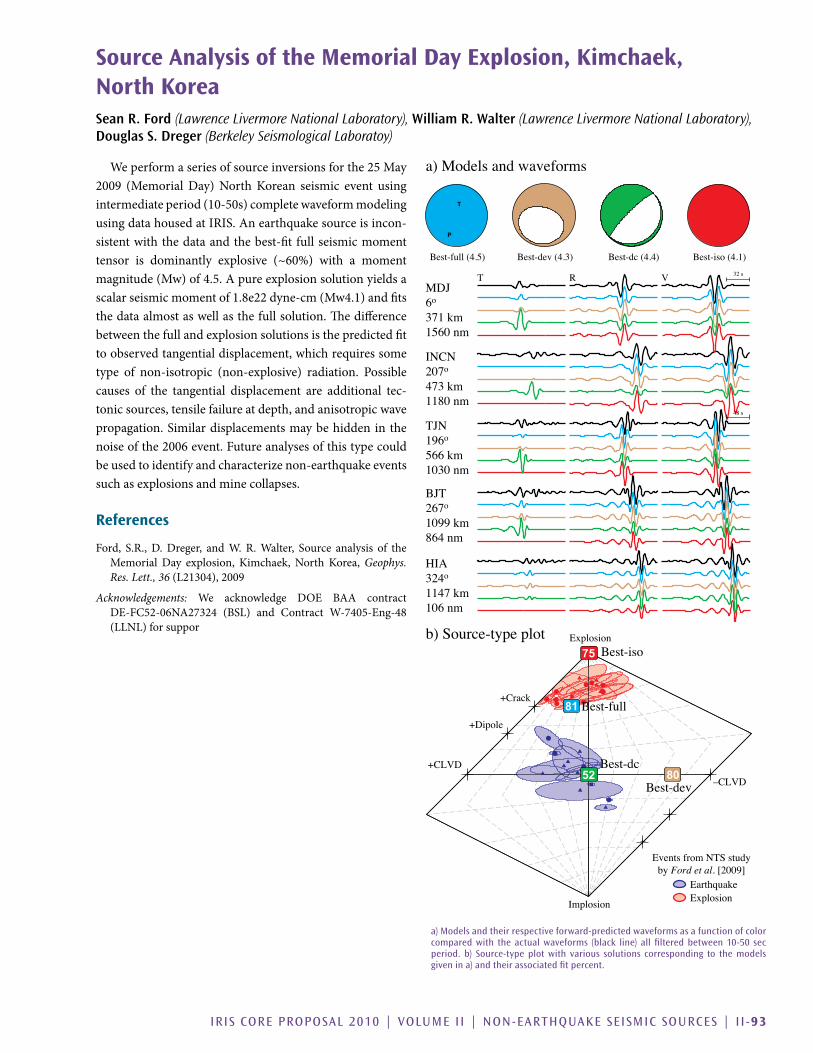
Weperformaseriesofsourceinversionsforthe25May2009 (MemorialDay)NorthKorean seismic event usingintermediateperiod(10-50s)completewaveformmodelingusing data housed at IRIS. An earthquake source is incon-sistent with the data and the best-fit full seismic moment tensor is dominantly explosive (~60%) with a momentmagnitude(Mw)of4.5.Apureexplosionsolutionyieldsascalarseismicmomentof1.8e22dyne-cm(Mw4.1)andfitsthe data almost as well as the full solution. The difference between the full and explosion solutions is the predicted fit to observed tangential displacement, which requires some type of non-isotropic (non-explosive) radiation. Possiblecauses of the tangential displacement are additional tec-tonic sources, tensile failure at depth, and anisotropic wave propagation. Similar displacements may be hidden in the noiseofthe2006event.Futureanalysesofthistypecouldbe used to identify and characterize non-earthquake events such as explosions and mine collapses.
References
Ford, S.R.,D.Dreger, andW.R.Walter, Source analysis of theMemorialDay explosion, Kimchaek,NorthKorea,Geophys. Res. Lett., 36 (L21304),2009
Acknowledgements: We acknowledge DOE BAA contractDE-FC52-06NA27324 (BSL) and Contract W-7405-Eng-48(LLNL)forsuppor
Best-full (4.5) Best-dev (4.3) Best-iso (4.1)Best-dc (4.4)
MDJ6o
371 km1560 nm
INCN207o
473 km1180 nm
BJT267o
1099 km864 nm
HIA324o
1147 km106 nm
TJN196o
566 km1030 nm
32 s
48 s
T R V
T
P
DC
Explosion
Implosion
+CLVD
–CLVD
+Crack
+Dipole
EarthquakeExplosion
Events from NTS studyby Ford et al. [2009]
81 Best-full
80Best-dev
75 Best-iso
52Best-dc
b) Source-type plot
a) Models and waveforms
a) models and their respective forward-predicted waveforms as a function of color compared with the actual waveforms (black line) all filtered between 10-50 sec period. b) Source-type plot with various solutions corresponding to the models given in a) and their associated fit percent.
II-94 | IRIS CoRe PRoPoSal 2010 | Volume I I | non-eaRTHQuaKe SeISmIC SouRCeS
Studying Earth's wave Climate Using the global MicroseismRichard Aster (New Mexico Institute of Mining and Technology), Daniel McNamara (US Geological Survey, Golden, CO), Peter Bromirski (Integrative Oceanography Division, Scripps Institution of Oceanography, UC San Diego)
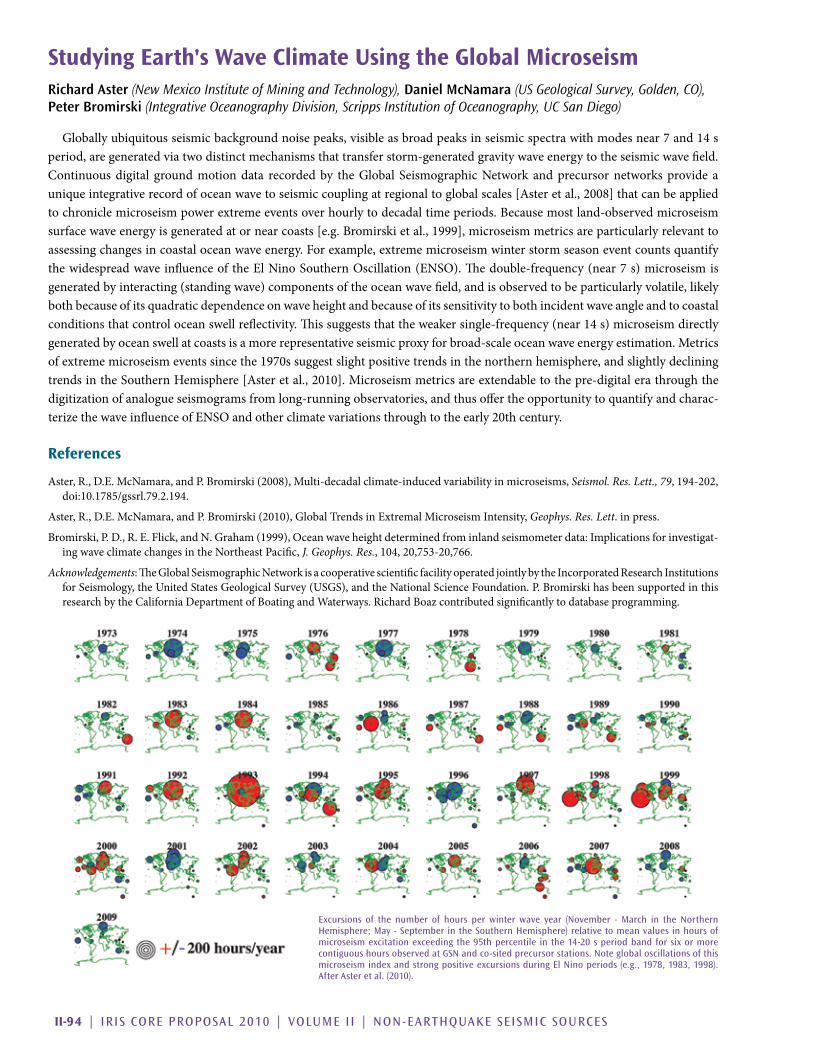
Globallyubiquitousseismicbackgroundnoisepeaks,visibleasbroadpeaksinseismicspectrawithmodesnear7and14speriod, are generated via two distinct mechanisms that transfer storm-generated gravity wave energy to the seismic wave field. Continuous digital ground motion data recorded by the Global Seismographic Network and precursor networks provide a uniqueintegrativerecordofoceanwavetoseismiccouplingatregionaltoglobalscales[Asteretal.,2008]thatcanbeappliedtochroniclemicroseismpowerextremeeventsoverhourlytodecadaltimeperiods.Becausemostland-observedmicroseismsurfacewaveenergyisgeneratedatornearcoasts[e.g.Bromirskietal.,1999],microseismmetricsareparticularlyrelevanttoassessing changes in coastal ocean wave energy. For example, extreme microseism winter storm season event counts quantify thewidespreadwaveinfluenceoftheElNinoSouthernOscillation(ENSO).Thedouble-frequency(near7s)microseismisgeneratedbyinteracting(standingwave)componentsoftheoceanwavefield,andisobservedtobeparticularlyvolatile,likelyboth because of its quadratic dependence on wave height and because of its sensitivity to both incident wave angle and to coastal conditionsthatcontroloceanswellreflectivity.Thissuggeststhattheweakersingle-frequency(near14s)microseismdirectlygenerated by ocean swell at coasts is a more representative seismic proxy for broad-scale ocean wave energy estimation. Metrics ofextrememicroseismeventssincethe1970ssuggestslightpositivetrendsinthenorthernhemisphere,andslightlydecliningtrendsintheSouthernHemisphere[Asteretal.,2010].Microseismmetricsareextendabletothepre-digitalerathroughthedigitization of analogue seismograms from long-running observatories, and thus offer the opportunity to quantify and charac-terizethewaveinfluenceofENSOandotherclimatevariationsthroughtotheearly20thcentury.
References
Aster,R.,D.E.McNamara,andP.Bromirski(2008),Multi-decadalclimate-inducedvariabilityinmicroseisms,Seismol. Res. Lett., 79,194-202,doi:10.1785/gssrl.79.2.194.
Aster,R.,D.E.McNamara,andP.Bromirski(2010),GlobalTrendsinExtremalMicroseismIntensity,Geophys. Res. Lett. in press.
Bromirski,P.D.,R.E.Flick,andN.Graham(1999),Oceanwaveheightdeterminedfrominlandseismometerdata:Implicationsforinvestigat-ingwaveclimatechangesintheNortheastPacific,J. Geophys. Res.,104,20,753-20,766.
Acknowledgements: The Global Seismographic Network is a cooperative scientific facility operated jointly by the Incorporated Research Institutions forSeismology,theUnitedStatesGeologicalSurvey(USGS),andtheNationalScienceFoundation.P.BromirskihasbeensupportedinthisresearchbytheCaliforniaDepartmentofBoatingandWaterways.RichardBoazcontributedsignificantlytodatabaseprogramming.
excursions of the number of hours per winter wave year (november - march in the northern Hemisphere; may - September in the Southern Hemisphere) relative to mean values in hours of microseism excitation exceeding the 95th percentile in the 14-20 s period band for six or more contiguous hours observed at GSn and co-sited precursor stations. note global oscillations of this microseism index and strong positive excursions during el nino periods (e.g., 1978, 1983, 1998). after aster et al. (2010).
IRIS CoRe PRoPoSal 2010 | Volume I I | non-eaRTHQuaKe SeISmIC SouRCeS | I I -95
Iceberg Tremor and Ocean Signals Observed with Floating SeismographsRichard Aster (New Mexico Institute of Mining and Technology), Douglas MacAyeal (University of Chicago), Peter Bromirski (Integrative Oceanography Division, Scripps Institution of Oceanography, UC San Diego), Emile Okal (Northwestern University)
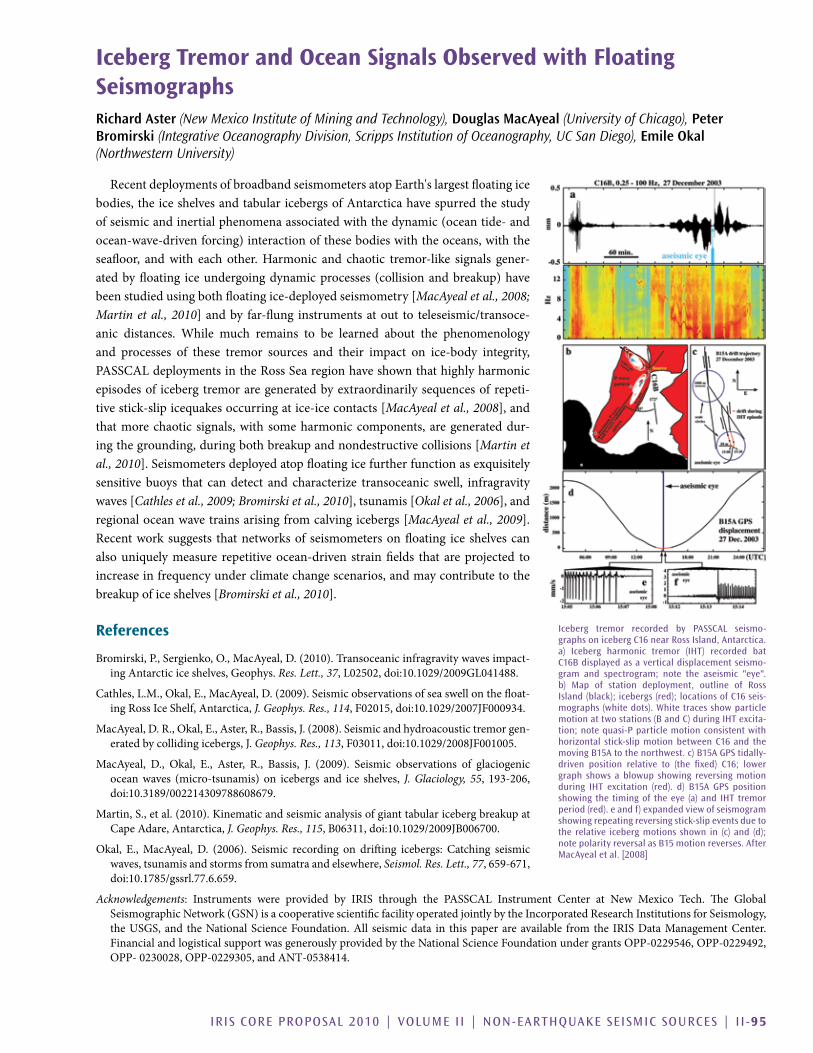
RecentdeploymentsofbroadbandseismometersatopEarth'slargestfloatingicebodies, the ice shelves and tabular icebergs of Antarctica have spurred the study ofseismicandinertialphenomenaassociatedwiththedynamic(oceantide-andocean-wave-drivenforcing)interactionofthesebodieswiththeoceans,withtheseafloor, andwith each other.Harmonic and chaotic tremor-like signals gener-atedbyfloating iceundergoingdynamicprocesses (collisionandbreakup)havebeenstudiedusingbothfloatingice-deployedseismometry[MacAyeal et al., 2008; Martin et al., 2010]andby far-flung instrumentsatout to teleseismic/transoce-anic distances. While much remains to be learned about the phenomenologyand processes of these tremor sources and their impact on ice-body integrity, PASSCALdeploymentsintheRossSearegionhaveshownthathighlyharmonicepisodes of iceberg tremor are generated by extraordinarily sequences of repeti-tive stick-slip icequakes occurring at ice-ice contacts [MacAyeal et al., 2008],andthat more chaotic signals, with some harmonic components, are generated dur-ing the grounding, during both breakup and nondestructive collisions [Martin et al., 2010].Seismometersdeployedatopfloatingicefurtherfunctionasexquisitelysensitive buoys that can detect and characterize transoceanic swell, infragravity waves [Cathles et al., 2009; Bromirski et al., 2010],tsunamis[Okal et al., 2006],andregional ocean wave trains arising from calving icebergs [MacAyeal et al., 2009].Recentworksuggests thatnetworksof seismometersonfloating ice shelvescanalso uniquely measure repetitive ocean-driven strain fields that are projected to increase in frequency under climate change scenarios, and may contribute to the breakup of ice shelves [Bromirski et al., 2010].
References
Bromirski,P.,Sergienko,O.,MacAyeal,D.(2010).Transoceanicinfragravitywavesimpact-ing Antarctic ice shelves, Geophys. Res. Lett., 37,L02502,doi:10.1029/2009GL041488.
Cathles,L.M.,Okal,E.,MacAyeal,D.(2009).Seismicobservationsofseaswellonthefloat-ing Ross Ice Shelf, Antarctica, J. Geophys. Res., 114,F02015,doi:10.1029/2007JF000934.
MacAyeal,D.R.,Okal,E.,Aster,R.,Bassis,J.(2008).Seismicandhydroacoustictremorgen-erated by colliding icebergs, J. Geophys. Res., 113,F03011,doi:10.1029/2008JF001005.
MacAyeal, D., Okal, E., Aster, R., Bassis, J. (2009). Seismic observations of glaciogenicoceanwaves (micro-tsunamis) on icebergs and ice shelves, J. Glaciology, 55, 193-206,doi:10.3189/002214309788608679.
Martin,S.,etal.(2010).KinematicandseismicanalysisofgianttabularicebergbreakupatCape Adare, Antarctica, J. Geophys. Res., 115,B06311,doi:10.1029/2009JB006700.
Okal, E.,MacAyeal,D. (2006). Seismic recording on drifting icebergs: Catching seismicwaves, tsunamis and storms from sumatra and elsewhere, Seismol. Res. Lett., 77,659-671,doi:10.1785/gssrl.77.6.659.
Acknowledgements: Instruments were provided by IRIS through the PASSCAL Instrument Center at New Mexico Tech. The GlobalSeismographicNetwork(GSN)isacooperativescientificfacilityoperatedjointlybytheIncorporatedResearchInstitutionsforSeismology,the USGS, and the National Science Foundation. All seismic data in this paper are available from the IRIS Data Management Center. FinancialandlogisticalsupportwasgenerouslyprovidedbytheNationalScienceFoundationundergrantsOPP‐0229546,OPP‐0229492,OPP‐0230028,OPP‐0229305,andANT‐0538414.
Iceberg tremor recorded by PaSSCal seismo-graphs on iceberg C16 near Ross Island, antarctica. a) Iceberg harmonic tremor (IHT) recorded bat C16b displayed as a vertical displacement seismo-gram and spectrogram; note the aseismic "eye". b) map of station deployment, outline of Ross Island (black); icebergs (red); locations of C16 seis-mographs (white dots). White traces show particle motion at two stations (b and C) during IHT excita-tion; note quasi-P particle motion consistent with horizontal stick-slip motion between C16 and the moving b15a to the northwest. c) b15a GPS tidally-driven position relative to (the fixed) C16; lower graph shows a blowup showing reversing motion during IHT excitation (red). d) b15a GPS position showing the timing of the eye (a) and IHT tremor period (red). e and f) expanded view of seismogram showing repeating reversing stick-slip events due to the relative iceberg motions shown in (c) and (d); note polarity reversal as b15 motion reverses. after macayeal et al. [2008]
II-96 | IRIS CoRe PRoPoSal 2010 | Volume I I | non-eaRTHQuaKe SeISmIC SouRCeS
Observations of Seismic and Acoustic Signals Produced by Calving, Bering glacier, AlaskaJoshua P. Richardson (Michigan Technological University), Gregory P. Waite (Michigan Technological University), Katelyn A. FitzGerald (Michigan Technological University), Wayne D. Pennington (Michigan Technological University)
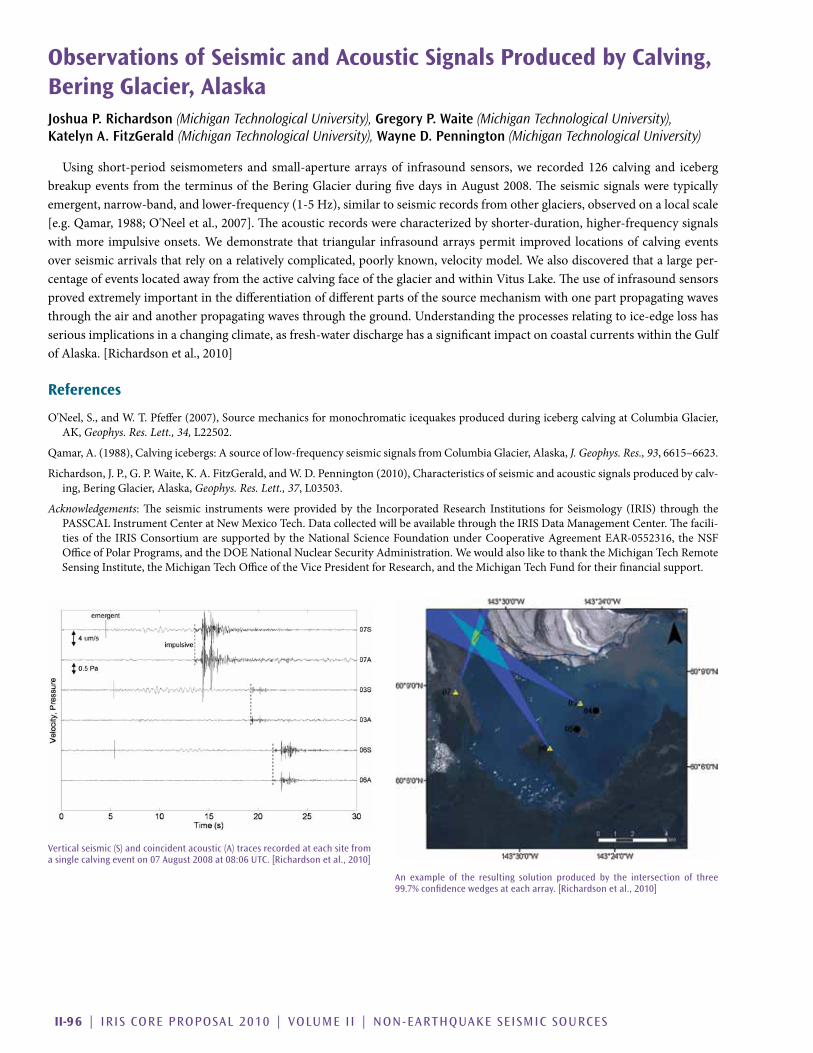
Using short-period seismometers and small-aperture arrays of infrasound sensors,we recorded 126 calving and icebergbreakupeventsfromtheterminusof theBeringGlacierduringfivedays inAugust2008.Theseismicsignalsweretypicallyemergent,narrow-band,andlower-frequency(1-5Hz),similartoseismicrecordsfromotherglaciers,observedonalocalscale[e.g.Qamar,1988;O'Neeletal.,2007].Theacousticrecordswerecharacterizedbyshorter-duration,higher-frequencysignalswithmore impulsiveonsets.Wedemonstrate that triangular infrasoundarrayspermit improved locationsofcalvingeventsoverseismicarrivalsthatrelyonarelativelycomplicated,poorlyknown,velocitymodel.Wealsodiscoveredthatalargeper-centageofeventslocatedawayfromtheactivecalvingfaceoftheglacierandwithinVitusLake.Theuseofinfrasoundsensorsproved extremely important in the differentiation of different parts of the source mechanism with one part propagating waves through the air and another propagating waves through the ground. Understanding the processes relating to ice-edge loss has serious implications in a changing climate, as fresh-water discharge has a significant impact on coastal currents within the Gulf ofAlaska.[Richardsonetal.,2010]
References
O'Neel,S.,andW.T.Pfeffer(2007),SourcemechanicsformonochromaticicequakesproducedduringicebergcalvingatColumbiaGlacier,AK,Geophys. Res. Lett., 34,L22502.
Qamar,A.(1988),Calvingicebergs:Asourceoflow-frequencyseismicsignalsfromColumbiaGlacier,Alaska,J. Geophys. Res., 93,6615–6623.
Richardson,J.P.,G.P.Waite,K.A.FitzGerald,andW.D.Pennington(2010),Characteristicsofseismicandacousticsignalsproducedbycalv-ing,BeringGlacier,Alaska,Geophys. Res. Lett., 37,L03503.
Acknowledgements:The seismic instrumentswereprovidedby the IncorporatedResearch Institutions for Seismology (IRIS) through thePASSCALInstrumentCenteratNewMexicoTech.DatacollectedwillbeavailablethroughtheIRISDataManagementCenter.Thefacili-tiesof the IRISConsortiumaresupportedby theNationalScienceFoundationunderCooperativeAgreementEAR-0552316, theNSFOfficeofPolarPrograms,andtheDOENationalNuclearSecurityAdministration.WewouldalsoliketothanktheMichiganTechRemoteSensingInstitute,theMichiganTechOfficeoftheVicePresidentforResearch,andtheMichiganTechFundfortheirfinancialsupport.
Vertical seismic (S) and coincident acoustic (a) traces recorded at each site from a single calving event on 07 august 2008 at 08:06 uTC. [Richardson et al., 2010]
an example of the resulting solution produced by the intersection of three 99.7% confidence wedges at each array. [Richardson et al., 2010]

IRIS CoRe PRoPoSal 2010 | Volume I I | non-eaRTHQuaKe SeISmIC SouRCeS | I I -97
Elucidating the Stick-Slip Nature of the whillans Ice PlainJacob Walter (University of California, Santa Cruz), Emily E. Brodsky (University of California, Santa Cruz), Slawek Tulaczyk (University of California, Santa Cruz), Susan Y. Schwartz (University of California, Santa Cruz)
TheWhillans Ice Plain (WIP) is anapproximately200kmx100kmx600mportionoftheWestAntarcticIceSheetthat slips up to 0.5 m over a duration of 30 minutes, twice daily. Such bi-daily, tidally modulated stick-slip speed-ups provide insight into glacier dynamics and may be a unique analogue to tec-tonic earthquake/slow slip rupture.Wedeployed a network of continuously-operating GPS receivers in 2007 andoperated on-ice broadband seismom-eters (partially provided by PASSCAL)during the austral summer of 2008 onWIP. Previous work during the 2004field season suggested that these speed-ups initiate as failure of an asperity on or near “Ice Raft A” that triggers rup-tureacrosstheentireWIP[Wiens et al., 2008].Ourresultsforthe2008fieldsea-son locate the slip initiation farther to the south of this feature, closer to the grounding line and the southernmost extent of the Ross Ice Shelf. A strong correlation between the amplitude of seismic waves generated at the rupture front and the total slip achieved over the duration oftheslipevent(~30min)suggestsslip-predictablebehavior[Walteretal.,submitted]ortheabilitytoforecasttheeventualslipbasedonthefirstminuteofseismicradiation.ArrivaltimeinformationcompiledfromstationsQSPAandVNDA(continuousseismicdataarchivedandprovidedbytheIRISDMC)showthatsuccessiveslipeventspropagatewithdifferentrupturespeeds(100-300m/s)thatstronglycorrelate(R-squared=0.73,p-value=0.0012)withtherecurrenceinterval.Inaddition,theamountof slip achieved during each event appears to be correlated with the rupture speed. Our work suggests that the far-field transmis-sion of seismic waves from glacier action is not dependent upon bulk ice movement, but rapid basal stress changes [Walter et al., submitted].Theavailabilityofon-icebroadbandseismometersanddataatstationsQSPAandVNDAyieldimportantinfor-mationregardingmechanicsanddynamicsoficestreambedsatthescaleof10sto100sofkm.Subglacialprocessesarenotori-ously difficult to constrain on these large scales, which are relevant to the understanding of regional and continental ice motion.
References
Fricker, H. A., T. Scambos, R. Bindschadler (2007), An active subglacial water system inWest Antarcticamapped from space, Science, 315(5818):1544-1548.
Walter,J.I.,Brodsky,E.Tulaczyk,S.,Schwartz,S.,andR.Pettersson,submitted,Slip-predictabilityanddynamicallyfluctuatingrupturespeedsonaglacier-fault,WhillansIcePlain,WestAntarctica,J. Geophys. Res. Earth Surface.
Wiens,D.A.,S.Anandakrishnan,J.P.Winberry,andM.A.King(2008),Simultaneousteleseismicandgeodeticobservationsofthestick-slipmotion of an Antarctic ice stream, Nature, 453: 770774.
Acknowledgements:ThisworkwasfundedprimarilybyNSFAntarcticSciencesDivisionGrantnumber0636970.SupportforJWisprovidedbyaNASAEarthandSpaceScienceFellowship.SomebroadbandseismicequipmentwasprovidedbyPASSCAL.TheIRISDMCmanagesandarchivesdatafromstationsQSPAandVNDA.
Station location map depicting continuous GPS network and broadband station names for the 2008 field sea-son. Subglacial lake geometry is shown as IceSaT tracks, adapted from fricker et al. [2007]. The green shaded circles 95% confidence level error ellipses encircling slip-start locations, shown as green squares. Yellow squares indicate slip-start locations with only three station observations.

II-98 | IRIS CoRe PRoPoSal 2010 | Volume I I | non-eaRTHQuaKe SeISmIC SouRCeS
Infrasonic Imaging with the USArrayKris Walker (Laboratory for Atmospheric Acoustics, IGPP, SIO, Univ. of California, San Diego), Michael Hedlin (Laboratory for Atmospheric Acoustics, IGPP, SIO, Univ. of California, San Diego), Catherine de Groot-Hedlin (Laboratory for Atmospheric Acoustics, IGPP, SIO, Univ. of California, San Diego)
The USArray directly measures ground motion, which can mostly be attributed to ocean waves, earthquakes, volcanoes, and weather systems that load the Earth’s surface. Another source of ground motion is the transfer of atmospheric acoustic energy intoseismicenergyattheEarth’ssurface.Infrasound(lowfrequencysoundbelow~20Hz)cantravelgreatdistancesunattenu-ated in atmospheric ducts created by layers of slow sound speed. The infrasound wave field is rich due to a variety of anthro-pogenic and geophysical phenomena including earthquakes, volcanoes, landslides, meteors, lightning and sprites, auroras, and oceanicandatmosphericprocesses.Globallyspacedmicrobarometerarrayswithaperturesof100mto2kmaretypicallyusedtostudythesesources.However,thesearraysareseparatedbythousandsofkilometers,whichplacesconsiderablelimitsonwhatthey can teach us about infrasound source physics. The USArray is in a position to study infrasound sources in unprecedented detail.Arrayprocessingmethods,suchasreverse-timemigration(RTM),mayworkwellinautomateddetectionandlocationofinfrasoundsourcesregisteredbytheUSArray(seealsoHedlinetal.contribution).Hundredsofsourceshavebeendetectedthusfarusingthistechnique.Forexample,belowisaUSArray“infrasonicimage”ofaVandenbergAirForceBaserocketlaunch.
The detector function (upper left) images the source in time; there is a peak at the launch time (thick red line) with a signal-to-noise ratio of 22 db. other colored lines indicate known regional and teleseismic earthquake times. The map shows the seismic energy migrated back to the source, where it constructively interferes, imag-ing the source in space at the source time. The record section to the right shows that the migrated energy moves out at ~300 m/s, indicating that rocket infrasound is observed out to ~1500 km. Horizontally aligned signals are earthquakes.

IRIS CoRe PRoPoSal 2010 | Volume I I | non-eaRTHQuaKe SeISmIC SouRCeS | I I -99
Probing the Atmosphere and Atmospheric Sources with the USArrayMichael Hedlin (Laboratory for Atmospheric Acoustics, U.C. San Diego), Kris Walker (Laboratory for Atmospheric Acoustics, U.C. San Diego), Catherine de Groot-Hedlin (Laboratory for Atmospheric Acoustics, U.C. San Diego), Doug Drob (Naval Research Laboratory)
The USArray is designed to image the subsurface structure of the United States with exceptional resolution at a continental scale and for studies of regional and teleseismic earthquakes. Although the sensors of this network directly measure ground motion, they indirectly measure other phenomena that affect ground motion. It has been known for a long time that infrasound canbedetectedbyseismometers throughacoustic-to-seismicconversionat theground/atmosphere interface.TheUSArraydata archive contains recordings of several hundred large atmospheric events. One example is a bolide that burst above Oregon StateonFebruary19,2008andwasrecordedbyseveralhundredseismicstationsandfourinfrasoundarrays.Thebolidesourceparameters were precisely determined by the seismic data, and the time-offset records show several phase branches correspond-ing to multiple arrivals. Such branches have never before been observed in such spectacular detail because infrasound arrays separated by thousands of kilometers are typically used for infrasound studies. The branches from such a large number of events occurring through the year are proving to be very useful for study of infrasound propagation and atmospheric structure.
Acknowledgements:WewouldliketoacknowledgeEarthscopeandIRISfordatafromtheUSArraywithoutwhichthisstudywouldnothavebeenpossible.WewouldliketothankMattFouchattheUniversityofArizonaandDavidJamesattheCarnegieInstitutionofWashingtonforgivingusaccesstodatafromtheirHighLavaPlainsSeismicExperiment.WewouldalsoliketothankGeneHumphriesattheUniversityofOregonforgivingusaccesstodatafromtheWallowaFlexibleArrayExperiment.Thisarticlewasmadepossiblethroughsupportpro-vided by US Army Space and Missile Defense Command. The opinions expressed herein are those of the authors and do not necessarily reflecttheviewsoftheUSArmySpaceandMissileDefenseCommand.
uSarray stations and regional infrasound arrays at the time of the bolide event.
a record section to the west of the event. We see two acoustic branches (at celer-ities from 225 to 312 m/s) to a range of over 300 km in this direction.
all branches from this event recorded by seismic stations and the infrasound array I56uS. Symbols are scaled by SnR and colored by azimuith from the source. Signals from the lone infrasound array near the source are represented by the blue squares at 300 km.

II-100 | IRIS CoRe PRoPoSal 2010 | Volume I I | non-eaRTHQuaKe SeISmIC SouRCeS
Spectrogram of Karymsky Volcano chugging, 1997. lines represent the fundamental and possible integer harmonics of the chugging sequence.
Harmonic Tremor on Active Volcanoes: Seismo-Acoustic wavefieldsJonathan Lees (University of North Carolina, Chapel Hill), Jeffrey Johnson (New Mexico Institute of Technology)
Harmonictremorisoftenobservedonactivevolcanoeswhereseismo-acousticarraysaredeployed.Inthispresentationwereview characteristic observational phenomena and discuss the continuum from monochromatic, oscillatory behavior through periodicacousticpulses(i.e.chugging)tospasmodicdrummingonnumerousvolcanoesworldwide.Harmonictremorcanpro-vide detailed constraints on physical parameters controlling activity in active vents through physical modeling. These include physicalconstraintsontheventgeometry,compositionanddensityofthemultiphasefluids,andvisco-elasticparametersofchokedflowintheconduits.Exampleswillshowseismictremorwithandwithoutanassociatedacousticemission,anindica-torofdynamicprocessesoccurringatthetopoftheactivevent.Whileexplosiveactivitycanrangewidelybetweenvolcanoes,harmonictremoroftenexhibitsremarkablysimilarbehavioronventsasdiverseasKarymsky,Tungurahua,Reventador,andSantiaguitoVolcanoes.Forexample,chuggingactivitytypicallyhasaconsistent0.7-2Hzsignalonmanyvolcanoesworldwide.Commonly observed gliding, where frequency modulates over time, suggests that conditions in the conduit are non-stationary, andmustbetreatedwithspecializedtimeseriesanalysis tools.Weexplorethesephenomenaandhighlightpossiblemodelsexplaining these near surface vent emissions.
References
Lees,J.M.,Johnson,J.B.,Ruiz,M.,Troncoso,L.andWelsh,M.,(2008).ReventadorVolcano2005:EruptiveActivityInferredfromSeismo-Acoustic Observation. J. Volcanol. Geotherm. Res., 176(1):179-190,doi:10.1016/j.jvolgeores.2007.10.006.
Lees, J.M. andRuiz,M., (2008).Non-linearExplosionTremor at Sangay,Volcano,Ecuador. J. Volcanol. Geotherm. Res., 176(1): 170-178doi:10.1016/j.jvolgeores.2007.08.012
Johnson,J.B.,andJ.M.Lees(2000),PlugsandChugs–StrombolianactivityatKarymsky,Russia,andSangay,Ecuador, J. Volcanol. Geotherm. Res., 101,67-82.
Acknowledgements:NSF:EAR-9614639,"SideEdgeofKamchatkaSlab",June1,1997-July31,2000.NSFProposalNo:EAR-0738768Title:Co
IRIS CoRe PRoPoSal 2010 | Volume I I | non-eaRTHQuaKe SeISmIC SouRCeS | I I -101
Volcanic Plume Height Measured by Seismic waves Based on a Mechanical ModelStephanie Prejean (Alaska Volcano Observatory, USGS), Emily Brodsky (UC Santa Cruz)
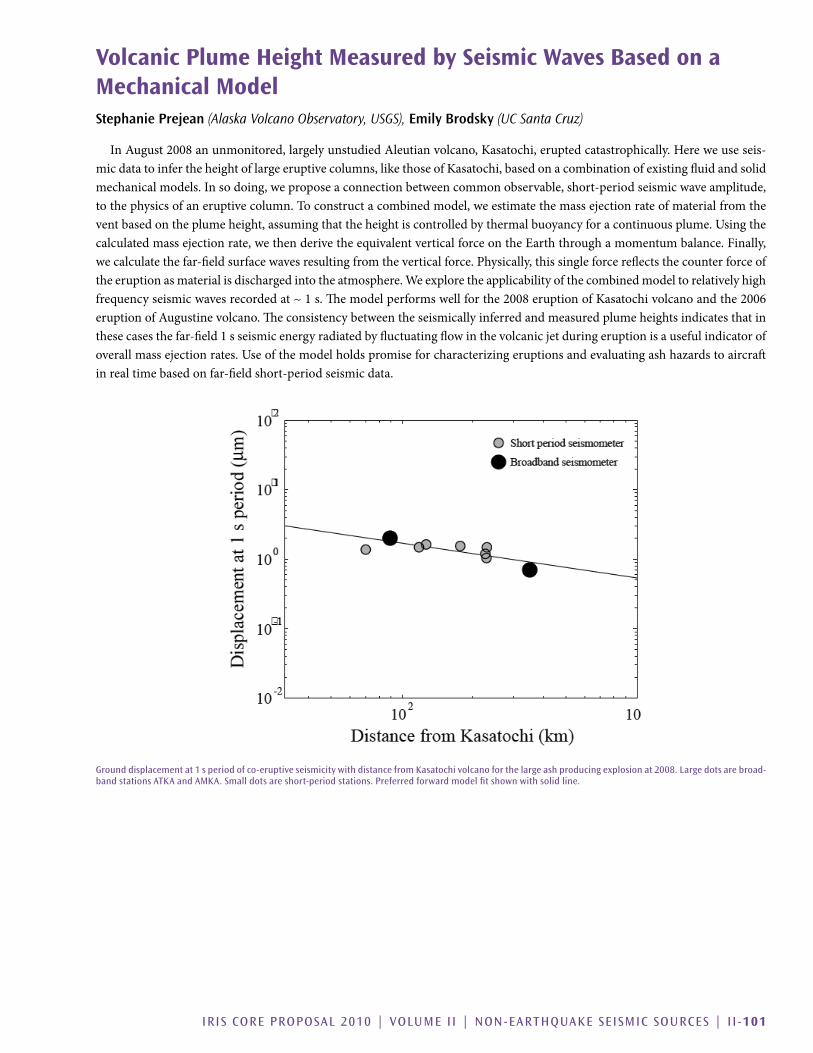
InAugust2008anunmonitored,largelyunstudiedAleutianvolcano,Kasatochi,eruptedcatastrophically.Hereweuseseis-micdatatoinfertheheightoflargeeruptivecolumns,likethoseofKasatochi,basedonacombinationofexistingfluidandsolidmechanical models. In so doing, we propose a connection between common observable, short-period seismic wave amplitude, tothephysicsofaneruptivecolumn.Toconstructacombinedmodel,weestimatethemassejectionrateofmaterialfromthevent based on the plume height, assuming that the height is controlled by thermal buoyancy for a continuous plume. Using the calculated mass ejection rate, we then derive the equivalent vertical force on the Earth through a momentum balance. Finally, wecalculatethefar-fieldsurfacewavesresultingfromtheverticalforce.Physically,thissingleforcereflectsthecounterforceoftheeruptionasmaterialisdischargedintotheatmosphere.Weexploretheapplicabilityofthecombinedmodeltorelativelyhighfrequencyseismicwavesrecordedat~1s.Themodelperformswellforthe2008eruptionofKasatochivolcanoandthe2006eruption of Augustine volcano. The consistency between the seismically inferred and measured plume heights indicates that in thesecasesthefar-field1sseismicenergyradiatedbyfluctuatingflowinthevolcanicjetduringeruptionisausefulindicatorofoverall mass ejection rates. Use of the model holds promise for characterizing eruptions and evaluating ash hazards to aircraft in real time based on far-field short-period seismic data.
Ground displacement at 1 s period of co-eruptive seismicity with distance from Kasatochi volcano for the large ash producing explosion at 2008. large dots are broad-band stations aTKa and amKa. Small dots are short-period stations. Preferred forward model fit shown with solid line.
II-102 | IRIS CoRe PRoPoSal 2010 | Volume I I | non-eaRTHQuaKe SeISmIC SouRCeS
Anomalous Earthquakes generated by Collapse of Magma ChambersAshley Shuler, Göran Ekström (Department of Earth and Environmental Sciences, Columbia University, Lamont-Doherty Earth Observatory)
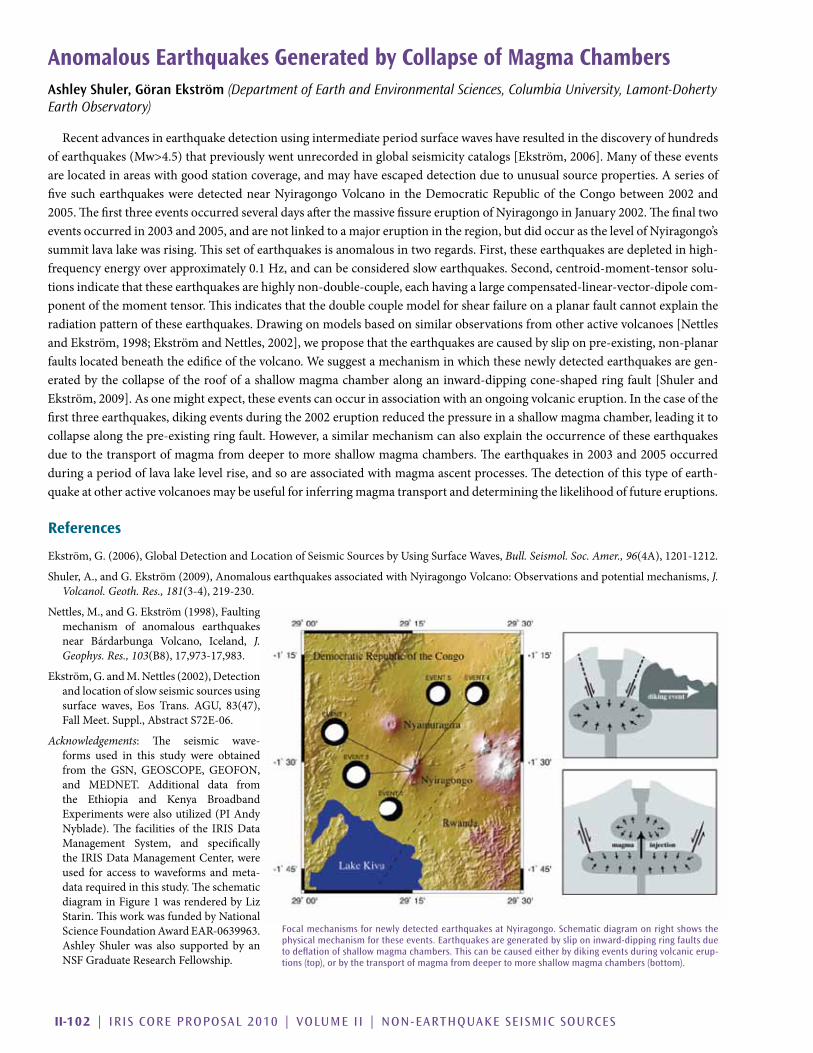
Recent advances in earthquake detection using intermediate period surface waves have resulted in the discovery of hundreds ofearthquakes(Mw>4.5)thatpreviouslywentunrecordedinglobalseismicitycatalogs[Ekström,2006].Manyoftheseeventsare located in areas with good station coverage, and may have escaped detection due to unusual source properties. A series of fivesuchearthquakesweredetectednearNyiragongoVolcanointheDemocraticRepublicof theCongobetween2002and2005. The first three events occurred several days after the massive fissure eruption of Nyiragongo in January 2002. The final two events occurred in 2003 and 2005, and are not linked to a major eruption in the region, but did occur as the level of Nyiragongo’s summit lava lake was rising. This set of earthquakes is anomalous in two regards. First, these earthquakes are depleted in high-frequencyenergyoverapproximately0.1Hz,andcanbeconsideredslowearthquakes.Second,centroid-moment-tensorsolu-tions indicate that these earthquakes are highly non-double-couple, each having a large compensated-linear-vector-dipole com-ponent of the moment tensor. This indicates that the double couple model for shear failure on a planar fault cannot explain the radiation pattern of these earthquakes. Drawing on models based on similar observations from other active volcanoes [Nettles andEkström,1998;EkströmandNettles,2002],weproposethattheearthquakesarecausedbysliponpre-existing,non-planarfaultslocatedbeneaththeedificeofthevolcano.Wesuggestamechanisminwhichthesenewlydetectedearthquakesaregen-erated by the collapse of the roof of a shallow magma chamber along an inward-dipping cone-shaped ring fault [Shuler and Ekström,2009].Asonemightexpect,theseeventscanoccurinassociationwithanongoingvolcaniceruption.Inthecaseofthefirst three earthquakes, diking events during the 2002 eruption reduced the pressure in a shallow magma chamber, leading it to collapsealongthepre-existingringfault.However,asimilarmechanismcanalsoexplaintheoccurrenceoftheseearthquakesdue to the transport of magma from deeper to more shallow magma chambers. The earthquakes in 2003 and 2005 occurred during a period of lava lake level rise, and so are associated with magma ascent processes. The detection of this type of earth-quake at other active volcanoes may be useful for inferring magma transport and determining the likelihood of future eruptions.
References
Ekström,G.(2006),GlobalDetectionandLocationofSeismicSourcesbyUsingSurfaceWaves,Bull. Seismol. Soc. Amer., 96(4A),1201-1212.
Shuler,A.,andG.Ekström(2009),AnomalousearthquakesassociatedwithNyiragongoVolcano:Observationsandpotentialmechanisms, J. Volcanol. Geoth. Res., 181(3-4),219-230.
Nettles,M.,andG.Ekström(1998),Faultingmechanism of anomalous earthquakes near Bárdarbunga Volcano, Iceland, J. Geophys. Res., 103(B8),17,973-17,983.
Ekström,G.andM.Nettles(2002),Detectionand location of slow seismic sources using surface waves, Eos Trans. AGU, 83(47),FallMeet.Suppl.,AbstractS72E-06.
Acknowledgements: The seismic wave-forms used in this study were obtained from the GSN, GEOSCOPE, GEOFON,and MEDNET. Additional data fromthe Ethiopia and Kenya BroadbandExperimentswerealsoutilized(PIAndyNyblade).The facilitiesof the IRISDataManagement System, and specifically the IRIS Data Management Center, were used for access to waveforms and meta-data required in this study. The schematic diagraminFigure1wasrenderedbyLizStarin. This work was funded by National ScienceFoundationAwardEAR-0639963.Ashley Shuler was also supported by an NSF Graduate Research Fellowship.
focal mechanisms for newly detected earthquakes at nyiragongo. Schematic diagram on right shows the physical mechanism for these events. earthquakes are generated by slip on inward-dipping ring faults due to deflation of shallow magma chambers. This can be caused either by diking events during volcanic erup-tions (top), or by the transport of magma from deeper to more shallow magma chambers (bottom).

IRIS CoRe PRoPoSal 2010 | Volume I I | non-eaRTHQuaKe SeISmIC SouRCeS | I I -103
Eruption Dynamics at Mount St. Helens Imaged from Broadband Seismic waveforms: Interaction of the Shallow Magmatic and Hydrothermal SystemsGregory Waite (Michigan Technological University)
The2004-2008eruptionatMountSt.Helenswascharacterizedbydomebuildingandshallow, repetitive, long-period (LP)earthquakes.Weanalyzedtheseismicityusingatemporaryarrayof19intermediatebandPASSCALseismometersdeployeddur-ingthesecondhalfof2005from~1to6kmfromtheactivevent.Waveformcross-correlationoftheLPeventsshowstheywereremarkable similarity for a majority of the earthquakes over periods of several weeks, indicating a repetitive source mechanism. Stackedspectraoftheseeventsdisplaymultiplepeaksbetween0.5and2Hzthatarecommontomoststations;thissuggeststhelow-frequencywaveformsareduetoasourceprocess,ratherthanpathaffects.Whenthefirstmotionswerediscernible,theyweredilatationalonstationsatalldistancesandazimuths.InadditiontotheLPevents,lower-amplitudevery-long-period(VLP)eventscommonlyaccompanytheLPevents.WemodeledthesourcemechanismsofLPandVLPeventsinthe0.5-4sand8-40sbands,respectivelybyfullwaveforminversion.ThesourcemechanismoftheLPeventsincludes:1)avolumetriccomponentmodeledasresonanceofagentlyNNW-dipping,steam-filledcracklocateddirectlybeneaththeactively-extrudingpartofthenewdomeandwithin100mofthecraterfloorand2)averticalsingleforceattributedtomovementoftheoverlyingdome.TheVLPsource,whichalsoincludesvolumetricandsingle-forcecomponents,is250mdeeperandNNWoftheLPsource,attheSWedgeofthe1980slava dome. The volumetric component points to the compression and expansion of a shallow, magma-filled sill, which is subparal-leltothehydrothermalcrackimagedattheLPsource,coupledwithasmallercomponentofexpansionandcompressionofadike.The single-force components are due to changes in the velocity of magma moving through the conduit. The location, geometry and timingofthesourcessuggesttheVLPandLPeventsarecausedbyperturbationsofacommoncracksystem.
References
Waite,G.P.,B.A.Chouet,andP.B.Dawson(2008),EruptiondynamicsatMountSt.Helensimagedfrombroadbandseismicwaveforms:Interaction of the shallow magmatic and hydrothermal systems, J. Geophys. Res., 113(B2),B02305.
Acknowledgements: Funding was provided primarily by theUSGSMendenhall Postdoctoral Fellowship.The IRIS-PASSCAL InstrumentCenter provided instruments and support for the temporary network. Data collected are available through the IRIS Data Management Center. The facilities of the IRIS Consortium are supported by the National Science Foundation under Cooperative Agreement EAR-0552316,theNSFOfficeofPolarProgramsandtheDOENationalNuclearSecurityAdministration
figure 1. Dilatational first motions are clear at all of the broadband stations for a sample event from 31 July 2005, plotted as a circle in the crater. The focal sphere in the inset shows distribution of the first motion recordings for the broadband stations, with a dashed line in the middle outlining the region where there are no broadband stations.
figure 2. east-northeast, three-dimensional, perspective view of the lP crack (blue) and VlP sill-dike (green) sources. Topography is shown as a surface and is contoured on the bottom at 20 m. Distances are in m and are relative to the origin of the 20-m-grid model used to calculate Green functions.

II-104 | IRIS CoRe PRoPoSal 2010 | Volume I I | non-eaRTHQuaKe SeISmIC SouRCeS
The Seismic Story of the Nile Valley Landslide - Foreshocks, Mainshock and AftershocksKate Allstadt, John Vidale, Weston Thelen, Paul Bodin (Univ. of Washington)
TheNileValleylandslide,inWashingtonState,11October2009,wasatranslationalslideinvolvingavolumeofmaterialontheorderof10^7cubicmeters.Itdamagedahighwayandseveralhousesanddivertedariver,causingflooding.Fortunatelynoone was injured because the landslide gave warning “foreshocks,” - rumbling sounds, rocks raveling, and a smaller precursory landslide in the days and hours beforehand.
The “mainshock” was a complex ground failure sequence occurring over the course of about 24 hours. The more energetic eventsgeneratedseismicsignalsthatwerecapturedbytwoPacificNorthwestSeismicNetwork(PNSN)short-periodregionalsta-tions12and29kmaway.Thispreciseseismictimeline,incombinationwithdetailedeyewitnessreportsandstudiesofthegeologyofthelandslideresultedinadetailedaccountoftheunfoldingofalandslideunlikeanyother.ThistimelineisshownonFigure1.
Afterthelandslideoccurred,weinstalled16temporaryseismicstations.Despitealackofsignificantcontinuedmovements,ourinstrumentsdetectedmorethan60smallevents,or“aftershocks.”Wewereabletolocatesomeofthelargereventsusingbeamforming techniques. The events were at the headscarp north of the slide, most likely slope failures due to instability of the newly created cliff-face.
References:
Anderson,D.andG.Taylor(2010),NileLandslideTimelineNarrativeReport,WashingtonStateDeptofTransportation,UnpublishedReport.
Acknowledgements:ThankstotheWashingtonStateDNRandDOT,inparticulartoDougAndersonandGabeTaylor.AlsotoIRISPASSCALforlendingusequipmentandAgnesHelmstetterforsharinghereventlocationmethods.
Seismic Timeline of the nile Valley landslide showing the main sliding sequence as detected at the two closest PnSn regional stations, both short period, vertical instruments. Station locations in relation to the slide are shown on the map at left. The spectrogram showing 12 hours of the landslide is shown on top and the traces filtered from 1 to 7Hz are shown below for each station. The seismic timeline is narrated in green at the top and the corresponding eyewitness timeline is narrated in orange at bottom. Times are Pacific Time.
edilsdnal raeh sessentiW oot si ti tuB .niaga gnivom
tI .epolspu ees ot krad emos gniyortsed snigeb
- esab eht ta sgnidliub gnippop dna gninaorg
...eunitnoc sdnuos
esirnuS
-muR gnisaercnIzH 6-4 ta gnilb
ta spop elpitlumCAN
dna gnilbmuRpop ces-5
ta gnilbmuR seunitnoc zH6-4
gnisaercni
CAN ta spoP erom emoceb
wef ,tneuqerfLLE ta wohs
-noc gnilbmur zH6-4 edutilpma tub seunit
gnihsinimid no esion cinortcelE
si tahw sedahs CAN zH6-4...gnineppah
gnihsimid eb ot sraeppa
-mur rekaeW ta LLE ta gnilb
.CAN naht zH6-4-ma ni gnisaercni
edutilp ta gnisolc hctiD
edisllih sa eot sevom ylwols
.yawhgih drawot tnatsnoc fo sdnuoS
yellav llif llafkcor
boL 3 e 4-0 tf0diw nivom e g
ssorca giH awh yta 4 tuoba .rh/m
saE ret ls n edivda cna ni gni otarg lev uq rra y
-eb gnilbmuR neve semoc
rednu reduol noitrop nretsae
edils fo
edilsdnal nretsaE .gnivom seunitnoc
gniknis eb ot sraeppa dna pot eht ta ni
ta tuo gniglubmottob
gnilbmuRylneddus semocebllits reduol
014 yawhgiH dessorc ti erehw edilsdnal nretseW
freq
(Hz)
CAN
0
2
4
6
8
01
05:2194:2184:2174:21
− 04
0
04
coun
tsfre
q (H
z)
LLE
0
2
4
6
8
01
05:2194:2184:2174:21
− 51051
coun
ts
ebol llams-hgiH sretne
014 yaw
gnilbmuR emoceb sesion
fo roolf ,reduol yrrauq levarg
gnitfilpu snigeb
htiw tsrub ces-001 tnegreme
.tesnosretneC
ta 6-4
zH dna
tsew dna tsaE gnitsurht edils
-noc ,eot ta pu .tfilpu tnats
-yortsed snigeB dna sesuoh gni
gnikatrevo .yrrauq levarg
-nitnoc gnitfilpU 02~ rof seu
sruoh
eht fo wolf skcolb tfilpU sesuac ,revir eht fo tser emos hguorht gnidoolf
-nahc ti sdnif ti litnu sesuohmaertsnwod niaga len
freq
(Hz)
CAN
0
2
4
6
8
01
05:1194:1184:1174:1164:1154:1144:1134:1124:1114:1104:11
− 05005
coun
tsfre
q (H
z)
LLE
0
2
4
6
8
01
05:1194:1184:1174:1164:1154:1144:1134:1124:1114:1104:11
− 02002
freq
(H
z)
CAN
0
2
4
6
8
01
54:4104:4153:41
− 001
0
001
freq
(H
z)
LLE
0
2
4
6
8
01
54:4104:4153:41
− 05
0
05
NSNP ybraen fo noitacoL yellaV eliN ot noitaler ni snoitats
)htraE elgooG( edilsdnaL
revir siht dekcolb edilsdnal nretsew ehTgnitrevid dna retaw fo ti gniytpme ,lennahc
maerts eht
pracsdaeh fo esab ta nebarg dna pracsdaeHedilsdnal tsae fo
ni elcihev denrutrevOyrrauq levarg
ta aera detfilpu ta pracs tluaf tsurhTedilsdnal nretsae fo esab
gnidoolf ot eud llafretaw denrut yawevirDlennahc maerts dekcolb eht morf gnitluser
A
‘A
zH2-1
fo snim 51~ dnabdaorb
gnilbmur deretnec
no zH5
nretsaE sliaf epols
yldipar
epols tsew-atac sliaf
,yllacihports eht stfilpu eot ta daor skcolb dnarevir fo flah
qerf rehgiH )zH01-5( slangis
ton esion lacol era-dilsdnal ot detaler
gni
dnoces-5 owTspop
ELLmk9
2()
N CA k21( m)
00:20
00:20
00:50
00:50 00:80
00:80
00:11
00:11
00:41
00:41
freq
(Hz)
NAC
0
2
4
6
8
10
16:35 16:40 16:45 16:50 16:55 17:00 17:05
−400
0
400
coun
tsfre
q (H
z)
ELL
0
2
4
6
8
10
16:35 16:40 16:45 16:50 16:55 17:00 17:05
−100
0
100
coun
ts
Overview of different landslide movements, courtesy of Washington StateDepartment of Transportation [Anderson and Taylor, 2010]. Times are Pac-ific Time. Circled area indicates approximate location of gravel quarry.
IRIS CoRe PRoPoSal 2010 | Volume I I | non-eaRTHQuaKe SeISmIC SouRCeS | I I -105
A Search for the Lunar Core Using Array SeismologyPeiying Patty Lin (Arizona State University), Renee Weber (U.S. Geological Survey), Edward Garnero (Arizona State University)
ApolloPassiveSeismicExperiment(ApolloPSE)seismometersweredeployedonthenearsideoftheMoonbetween1969and1972,andcontinuouslyrecorded3componentsofgroundmotionuntillate1977.ThesedataprovideauniqueopportunityforinvestigatingaplanetaryinteriorotherthantheEarth.PSEdatapotentiallyprovidethemostdirectinformationaboutthestruc-ture of the lunar interior, including the thermal and compositional evolution of the Moon. The size and the state of the Moon¡¦s coreremainprimaryquestionsregardingthedeeplunarinterior.Pastseismicmodelsofthelunarinteriorreportsignificantlydiminished resolution in the deepest Moon, and frequently don’t cite model solutions in the deepest 500 km of the interior.
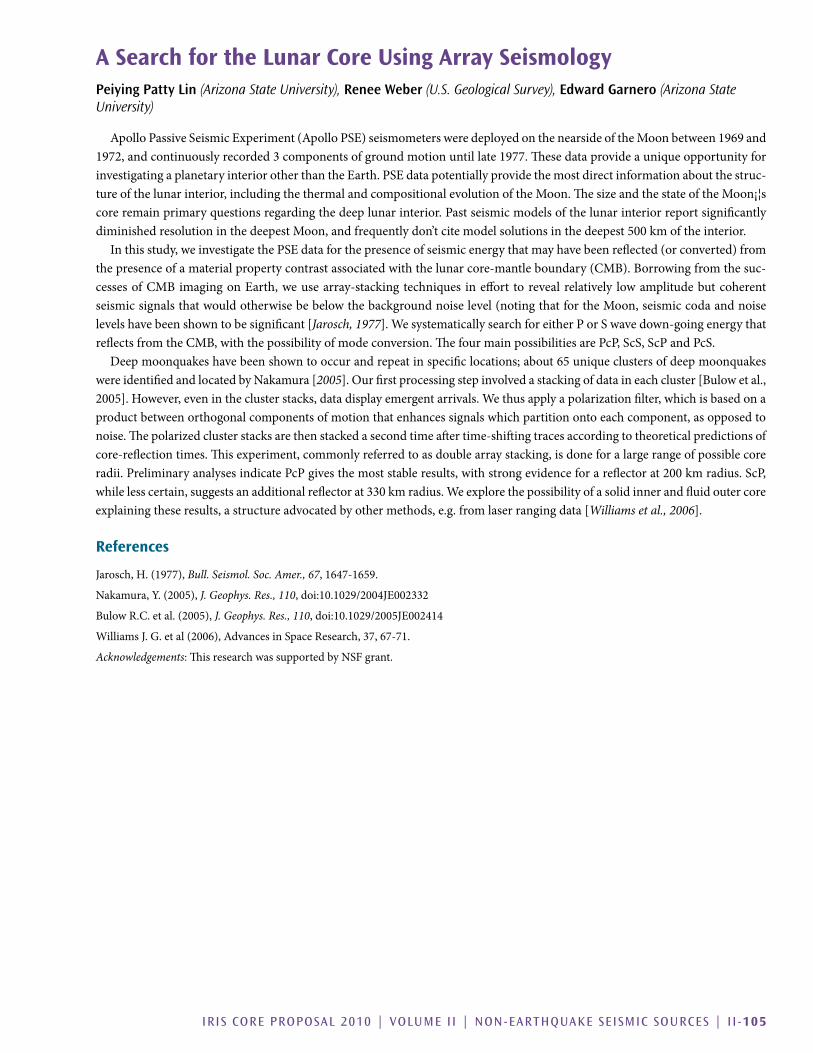
Inthisstudy,weinvestigatethePSEdataforthepresenceofseismicenergythatmayhavebeenreflected(orconverted)fromthepresenceofamaterialpropertycontrastassociatedwiththelunarcore-mantleboundary(CMB).Borrowingfromthesuc-cessesofCMBimagingonEarth,weusearray-stackingtechniques ineffort torevealrelatively lowamplitudebutcoherentseismicsignalsthatwouldotherwisebebelowthebackgroundnoiselevel(notingthatfortheMoon,seismiccodaandnoiselevels have been shown to be significant [Jarosch, 1977].WesystematicallysearchforeitherPorSwavedown-goingenergythatreflectsfromtheCMB,withthepossibilityofmodeconversion.ThefourmainpossibilitiesarePcP,ScS,ScPandPcS.
Deepmoonquakeshavebeenshowntooccurandrepeatinspecificlocations;about65uniqueclustersofdeepmoonquakeswere identified and located by Nakamura [2005].Ourfirstprocessingstepinvolvedastackingofdataineachcluster[Bulowetal.,2005].However,evenintheclusterstacks,datadisplayemergentarrivals.Wethusapplyapolarizationfilter,whichisbasedonaproduct between orthogonal components of motion that enhances signals which partition onto each component, as opposed to noise. The polarized cluster stacks are then stacked a second time after time-shifting traces according to theoretical predictions of core-reflectiontimes.Thisexperiment,commonlyreferredtoasdoublearraystacking,isdoneforalargerangeofpossiblecoreradii.PreliminaryanalysesindicatePcPgivesthemoststableresults,withstrongevidenceforareflectorat200kmradius.ScP,whilelesscertain,suggestsanadditionalreflectorat330kmradius.Weexplorethepossibilityofasolidinnerandfluidoutercoreexplaining these results, a structure advocated by other methods, e.g. from laser ranging data [Williams et al., 2006].
References
Jarosch,H.(1977),Bull. Seismol. Soc. Amer., 67,1647-1659.
Nakamura,Y.(2005), J. Geophys. Res., 110,doi:10.1029/2004JE002332
BulowR.C.etal.(2005), J. Geophys. Res., 110,doi:10.1029/2005JE002414
WilliamsJ.G.etal(2006),AdvancesinSpaceResearch,37,67-71.
Acknowledgements: This research was supported by NSF grant.