regional model-data comparison: an nacp interim synthesis project coordinators: andy jacobson, mac...
TRANSCRIPT

Regional Model-Data Comparison: An NACP Interim
Synthesis Project
Coordinators: Andy Jacobson, Mac Post, Debbie Huntzinger, Bob
Cook
Participants: Dozens of modeling teams and data providers,
Canada, USA, Mexico, Europe

Regional MDC Questions with Focus on North America
• Interannual Variation– What is the spatial pattern and magnitude of interannual
variation in carbon fluxes during 2000-2005?– What are the components of carbon fluxes and pools that
contribute to this variation?
• 2002 Drought– Do model results and observations show consistent spatial
patterns in response to the 2002 drought? – From measurements and ecosystem models, can we infer
what processes were affected by the 2002 drought?
• Identification of Sources/Sinks– What are the magnitudes and spatial distribution of carbon
sources and sinks, and their uncertainties during 2000-2005?

CarbonTracker Inversion Model, Net Terrestrial Summer Flux (gC/m2/yr)www.esrl.noaa.gov/gmd/ccgg/carbontracker/
CarbonTracker Estimated C Source/Sink
ö

NASA-CASA Estimated C Source/Sink

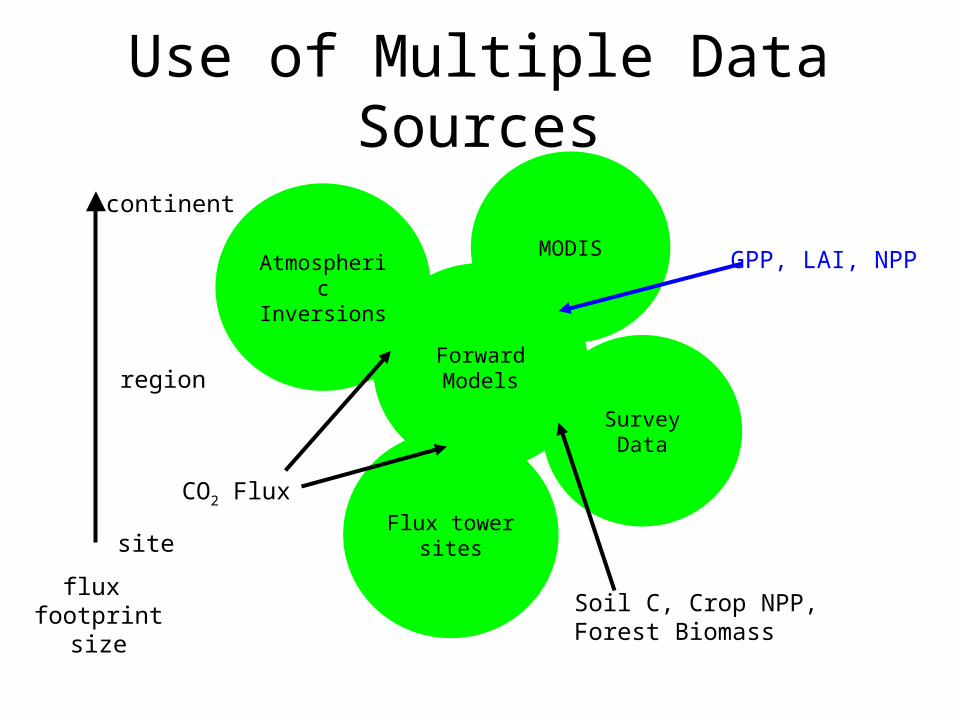
Atmospheric Inversions
ForwardModels
MODIS
Flux tower sites
CO2 Flux
GPP, LAI, NPP
Use of Multiple Data Sources
Survey Data
Soil C, Crop NPP, Forest Biomass
flux footprint
size
site
continent
region
Regional MDC Objectives• Development of benchmark data sets and
approaches for model-data evaluation.• Evaluation of strengths and weaknesses of various
model formulations, both inverse models and ecosystem models resulting from the comparison to data.
• Formal comparison of inverse and forward ecosystem model results for enhancing identification and diagnosis of temporal and spatial patterns of carbon fluxes.
• Understanding of mechanistic processes which lead to model differences

Synthesis of Interim NACP Results
Ecosystem Models• Contribute in hand regional, continental results
(including ones cut from global analyses)• A range of temporal and spatial resolutions• No standardization of model runs!
Inversion Models• Contribute North America results in hand from
TRANSCOM or from other relevant activities• Spatial scales
– TRANSCOM regions, and – 1º grids centered on half-degrees
• Temporal scale - monthly

Ecosystem (Forward) Models
ftp://nacp.ornl.gov/synthesis/2008/firenze/continental/continental_data_model_inventory.html

Inversion Models• Results by Transcom Regions
– Transcom3 IAV inversion (D Baker),13 models
– Rödenbeck Jena, 3 different networks
– CarbonTracker
– FRCGC Japan (Patra)
– U Michigan geostat, 2 models
– LSCE France (Peylin)
– LSCE France (Chevallier)
– LSCE France (Rayner)
– Penn State (Butler), 2 models
• Results by 1 degree – U of Toronto
– CarbonTracker
– LSCE
– Jena
– U of Michigan
– MLEF-PCTM – Colorado State University
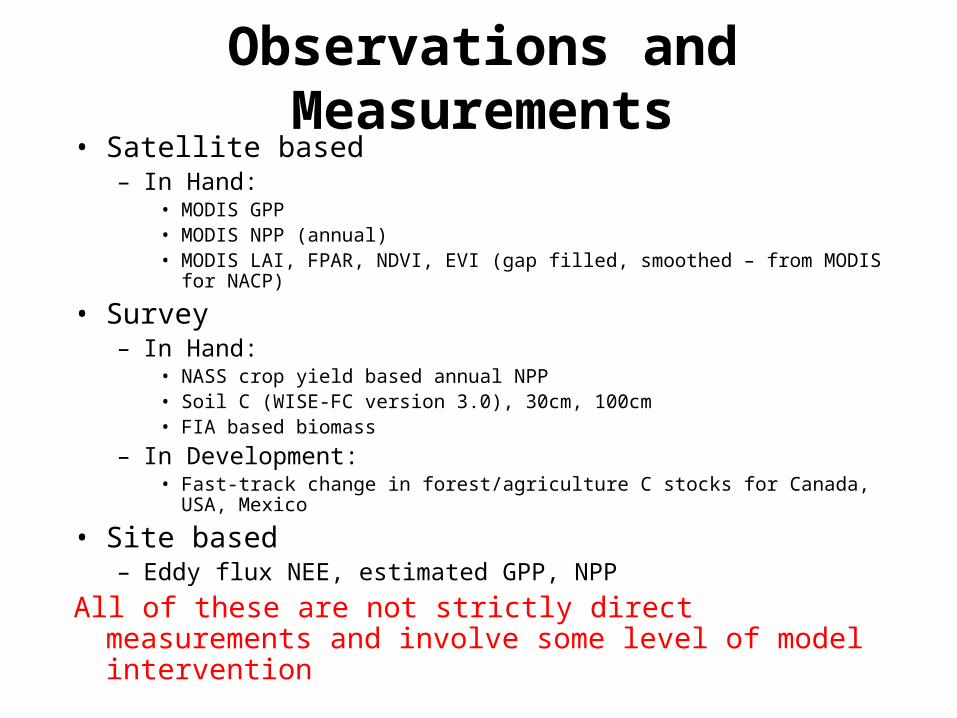
Observations and Measurements• Satellite based
– In Hand:• MODIS GPP• MODIS NPP (annual) • MODIS LAI, FPAR, NDVI, EVI (gap filled, smoothed – from MODIS for
NACP)
• Survey– In Hand:
• NASS crop yield based annual NPP• Soil C (WISE-FC version 3.0), 30cm, 100cm• FIA based biomass
– In Development:• Fast-track change in forest/agriculture C stocks for Canada, USA, Mexico
• Site based– Eddy flux NEE, estimated GPP, NPP
All of these are not strictly direct measurements and involve some level of model intervention

Conversion to Common Grid - both Data and Model
• Spatial Resolution: 1°x1°, centered at (x.5, y.5 for each grid cell)
• Domain: 50° to 170° W longitude, 10° to 84° N latitude
• Temporal Resolution: monthly (or annual)
• netCDF files, CF-1 convention• ftp://nacp.ornl.gov/synthesis/2008/firenze/continental
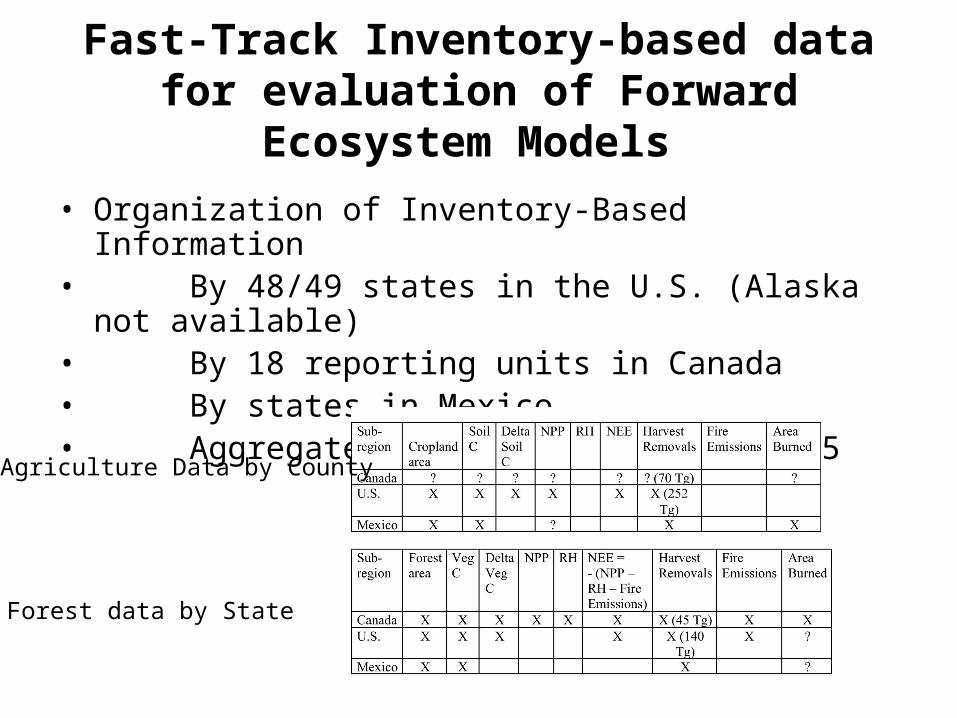
Fast-Track Inventory-based data for evaluation of Forward Ecosystem Models
• Organization of Inventory-Based Information• By 48/49 states in the U.S. (Alaska not available)• By 18 reporting units in Canada• By states in Mexico• Aggregated estimates for 2000-2005
Agriculture Data by County
Forest data by State

Inverse Models• Produce model predictions of atmospheric CO2
mole fractions
• Compare with the observed atmospheric CO2 mole fraction
• Difference between them is attributed to differences in estimated (first guess) and the actual sources and sinks
• Numerical techniques, reduce these differences and solve for a set of sources and sinks that most closely matches the observed CO2 mole fraction

North AmericaBoreal (NABR)
North America Temperate (NATM)


Atmospheric Inversions
ForwardModels
MODIS
Flux tower sites
CO2 Flux
GPP, LAI, NPP
Use of Multiple Data Sources
Survey Data
Soil C, Crop NPP, Forest Biomass
flux footprint
size
site
continent
region
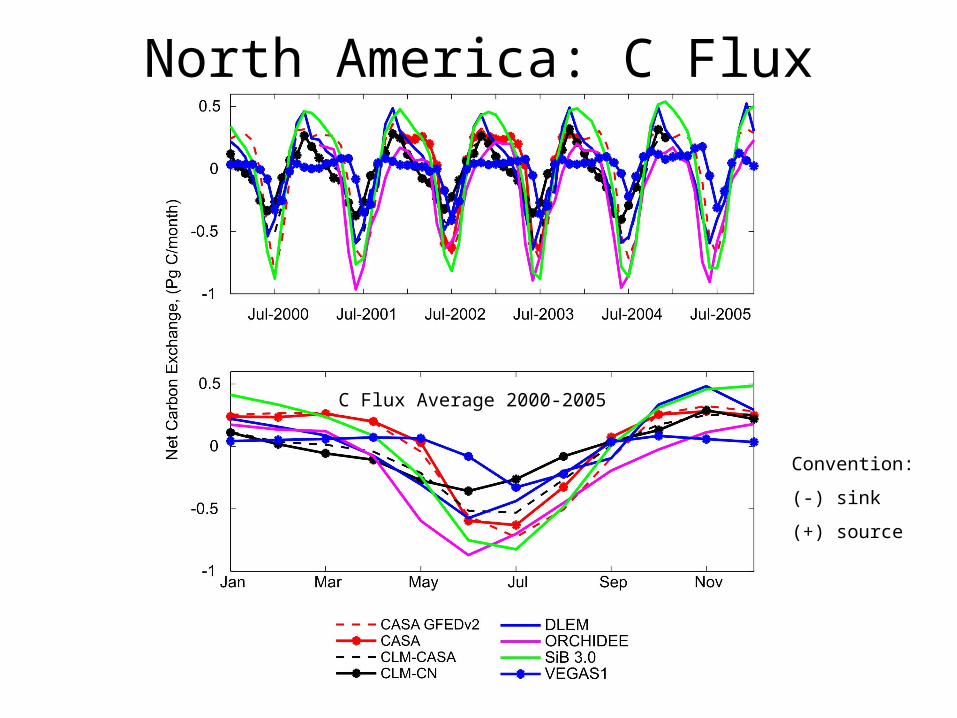
Convention:
(-) sink
(+) source
North America: C Flux
C Flux Average 2000-2005

2002 Inter-Model Annual Carbon Flux
Mean Carbon Flux Standard Deviation Carbon Flux
Inverse ModelsN=5
Forward ModelsN=12

2004 Inter-Model Annual Carbon Flux
Mean Carbon Flux Standard Deviation Carbon Flux
Forward ModelsN=12
Inverse ModelsN=5
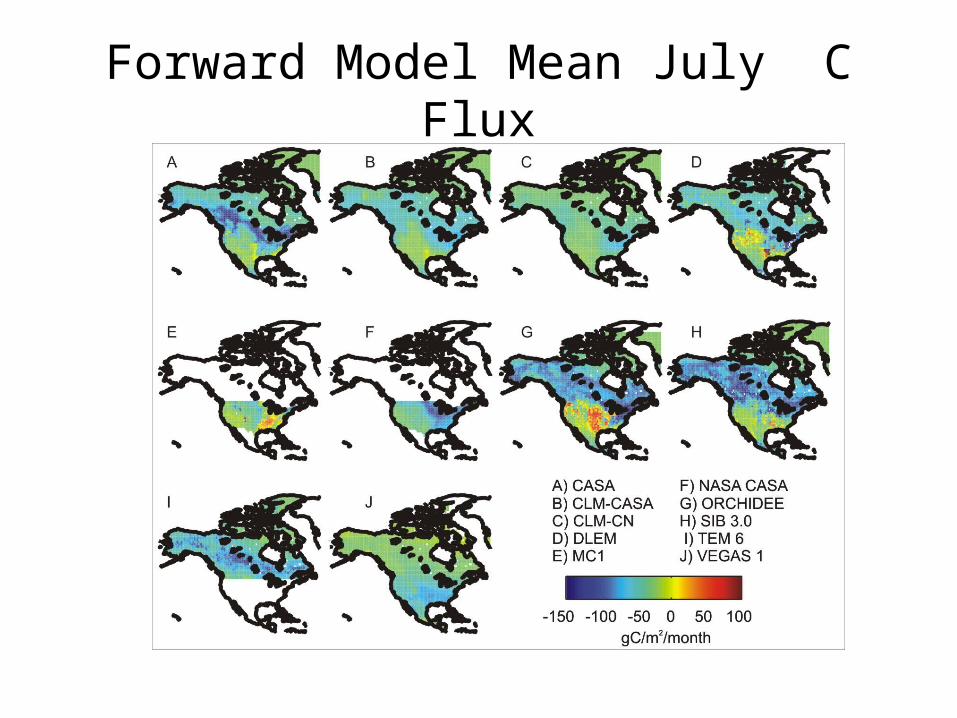
Forward Model Mean July C Flux
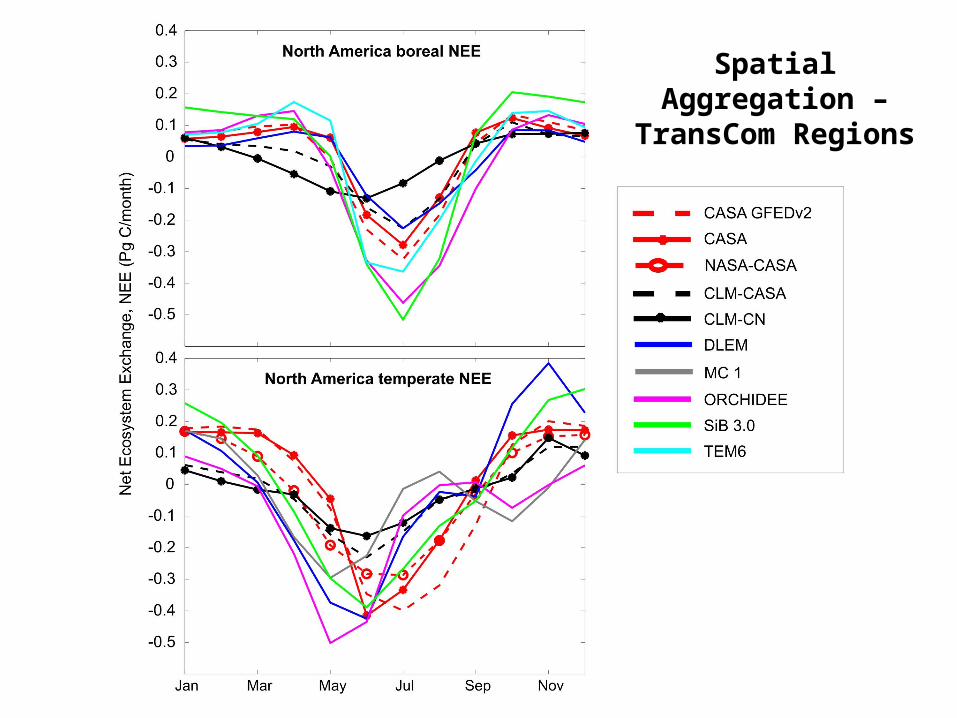
Spatial Aggregation – TransCom Regions

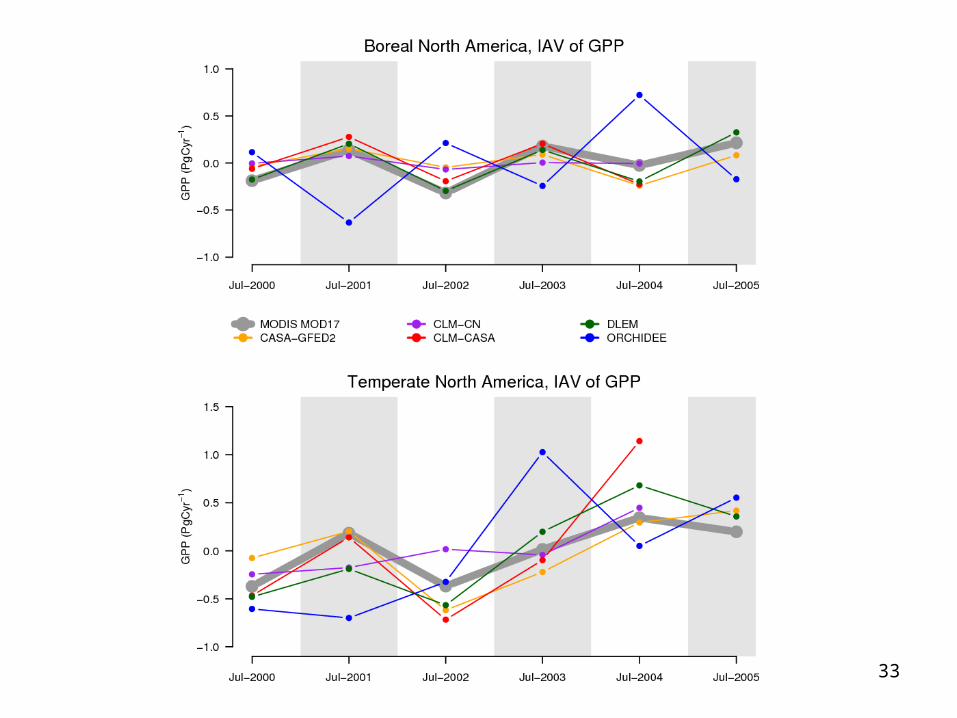
IAV of NEE from Forward Models

IAV of NEE from Forward Models

Inversions25th
percentileCentral
75th percentile
Uptake 0.7 1.0 1.4
IAV peak-peak 0.8 1.2 1.6
IAV (sd) 0.26 0.34 0.44
Forward models
25th percentile
Central75th
percentile
Uptake 0.0 0.3-0.5 0.4
IAV peak-peak 0.2 0.5 0.8
IAV (sd) 0.06 0.18 0.29
Summary of NEE (boreal and temperate) comparison between Inverse and
Forward Models

Forward or Ecosystem Models• Large diversity of model types constructed for different
reasons– Statistical relationships with environmental factors– Biologically based process representations based on
experimental analyses
– Incorporate a subset of processes that contribute to total CO2 flux – often disturbances that, for a single location, are episodic are left out (NEE vs. NECB).
• More ecosystem components are modeled and therefore allows comparison with wider range of observations• Long-term carbon pools, steady-state issues,
dependence on initial conditions introduce difficulties
Atmospheric Inversions
ForwardModels
MODIS
Flux tower sites
CO2 Flux
GPP, LAI, NPP
Use of Multiple Data Sources
Survey Data
Soil C, Crop NPP, Forest Biomass
flux footprint
size
site
continent
region

Prepared by Andy Jacobson, NOAA
Spatial Aggregation Forward Models for TransCom Regions
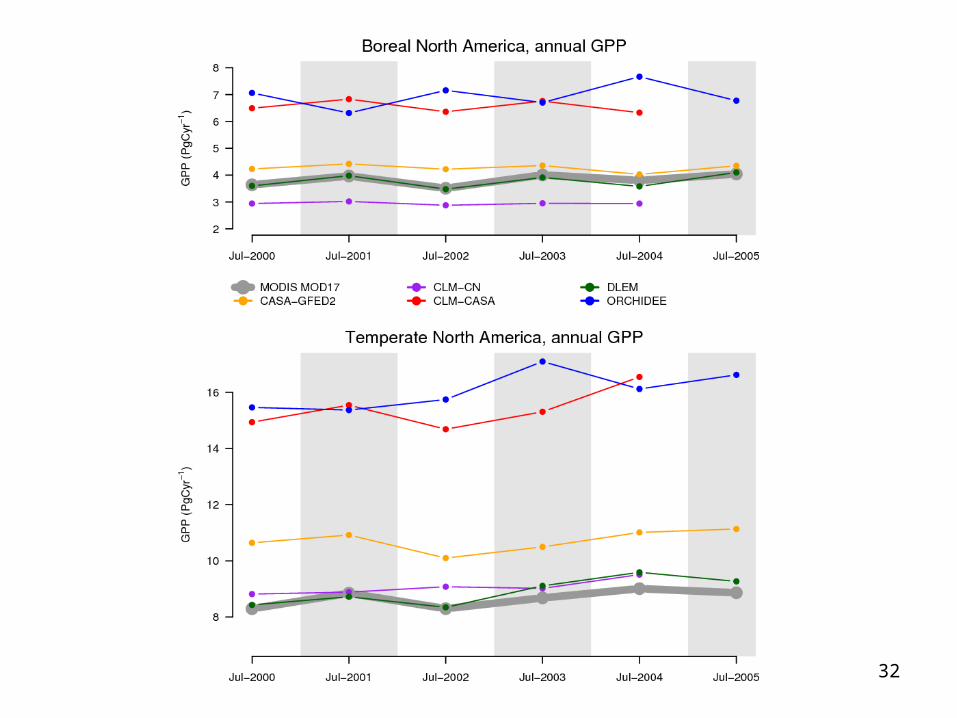
32
33

Inter-Model Variation in NEE Components – JJA (summer) 2002
Models included:• CLM-CASA• CLM-CN• ORCHIDEE• VEGAS1• EC-LUE• MC1• TEM6• CASA-GFed2• NASA-CASA• DLEM
1 Standard DeviationMean
GPP
Ra
Rh

Inter-Model Variation in NEE Components – JJA (summer) 2004
1 Standard DeviationMean
GPP
Ra
Rh
Models included:• CLM-CASA• CLM-CN• ORCHIDEE• VEGAS1• EC-LUE• MC1• TEM6• CASA-GFed2• NASA-CASA• DLEM

Taylor Diagrams
RMSD2=sd_obs2+sd_mod2-2*sd_obs*sd_mod*R


Atmospheric Inversions
ForwardModels
MODIS
Flux tower sites
CO2 Flux
GPP, LAI, NPP
Use of Multiple Data Sources
Survey Data
Soil C, Crop NPP, Forest Biomass
flux footprint
size
site
continent
region

Agricultural NPP
•Select 1 degree cells that are 50% managed agriculture•Compare model NPP in same 1 degree cells

Agricultural NPP
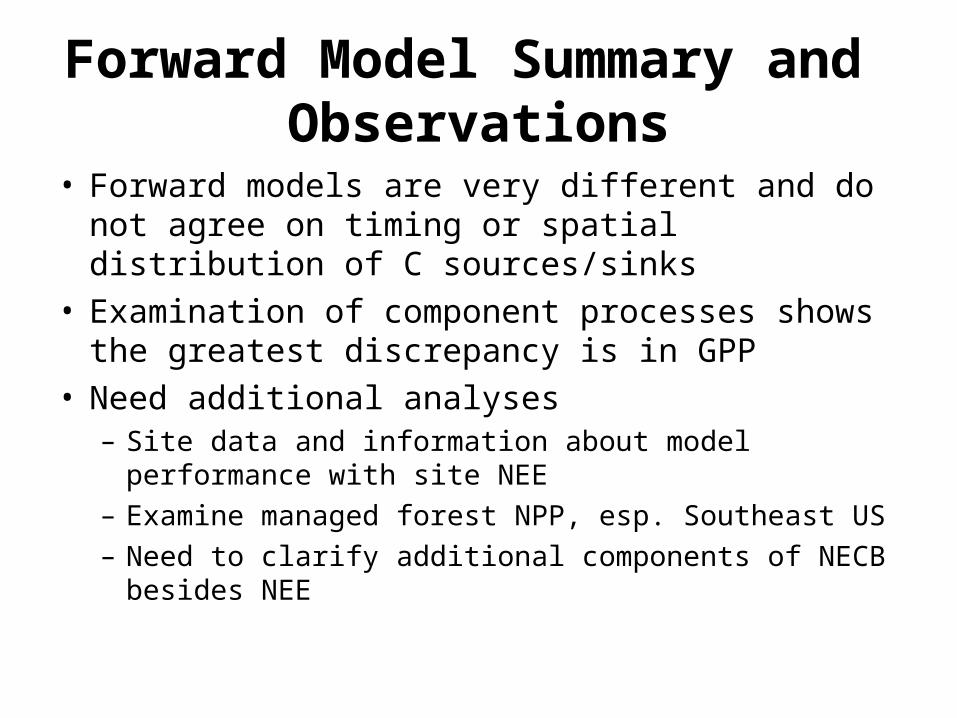
Forward Model Summary and Observations
• Forward models are very different and do not agree on timing or spatial distribution of C sources/sinks
• Examination of component processes shows the greatest discrepancy is in GPP
• Need additional analyses– Site data and information about model performance with
site NEE
– Examine managed forest NPP, esp. Southeast US
– Need to clarify additional components of NECB besides NEE
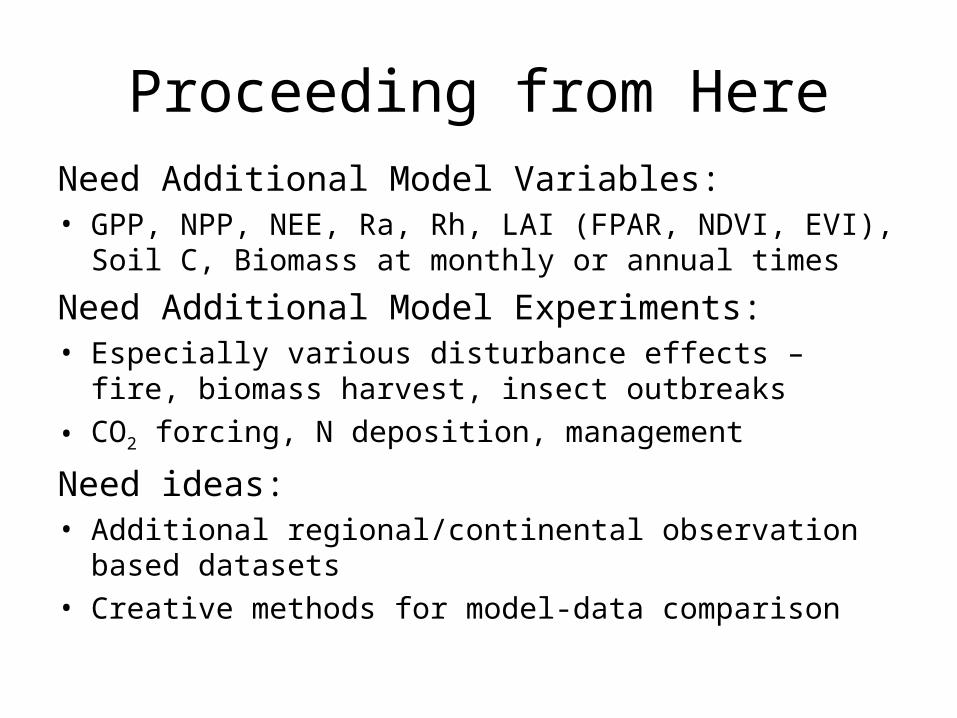
Proceeding from HereNeed Additional Model Variables:• GPP, NPP, NEE, Ra, Rh, LAI (FPAR, NDVI, EVI), Soil
C, Biomass at monthly or annual times
Need Additional Model Experiments:• Especially various disturbance effects – fire, biomass
harvest, insect outbreaks
• CO2 forcing, N deposition, management
Need ideas:• Additional regional/continental observation based
datasets• Creative methods for model-data comparison

Reporting of Current FindingsTasks• Gather additional forward model metadata
– What components of NECB are included– How processes are represented– Details on boundary and forcing conditions
• Develop Manuscripts– Fast-track Forest and Agriculture inventory – Model comparison
– Temporal Analysis – mostly completed, need to complement with and “expert” update of the SOCCR estimates on an annual time step (Jacobson, McGuire, Post, others). This could involve interaction with Site Synthesis results for non-managed ecosystems (Tundra, wetlands, grasslands, stc.)
– Spatial Analysis (Huntzinger, Post)
– Extreme event analysis (Zeng)

After the Interim Synthesis: The Well Planned Regional Synthesis
• Conduct a formal regional scale data-model comparison
• Development of benchmarks for model evaluation ala C-LAMP
• Development of inventory change estimates and uncertainties in those estimates that are spatially and temporally resolved – Soil C, Forest, Agriculture
• Evaluation of inversion sensitivity to terrestrial biosphere model priors and other inversion uncertainties
• Evaluation of sensitivity of flask station CO2 concentration estimates to terrestrial biosphere model and fossil fuel fluxes
• Model-data synthesis activities should NOT be delayed until after all data collection. They should begin now!