regional disparities in sri lanka: an empirical … · asia-pacific development journal vol. 21,...
TRANSCRIPT
Asia-Pacific Development Journal Vol. 21, No. 2, December 2014
77
REGIONAL DISPARITIES IN SRI LANKA:AN EMPIRICAL ANALYSIS
Deeptha Wijerathna, Jayatilleke S. Bandara, Christine Smith andAthula Naranpanawa*
To effectively implement the proposed United Nations developmentagenda beyond 2015, Governments will need to focus on reducinginequality in their national planning strategies. In order to provide anevidence base for such planning in the Sri Lankan context, a systematicand comprehensive analysis on regional inequality is required. Thepresent study begins to undertake this type of analysis using summarysigma convergence statistics, such as the coefficient of variation, the Ginicoefficient and mean deviation scores. Regional gross domestic product(GDP) per capita data for the period 1996 to 2011 reveal that inequalitywith respect to this welfare indicator is considerable. Analysis of trends,over this 16-year period, indicates that while some beta convergencehas occurred since 2000, this convergence (both conditional andunconditional) is not statistically significant. Indeed, the results suggestthat based on current trends, it will take 15 years to halve the currentinequality and about 30 years to achieve a regionally balanced economy.In this context, well-planned regionally inclusive development strategiesare needed in order for Sri Lanka to move forward, especially sincethe current levels of regional disparity are argued by some to havecontributed to the civil unrest and conflict that led to a reduction innational economic development over the three decades to 2009.
JEL Classification: O2, O53, R11, R12, R58.
Key words: Economic disparity, regions, inequality, convergence, divergence,Sri Lanka.
* Deeptha Wijerathna, corresponding author (Tel: +61 7 3735 7295; fax: +61 7 3735 7760; e-mail:[email protected], [email protected]); Jayatilleke S. Bandara, AssociateProfessor; Christine Smith, Professor; and Athula Naranpanawa, PhD, are from Department ofAccounting, Finance and Economics, Griffith University, Nathan, QLD 4111 Australia. An earlier version ofthis paper was presented at the 9th International Conference of Network of Asia Pacific Schoolsand Institutes of Public Administration and Governance (NAPSIPAG), which was held in Colombo from12 to 14 December 2012. The present paper also benefited from constructive comments made at theConference, as well as from those provided by two anonymous referees associated with this Journal.
Asia-Pacific Development Journal Vol. 21, No. 2, December 2014
78
I. INTRODUCTION
Sri Lanka needs to focus on post-war development strategies to get itseconomy back on track after it was severely affected by a civil war that ended in 2009following nearly three decades of conflict (Collier, Hoeffler and Rohner, 2009; Wright,2009). Furthermore, the country also faces the challenge of framing these strategiesso that an equitable share of the benefits of economic growth is accessible to allregions and communities. Regionally imbalanced economic growth and regionaldisparities in the level of well-being is a widely discussed topic. Notably, it is evidentin both developing and developed countries (Smith, 2004).
As many authors have highlighted, economic disparities can lead to socialunrest and civil conflicts, which, in turn, contribute to the further widening of thosedisparities (Sen, 1997; World Bank, 2011; Wright, 2009; Vu and others, 2012; Buhaugand Gates, 2002; Buhaug and others, 2011). In its recent turbulent political history,particularly since 1970, Sri Lanka experienced two youth insurrections in the southernpart of the country, one in 1971 and the other in the late 1980s, and nearly threedecades of civil armed conflict in the northern and eastern provinces. In fact, in thelate 1980s the country was involved in two wars, one in the South and another one inthe North and the East (Abeyratne, 2004). The catchy slogan Kolambata Kiri GamataKekeri (Villagers have only low value cucumber, while people in Colombo enjoy thecream!), which was used by the southern revolutionary youth movement uprising inthe late 1980s under the banner of Janatha Vimukthi Peramuna (JVP), provides a goodexample of civil unrest aroused by regional inequality and lack of economic andemployment opportunities in regional economies (Sri Lanka, Presidential Commisionof Youth, 1990; Hasbullah and Morrison, 2004; Karnik, 2002; Yeung and Lin, 2003).Even though the armed struggle of the Liberation Tigers of Tamil Eelam (LTTE),commonly known as the Tamil Tigers, for a separate state in the northern and easternparts of Sri Lanka is widely viewed as a terrorism problem, regional economicdisparities that prevented equitable access to opportunities generated by nationaleconomic development following the opening up of the economy in 1977 is oftenacknowledged to be a major cause of it (Abeyratne, 2004; Grobar and Gnanaselvam,1993; Arunathilake, Jayasooriya and Kelegama, 2001; Dhananjayan, 2005).
To ensure that post-war economic and political stability continues, theGovernment of Sri Lanka is implementing a ten year development strategy targetinglagging regions under the banner Mahinda Chintana (Sri Lanka, National PlanningDivision, 2010). Mahinda Chintana gives priority to investments in infrastructure on therationale that this type of investment will contribute to the rebalancing of regionaleconomic growth. It also identifies a number of other policy measures to rebalanceeconomic development, emphasizing their contribution to both spatial equity andeconomic efficiency (World Bank, 2010).
Asia-Pacific Development Journal Vol. 21, No. 2, December 2014
79
Clear understanding about the current level of economic disparities and thedynamics of those disparities during the past is of key importance in evaluating theimpact of Mahinda Chintana and in formulating further development strategies aimedat reducing regional disparities. The number of Sri Lankan-specific studies on thisissue is relatively sparse. The main objective of the present paper, therefore, is toconduct a comprehensive and updated empirical analysis on regional disparities eventhough the regional statistical database to support such analysis is weak incomparison with a number of other countries. The paper also provides a brief reviewof related theories and global experiences in analysing and mitigating regionaldisparities.
The present paper is structured as follows. The next section provides a briefoverview of stylized facts on regional disparities and possible reasons for suchdisparities in Sri Lanka. Section three presents a summary of related economictheories and global experience. It also documents previous attempts to analyseregional development disparities in Sri Lanka. The fourth section provides an overviewof the methodology employed in this paper to analyse such disparities over the period1996-2011. The fifth section presents the authors’ empirical findings, and the finalsection contains concluding remarks and a discussion on some relevant policyimplications.
II. SRI LANKAN REGIONS: STYLIZED FACTS
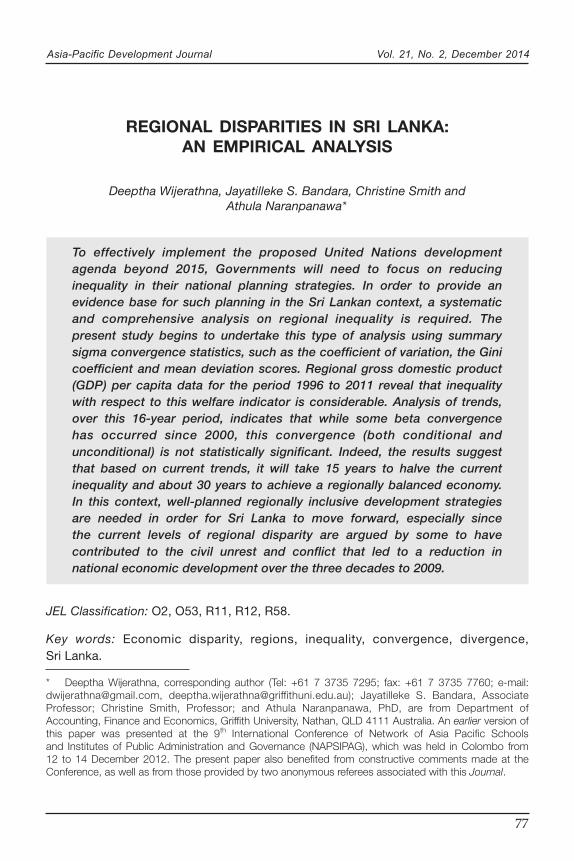
Sri Lanka is a small island in the Indian Ocean, located at the south-easternpart of the southern tip of the Indian subcontinent. It was a British colony from 1815to 1948 (De Silva, 1981). During that period, the country was geographically dividedinto nine provinces (see figure 1).
Except for the period 1948 to 1956 during which the colonial open economicpolicies were continued following independence and a brief episode of partial tradeliberalization (from 1965-1970), Sri Lanka had a centralized unitary Government withclosed economic policies up to 1977. The right-of-centre Government, led by theUnited National Party (UNP), which came to power in 1977, opened the economy byintroducing a trade liberalization package and undertaking other structural reforms,including privatization. In 1978, the newly elected Government also introduced a newConstitution, making considerable changes to the administrative system. In responseto growing regional unrest, especially in the Northern and Eastern provinces and theIndian intervention in 1987, the 13th Amendment to the 1978 Constitution was madeto establish provincial councils as a second layer of Government (Leitan, 1990; SriLanka, 1987; Marasinghe, 2007).
Asia-Pacific Development Journal Vol. 21, No. 2, December 2014
80
With the introduction of the provincial council system in 1988, the planning andadministrative activities of Sri Lanka were decentralized to a certain extent. Due tovariations in natural conditions, resource endowments and sociocultural settings, theproduction systems and economic conditions also vary across the provinces.According to statistics for 2011, 44 per cent of national GDP is produced in theWestern province. This province, which is home to Colombo, the capital city, andserves as the country’s commercial centre, comprises 5.7 per cent of the land areaand 28 per cent of the population (see for details, Bandara and Jayasuriya, 2010;World Bank, 2010; Wijerathna, Bandara and Karunagoda, 2013).
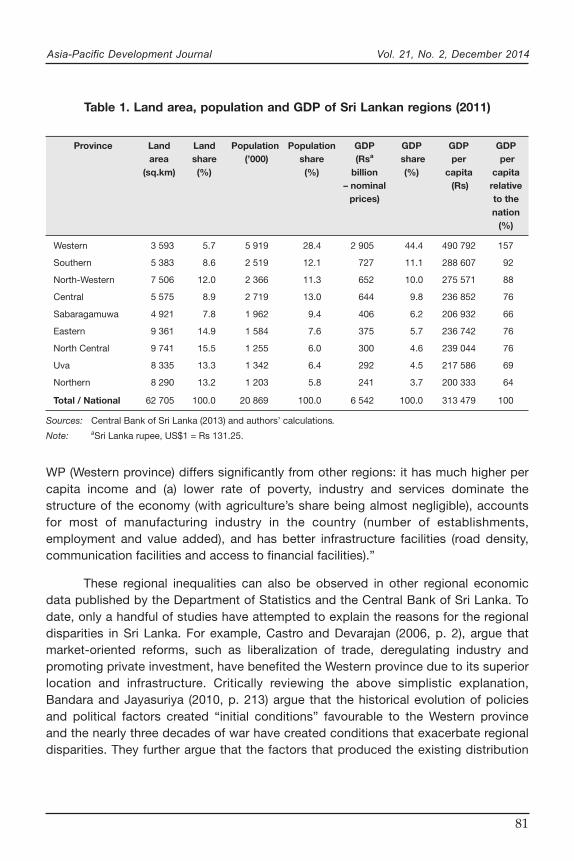
The distribution of the land area, population and economic activity across theprovinces is given in table 1.
GDP per capita, shown in last two columns of table 1 (in absolute terms and asa share of that of the country), demonstrates the economic dominance of the Westernprovince (with a per capita GDP of 157 per cent of the national average) and therelative weakness of Northern, Uva, North Central and Eastern provinces (which havea GDP per capita of 64, 69, 76 and 76 per cent, respectively). This is consistent withthe finding of Bandara and Jayasuriya (2010, p. 12) who argue that “...it is clear that
Figure 1. Sri Lankan provinces and their contribution to national GDP 2011
Source: Central Bank of Sri Lanka (2013) and authors’ calculations.
Asia-Pacific Development Journal Vol. 21, No. 2, December 2014
81
WP (Western province) differs significantly from other regions: it has much higher percapita income and (a) lower rate of poverty, industry and services dominate thestructure of the economy (with agriculture’s share being almost negligible), accountsfor most of manufacturing industry in the country (number of establishments,employment and value added), and has better infrastructure facilities (road density,communication facilities and access to financial facilities).”
These regional inequalities can also be observed in other regional economicdata published by the Department of Statistics and the Central Bank of Sri Lanka. Todate, only a handful of studies have attempted to explain the reasons for the regionaldisparities in Sri Lanka. For example, Castro and Devarajan (2006, p. 2), argue thatmarket-oriented reforms, such as liberalization of trade, deregulating industry andpromoting private investment, have benefited the Western province due to its superiorlocation and infrastructure. Critically reviewing the above simplistic explanation,Bandara and Jayasuriya (2010, p. 213) argue that the historical evolution of policiesand political factors created “initial conditions” favourable to the Western provinceand the nearly three decades of war have created conditions that exacerbate regionaldisparities. They further argue that the factors that produced the existing distribution
Table 1. Land area, population and GDP of Sri Lankan regions (2011)
Province Land Land Population Population GDP GDP GDP GDParea share (’000) share (Rsa share per per
(sq.km) (%) (%) billion (%) capita capita– nominal (Rs) relative
prices) to thenation
(%)
Western 3 593 5.7 5 919 28.4 2 905 44.4 490 792 157
Southern 5 383 8.6 2 519 12.1 727 11.1 288 607 92
North-Western 7 506 12.0 2 366 11.3 652 10.0 275 571 88
Central 5 575 8.9 2 719 13.0 644 9.8 236 852 76
Sabaragamuwa 4 921 7.8 1 962 9.4 406 6.2 206 932 66
Eastern 9 361 14.9 1 584 7.6 375 5.7 236 742 76
North Central 9 741 15.5 1 255 6.0 300 4.6 239 044 76
Uva 8 335 13.3 1 342 6.4 292 4.5 217 586 69
Northern 8 290 13.2 1 203 5.8 241 3.7 200 333 64
Total / National 62 705 100.0 20 869 100.0 6 542 100.0 313 479 100
Sources: Central Bank of Sri Lanka (2013) and authors’ calculations.
Note: aSri Lanka rupee, US$1 = Rs 131.25.
Asia-Pacific Development Journal Vol. 21, No. 2, December 2014
82
of economic activities and the associated infrastructure and institutions have been themain reasons behind the existing regional disparities.
However, as discussed below, the dominance of a national economy by theregion that includes the national capital is not unique to Sri Lanka and in fact is notparticularly unusual in the context of developing countries. What is more important isthe pattern of change in these regional disparities over time and policies adopted torectify this situation while maintaining a high level of overall national growth.
III. THEORETICAL AND EMPIRICAL EVIDENCE FROMPREVIOUS STUDIES
A number of theories on regional development are used to analyse regionaldevelopment disparities (UNDP, 2012; Smith, 2004; World Bank, 2009). A review ofthese theories is important for understanding possible causes for existing problems,as well as for ascertaining the most appropriate ways to overcome these problems.
Development theories of the 1950s and 1960s primarily focused on thematerial growth associated with the process of modernization (Barca, McCann andRodríguez-Pose, 2012). According to neoclassical regional growth theories, disparityacross regions should not persist as convergence occurs naturally over time throughthe operation of free market forces. The movement of factors of production acrossregions in search of greater economic returns and absorption of new technologiesfrom leading regions (by peripheral lagging regions) have been identified as the keyfactors leading to convergence (Ray, 2007). According to the associated catching-uphypothesis, the rate of growth of per capita income of lagging regions should beinversely related to their initial level of per capita income. In addition to governmentinterventions, which create price distortions, barriers to the free movement of factorsof production, such as family ties, links to the land, ethnic loyalties or religiousaffinities to particular localities, can adversely affect the process of convergence(Fotopoulos, 2012).
As per the endogenous growth theory, the smart use of resources owned bya region can provide the key to its economic success. However, many authors haveobserved that disparities may persistent due to differences in resource endowmentamong regions and lagging regions inadequate capacity to benefit fromagglomeration in the leading regions (Marques and Soukiazis, 1998; Matsuki andUsami, 2011; Barro and Sala-i-Martin, 1997). Myrdal (1957) argues that while theleading region will have a favourable effect on the other regions due to “spreadeffects” of trade and modernization of institutions (as discussed above), this willnormally be outweighed by adverse backwash effects with movements of factors of
Asia-Pacific Development Journal Vol. 21, No. 2, December 2014
83
production and other resources favouring the leading region at the expense of thelagging regions.
“New economic geography”, which has evolved as a sub-discipline of botheconomics and geography, attempts to understand more clearly the causes anddynamics of agglomeration, urbanization, interregional and international trade andfactor flows, regional economic growth and other location-specific socioeconomicissues (Sheppard and others, 2004; Krugman, 1990). Krugman (1998) and Fujita,Krugman and Venables (2001) highlight the role of history in shaping the economicgeography of a region and discuss factors contributing to changes in the spatialstructure of the economy. Recent regional growth and development theories alsoattempt to analyse the macroeconomic issue of the role of location in development.
As noted previously, few attempts have been made to analyse regional-leveldisparities within Sri Lanka (Bandara and Jayasuriya, 2010; Gunewardena, 2008;Kakwani, 1988; Karunaratne, 2007; Uduporuwa, 2007). Two of the studies undertakenare based on theories of convergence. Shankar and Shah (2003) have considered thelevel of regional disparity among Sri Lankan provinces during the period 1990-1995.They have also compared the level of regional disparity in Sri Lanka with bothdeveloped and developing countries that have either unitary or federal governingsystems. Karunaratne (2007) analyses the provincial disparity of per capita income inSri Lanka with a sigma convergence analysis that was carried out using the coefficientof variation measure for the period 1998-2003.
The present paper is unique due to three factors. First, it is based on regionalGDP data for 16 consecutive years. Most other regional studies that focus on SriLanka are based on data for either a short period or a few selected reference years.As the analysis includes the pre and post Sri Lankan civil war eras, the use of datafrom a relatively long time span is also helpful in understanding the regionaldevelopment impact of this phenomenon. Second, the present paper uses fiveestablished indicators to analyse regional disparity, which is significantly more thanthe number used for other studies. Third, it also employs an extension of meandeviation analysis to explain the contribution of individual provinces to regionaldisparity measures and the variation of those contributions over time.
IV. METHODOLOGY
The analysis is mainly based on the well-established regional inequalityanalysis methods of sigma and beta convergence. However, due to the poorperformance of the standard beta convergence regressions given the limitations ofthe dataset, an alternative approach based on decomposition of mean deviations isemployed to assist in understanding the pattern of convergence over time.
Asia-Pacific Development Journal Vol. 21, No. 2, December 2014
84
Following authors, such as Barro and others (1991), provincial-level per capitaGDP, which is denoted as per capita GPDP (gross provincial domestic product) in therest of the paper, is used for this analysis. Data required for the study were obtainedfrom published and unpublished reports of the Central Bank of Sri Lanka (CentralBank of Sri Lanka, 2002-2013). As published provincial-level GDP data for Sri Lankaare available annually only from 1996, the quantitative analysis is restricted to a periodof 16 years starting from 1996.
Sigma convergence analysis is commonly used in cross sectional studies tounderstand the level of overall economic disparities within countries. Repeated sigmaconvergence analysis is useful in understanding the variation in such disparities overtime. Different authors have come up with alternative inequality measures foranalysing the level of sigma convergence (Williamson, 1965; Shankar and Shah,2003). Since these alternative indicators, with varying complexities, are best used forhighlighting different aspects of disparity and convergence, four widely appliedindicators are used in the analysis:
Maximum to minimum ratio (MMR)
The ratio of maximum and minimum per capita GPDP is the most simple anddirect measure or indicator that can be used. In interpreting this measure, the ratiogets closer to one with an equal distribution and further from one with increasingdisparity. Though this indicator is easily calculated, it is highly sensitive to thepresence of outliers. Furthermore, it does not permit analysis of regions with percapita GPDP values that fall in between the minimum and the maximum.
MMR =
Coefficient of variation (CV)
Following the work of Williamson (1965), the coefficient of variation is widelyused in convergence literature (Smith, 2004). CV is defined as the ratio between thereal value of mean per capita GPDP and its standard deviation across the regions. It isessentially a measure of the dispersion of per capita GPDP of each region from theiraverage. Since this is a standardized value, it can be used in comparisons over timeor across other countries. It is possible to calculate CV either as a simple or weightedmeasure in a few different ways. Below are the methods used to calculate weightedand unweighted CV.
GPDP richest province
GPDP poorest province
Asia-Pacific Development Journal Vol. 21, No. 2, December 2014
85
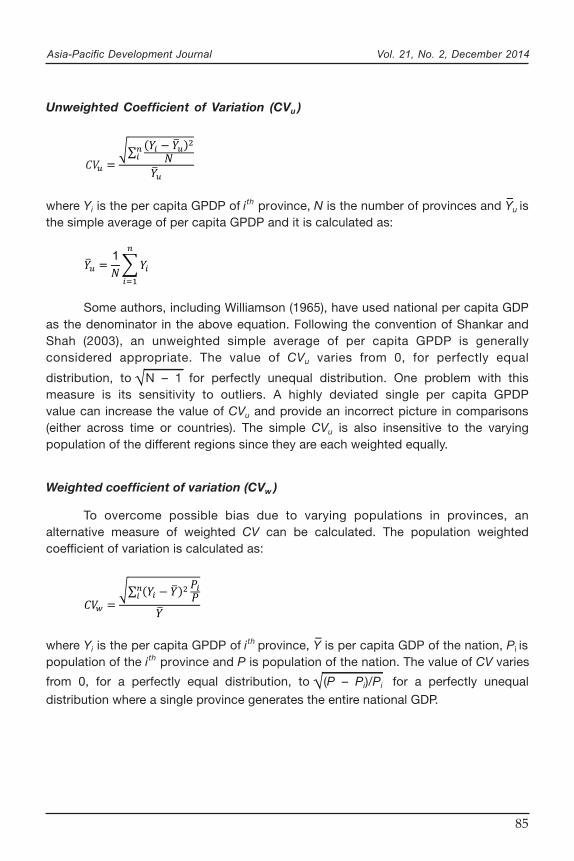
Unweighted Coefficient of Variation (CVu )
where Yi is the per capita GPDP of ith province, N is the number of provinces and Yu isthe simple average of per capita GPDP and it is calculated as:
Some authors, including Williamson (1965), have used national per capita GDPas the denominator in the above equation. Following the convention of Shankar andShah (2003), an unweighted simple average of per capita GPDP is generallyconsidered appropriate. The value of CVu varies from 0, for perfectly equal
distribution, to N – 1 for perfectly unequal distribution. One problem with thismeasure is its sensitivity to outliers. A highly deviated single per capita GPDPvalue can increase the value of CVu and provide an incorrect picture in comparisons(either across time or countries). The simple CVu is also insensitive to the varyingpopulation of the different regions since they are each weighted equally.
Weighted coefficient of variation (CVw )
To overcome possible bias due to varying populations in provinces, analternative measure of weighted CV can be calculated. The population weightedcoefficient of variation is calculated as:
where Yi is the per capita GPDP of ith province, Y is per capita GDP of the nation, Pi ispopulation of the ith province and P is population of the nation. The value of CV varies
from 0, for a perfectly equal distribution, to (P – Pi)/Pi for a perfectly unequal
distribution where a single province generates the entire national GDP.
–
–
√
1
√
Asia-Pacific Development Journal Vol. 21, No. 2, December 2014
86
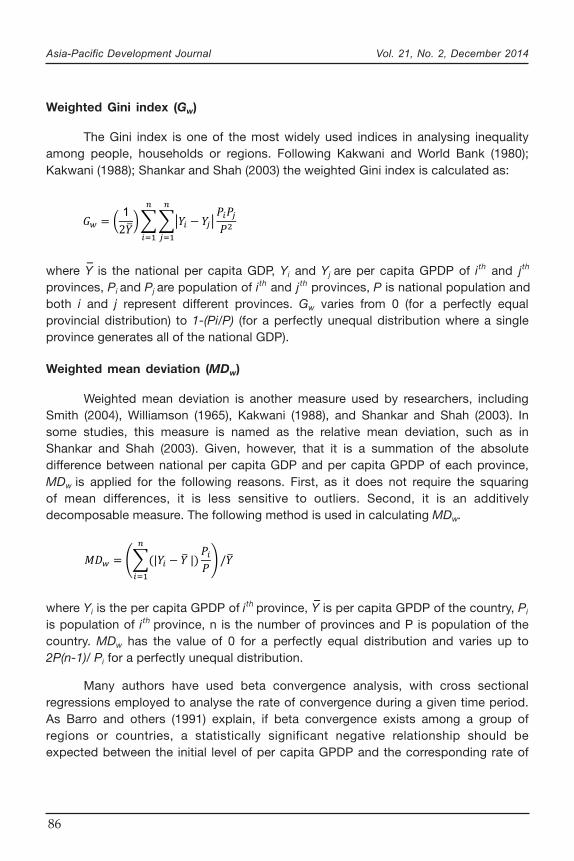
Weighted Gini index (Gw)
The Gini index is one of the most widely used indices in analysing inequalityamong people, households or regions. Following Kakwani and World Bank (1980);Kakwani (1988); Shankar and Shah (2003) the weighted Gini index is calculated as:
where Y is the national per capita GDP, Yi and Yj are per capita GPDP of ith and jth
provinces, Pi and Pj are population of ith and jth provinces, P is national population andboth i and j represent different provinces. Gw varies from 0 (for a perfectly equalprovincial distribution) to 1-(Pi/P) (for a perfectly unequal distribution where a singleprovince generates all of the national GDP).
Weighted mean deviation (MDw)
Weighted mean deviation is another measure used by researchers, includingSmith (2004), Williamson (1965), Kakwani (1988), and Shankar and Shah (2003). Insome studies, this measure is named as the relative mean deviation, such as inShankar and Shah (2003). Given, however, that it is a summation of the absolutedifference between national per capita GDP and per capita GPDP of each province,MDw is applied for the following reasons. First, as it does not require the squaringof mean differences, it is less sensitive to outliers. Second, it is an additivelydecomposable measure. The following method is used in calculating MDw.
where Yi is the per capita GPDP of ith province, Y is per capita GPDP of the country, Pi
is population of ith province, n is the number of provinces and P is population of thecountry. MDw has the value of 0 for a perfectly equal distribution and varies up to2P(n-1)/ Pi for a perfectly unequal distribution.
Many authors have used beta convergence analysis, with cross sectionalregressions employed to analyse the rate of convergence during a given time period.As Barro and others (1991) explain, if beta convergence exists among a group ofregions or countries, a statistically significant negative relationship should beexpected between the initial level of per capita GPDP and the corresponding rate of
–
–
1
Asia-Pacific Development Journal Vol. 21, No. 2, December 2014
87
growth over time. In this study, the use of (conditional and unconditional) betaconvergence analysis is explored. However, due in part to the limited number of yearsof data and the limited number of provinces, it is supplemented with alternativemeasures aimed at understanding the rate of convergence and the time required forfull convergence with the rate of current convergence.
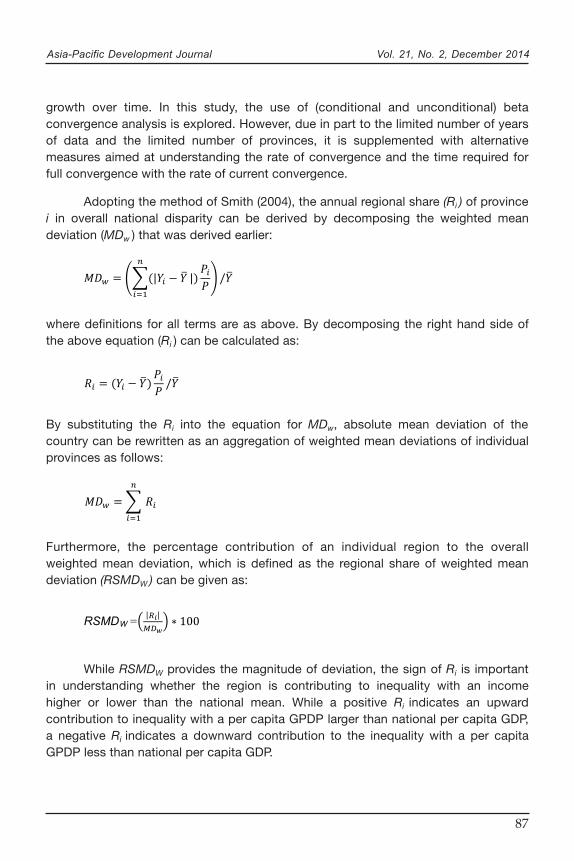
Adopting the method of Smith (2004), the annual regional share (Ri ) of provincei in overall national disparity can be derived by decomposing the weighted meandeviation (MDw ) that was derived earlier:
where definitions for all terms are as above. By decomposing the right hand side ofthe above equation (Ri ) can be calculated as:
By substituting the Ri into the equation for MDw, absolute mean deviation of thecountry can be rewritten as an aggregation of weighted mean deviations of individualprovinces as follows:
Furthermore, the percentage contribution of an individual region to the overallweighted mean deviation, which is defined as the regional share of weighted meandeviation (RSMDW ) can be given as:
While RSMDW provides the magnitude of deviation, the sign of Ri is importantin understanding whether the region is contributing to inequality with an incomehigher or lower than the national mean. While a positive Ri indicates an upwardcontribution to inequality with a per capita GPDP larger than national per capita GDP,a negative Ri indicates a downward contribution to the inequality with a per capitaGPDP less than national per capita GDP.
Asia-Pacific Development Journal Vol. 21, No. 2, December 2014
88
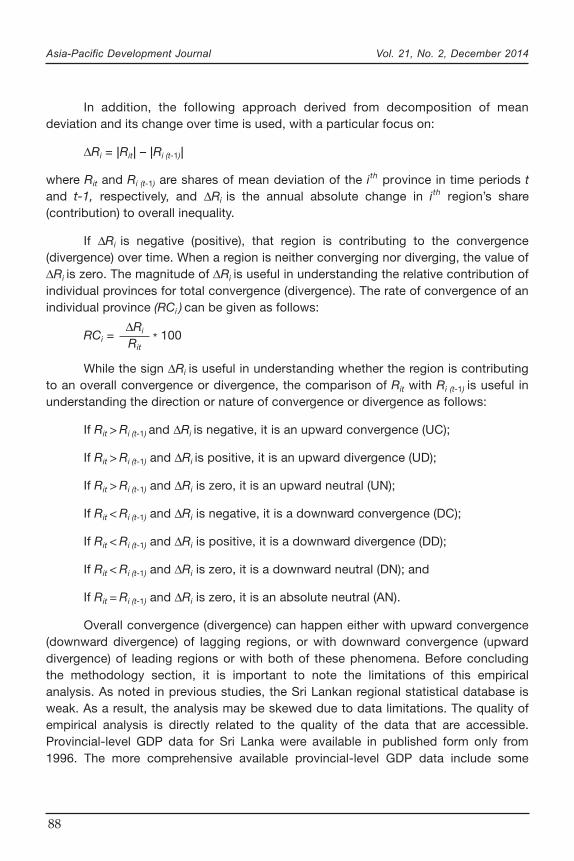
In addition, the following approach derived from decomposition of meandeviation and its change over time is used, with a particular focus on:
∆Ri = |Rit| – |Ri (t-1)|
where Rit and Ri (t-1) are shares of mean deviation of the ith province in time periods tand t-1, respectively, and ∆Ri is the annual absolute change in ith region’s share(contribution) to overall inequality.
If ∆Ri is negative (positive), that region is contributing to the convergence(divergence) over time. When a region is neither converging nor diverging, the value of∆Ri is zero. The magnitude of ∆Ri is useful in understanding the relative contribution ofindividual provinces for total convergence (divergence). The rate of convergence of anindividual province (RCi ) can be given as follows:
RCi = * 100
While the sign ∆Ri is useful in understanding whether the region is contributingto an overall convergence or divergence, the comparison of Rit with Ri (t-1) is useful inunderstanding the direction or nature of convergence or divergence as follows:
If Rit > Ri (t-1) and ∆Ri is negative, it is an upward convergence (UC);
If Rit > Ri (t-1) and ∆Ri is positive, it is an upward divergence (UD);
If Rit > Ri (t-1) and ∆Ri is zero, it is an upward neutral (UN);
If Rit < Ri (t-1) and ∆Ri is negative, it is a downward convergence (DC);
If Rit < Ri (t-1) and ∆Ri is positive, it is a downward divergence (DD);
If Rit < Ri (t-1) and ∆Ri is zero, it is a downward neutral (DN); and
If Rit = Ri (t-1) and ∆Ri is zero, it is an absolute neutral (AN).
Overall convergence (divergence) can happen either with upward convergence(downward divergence) of lagging regions, or with downward convergence (upwarddivergence) of leading regions or with both of these phenomena. Before concludingthe methodology section, it is important to note the limitations of this empiricalanalysis. As noted in previous studies, the Sri Lankan regional statistical database isweak. As a result, the analysis may be skewed due to data limitations. The quality ofempirical analysis is directly related to the quality of the data that are accessible.Provincial-level GDP data for Sri Lanka were available in published form only from1996. The more comprehensive available provincial-level GDP data include some
∆Ri
Rit
Asia-Pacific Development Journal Vol. 21, No. 2, December 2014
89
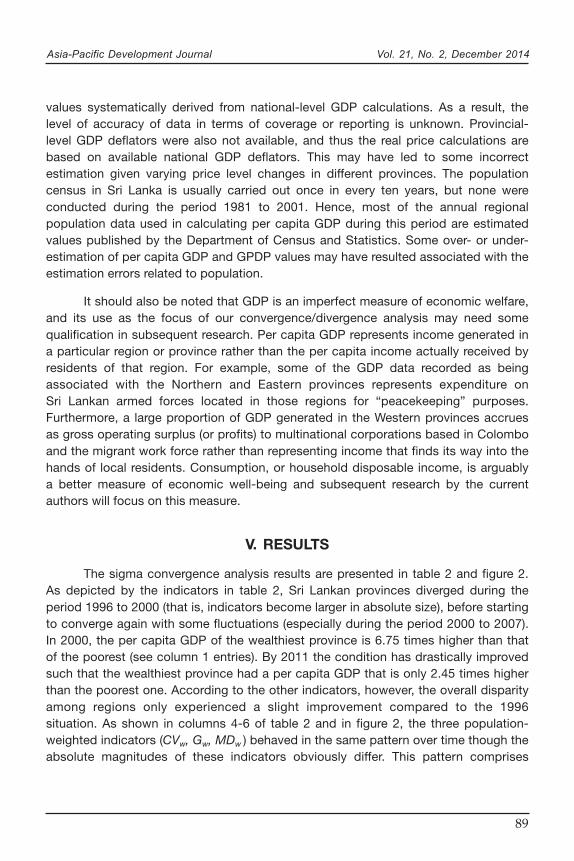
values systematically derived from national-level GDP calculations. As a result, thelevel of accuracy of data in terms of coverage or reporting is unknown. Provincial-level GDP deflators were also not available, and thus the real price calculations arebased on available national GDP deflators. This may have led to some incorrectestimation given varying price level changes in different provinces. The populationcensus in Sri Lanka is usually carried out once in every ten years, but none wereconducted during the period 1981 to 2001. Hence, most of the annual regionalpopulation data used in calculating per capita GDP during this period are estimatedvalues published by the Department of Census and Statistics. Some over- or under-estimation of per capita GDP and GPDP values may have resulted associated with theestimation errors related to population.
It should also be noted that GDP is an imperfect measure of economic welfare,and its use as the focus of our convergence/divergence analysis may need somequalification in subsequent research. Per capita GDP represents income generated ina particular region or province rather than the per capita income actually received byresidents of that region. For example, some of the GDP data recorded as beingassociated with the Northern and Eastern provinces represents expenditure onSri Lankan armed forces located in those regions for “peacekeeping” purposes.Furthermore, a large proportion of GDP generated in the Western provinces accruesas gross operating surplus (or profits) to multinational corporations based in Colomboand the migrant work force rather than representing income that finds its way into thehands of local residents. Consumption, or household disposable income, is arguablya better measure of economic well-being and subsequent research by the currentauthors will focus on this measure.
V. RESULTS
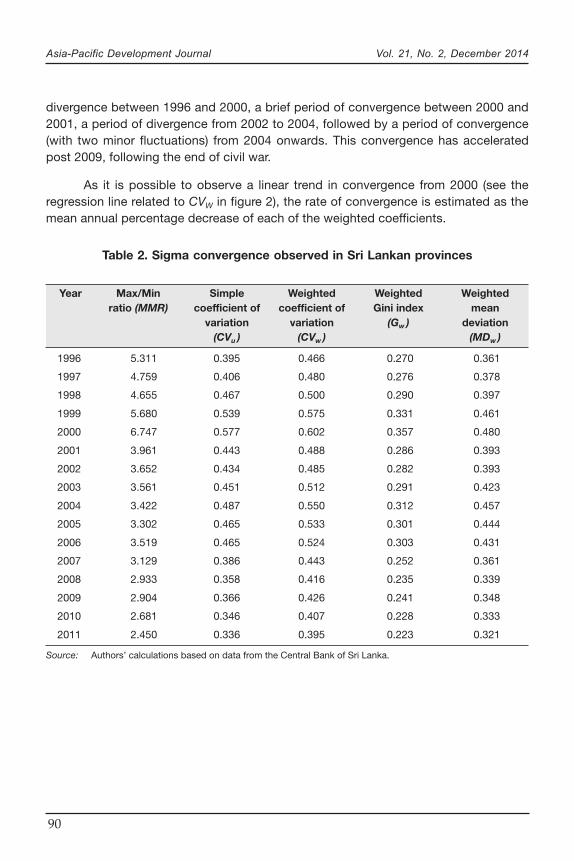
The sigma convergence analysis results are presented in table 2 and figure 2.As depicted by the indicators in table 2, Sri Lankan provinces diverged during theperiod 1996 to 2000 (that is, indicators become larger in absolute size), before startingto converge again with some fluctuations (especially during the period 2000 to 2007).In 2000, the per capita GDP of the wealthiest province is 6.75 times higher than thatof the poorest (see column 1 entries). By 2011 the condition has drastically improvedsuch that the wealthiest province had a per capita GDP that is only 2.45 times higherthan the poorest one. According to the other indicators, however, the overall disparityamong regions only experienced a slight improvement compared to the 1996situation. As shown in columns 4-6 of table 2 and in figure 2, the three population-weighted indicators (CVw, Gw, MDw ) behaved in the same pattern over time though theabsolute magnitudes of these indicators obviously differ. This pattern comprises
Asia-Pacific Development Journal Vol. 21, No. 2, December 2014
90
divergence between 1996 and 2000, a brief period of convergence between 2000 and2001, a period of divergence from 2002 to 2004, followed by a period of convergence(with two minor fluctuations) from 2004 onwards. This convergence has acceleratedpost 2009, following the end of civil war.
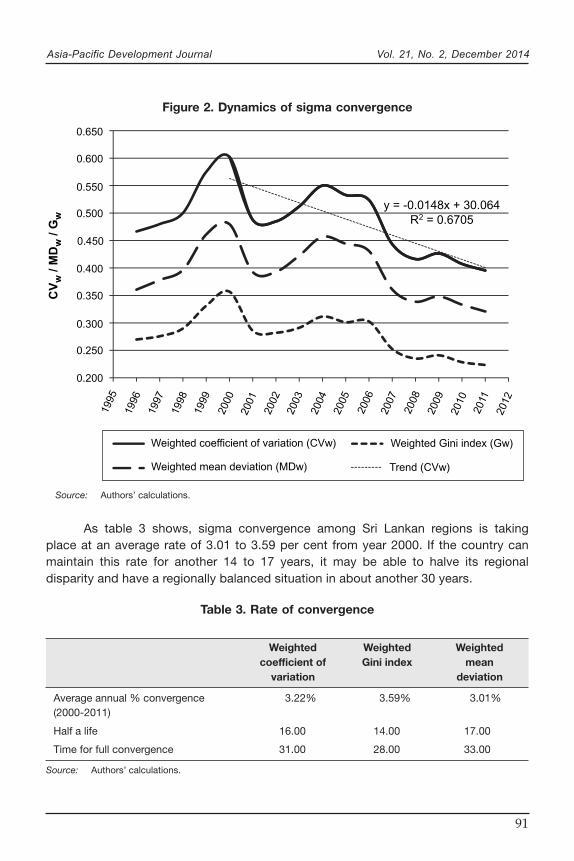
As it is possible to observe a linear trend in convergence from 2000 (see theregression line related to CVW in figure 2), the rate of convergence is estimated as themean annual percentage decrease of each of the weighted coefficients.
Table 2. Sigma convergence observed in Sri Lankan provinces
Year Max/Min Simple Weighted Weighted Weightedratio (MMR) coefficient of coefficient of Gini index mean
variation variation (Gw ) deviation(CVu ) (CVw ) (MDw )
1996 5.311 0.395 0.466 0.270 0.361
1997 4.759 0.406 0.480 0.276 0.378
1998 4.655 0.467 0.500 0.290 0.397
1999 5.680 0.539 0.575 0.331 0.461
2000 6.747 0.577 0.602 0.357 0.480
2001 3.961 0.443 0.488 0.286 0.393
2002 3.652 0.434 0.485 0.282 0.393
2003 3.561 0.451 0.512 0.291 0.423
2004 3.422 0.487 0.550 0.312 0.457
2005 3.302 0.465 0.533 0.301 0.444
2006 3.519 0.465 0.524 0.303 0.431
2007 3.129 0.386 0.443 0.252 0.361
2008 2.933 0.358 0.416 0.235 0.339
2009 2.904 0.366 0.426 0.241 0.348
2010 2.681 0.346 0.407 0.228 0.333
2011 2.450 0.336 0.395 0.223 0.321
Source: Authors’ calculations based on data from the Central Bank of Sri Lanka.
Asia-Pacific Development Journal Vol. 21, No. 2, December 2014
91
As table 3 shows, sigma convergence among Sri Lankan regions is takingplace at an average rate of 3.01 to 3.59 per cent from year 2000. If the country canmaintain this rate for another 14 to 17 years, it may be able to halve its regionaldisparity and have a regionally balanced situation in about another 30 years.
Source: Authors’ calculations.
Figure 2. Dynamics of sigma convergence
Table 3. Rate of convergence
Weighted Weighted Weightedcoefficient of Gini index mean
variation deviation
Average annual % convergence 3.22% 3.59% 3.01%(2000-2011)
Half a life 16.00 14.00 17.00
Time for full convergence 31.00 28.00 33.00
Source: Authors’ calculations.
0.650
0.600
0.550
0.500
0.450
0.400
0.350
0.300
0.250
0.200
CV
w /
MD
w /
Gw
1995
1996
1997
1998
1999
2000
2001
2002
2003
2004
2005
2006
2007
2008
2009
2010
2011
2012
Weighted coefficient of variation (CVw)
Weighted mean deviation (MDw)
Weighted Gini index (Gw)
Trend (CVw)
y = -0.0148x + 30.064
R2 = 0.6705
Asia-Pacific Development Journal Vol. 21, No. 2, December 2014
92
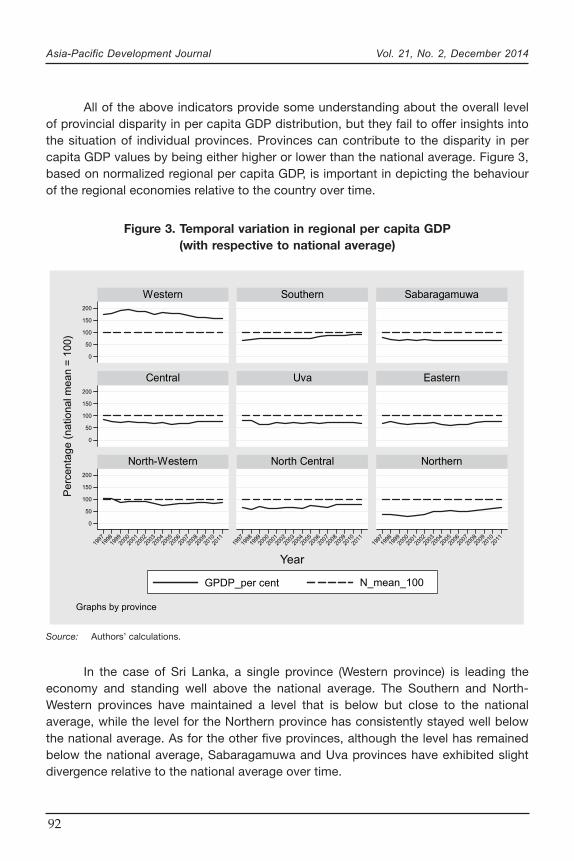
All of the above indicators provide some understanding about the overall levelof provincial disparity in per capita GDP distribution, but they fail to offer insights intothe situation of individual provinces. Provinces can contribute to the disparity in percapita GDP values by being either higher or lower than the national average. Figure 3,based on normalized regional per capita GDP, is important in depicting the behaviourof the regional economies relative to the country over time.
Figure 3. Temporal variation in regional per capita GDP(with respective to national average)
Source: Authors’ calculations.
0
50
100
150
200
0
50
100
150
200
0
50
100
150
200
1997
1998
1999
2000
2001
2002
2003
2004
2005
2006
2007
2008
2009
2010
2011
1997
1998
1999
2000
2001
2002
2003
2004
2005
2006
2007
2008
2009
2010
2011
1997
1998
1999
2000
2001
2002
2003
2004
2005
2006
2007
2008
2009
2010
2011
Western Southern Sabaragamuwa
Central Uva Eastern
North-Western North Central Northern
Perc
enta
ge (
national m
ean =
100)
GPDP_per cent N_mean_100
Graphs by province
Year
In the case of Sri Lanka, a single province (Western province) is leading theeconomy and standing well above the national average. The Southern and North-Western provinces have maintained a level that is below but close to the nationalaverage, while the level for the Northern province has consistently stayed well belowthe national average. As for the other five provinces, although the level has remainedbelow the national average, Sabaragamuwa and Uva provinces have exhibited slightdivergence relative to the national average over time.
Asia-Pacific Development Journal Vol. 21, No. 2, December 2014
93
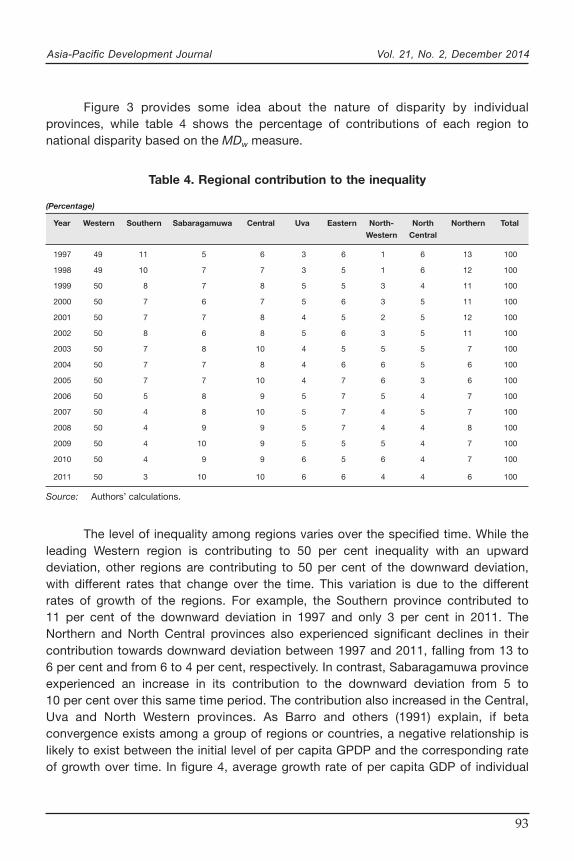
Figure 3 provides some idea about the nature of disparity by individualprovinces, while table 4 shows the percentage of contributions of each region tonational disparity based on the MDw measure.
Table 4. Regional contribution to the inequality
(Percentage)
Year Western Southern Sabaragamuwa Central Uva Eastern North- North Northern Total
Western Central
1997 49 11 5 6 3 6 1 6 13 100
1998 49 10 7 7 3 5 1 6 12 100
1999 50 8 7 8 5 5 3 4 11 100
2000 50 7 6 7 5 6 3 5 11 100
2001 50 7 7 8 4 5 2 5 12 100
2002 50 8 6 8 5 6 3 5 11 100
2003 50 7 8 10 4 5 5 5 7 100
2004 50 7 7 8 4 6 6 5 6 100
2005 50 7 7 10 4 7 6 3 6 100
2006 50 5 8 9 5 7 5 4 7 100
2007 50 4 8 10 5 7 4 5 7 100
2008 50 4 9 9 5 7 4 4 8 100
2009 50 4 10 9 5 5 5 4 7 100
2010 50 4 9 9 6 5 6 4 7 100
2011 50 3 10 10 6 6 4 4 6 100
Source: Authors’ calculations.
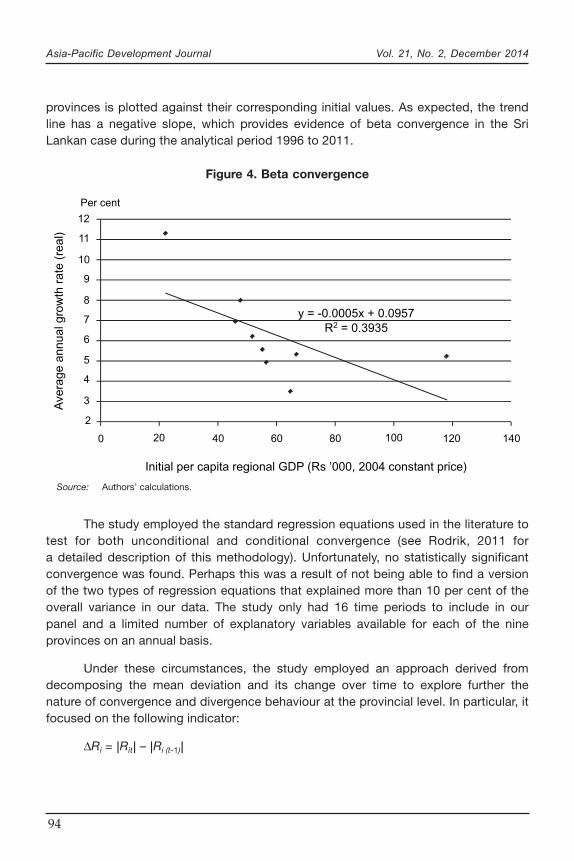
The level of inequality among regions varies over the specified time. While theleading Western region is contributing to 50 per cent inequality with an upwarddeviation, other regions are contributing to 50 per cent of the downward deviation,with different rates that change over the time. This variation is due to the differentrates of growth of the regions. For example, the Southern province contributed to11 per cent of the downward deviation in 1997 and only 3 per cent in 2011. TheNorthern and North Central provinces also experienced significant declines in theircontribution towards downward deviation between 1997 and 2011, falling from 13 to6 per cent and from 6 to 4 per cent, respectively. In contrast, Sabaragamuwa provinceexperienced an increase in its contribution to the downward deviation from 5 to10 per cent over this same time period. The contribution also increased in the Central,Uva and North Western provinces. As Barro and others (1991) explain, if betaconvergence exists among a group of regions or countries, a negative relationship islikely to exist between the initial level of per capita GPDP and the corresponding rateof growth over time. In figure 4, average growth rate of per capita GDP of individual
Asia-Pacific Development Journal Vol. 21, No. 2, December 2014
94
provinces is plotted against their corresponding initial values. As expected, the trendline has a negative slope, which provides evidence of beta convergence in the SriLankan case during the analytical period 1996 to 2011.
Figure 4. Beta convergence
Source: Authors’ calculations.
The study employed the standard regression equations used in the literature totest for both unconditional and conditional convergence (see Rodrik, 2011 fora detailed description of this methodology). Unfortunately, no statistically significantconvergence was found. Perhaps this was a result of not being able to find a versionof the two types of regression equations that explained more than 10 per cent of theoverall variance in our data. The study only had 16 time periods to include in ourpanel and a limited number of explanatory variables available for each of the nineprovinces on an annual basis.
Under these circumstances, the study employed an approach derived fromdecomposing the mean deviation and its change over time to explore further thenature of convergence and divergence behaviour at the provincial level. In particular, itfocused on the following indicator:
∆Ri = |Rit| – |Ri (t-1)|
y = -0.0005x + 0.0957
R2 = 0.3935
Per cent
12
11
10
9
8
7
6
5
4
3
2
Ave
rag
e a
nn
ua
l g
row
th r
ate
(re
al)
0 20 40 60 80 100 120 140
Initial per capita regional GDP (Rs ’000, 2004 constant price)
Asia-Pacific Development Journal Vol. 21, No. 2, December 2014
95
where Rit and Ri (t-1) are shares of mean deviation of the ith province in time periods tand t-1 respectively, and ∆Ri is the annual absolute change in ith region’s share(contribution) to overall inequality.
If ∆Ri is negative (positive), that region is contributing to the convergence(divergence) over time. When a region is neither converging nor diverging, the value of∆Ri is zero. The magnitude of ∆Ri is useful in understanding the relative contribution ofindividual provinces for total convergence (divergence). The rate of convergence of anindividual province (RCi ) can be given as follows:
The sign of ∆Ri is useful in understanding whether the region is contributing toan overall convergence or divergence while the comparison of Rit with Ri (t-1) is usefulin understanding the direction or nature of convergence or divergence. Table 4provides a summary of the diverging and converging pattern of different provincesover the time period. The nature of the divergence given in this table is derived asfollows:
If Rit > Ri (t-1) and ∆Ri is negative, it is an upward conver gence (UC);
If Rit > Ri (t-1) and ∆Ri is positive, it is an upward diver gence (UD);
If Rit > Ri (t-1) and ∆Ri is zero, it is an upward neutral (UN);
If Rit < Ri (t-1) and ∆Ri is negative, it is a downward conver gence (DC);
If Rit < Ri (t-1) and ∆Ri is positive, it is a downward diver gence (DD);
If Rit < Ri (t-1) and ∆Ri is zero, it is a downward neutral (DN);
If Rit = Ri (t-1) and ∆Ri is zero, it is an absolute neutral (AN).
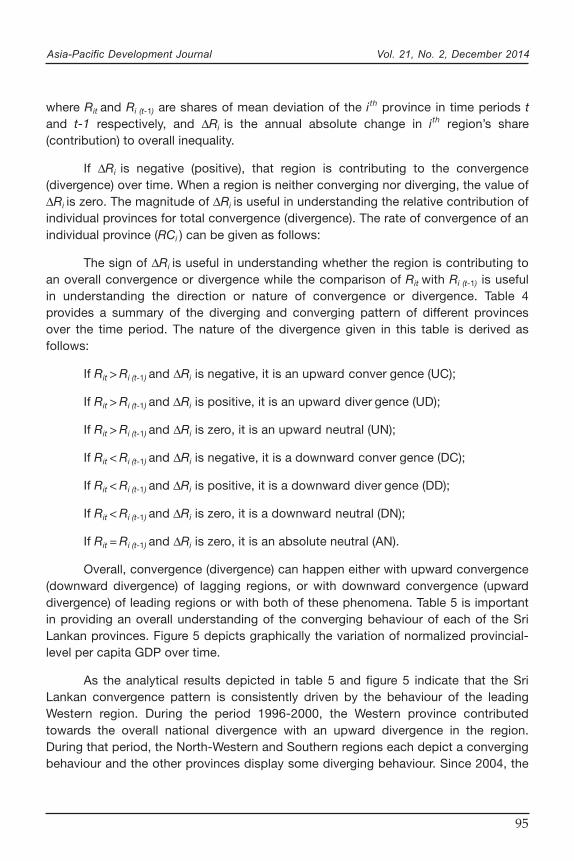
Overall, convergence (divergence) can happen either with upward convergence(downward divergence) of lagging regions, or with downward convergence (upwarddivergence) of leading regions or with both of these phenomena. Table 5 is importantin providing an overall understanding of the converging behaviour of each of the SriLankan provinces. Figure 5 depicts graphically the variation of normalized provincial-level per capita GDP over time.
As the analytical results depicted in table 5 and figure 5 indicate that the SriLankan convergence pattern is consistently driven by the behaviour of the leadingWestern region. During the period 1996-2000, the Western province contributedtowards the overall national divergence with an upward divergence in the region.During that period, the North-Western and Southern regions each depict a convergingbehaviour and the other provinces display some diverging behaviour. Since 2004, the
Asia-Pacific Development Journal Vol. 21, No. 2, December 2014
96
Tab
le 5
. R
egio
nal c
ont
rib
utio
n to
the
co
nver
gen
ce
(Per
cen
tag
e)
Per
iod
Wes
tern
So
uthe
rnS
abar
agam
uwa
Cen
tral
Uva
Eas
tern
No
rth-
No
rth
Cen
tral
No
rthe
rnN
atio
nal
Wes
tern
Rat
eTy
pe
Rat
eTy
pe
Rat
eTy
pe
Rat
eTy
pe
Rat
eTy
pe
Rat
eTy
pe
Rat
eTy
pe
Rat
eTy
pe
Rat
eTy
pe
Rat
eTy
pe
1997
-199
8-5
UD
11U
C-4
5D
D-3
4D
D-4
DD
22U
C22
UC
-18
DD
3U
C-5
D
1998
-199
9-1
8U
D8
UC
-7D
D-2
6D
D-6
9D
D-2
8D
D0
UC
23U
C-8
DD
-16
D
1999
-200
0-4
UD
-3D
D9
UC
6U
C-8
DD
-23
DD
5U
C-1
4D
D-7
DD
-4D
2000
-200
15
DC
9U
C-1
1D
D-4
DD
28U
C15
UC
23U
C-7
DD
4U
C5
C
2001
-200
20
DC
-4D
D14
UC
0D
D-2
5D
D-4
DD
-32
DD
12U
C6
UC
0C
2002
-200
36
DC
16U
C-2
3D
D-1
8D
D13
UC
17U
C-5
1D
D6
UC
42U
C6
C
2003
-200
4-9
UD
-12
DD
8U
C10
UC
-9D
D-4
1D
D-4
4D
D-1
4D
D1
UC
-9D
2004
-200
52
DC
2U
C0
UC
-20
DD
13U
C-8
DD
15U
C30
UC
3U
C2
C
2005
-200
63
DC
33U
C-8
DD
8U
C-1
6D
D4
UC
9U
C-2
0D
D-9
DD
3C
2006
-200
78
DC
25U
C8
UC
1U
C10
UC
3U
C22
UC
-5D
D4
UC
8C
2007
-200
815
DC
6U
C3
UC
21U
C1
UC
20U
C21
UC
38U
C9
UC
15C
2008
-200
9-2
UD
-5D
D-1
0D
D-1
DD
-3D
D28
UC
-24
DD
-16
DD
2U
C-2
D
2009
-201
04
DC
12U
C5
UC
5U
C-5
DD
3U
C-1
1D
D11
UC
8U
C4
C
2010
-201
14
DC
30U
C-2
DD
-4D
D-2
DD
-13
DD
29U
C-1
4D
D12
UC
4C
Sou
rce:
Aut
hors
’ cal
cula
tions
.
Not
es:
UD
– u
pw
ard
div
erge
nce,
DD
– d
ownw
ard
div
erge
nce,
DC
– d
ownw
ard
con
verg
ence
, UC
– u
pw
ard
con
verg
ence
.
C –
con
verg
ence
, D -
Div
erge
nce.
Rat
e re
fer
to t
he c
orre
spon
din
g p
rovi
ncia
l rat
e of
con
verg
ence
.
Asia-Pacific Development Journal Vol. 21, No. 2, December 2014
97
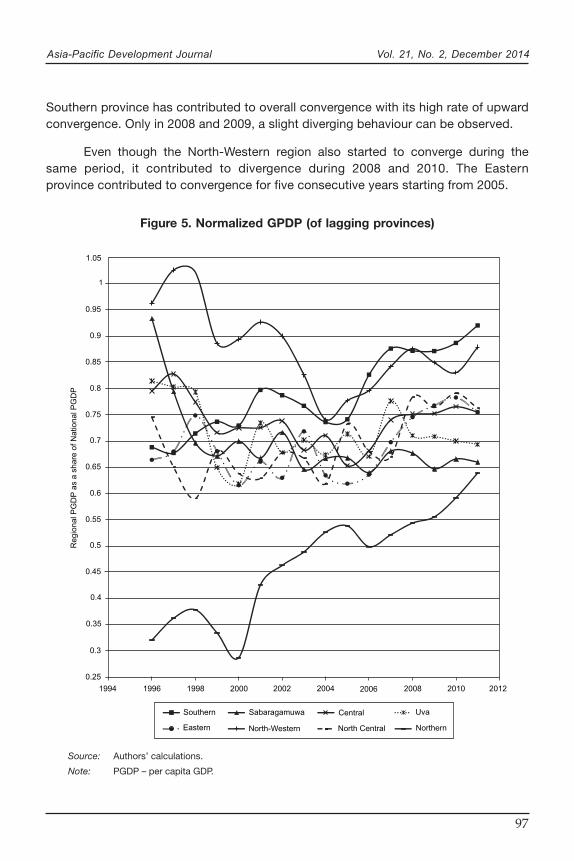
Southern province has contributed to overall convergence with its high rate of upwardconvergence. Only in 2008 and 2009, a slight diverging behaviour can be observed.
Even though the North-Western region also started to converge during thesame period, it contributed to divergence during 2008 and 2010. The Easternprovince contributed to convergence for five consecutive years starting from 2005.
Figure 5. Normalized GPDP (of lagging provinces)
Source: Authors’ calculations.
Note: PGDP – per capita GDP.
Regio
na
l P
GD
P a
s a
share
of N
ational P
GD
P
1.05
1
0.95
0.9
0.85
0.8
0.75
0.7
0.65
0.6
0.55
0.5
0.45
0.4
0.35
0.3
0.25
1994 1996 1998 2000 2002 2004 2006 2008 2010 2012
Southern Sabaragamuwa Central Uva
Eastern North-Western North Central Northern
Asia-Pacific Development Journal Vol. 21, No. 2, December 2014
98
The Northern province also contributed to convergence in each of the last fiveyears. The above results are consistent with the targeted infrastructure developmentprogrammes initiated by the Government under Mahinda Chintana. The two laggingregions of Uva and Sabaragamuwa mostly contributed to divergence during the entireanalytical period.
V. CONCLUDING REMARKS AND POLICY IMPLICATIONS
Based on the analysis and insights from previous studies, we can derive thefollowing set of conclusions. Economic conditions in Sri Lankan provinces are notequally distributed geographically and a considerable level of inequality haspersevered over time. The disparity between provinces is visible both in thecontribution that they are making to the national GDP and also in terms of valueaddition per head (in the province) or per capita GPDP. Variation in per capita GPDP isnot as high as that of the provincial GDP due to comparatively high population densityin the leading region.
All three weighted indicators (CVw, Gw, MDw ) calculated to understand sigmaconvergence (in terms of per capita GPDP) show similar patterns of temporalvariation. Though the magnitudes of indicators are not comparable, any of them canbe used in analysing temporal variation of convergence behaviour. Sri Lankanprovinces diverged during the period 1996-2000. Since 2000, there has beena declining trend in inequality, albeit with some temporary fluctuations for particularregions. Some fluctuations in the pattern of convergence are coincident with changesin political conditions and the prevailing armed conflict at the time. For example in2009, at the peak of civil war, there is divergence. A clear convergence is visible afterthe conclusion of the war. This is a positive sign. Moreover, the average rate ofconvergence observed with our three weighted indices (CVw, Gw, MDw ) during theperiod 2000-2012 varies from 3.3 to 4.1 per cent, and is almost twice as the averagerate of 2 per cent of beta convergence observed by Barro and Sala-i-Martin (1997)with data of the United States of America. Furthermore, the current pattern ofconvergence observed in per capita GPDP is associated with recent rural roaddevelopment projects and other post-war reconstruction projects initiated by thenational government. Variations in industrial structure, natural resources endowment,the quality of human resources, available technology, and level of infrastructureconditions are the other main reasons for varying economic conditions in theprovinces.
If the average rate of convergence prevailing in the period 2000-2012 continueslinearly, Sri Lanka may be able to halve its current level of inter-provincial disparity in16 years and eliminate the asymmetry in about 30 years. In saying this, however, it
Asia-Pacific Development Journal Vol. 21, No. 2, December 2014
99
must be recognized that there is no guarantee about continuity of convergence evenwith the maintenance of current policy settings. Policies suggested in literature onenhancing regional development fall into two main categories. Development policiesdesigned without explicit consideration to space are designated “place-neutral” orspatially blind policies. Those policies are targeted at maximizing national economicgrowth and efficiency while improving the lives of individuals wherever they live orwork, although not necessarily in an equitable manner. While some developmentpractitioners and reports, including the World Development Report 2009, supportthis approach, some authors, such as Barca (2009); Barca, McCann and Rodríguez-Pose (2012), highlight the importance of spatially targeted or “place-based”development policies. The place-based approach suggests the need to focus onarea-specific development policies that consider the social, cultural and institutionalcharacteristics, as well as the natural and capital resource endowment of thegeographical context (Pike, Pose and Tomaney, 2006; OECD, 2009a; 2009b).Development policy within this context seeks to target lagging regions for enhancedlevels of economic growth even if it is at the expense of some loss in overall nationalgrowth.
In this context, recent Sri Lankan policy interventions involving targeted publicinvestments in lagging regions are important towards achieving a higher level ofconvergence in regional per capita GDP over time. However, given the currentemphasis on public-private partnerships to spread the public investment dollarfurther, the provision of incentives for private sector firms to establish operations inlagging regions is also required. Even if the focus is concentrated on publicinvestments as a vehicle for achieving regionally balanced growth moving forward,there is an urgent need to develop a policy analysis tool, such as a bottom-upmultiregional computable general equilibrium model, to guide the selection of themost appropriate set of interventions (both place-based and place-neutral). Theauthors are currently involved in development of such a policy analysis tool for SriLanka.
Asia-Pacific Development Journal Vol. 21, No. 2, December 2014
100
REFERENCES
Abeyratne, S. (2004). Economic roots of political conflict: the case of Sri Lanka. World Economy,vol. 27, No. 8, pp. 1295-1314.
Arunathilake, N., S. Jayasuriya, and S. Kelegama (2001). The economic cost of the war in Sri Lanka.World Development, vol. 29, No. 9, pp. 1483-1500.
Bandara, J.S., and S. Jayasuriya (2010). Regional disparities: limitations in the application of neweconomic geography. In Economic and Social Development under a Market EconomyRegime in Sri Lanka, Saman Kelegama and Delini Gunawardena, eds. Colombo: VijithaYapa Publications.
Barca, F. (2009). An agenda for a reformed cohesion policy. In A Place-based Approach to MeetingEuropean Union Challenges and Expectations, Independent Report Prepared at theRequest of Commissioner for Regional Policy, Danuta Hübner. Brussels: EuropeanCommission.
Barca, F., P. McCann, and A. Rodríguez-Pose (2012). The case for regional development intervention:place-based versus place-neutral approaches. Journal of Regional Science, vol. 52, No. 1,pp. 134-152.
Barro, R.J., and F.X. Sala-i-Martin (1997). Technological diffusion, convergence, and growth. Journalof Economic Growth, vol. 2, No. 1, pp. 1-26.
Barro, R.J., and others (1991). Convergence across states and regions. Brookings Papers onEconomic Activity, No. 1, pp. 107-182.
Buhaug, H., and S. Gates (2002). The geography of civil war. Journal of Peace Research, vol. 39,No. 4, pp. 417-433.
Buhaug, H., and others (2011). It’s the local economy, stupid! Geographic wealth dispersion andconflict outbreak location. Journal of Conflict Resolution, vol. 55, No. 5, pp. 814-840.
Castro, R., and S. Devarajan (2006). Unleashing Sri Lanka’s growth potential. Mimeo, June.
Central Bank of Sri Lanka (2002-2013). Economic and Social Statistics of Sri Lanka. Colombo.
Collier, P., A. Hoeffler, and D. Rohner (2009). Beyond greed and grievance: feasibility and civil war.Oxford Economic Papers, vol. 61, No. 1, pp. 1-27.
De Silva, K.M. (1981). A History of Sri Lanka. Berkely: University of California Press.
Dhananjayan, S. (2005). Socio-economic inequality and ethno-political conflict: some observationsfrom Sri Lanka. Contemporary South Asia, vol. 14, No. 3, pp. 341-356.
Fotopoulos, G. (2012). Nonlinearities in regional economic growth and convergence: the role ofentrepreneurship in the European union regions. The Annals of Regional Science, vol. 48,No. 3, pp. 719-741.
Fujita, M., P.R. Krugman, and A.J. Venables (2001). The Spatial Economy: Cities, Regions, andInternational Trade. Cambridge, Massachusetts: MIT press.
Grobar, L.M., and S. Gnanaselvam (1993). The economic effects of the Sri Lankan civil war. EconomicDevelopment and Cultural Change, vol. 41, No. 2, pp. 395-405.
Gunewardena, D. (2008). Inequality in Sri Lanka: key trends and policy response. Paper presented atInequality and Social Justice in Asia: Policy Dialogues and Inequality Conference.Colombo, December.
Asia-Pacific Development Journal Vol. 21, No. 2, December 2014
101
Hasbullah, S., and B.M. Morrison (2004). Sri Lankan Society in an Era of Globalization: Struggling toCreate a New Social Order. New Delhi: Sage Publications.
Kakwani, N. (1988). Income inequality, welfare and poverty in a developing economy with applicationsto Sri Lanka. Social Choice and Welfare, vol. 5, Nos. 2-3, pp. 199-222.
Kakwani, N., and World Bank (1980). Income Inequality and Poverty: Methods of Estimation andPolicy Applications. New York: Oxford University Press.
Karnik, N. (2002). Book review: Violence & Subjectivity. Journal of Medical Humanities, vol. 23, No. 3,pp. 267-269.
Karunaratne, H.D. (2007). Managing regional income inequality in Sri Lanka: lessons from Japaneseexperience. Journal of International Economic Studies, No. 21, pp. 85-102.
Krugman, P. (1990). Increasing returns and economic geography. Working Paper, No. 3275.Cambridge: National Bureau of Economic Research.
(1998). What’s new about the new economic geography? Oxford Review of EconomicPolicy, vol. 14, No. 2, pp. 7-17.
Leitan, G.T. (1990). Political Integration Through Decentralization and Devolution of Power: The SriLankan Experience. Colombo: Department of History and Political Science, University ofColombo.
Marasinghe, M.L. (2007). The Evolution of Constitutional Governance in Sri Lanka. Colombo: VijithaYapa Publicaitons.
Marques, A., and E. Soukiazis (1998). Per capita income convergence across countries and acrossregions in the European Union. Some new evidence. Paper presented at the 2nd
International Meeting of European Economy organized by CEDIN(ISEG). Lisbon, December.
Matsuki, T., and R. Usami (2011). China’s regional convergence in panels with multiple structuralbreaks. Applied Economics, vol. 43, No. 7, pp. 873-890.
Myrdal, G. (1957). Economic Theory and Underdeveloped Regions. London: University Paperbacks,Methuen.
Organisation for Economic Co-operation and Development (OECD) (2009a). How Regions Grow:Trends and Analysis. Paris.
(2009b). Regions Matter: Economic Recovery, Innovation and Sustainable Growth. Paris.
Pike, A., A.R. Pose, and J. Tomaney (2006). Local and Regional Gevelopment. London: Routledge.
Ray, D. (2007). Introduction to development theory. Journal of Economic Theory, vol. 137, No. 1,pp. 1-10.
Rodrik, D. (2011). The future of economic convergence. Working Papers, No. 17400. Cambridge:National Bureau of Economic Research.
Sen, A.K. (1997). From income inequality to economic inequality. Southern Economic Journal, vol. 64,No. 2, pp. 384-401.
Shankar, R., and A. Shah (2003). Bridging the economic divide within countries: a scorecard on theperformance of regional policies in reducing regional income disparities. WorldDevelopment, vol. 31, No. 8, pp. 1421-1441.
Sheppard, E., and others (2004). Introduction: reading economic geography. In Reading EconomicGeography, Gary Bridge and Sophie Watson, eds. Oxford: Blackwell Publishing.
Asia-Pacific Development Journal Vol. 21, No. 2, December 2014
102
Smith, C. (2004). For richer or poorer: recent trends in Australia’s regional income dynamics.Australasian Journal of Regional Studies, vol. 10, No. 2, pp. 195-223.
Sri Lanka (1987). Thirteenth Amendment of the Constitution. Colombo.
Sri Lanka, National Planning Division (2010). Sri Lanka, The Emerging Wonder of Asia: MahindaChintana – Vision for the Future: The Development Policy Framework. Colombo: Ministry ofFinance and Planning.
Sri Lanka, Presidential Commision of Youth (1990). Report of the Presidential Commision of Youth.Colombo.
Uduporuwa, R.J.M. (2007). Regional dimensions of development of Sri Lanka. SabaragamuwaUniversity Journal, vol. 7, No. 1, pp. 22-36.
United Nations Development Programme (UNDP) (2012). Sri Lanka Human Development Report2012: Bridging Regional Disparities for Human Development. Colombo.
Vu, X.-B., and others (2012). Vietnam’s responses to provincial economic disparities throughcentral-provincial government financial relations. Available from www.wbiconpro.com/table_of_contents_newyork_economicsbanking2012.htm.
Wijerathna, D., J.S. Bandara, and K. Karunagoda (2013). How useful is a regional SAM in evaluatingregional projects in Sri Lanka?: An illustration for post-war regional development policyanalysis. Australasian Journal of Regional Studies, vol. 19, No. 2, pp. 239-273.
Williamson, J.G. (1965). Regional inequality and the process of national development: a description ofthe patterns. Economic Development and Cultural Change, vol. 13, No. 4, pp. 1-84.
World Bank (2009). World Development Report 2009: Reshaping Economic Geography. Washington,D.C.
(2010). Sri Lanka – Reshaping Economic Geography : Connecting People to Prosperity.Colombo.
(2011). World Development Report 2011: Conflict, Security, and Development. Washington,D.C.
Wright, C. (2009). Sri Lanka looks beyond euphoria. Euromoney (November). Available fromwww.euromoney.com/Article/2331913/Sri-Lanka-looks-beyond-euphoria.html.
Yeung, H.W.-c., and G.C.S. Lin (2003). Theorizing economic geographies of Asia. EconomicGeography, vol. 79, No. 2, pp. 107-128.