an empirical investigation of border tax evasion in sri lanka
TRANSCRIPT
The views expressed in this document are those of the authors and do not
necessarily reflect the views and policies of the Asian Development Bank (ADB)
or its Board of Governors or the governments they represent.
An Empirical Investigation of Border Tax Evasion in Sri Lanka
Harini WeerasekeraResearch OfficerInstitute of Policy Studies of Sri Lanka
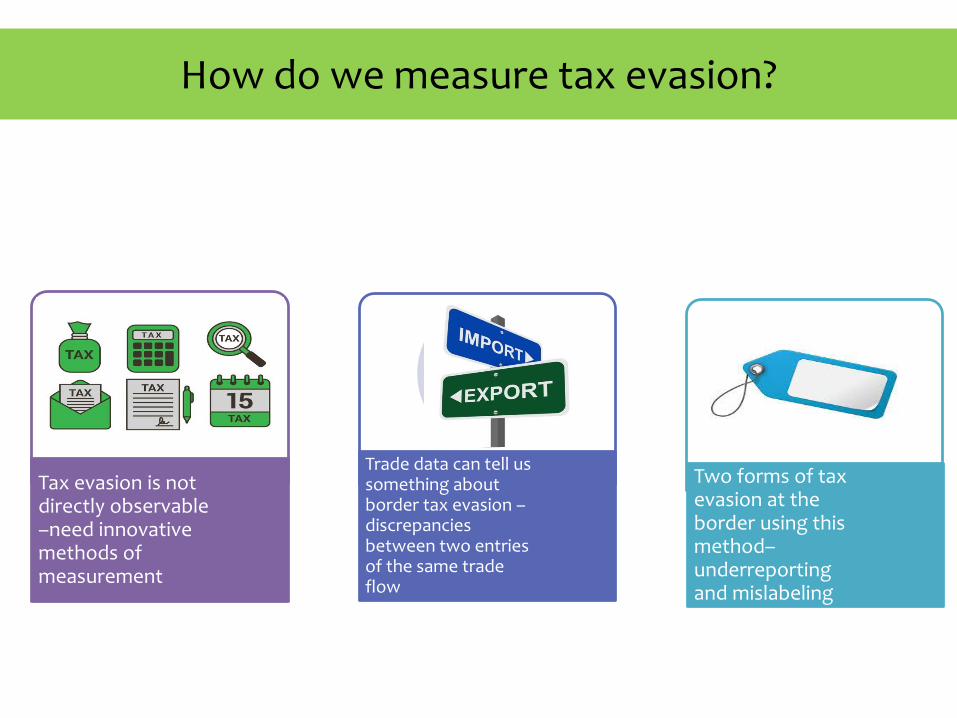
How do we measure tax evasion?
Tax evasion is not directly observable –need innovative methods of measurement
Trade data can tell us something about border tax evasion –discrepancies between two entries of the same trade flow
Two forms of tax evasion at the border using this method–underreporting and mislabeling
Chickens or Turkeys?

Motivation
▪ Tax evasion is understudied in SL – data limitations
▪ Low tax-take in SL relative to middle income country average –is tax evasion part of the reason?

Motivation
▪ Anecdotally we know that evasion/avoidance is widespread in SL –low tax morale

Research Questions
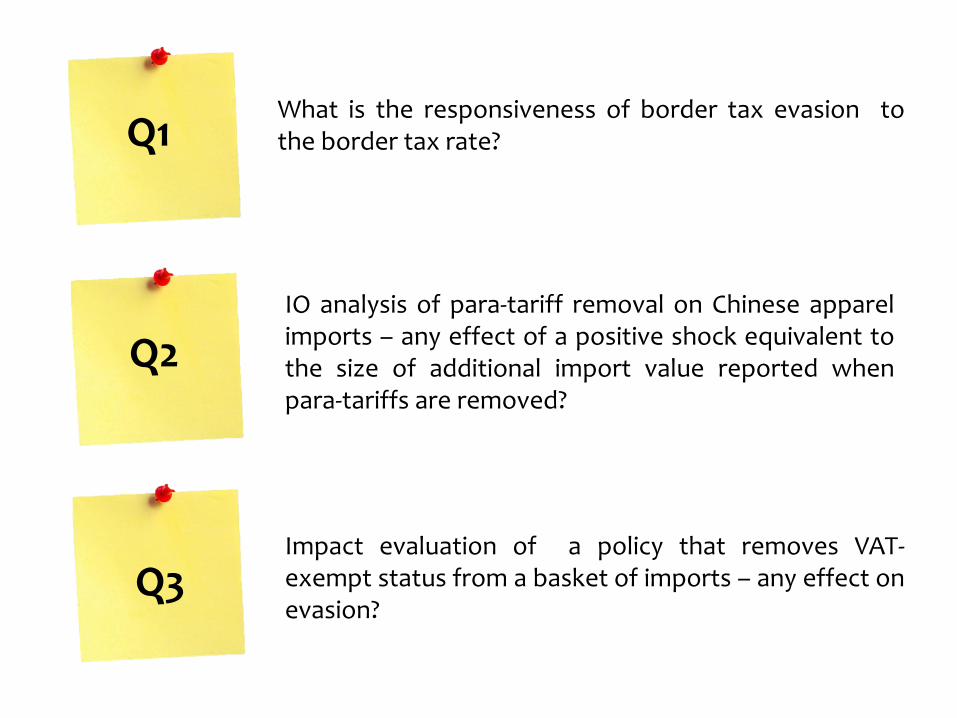
What is the responsiveness of border tax evasion tothe border tax rate?
Impact evaluation of a policy that removes VAT-exempt status from a basket of imports – any effect onevasion?
Q1
Q3
Q2
IO analysis of para-tariff removal on Chinese apparelimports – any effect of a positive shock equivalent tothe size of additional import value reported whenpara-tariffs are removed?
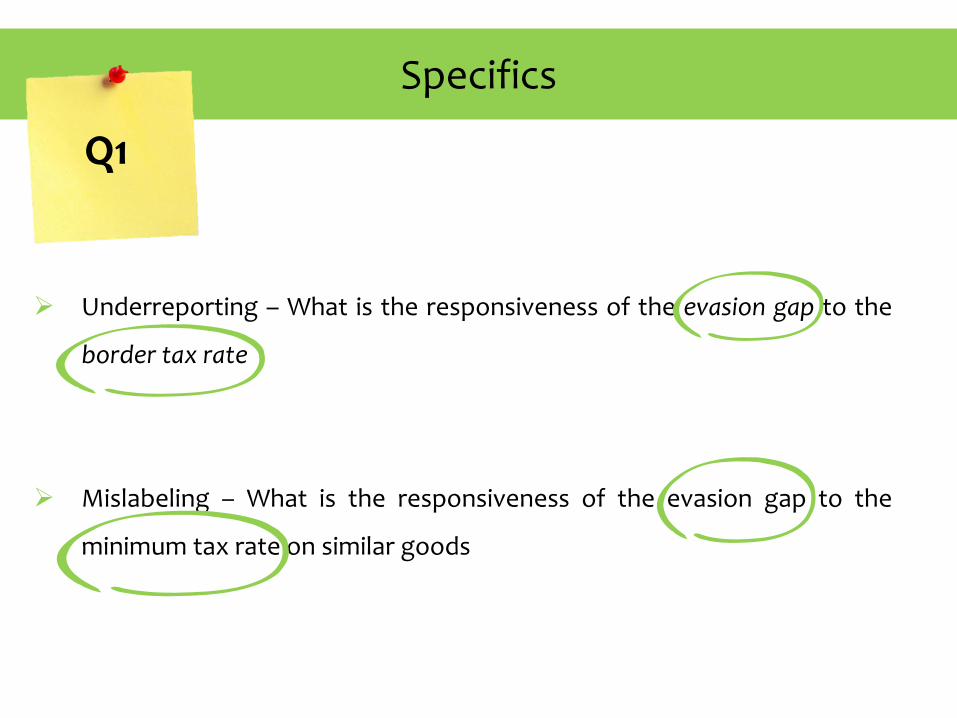
Specifics
➢ Underreporting – What is the responsiveness of the evasion gap to the
border tax rate
➢ Mislabeling – What is the responsiveness of the evasion gap to the
minimum tax rate on similar goods
Q1

Border tax rate =Tariff + VAT +PAL + NBT + SCL + CESS + SPL
Evasion gap = Difference
between exports to Sri Lanka (as
reported by Sri Lanka’s trade
partners) and imports by Sri
Lanka (as reported by Sri Lanka)Minimum tax rate on
similar goods =
Minimum tax rate
among a group of
goods belonging to the
same HS4 category
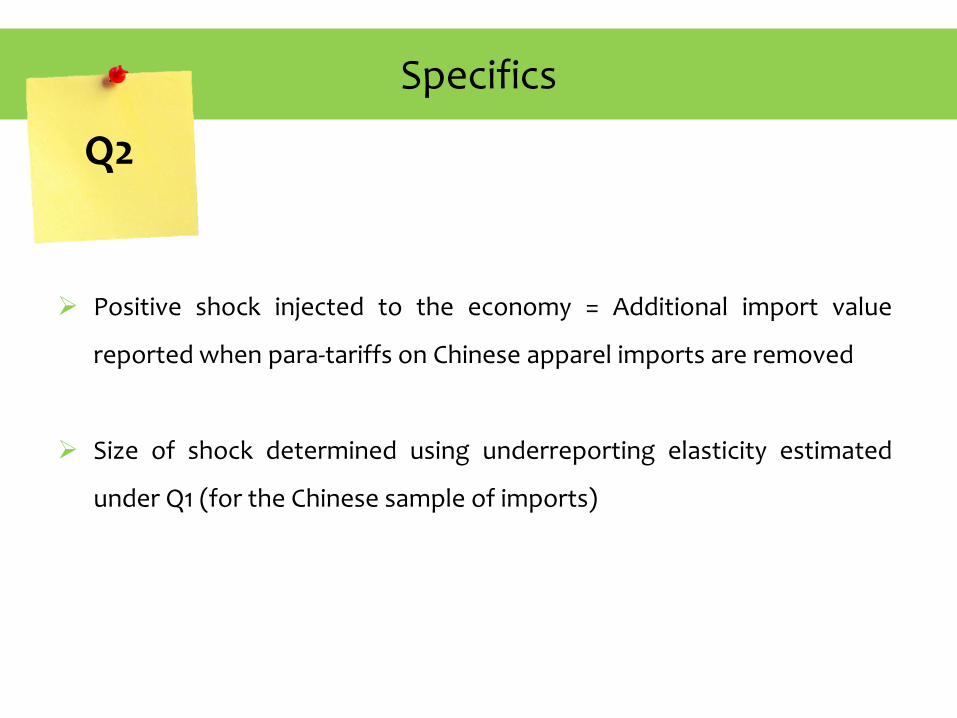
Specifics
➢ Positive shock injected to the economy = Additional import value
reported when para-tariffs on Chinese apparel imports are removed
➢ Size of shock determined using underreporting elasticity estimated
under Q1 (for the Chinese sample of imports)
Q2

A quick look at the literature

Allingham & Sandmo (1972)
Pioneering theoretical model on tax
evasion which states that there is an
ambiguous relationship between
tax rates and tax evasion;
depending on the nature of ‘risk
aversion’ of agent

Empirical Literature on Measuring Evasion
Addressing tax evasion empirically is challenging as it is unobservable. Someindirect strategies:
▪ Clotfelter (1983) & Feinstein (1991) - employ reporting discrepancies toestimate evasion gaps - reported taxable income versus true audited income
▪ Saez et al. (2012) - The elasticity of taxable income to changes in the marginaltax rate
▪ Best et al. (2015) - Bunching method provides estimates of many behavioralresponses by agents to changes in tax rates, including labor supply, work hourand evasion responses.

Empirical Literature on Measuring Evasion
Using the double declaration of trade flows:
▪ Fisman & Wei (2004) – Discrepancy between Hong Kong reported exports (toChina) and China reported imports of the same, to the tax rate - elasticity of 3%
▪ Employ F&Ws method but extend to products trade between SL and its top 7import partners

Data

Data Samples
Cross-sectional sample of all products imported from Sri Lanka’s top 7
import partners in 2014 -India, China, Singapore, Japan, UAE, France, and
Malaysia
Sri Lanka’s I-O Table for 2010 – latest available
Q1
Q2
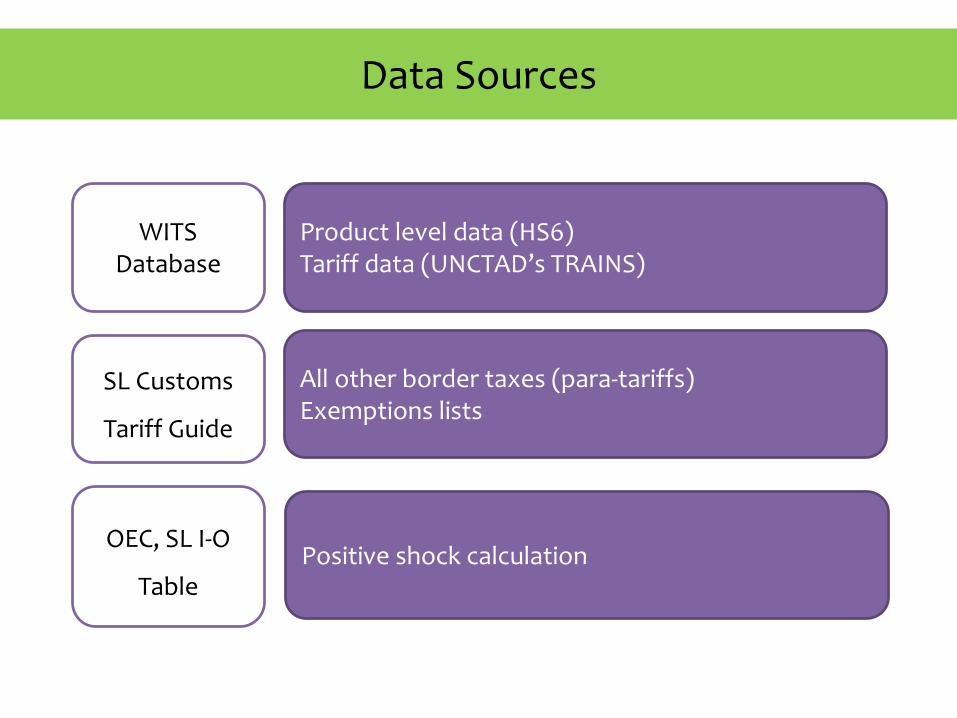
Data Sources
WITS Database
OEC, SL I-O
Table
Product level data (HS6)Tariff data (UNCTAD’s TRAINS)
All other border taxes (para-tariffs)Exemptions lists
SL Customs
Tariff Guide
Positive shock calculation

Preparing Datasets for Analysis
Cross-section Sample
Impact analysis using I-O table
Match export and import data
Select appropriate
tariff
Match ‘other taxes’
Determineimport
partner/sector with highest import value (China – NKF)
Determine % of Chinese NKF import
content in SL apparel sector
Determine additional value reported when para-tariffs removed, (using China underreporting elasticity) as % of apparel sector

Summary Statistics
Table 1: Summary statistics - cross-sectional sample
Variable Mean Std. Dev. Min. Max. N Log(export_value) 3.8 2.63 -6.91 12.31 9359 Log(import_value) 3.53 2.72 -6.91 12.28 9359
Evasion gap 0.27 2.28 -10.53 11.79 9359
Tax rate 0.24 0.20 0 4.47 9359
Min_tax (at 4-digit level) 0.19 0.14 0 2.69 9359
Q1

Methodology
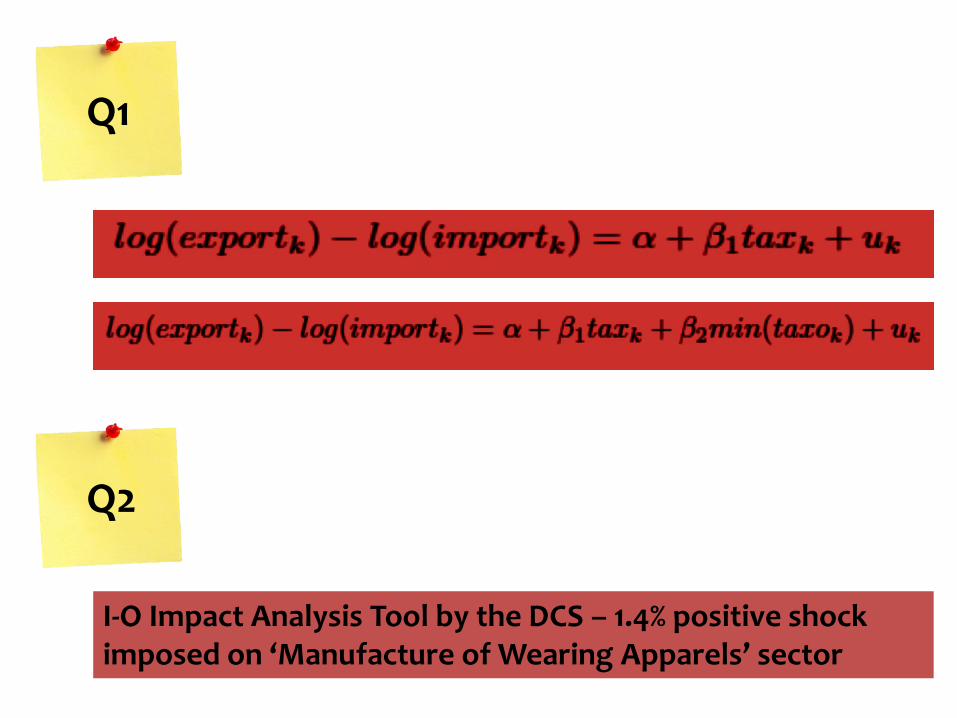
Q1
Q2
I-O Impact Analysis Tool by the DCS – 1.4% positive shock imposed on ‘Manufacture of Wearing Apparels’ sector
Identifying Assumptions
Reverse Causality
Product Specific Characteristics
OLS RESULTS
Testing for evasion by underreporting/mislabeling
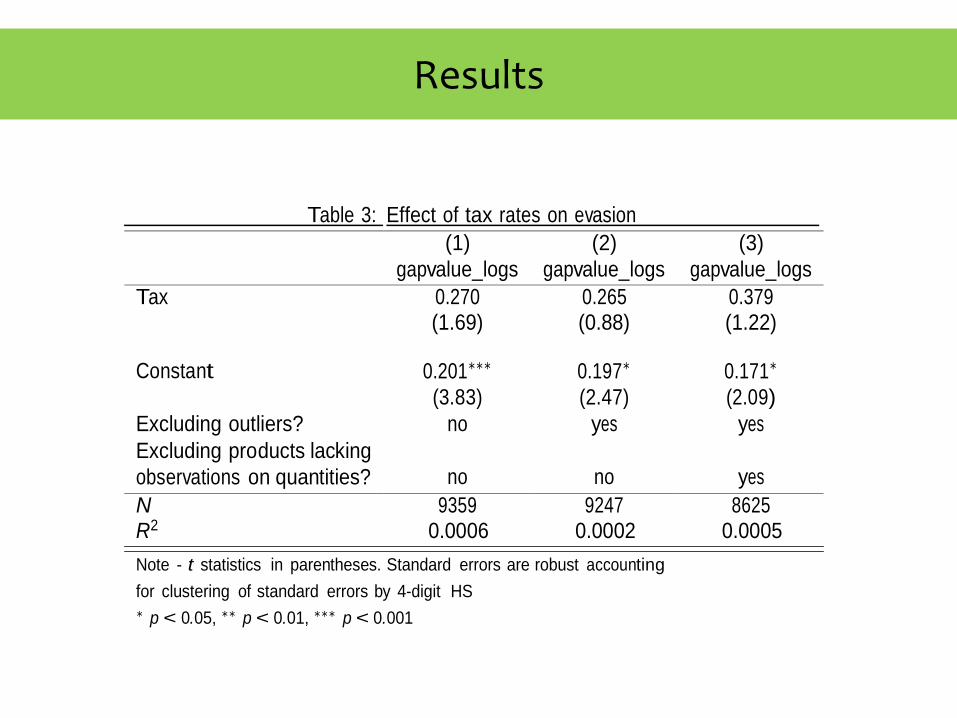
Results
Table 3: Effect of tax rates on evasion
(1)
gapvalue_logs
(2)
gapvalue_logs
(3)
gapvalue_logs
Tax 0.270 0.265 0.379
(1.69) (0.88) (1.22)
Constant
Excluding outliers?
0.201∗∗∗
(3.83)
no
0.197∗
(2.47)
yes
0.171∗
(2.09)
yes
Excluding products lacking
observations on quantities?
no
no
yes
N 9359 9247 8625 R2 0.0006 0.0002 0.0005
Note - t statistics in parentheses. Standard errors are robust accounting
for clustering of standard errors by 4-digit HS
∗ p < 0.05, ∗∗ p < 0.01, ∗∗∗ p < 0.001

Results
Table 4: Incorporating minimum tax among similar products
(1)
gapvalue_logs
(2)
gapvalue_logs
(3)
gapvalue_logs Tax 0.735∗∗
(2.63)
1.605∗∗∗
(3.69)
1.690∗∗∗
(3.66)
Minimum tax
on similar products
-0.904∗
-2.180∗∗∗
-2.111∗∗∗
(-2.21) (-3.88) (-3.66)
Constant
Excluding outliers?
0.258∗∗∗
(4.07)
no
0.285∗∗∗
(3.33)
yes
0.256∗∗
(2.93)
yes
Excluding products lacking
observations on quantities?
no
no
yes
N 9359 9247 8625 R2 0.002 0.004 0.004
Note - t statistics in parentheses. Standard errors are robust accounting
for clustering of standard errors by 4-digit HS
∗ p < 0.05, ∗∗ p < 0.01, ∗∗∗ p < 0.001

Results
Table 5: Evasion gap by by trade partner
(1) (2) (3) (4) (5) (6) (7) (8)
China France India Japan Malaysia Singapore UAE All
Tax 2.392∗∗∗ 0.281 0.276 -0.0851 -0.138 0.375 0.248 0.735∗∗
(4.25) (0.30) (1.10) (-0.10) (-0.63) (0.58) (0.44) (2.63)
Minimum tax
on similar products -2.377∗∗ -2.581 -0.860 0.0729 -0.0898 -0.814 -0.0584 -0.904∗
(-3.18) (-1.69) (-1.71) (0.07) (-0.19) (-0.93) (-0.06) (-2.21)
Constant 0.0992 -0.180 0.145 0.00661 0.225 0.958∗∗∗ 0.838∗∗∗ 0.258∗∗∗
(0.92) (-1.04) (1.44) (0.04) (1.95) (6.57) (3.98) (4.07)
Share of obs (%) 26.7 5.3 29.5 8.2 7.4 14.7 8.1 100
N 2501 500 2766 765 691 1375 761 9359
R2 0.013 0.014 0.002 0.00001 0.0006 0.0009 0.0005 0.002
Note - t statistics in parentheses. Standard errors are robust accounting for clustering of standard errors by 4-digit HS ∗ p < 0.05, ∗∗ p < 0.01, ∗∗∗ p < 0.001
I-O RESULTS
Para-tariff removal for the case of Chinese imports
Initial shock
(Rs. Mn)
Change in
Output
(Rs. Mn)
Extra
Employment
(No of job
opportunities)
to be
generated
Extra
Household
Income
from
compensat
ion of
employees
(Rs. Mn)
Extra
Value
Addition
generated
(Rs. Mn)
Extra
Demand
for
imports
(Rs. Mn)
Extra
Fixed
capital
assets to
be added
to capital
stock (Rs.
Mn)
Agricultural
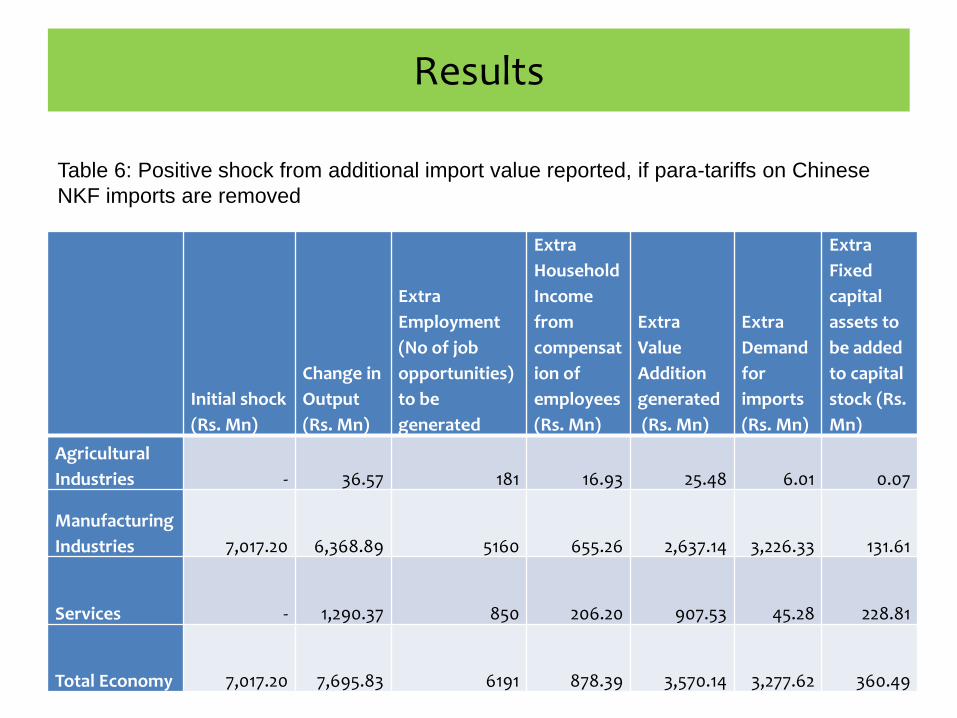
Industries - 36.57 181 16.93 25.48 6.01 0.07
Manufacturing
Industries 7,017.20 6,368.89 5160 655.26 2,637.14 3,226.33 131.61
Services - 1,290.37 850 206.20 907.53 45.28 228.81
Total Economy 7,017.20 7,695.83 6191 878.39 3,570.14 3,277.62 360.49
Results
Table 6: Positive shock from additional import value reported, if para-tariffs on Chinese
NKF imports are removed

Wrap Up

Limitations
Inability to capture variation across time – not controlled for product specific characteristics
Doesn’t adjust for illicit financial flows
Assumption of general elasticity applied to specific products, and data limitations in I-O analysis
Policy Implications
▪ Laffer curve analysis for optimality of the border tax rate in terms of revenue collection - Is there space for increasing the border tax rate, without a loss in revenue?
▪For any product who’s tax rate exceeds 59%, an increase in the tax rate would lead to a reduction in reported imports –only 2% of sample
▪OLS analysis shows presence of evasion – implies more tax revenue can be generated if more import value is reported.
▪I-O analysis implies that additional GDP and employment can be generated if true import value is reported

Recommendations
▪ Streamline border tax rates – phase out para-tariffs
▪Avoid ad-hoc tax policy changes
▪Strengthen customs procedures – National Single Window

Thank you