regional business cycle synchronization in europe
TRANSCRIPT

Bruges European Economic Research Papers
http://www.coleurop.be/eco/publications.htm
Regional Business Cycle Synchronization
in Europe?
Lourdes Acedo Montoyaa and Jakob de Haanb
BEER paper n ° 11
June 2007
Forthcoming in International Economics and Economic Policy
______________________________________ a College of Europe, Bruges campus , Belgium b Corresponding author; Faculty of Economics, University of Groningen, PO Box 800, 9700 AV Groningen, The Netherlands, Tel. 31-(0)50-3633706; Fax 31-(0)50-3633720; email: [email protected].; CESifo Munich, Germany
Abstract
We analyse regional business cycle synchronization in the Euro Area, using Gross Value
Added in 53 NUTS 1 regions for a period of thirty years (1975-2005), detrended by
Hodrick-Prescott and the Christiano-Fitzgerald filters. We conclude that, on average,
synchronization has increased for the period considered with exceptions during the
eighties and the beginning of the nineties. Still, the correlation of the business cycle in
some regions with the benchmark remained low or even decreased. Our findings also
support the hypothesis of the existence of a ‘national border’ effect.
Key words: business cycles, synchronization of business cycles, regions.
JEL codes: E32, F42.

Regional Business Cycle Synchronization
in Europe?
Lourdes Acedo Montoya and Jakob de Haan
BEER paper n° 11
1. Introduction
Many studies have examined to what extent business cycles of the countries in the Euro
Area have become similar. Other studies have examined the driving forces of the co-
movement of output (see De Haan et al. 2007 for a survey). These studies are highly
relevant from a policy perspective. If the synchronization of business cycles in the Euro
Area has increased and will further increase due to economic and monetary integration, the
well-known critique that a common monetary policy may not be equally good for all
countries or regions in the union (“one size does not fit all”) can be dismissed. This
‘optimistic view’ is popular among European policy makers. For instance, according to the
president of the European Central Bank (ECB):
“We can be reasonably confident in the increasing integration of European countries, and in the fact that economic developments are becoming more and more correlated in the area. This has been highlighted, in the academic field, by several empirical investigations: I would mention authors like Artis and Zhang (1999) who found evidence that business cycles are becoming more synchronous across Europe” (Trichet, 2001, pp. 5-6).
As economic policies in the euro area have become similar than before the start of the
currency union and are likely to become even more similar, business cycle synchronization
will increase (Inklaar et al., 2007).
1

Furthermore, economic and monetary integration will stimulate trade relations, which in
turn, will lead to business cycle synchronization (Frankel and Rose, 1998). However,
Krugman (1991, 1993) argues that integration will lead to regional concentration of
industrial activities. In Europe a similar concentration of industries may take place as in the
US mainly because of economies of scale and scope. Due to this concentration process,
sector-specific shocks may become region-specific shocks, thereby increasing the
likelihood of asymmetric shocks and diverging business cycles. So, the ‘pessimistic view’
holds that business cycles in the Euro Area, especially at the regional level, may become
more divergent in the future.
In this paper, we focus on the synchronisation of regional business cycles in the Euro Area,
using Gross Value Added covering a range of 53 NUTS 1 regions for a period of thirty
years (1975-2005). The regional cycle is computed by using the Hodrick-Prescott and the
Christiano-Fitzgerald filters. We measure the co-movement of the regional cycles and the
Euro Area cycle in terms of their correlation coefficients. We conclude that, on average,
synchronization has increased for the period considered with some exceptions during the
eighties and the beginning of the nineties. Still, the correlation of the business cycle in
some regions with the benchmark remained low or even decreased. Our findings also
support the hypothesis of the existence of a ‘national border’ effect.
The remainder of the paper is organized as follows. Section 2 reviews previous studies on
synchronization of business cycles of regions in Europe. Section 3 outlines our data and
method, while section 4 examines the evolution of Euro Zone regional cyclical affiliations
using various analytical tools. Section 5 considers the importance of the national border as
a driver of regional synchronization. Finally, section 6 offers our conclusions.
2. Previous literature
Most of the existing literature on business cycle synchronization in Europe focuses at the
national level. Those studies that examine regional cycles use different methodologies and
datasets. There is not a common approach to analyse regional business cycles, while
2

L. Acedo Montoya & J. de Haan, Regional Business Cycle Synchronization in Europe?
3
datasets and methodologies vary considerably, making it difficult to compare the results of
previous studies.
Those studies that we aware of, are summarized in Table 1. A quick glance at the table
suffices to conclude that none of the studies employs a comprehensive database including
all the Euro Area regions. It is therefore difficult to conclude whether there is a regional
business cycle in the Euro Area on the basis of the existing literature.
Table 1. Review of the literature on regional business cycles
Authors Data Used Measure of the cycle Synchronization Measure Conclusions
De Grauwe and Vanhaverbeke (1993)
GDP, employment Growth rates
Correlations between measures of dispersion in real exchange rate and output and employment growth rates
Exchange rate flexibility plays a role on regional adjustment to shocks. Asymmetric shocks occur frequently in regions.
Fatás (1997) Employment, 38 European regions from FR, DE, IT and UK
Growth rates
Two sub-samples (pre- and post-ERM), contemporaneous correlation with the EU12 and the country aggregate
Cross-country regional correlation has increased whereas within country regional correlation has decreased.
Clark and van Wincoop (1999)
GDP, employment Control variables: Krugman index, trade measure and monetary and fiscal policies 9 U.S census regions and 38 European regions from FR, DE, IT and UK
Percentage changes, HP
Pairwise correlations using GMM
European national borders are stronger than in the US: Explained by lower level of trade and higher specialization. Single currency is not likely to soon increase business cycle synchronization.
Barrios et al. (2002)
GDP, Control variables: Krugman index, UK regions and Euro Zone countries
HP Pairwise correlations using GMM
Cyclical divergence between UK and Euro Zone. Specialization does not explain dissimilarities between UK regions and Euro Zone.
Barrios and de Lucio (2003)
Employment, EU NUTS2 regions
HP Pairwise correlation using GMM
Positive impact of economic integration on regional business cycles’ correlation. Convergence nests may appear in Europe. Relative size and industrial structure are main determinants of business cycles affiliations.
Belke and Heine (2006)
Employment, 30 regions from BE, FR, DE, IE, NL, and ES Control variables: Index of conformity, Finger-Kreinin index, Specialization coefficient
HP Pairwise bivariate correlations
Employment growth is more synchronized when there is similar sector structure. Degree of synchronicity has declined in last years.

L. Acedo Montoya & J. de Haan, Regional Business Cycle Synchronization in Europe?
4
3. Data and method Research on the synchronization of business cycles of countries generally employs GDP
and/or Industrial Production. However, these variables are not available at the regional
level. Moreover, regional data on a quarterly or monthly basis are scarce. For our empirical
analysis we therefore use annual data on Gross Value Added (GVA) per capita at 1995
prices for NUTS1 regions of the Euro Area.1 Although this variable has not been used in
previous studies on business cycle synchronization, we believe that it is an adequate
variable for our purpose as GVA represents the added value of all sectors of the economy.
The source of the data is Cambridge Econometrics, which itself retrieves the information
from Eurostat and the national services of statistics. The series cover a period of thirty
years, from 1975 to 2005, except for Portugal for which the data start in 1978.
In choosing the sample, we faced a trade-off between geographical coverage and the length
of the series. We sacrificed longer series in order to cover a wider range of regions. Still, a
thirty years period should suffice to capture business cycles fluctuations. It also allows for
comparison with previous studies that consider a similar time span.2
Figure 1 shows the average regional GVA as a percentage of the Euro Zone GVA for the
period of reference. It is important to have a notion of the relative weight of every region in
the Euro Zone in order to correctly interpret our results. Obviously, if we find that a region
representing a huge percentage of the Euro Zone economy is not synchronized with the
rest, the implications for the effectiveness of monetary policy and the viability of the
currency union will be more important than if the region has a limited share in the Euro
Zone economy.
We follow previous studies and focus on “deviation cycles”, measuring the cycle as the
deviation from a trend. For the purposes of signal extraction, we use two techniques: the
Hodrick-Prescott (HP) filter and the Cristiano-Fitzgerald (CF) band-pass filter. The HP
filter, developed by Hodrick and Prescott (1997), has been widely used in the business
cycles literature.
1 See Annex A for a detailed list of the regions and the codes assigned to them. 2 Fatás (1997) and Barrios et al. (2002) have a sample running from 1966 to 1992, and 1966 to 1997, respectively.

L. Acedo Montoya & J. de Haan, Regional Business Cycle Synchronization in Europe?
5
Figure 1. Regional GVA (1975-2005)
GVA per inhabitant (1995 prices), in % of Euro Zone=100
(average 1975-2005) NUTS 1
60956012095
120
≤−−
≥

L. Acedo Montoya & J. de Haan, Regional Business Cycle Synchronization in Europe?
6
)
The filter is obtained by minimizing the following function:
( ) ( ) (( )2211
2
1
Tt
Tt
Tt
Tt
N
t
Ttt xxxxxx −−−
=
−−−+−∑ λ
tx represents the original data, the trend and Ttx λ a smoothing parameter. In other words,
it minimizes the variance of the cycle subject to a penalty for variation in the second
difference of the trend (Massmann et al., 2003). We set the smoothing parameter at 6.25 as
proposed by Ravn and Uhlig (2002).
In addition, we use the band pass filter suggested by Christiano and Fitzgerald (2003). We
filter GVA growth rates, since correlations of filtered series in levels or log levels reflect
long-term relationship rather than business cycle affiliation (Camacho et al., 2006). As it
turned out that – with one exception – both filtering methods yielded very similar results,
we only report the outcomes using the HP filter (all other results are available on request).
The literature on business cycles accounts for several techniques for measuring co-
movements of cycles. Even though it has been criticized, the Pearson correlation coefficient
is the most widely used technique.3 De Haan et al. (2007) show that the theoretical measure
based on the potential loss of welfare due to asymmetric GDP fluctuations in the absence of
risk sharing mechanisms as constructed by Kalemli-Ozcan et al. (2001) bears a strong
resemblance with the correlation coefficient.
4. Synchronization of regional business cycle with the reference cycle
For our analysis, we compute the cross-correlation matrix for the full sample and time
period considered (1978-2005) for the NUTS1 regions of the Euro Area. Given the size of
the matrix, we focus on the correlations of the regional cycles with the Euro Zone cycle.
The results are shown in Figure 2. It follows from the graph that the degree of
synchronization with the Euro Zone cycle varies substantially among regions. This
variation is much higher than the variation usually found in studies on business cycle
synchronization in countries in the Euro Area. These results are in line with the findings of
3 For a critique, we refer to Den Haan (2000).

L. Acedo Montoya & J. de Haan, Regional Business Cycle Synchronization in Europe?
7
De Grauwe and Vanhaverbeke (1993) and Fatás (1997), who also found larger divergences
at the regional level.
Figure 2. Correlation of regional cycles with the Euro Area cycle (1978-2005)
-0,10
0,10,20,30,40,50,60,70,80,9
BE
1B
E2
BE
3D
E1
DE
2D
E3
DE
5D
E6
DE
7D
E9
DE
AD
EB
DE
CD
EF
GR
1G
R2
GR
3G
R4
ES
1E
S2
ES
3E
S4
ES
5E
S6
ES
7FR
1FR
2FR
3FR
4FR
5FR
6FR
7FR
8IE
1IE
2ITCITDITEITFITAITBN
L1N
L2N
L3N
L4A
T1A
T2A
T3P
T1P
T2P
T3FI1FI2
Yet, the correlation coefficients as shown in Figure 2 do not tell us much about the effect of
European integration on the synchronization of business cycles. For that end, we need to
analyse the evolution of the correlation coefficient over time. Previous researchers
examined the impact of integration by splitting the sample in various periods, like before
and after the start of the European Exchange Rate Mechanism.4 In more recent research
rolling windows are used to observe the evolution of the correlation coefficient (see, for
instance, Massmann and Mitchel, 2004). We opt for using a rolling window of 8 years; the
results for the average correlation coefficient of all regions with the Euro Area reference
cycle are shown in Figure 3.
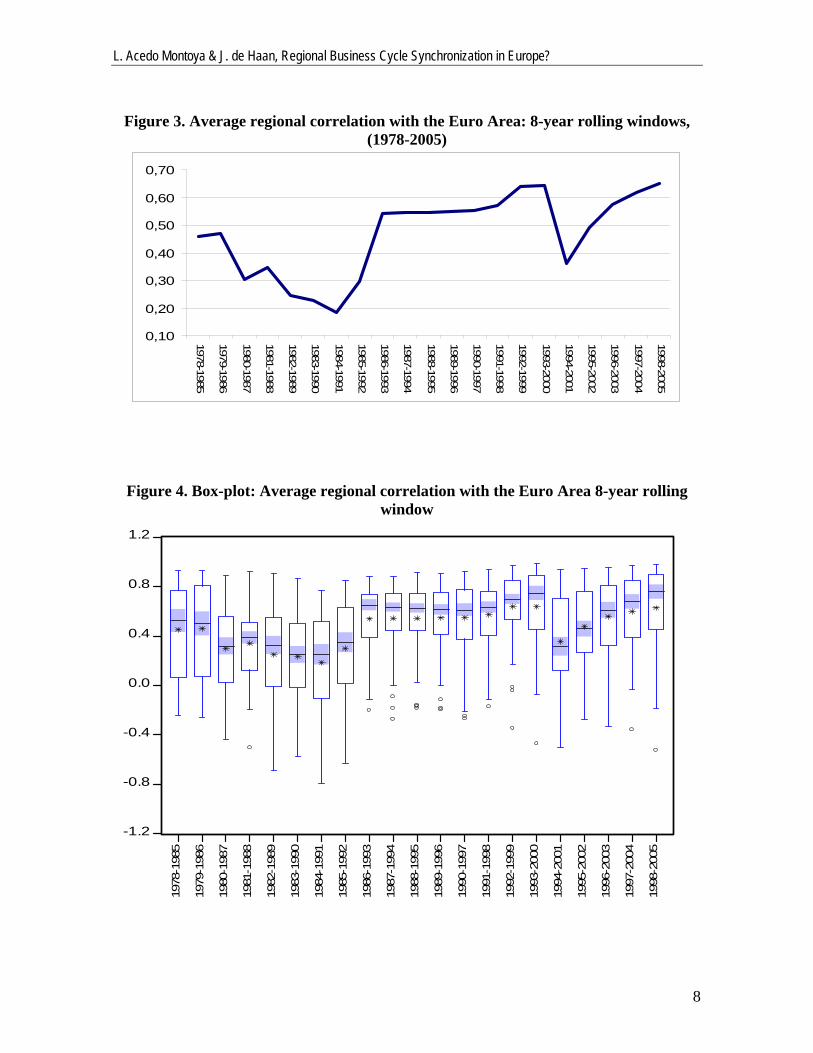
As Figure 3 shows, the average correlation decreased during the eighties, recuperated in the
nineties and remained high in successive years except for the very beginning of the
nineties. The average correlation coefficient of the regional and the Euro Area business
cycle may be influenced by outliers, i.e., observations that are far away from the rest of the
data
4 For instance, Artis and Zhang (1997, 1999) break their sample in two intervals corresponding with the period before and after the start of the ERM and conclude that business cycles have become more synchronized during the ERM phase. However, Inklaar and De Haan (2001) dispute this finding. See also Fatás (1997).
L. Acedo Montoya & J. de Haan, Regional Business Cycle Synchronization in Europe?
8
Figure 3. Average regional correlation with the Euro Area: 8-year rolling windows, (1978-2005)
0,10
0,20
0,30
0,40
0,50
0,60
0,70
1978-1985
1979-1986
1980-1987
1981-1988
1982-1989
1983-1990
1984-1991
1985-1992
1986-1993
1987-1994
1988-1995
1989-1996
1990-1997
1991-1998
1992-1999
1993-2000
1994-2001
1995-2002
1996-2003
1997-2004
1998-2005
Figure 4. Box-plot: Average regional correlation with the Euro Area 8-year rolling window
-1.2
-0.8
-0.4
0.0
0.4
0.8
1.2
1978
-198
5
1979
-198
6
1980
-198
7
1981
-198
8
1982
-198
9
1983
-199
0
1984
-199
1
1985
-199
2
1986
-199
3
1987
-199
4
1988
-199
5
1989
-199
6
1990
-199
7
1991
-199
8
1992
-199
9
1993
-200
0
1994
-200
1
1995
-200
2
1996
-200
3
1997
-200
4
1998
-200
5

L. Acedo Montoya & J. de Haan, Regional Business Cycle Synchronization in Europe?
9
To examine this issue is more detail, Figure 4 shows Box & Whisker diagrams that show
the spread of the values. The plot provides the medians, quartiles (upper and lower), and
ranges (minimum and maximum). The box is limited by the first and third quartile while
the whiskers represent the minimum and the maximum value, respectively. The blue area in
the box represents a confidence interval for the median, which is depicted by a black line.
Outliers are defined as the observations that lie outside the staple, i.e., those observations
with more than one and a half times the inter-quartile range.
As Figure 4 shows, most of the irregular observations appear in the period following the
Maastricht Treaty. The regions concerned are Sicilia, Manner-Suomi and Kentriki Ellada.
By the end of the period, the Spanish region of Noroeste behaves as an outlier.
Interestingly, all outliers have lower than average correlation with the Euro Zone cycle.
Even though Figure 3 suggests that there is no obvious way to split the sample in various
sub-periods, we take the Maastricht Treaty as a watershed as various studies on national
business cycle synchronization identify a “Maastricht effect”.5 Though the results must be
interpreted with some caution, it appears that the synchronization of the business cycle of
most regions with the Euro Area cycle has increased due to the Maastricht policy reforms.
Some regions show a remarkable increase, like Portugal Continente, Ile de France, Brussels
Capital, Westösterreich and Sudösterreich. However, there is also a group of regions
without any change due to the Maastricht Treaty. Their cycle remained either at a fairly
high level (e.g., Noreste and Madrid, Noreste and Noroeste (IT)) or at a low level (e.g.,
Madeira, Açores, and Nisia-Aigaiou-Kriti) of synchronization with the reference cycle.
Still, the general conclusion that we draw is that, on average, regional cycles in the Euro
Area are more in sync after 1992.
Massmann and Mitchell (2004) argue that full business cycle convergence implies that the
mean of the business cycle correlation coefficients should tend towards 1, while the
variance should approach to 0 over the period considered.6
Figure 5. Regional correlations with the Euro Zone: Before and after Maastricht
5 See, for instance, Altavilla (2004) and Darvas et al. (2007). 6 These conditions are similar to the “beta” and “sigma” convergence concepts used in the economic growth literature.
L. Acedo Montoya & J. de Haan, Regional Business Cycle Synchronization in Europe?
10
FI2
FI1
PT3
PT2
PT1AT3
AT2
AT1
NL4
NL3
NL2
NL1
ITB
ITA
ITF
ITE
ITDITCIE2
IE1
FR8FR7
FR6
FR5
FR4
FR3
FR2
FR1
ES7
ES6ES5
ES4
ES3
ES2
ES1
GR4
GR3
GR2
GR1
DEF DECDEB
DEADE9
DE7DE2DE1 DE6DE5
DE3BE3
BE2BE1
-0,4
-0,2
0
0,2
0,4
0,6
0,8
1
1,2
-0,2 0 0,2 0,4 0,6 0,8 1
Pre-Maastricht
Post
-Maa
stric
ht
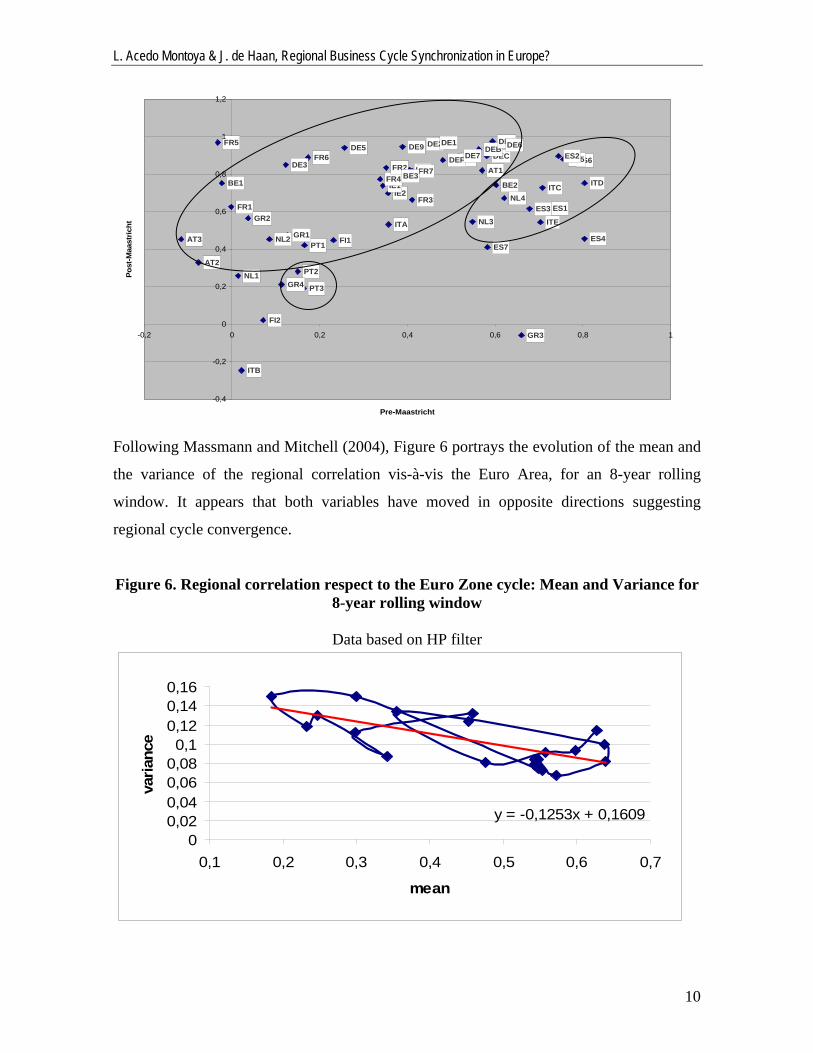
Following Massmann and Mitchell (2004), Figure 6 portrays the evolution of the mean and
the variance of the regional correlation vis-à-vis the Euro Area, for an 8-year rolling
window. It appears that both variables have moved in opposite directions suggesting
regional cycle convergence.
Figure 6. Regional correlation respect to the Euro Zone cycle: Mean and Variance for 8-year rolling window
Data based on HP filter
y = -0,1253x + 0,1609
00,020,040,060,080,1
0,120,140,16
0,1 0,2 0,3 0,4 0,5 0,6 0,7
mean
varia
nce

L. Acedo Montoya & J. de Haan, Regional Business Cycle Synchronization in Europe?
11
Data based on CF filter
y = -0,1917x + 0,2059
00,020,040,060,08
0,10,120,140,160,18
0,2 0,3 0,4 0,5 0,6 0,7
mean
vari
ance
It appears that there have been three periods with different convergence patterns. In the first
period, which ranges from 1978 till 1992, the average correlation coefficient with the Euro
Zone business cycle decreases, while the variance remains high. These results contradict
the findings of Fatás (1997). The most straightforward explanation for this different result
is that Fatás’ sample is limited to France, Germany, UK and Italy. During the first period,
not only regions in Italy exhibit a low correlation coefficient but also regions in other
countries, like the Netherlands, Austria and Finland, have a low correlation coefficient with
the reference cycle.
The second period comprises the years after the signing of the Maastricht Treaty until the
start of EMU. Corroborating the belief that further integration leads to higher
synchronization, this period is characterized by low variance and high correlation with the
Euro Zone. This finding supports our previous result concerning the “Maastricht effect”.
Finally, for the period after EMU we are unable to draw a firm conclusion because the
results differ according to the de-trending method used. Whilst the data constructed with
the HP filter do not yield a clear pattern for the mean and the variance, the data constructed
with the CF filter show an increase of the average, while the variance decreases.

L. Acedo Montoya & J. de Haan, Regional Business Cycle Synchronization in Europe?
12
5. Synchronization with the country or the Euro Area? Various studies find that the correlation of regional business cycles with the national cycle
remain high over time, despite European economic integration, i.e., there is a “border
effect”. For instance, Clark and Van Wincoop (1999) who compare the US and Europe,
find a stronger “border effect” in Europe than in the US.
Following De Grauwe and Vanhaverbeke (1993) and Fatás (1997), we study the correlation
of the regional cycle with the national cycle and with the Euro Area cycle over a thirty
years period. However, instead of splitting the sample in arbitrary periods, we opt for
building 8-year rolling windows. The results are shown in Figure 7. It appears that the
correlation of the regional cycles with the national cycles is always higher than the
correlation of the regional cycles with the Euro Area cycle. These findings contradict those
of Fatás (1997) who reports that the correlation of the regional cycles with the national
cycle decreased over time, whereas the correlation with the European cycle increased. This
discrepancy can be explained by the difference of the sample (Fatás’ sample only covers
Germany, Italy, France and the UK) and the time period considered (Fatás’ series stop in
1992).
Going deeper into the data, one notices different performances among countries. For
instance, regions in Germany have always exhibited a high degree of correlation both with
the country and with the Euro Zone cycles, whereas regions in Greece do not seem to
follow neither their national cycle nor the Euro Zone’s. Other regions, like those in
Portugal, Spain, and France, saw their correlation with the Euro Zone cycle increase, while
maintaining a high degree of synchronization with the country cycle. In contrast, the
business cycle correlation of regions in Ireland with the Euro Area cycle decreased, while it
remained incredibly high with the country cycle.
So far, we have analysed synchronization of regional cycles with the Euro Zone cycle. As
an alternative, we follow Artis (2003) and Camacho et al. (2006) and perform a cluster
analysis.

L. Acedo Montoya & J. de Haan, Regional Business Cycle Synchronization in Europe?
13
Figure 7. Regional correlation with national and Euro Zone business cycles. 8-year rolling window
0,1
0,2
0,3
0,4
0,5
0,6
0,7
0,8
1978-1985
1979-1986
1980-1987
1981-1988
1982-1989
1983-1990
1984-1991
1985-1992
1986-1993
1987-1994
1988-1995
1989-1996
1990-1997
1991-1998
1992-1999
1993-2000
1994-2001
1995-2002
1996-2003
1997-2004
1998-2005
Country Euro Zone
A pioneer study using this technique is Artis and Zhang (1998), who apply clustering to a
set of 18 OECD countries and study their affiliations with Germany on the base of six
criteria (correlation in business cycle, volatility in exchange rate, correlation in interest rate
cycle, trade, inflation and labour market flexibility). Their findings reveal the existence of a
“core” group, made up of France, Belgium, Austria and the Netherlands, and two
“peripheral” groups comprising the northern and southern countries of the EU15. Artis
(2003) reverses to some extent this earlier paper and concludes that there is not a European
cycle on the basis of cluster analysis. Camacho et al. (2006) adopt a slightly different
methodology. They apply sequentially two clustering procedures: first, they consider
hierarchical clustering algorithms and use this information to apply non-hierarchical or
partitioning clustering algorithms. Their findings reveal that there is no evidence of the
existence of a “European attractor” that brings the European cycles together.
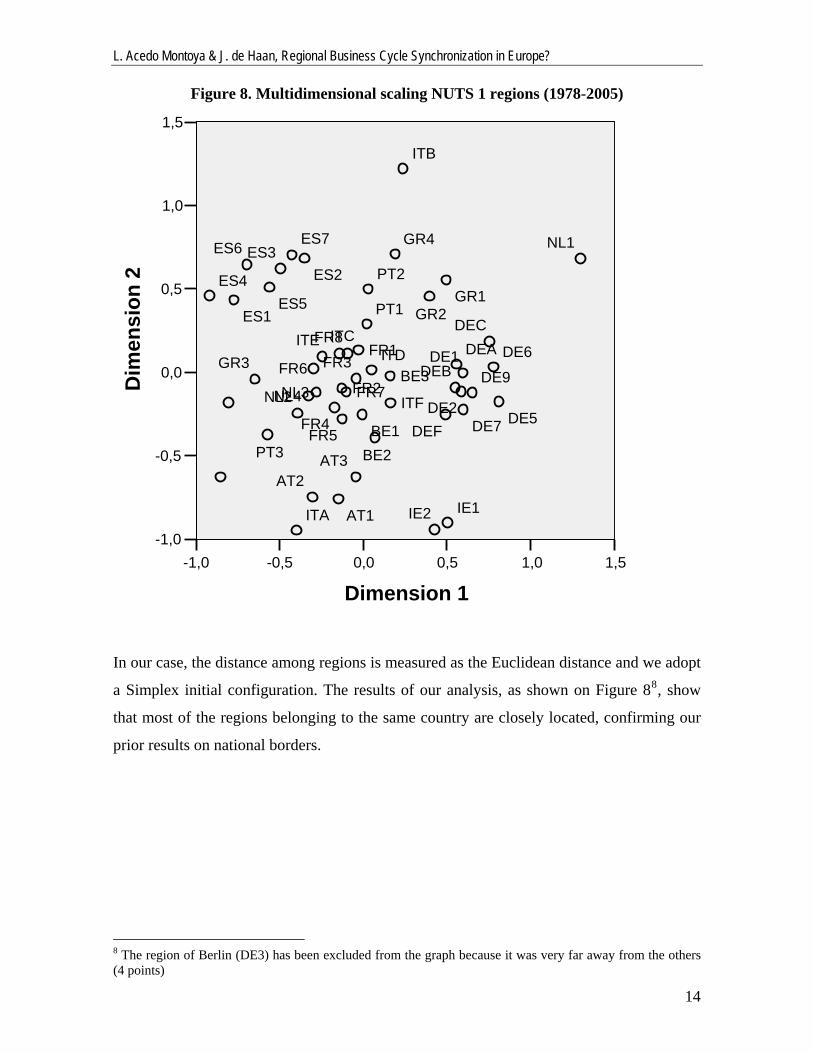
We apply Multidimensional Scaling techniques to the cyclical component of GVA of the
53 NUTS 1 regions in our sample. This technique converts a set of dissimilarity measures
in several dimensions into two dimensions by minimizing the squared sum of the difference
between the real and the estimated distance.7
7 This measure is called STRESS (Standardized Residual Sum of Squares).
L. Acedo Montoya & J. de Haan, Regional Business Cycle Synchronization in Europe?
14
Figure 8. Multidimensional scaling NUTS 1 regions (1978-2005)
1,51,00,50,0-0,5-1,0
Dimension 1
1,5
1,0
0,5
0,0
-0,5
-1,0
Dim
ensi
on 2
PT3
PT2
PT1
AT3AT2
AT1
NL4NL3NL2
NL1
ITB
ITA
ITF
ITEITD
ITC
IE2 IE1
FR8
FR7FR6
FR5FR4
FR3
FR2
FR1
ES7ES6
ES5ES4
ES3ES2
ES1
GR4
GR3
GR2GR1
DEF
DEC
DEBDEA
DE9
DE7
DE6
DE5DE2
DE1BE3
BE2BE1
In our case, the distance among regions is measured as the Euclidean distance and we adopt
a Simplex initial configuration. The results of our analysis, as shown on Figure 88, show
that most of the regions belonging to the same country are closely located, confirming our
prior results on national borders.
8 The region of Berlin (DE3) has been excluded from the graph because it was very far away from the others (4 points)

L. Acedo Montoya & J. de Haan, Regional Business Cycle Synchronization in Europe?
15
6. Conclusions
In this paper we have analysed the question of whether regional business cycles in the Euro
Area have become more synchronized. We have examined the correlation of detrended
Gross Value Added (GVA) among 53 NUTS 1 regions over the 1975-2005 period. Our
sample comprises nearly all the Euro Zone NUTS 1 regions. This is a major improvement
compared to previous studies that only considered a group of selected regions. Using the
correlation coefficient of the regional cycles with the Euro Zone benchmark, we find that
synchronization has increased on average for the period considered with some exceptions
during the eighties and the beginning of the nineties. Still, the correlation of the business
cycle in some regions with the benchmark remained low or even decreased.
Our findings also support the hypothesis of the existence of a “national border” effect,
which influences business cycles synchronization. Our findings do not support Krugman’s
(1991) view. We observe an increase in regional business cycle synchronization, although
there are marked differences across regions. An interesting topic for future research is to
determine the sources of these regional differences in business cycle synchronization.

L. Acedo Montoya & J. de Haan, Regional Business Cycle Synchronization in Europe?
16
References Altavilla C (2004) Do EMU members share the same business cycle? Journal of Common Market Studies 42: 869-898. Artis M (2003) Is there a European business cycle? CESifo Working Paper No. 1053. Artis M, Zhang W (1997) International business cycles and the ERM: Is there a European business cycle? International Journal of Finance and Economics 2: 1-16. Artis M, Zhang W (1998) Core and periphery in EMU: A cluster analysis. EUI Working Paper No. 98/37. Artis M, Zhang W (1999) Further evidence on the international business cycle and the ERM: Is there a European business cycle? Oxford Economic Papers 51: 120-132. Barrios S, Brülhart M, Elliot R, Sensier M (2002) A tale of two cycles : co-fluctuations between UK regions and the Euro Zone. Centre for Growth and Business Cycle Research (University of Manchester), Discussion Paper No. 003. Barrios S, De Lucio Fernandez JJ (2003) Economic integration and regional business cycles: Evidence from the Iberian regions. Oxford Bulletin of Economics and Statistics 65: 497-515. Belke A, Heine J (2006) Specialization patterns and the synchronicity of regional employment cycles in Europe. International Economics and Economic Policy 3: 91-104. Camacho M, Perez-Quiros G, Saiz L (2006) Are European business cycles close enough to be just one? Journal of Economic Dynamics and Control 30: 1687-1706. Christiano L, Fitzgerald TJ (2003) The band pass filter. International Economic Review 44: 435-465 Clark T, van Wincoop E (1999) Borders and business cycles. Federal Reserve Bank of Kansas City, Working Paper No. RWP-99-07. Darvas Z, Rose AK, Szapáry G (2007), Fiscal divergence and business cycle synchronization: Irresponsibility is idiosyncratic. Forthcoming in: Frankel JA, Pissarides C (eds) NBER International Seminar on Macroeconomics, MIT Press, Cambridge, MA. Den Haan W (2000) The comovement between output and prices. Journal of Monetary Economics 46: 3-30. De Grauwe P, Vanhaverbeke W (1993) Is Europe and optimum currency area? Evidence from regional data. In: Masson P, Taylor M. (eds), Policy Issues in the Operation of Currency Unions, Cambridge University Press, Cambridge, 111-129.

L. Acedo Montoya & J. de Haan, Regional Business Cycle Synchronization in Europe?
17
De Haan J, Inklaar RC, Jong-A-Pin RM (2007), Will business cycles in the Euro area converge? A critical survey of empirical research. Journal of Economic Surveys, forthcoming. Fatás A (1997) EMU: Countries or regions? Lessons from the EMS Experience. European Economic Review 41: 743-751. Frankel J, Rose A (1998) The Endogeneity of the optimum currency area criteria. The Economic Journal 108: 1009-1025. Hodrick RJ, Prescott EC (1997) Postwar US business cycles: An empirical investigation. Journal of Money, Credit, and Banking 29: 1-16. Inklaar R, De Haan J (2001) Is there really a European business cycle? A comment. Oxford Economic Papers 53: 215-220. Inklaar R, Jong-A-Pin RM, De Haan J (2007) Trade and business cycle synchronization in OECD countries A re-examination. European Economic Review, forthcoming. Kalemli-Ozcan S, Sørensen BE, Yosha O (2001) Economic integration, industrial specialization, and the asymmetry of macroeconomic fluctuations. Journal of International Economics 55: 107-137. Krugman, P (1991) Geography and Trade MIT Press, Cambridge (MA). Krugman, P (1993) Lessons of Massachusetts for EMU. In: Torres F, Giavazzi F (eds) Adjustment and Growth in the European Monetary Union, Cambridge University Press, Cambridge, 241-269. Massmann M, Mitchell J, Wheale M (2003) Business cycles and turning points: a survey of statistical techniques. National Institute Economic Review, No. 183. Massmann M, Mitchell J (2004) Reconsidering the evidence: Are Euro Area business cycles converging? Journal of Business Cycle Measurement and Analysis 1: 275-307. Ravn M, Uhlig H. (2002) On adjusting the HP-filter for the frequency of observations. The Review of Economics and Statistics 84: 371-375. Trichet J-C (2001) The Euro after two years. Journal of Common Market Studies 39: 1-13.

L. Acedo Montoya & J. de Haan, Regional Business Cycle Synchronization in Europe?
18
ANNEX A: List of regions and codes The “Nomenclature of territorial Units for Statistics (NUTS)” subdivides the economic territory of the Member States into smaller units for statistical purposes, as defined in Decision 91/450/EEC. The classification is hierarchical and based on a population threshold. Therefore, NUTS do not necessarily coincide with existing administrative units9.
Thought statistical analysis have been substantially simplified, NUTS classification has changed over time which difficult obtaining long and homogeneous series.
Population threshold NUTS1 3M 7M NUTS2 800000 3M NUTS3 150000 800000
List of regions and codes used for the empirical analysis (NUTS1) BE Belgium ES7 Canarias BE1 Brussels-capital FR France BE2 Vlaams Gewest FR1 Île de France BE3 Wallonie FR2 Bassin Parisien DE Germany FR3 Nord Pas de Calais DE1 Baden-Württemberg FR4 Est DE2 Bayern FR5 Ouest DE3 Berlin FR6 Sud-ouest DE5 Bremen FR7 Centre-est DE6 Hamburg FR8 Méditerranée DE7 Hessen IE Ireland DE9 Niedersachsen IE1 Border DEA Nordrhein-Westfalia IE2 Southern and Eastern DEB Rheinland-Pfalz IT Italy DEC Saarland ITC Nord-ouest DEF Schleswig-Holstein ITD Nord-est GR Greece ITE Centro GR1 Voreia Ellada ITF Sur GR2 Kentriki Ellada ITA Sicilia GR3 Attiki ITB Sardegna GR4 Nisia Aigaiou, Kriti LU Luxembourg ES Spain NL Nederland ES1 Noroeste NL1 Noord-Nederland ES2 Noreste NL2 Oost-Nederland ES3 Comunidad Madrid NL3 West-Nederland ES4 Centro NL4 Zuid-Nederland ES5 Este AT Austria ES6 Sur AT1 Ostösterreich
9 Regulation 1059/2003 of the European Parliament and the Council, of 26 May 2003 on the establishment of a common classification of territorial units for statistics (NUTS).

L. Acedo Montoya & J. de Haan, Regional Business Cycle Synchronization in Europe?
19
AT2 Südösterreich AT3 Westösterreich PT Portugal PT1 Continente PT2 Açores PT3 Madeira FI Finland FI1 Manner-Suomi FI2 Aland

List of ‘Bruges European Economic Policy briefings’ (BEEP) BEEP briefing n° 16 (March 2007) Services in European Policies, by Luis Rubalcaba. BEEP briefing n° 15 (July 2006) European Industrial Policy, by Jacques Pelkmans.
BEEP briefing n° 14 (March 2006) Has the European ICT Sector A Chance to be Competitive? by Godefroy Dang Nguyen & Christan Genthon.
BEEP briefing n° 13 (February 2006) Testing for Subsidiarity, by Jacques Pelkmans
BEEP briefing n° 12 (November 2005) La gestion de la transition vers la monnaie unique et l’établissement de la crédibilité de l’euro, by Jean-Claude Trichet.
BEEP briefing n° 11 (September 2005) Does the European Union create the foundations of an information society for all?, by Godefroy Dang Nguyen & Marie Jollès.
BEEP briefing n° 10 (January 2005) A ‘Triple-I’ Strategy for the Future of Europe, by Raimund Bleischwitz.
BEEP briefing n° 9 (December 2004) The Turkish Banking Sector, Challenges and Outlook in Transition to EU Membership, by Alfred Steinherr, Ali Tukel & Murat Ucer.
BEEP briefing n° 8 (October 2004) The Economics of EU Railway Reform, by Jacques Pelkmans & Loris di Pietrantonio.
BEEP briefing n° 7 (June 2004) Sustainable Development and Collective Learning: Theory and a European Case Study, by Raimund Bleischwitz, Michael Latsch & Kristian Snorre Andersen
BEEP briefing n° 6 (January 2004) Can Europe Deliver Growth? The Sapir Report And Beyond, by Jacques Pelkmans & Jean-Pierre Casey.
BEEP briefing n° 5 (April 2003) Efficient Taxation of Multi-National Enterprises in the European Union, by Stefano Micossi, Paola Parascandola & Barbara Triberti.
./..

List of ‘Bruges European Economic Policy briefings’ (BEEP) ./.. BEEP briefing n° 4 (April 2003) EU Enlargement: External Economic Implications, by Jacques Pelkmans & Jean-Pierre Casey. BEEP briefing n° 3 (March 2003) Mutual Recognition, Unemployment and The Welfare State, by Fiorella Kostoris Padoa Schioppa. BEEP briefing n° 2 (December 2002) Mutual Recognition in Goods and Services: an Economic Perspective, by Jacques Pelkmans.
BEEP briefing n° 1 (October 2002) Economic Implications of Enlargement, by Jacques Pelkmans.

List of ‘Bruges European Economic Research Papers’ (BEER) BEER paper n° 11 (June 2007) Regional Business Cycle Synchronization in Europe?, by Lourdes Acedo Montoya and Jakob de Haan BEER paper n° 10 (March 2007) Family Types and the Persistence of Regional Disparities in Europe, by Gilles Duranton, Andrés Rodríguez-Pose and Richard Sandall. BEER paper n° 9 (February 2007) Analysing the Contribution of Business Services to European Economic Growth, by Henk Kox and Luis Rubalcaba. BEER paper n° 8 (November 2006) The Determinants of Country Risk in Eastern European Countries. Evidence from Sovereign Bond Spreads, by Kiril Strahilov. BEER paper n° 7 (November 2006) Regional business cycles and the emergence of sheltered economies in the southern periphery of Europe by Andrés Rodríguez-Pose and Ugo Fratesi. BEER paper n° 6 (November 2006) The 2005 Reform of the Stability and Growth Pact: Too Little, Too Late?, by Fiorella Kostoris Padoa Schioppa. BEER paper n° 5 (October 2006) R&D, Spillovers, Innovation Systems and the Genesis of Regional Growth in Europe, by Andrés Rodríguez-Pose and Riccardo Crescenzi. BEER paper n° 4 (July 2006) Mixed Public-Private Enterprises in Europe: Economic Theory and an Empirical Analysis of Italian Water Utilities, by Alessandro Marra. BEER paper n° 3 (November 2005) Regional Wage And Employment Responses To Market Potential In The EU, by Keith Head & Thierry Mayer. BEER paper n° 2 (May 2005) Technology diffusion, services and endogenous growth in Europe. Is the Lisbon Strategy still alive?, by Paolo Guerrieri , Bernardo Maggi , Valentina Meliciani & Pier Carlo Padoan. BEER paper n° 1 (November 2004) Education, Migration, And Job Satisfaction: The Regional Returns Of Human Capital In The EU, by Andrés Rodríguez-Pose & Montserrat Vilalta-Bufí.