regional beach sand
TRANSCRIPT


REGIONAL BEACH SANDRETENTION STRATEGY
FINAL REPORT
Prepared for:
SANDAG401 B Street
San Diego, California 92101
Prepared by:
MOFFATT & NICHOL ENGINEERS250 West Wardlow Road
Long Beach, California 90807
In Association with:
EVERTS COASTAL1250 Grand Avenue, #334
Arroyo Grande, California 93420
and
MEC ANALYTICAL SYSTEMS2433 Impala Drive
Carlsbad, California 92008
October, 2001
M&N File: 4758

i
CONTENTS1.0 INTRODUCTION................................................................................................................1-1
1.1 Background ......................................................................................................................1-11.2 Approach ..........................................................................................................................1-11.3 Scope of Work..................................................................................................................1-2
2.0 EVALUATION OF RETENTION STRATEGIES AT APPROPRIATE LOCATIONS ...2-12.1 Needs Assessment ............................................................................................................2-12.2 Constraints Assessment....................................................................................................2-42.3 Opportunities Assessment ................................................................................................2-62.4 Retention Strategies by Location ...................................................................................2-13
3.0 SCREENING LEVEL ANALYSIS OF SAND RETENTION CONCEPTS ......................3-13.1 Offshore Breakwaters.......................................................................................................3-2
3.1.1 Relationships Between Structure Characteristics and Retained Beaches ................3-23.1.2 Impacts and Mitigation.............................................................................................3-7
3.2 Artificial Sand Retention Reefs........................................................................................3-73.2.1 Relationships Between Structure Characteristics and Retained Beaches ................3-73.2.2 Impacts and Mitigation...........................................................................................3-14
3.3 Groin Field .....................................................................................................................3-173.3.1 Relationships Between Structure Characteristics and Retained Beaches ..............3-173.3.2 Impacts and Mitigation...........................................................................................3-20
3.4 Economic Analysis of SanD Retention Strategies .........................................................3-203.4.1 Present Value Cost of Retention Strategies............................................................3-203.4.2 Present Value Cost for Beach Nourishment Alone................................................3-223.4.3 Summary of Economic Analysis............................................................................3-23
4.0 CONCLUSIONS AND RECOMMENDATIONS...............................................................4-14.1 Conclusions ......................................................................................................................4-14.2 Recommendations ............................................................................................................4-2
5.0 GLOSSARY OF TERMS ....................................................................................................5-46.0 BIBLIOGRAPHY ................................................................................................................6-1
Tables
Table 2-1 Results of Interviews for SANDAG- Retention Measure Strategies in Each CityTable 2-2 Sites With Moderate to No Environmental ConstraintsTable 2-3 Assessment of Sand Retention Opportunities in Oceanside Littoral CellTable 2-4 Assessment of Sand Retention Opportunities in Silver Strand Littoral CellTable 2-5 Sand Retention Strategies by LocationTable 3-1 Summary of Potential Impacts from a Sand Retention ReefTable 3-2 Present Value Costs for Sand Retention Strategies to Maintain Specified Beach
Areas for 50 YearsTable 3-3 Present Value Costs to Maintain Specified Dry Beach Area for 50 YearsTable 3-4 Comparison of Present Value Cost of Structure-Retained Beach Area and Beach
Area Maintained By Nourishment Only

ii
Technical Appendices
Appendix 1 Economic AnalysisAppendix 2 Longshore Sediment Transport in the RegionAppendix 3 Performance Assessment of Existing Structures in the RegionAppendix 4 Performance Assessment of Representative Retention Structures
Attachment Needs and Constraints Map

1-1Moffatt & Nichol Engineers
1.0 INTRODUCTION1.1 BACKGROUND
SANDAG adopted the Regional Shoreline Preservation Strategy in 1993. Sand retentionstrategies are recognized in the Shoreline Preservation Strategy as one of a number of tactics thatcan be used to complement the placement of sand on the region’s beaches. Sand retention hasthe potential to increase the cost effectiveness of beach replenishment activities, and may evenhelp to reduce potential environmental effects of beach filling by protecting sensitive resourcessuch as reefs and lagoons from sedimentation, and possibly providing new habitat areas.
1.2 APPROACH
In order to assess and take advantage of the potential benefits of sand retention, SANDAG hasapproved the preparation of a Sand Retention Strategy that includes the following components:
� Evaluation of retention strategies at the most appropriate locations along the region’sshoreline, and within every local coastal jurisdiction..
� Evaluation of natural features, such as points, bays and pockets along the coast, aswell as soft and hard structures, as potential features to retain sand.
� Use of the policies in the Shoreline Preservation Strategy to guide the evaluation,including evaluation of costs, benefits of reduced need for beach filling, possiblenegative affects on down-coast beaches (sand losses), and methods to compensate forany sand losses.
� Preliminary assessment of environmental affects of strategies and projects onlagoons, reefs and kelp beds.
� Development of preliminary designs and cost estimates for sand retention strategiesthat are consistent with Shoreline Preservation Strategy policies and have minimal ormitigable environmental impacts and consideration of possible downcoast erosionimpacts.
� Continuing consultation with the coastal jurisdictions and the Shoreline PreservationCommittee in carrying out the work, including input from coastal jurisdictions andreview by the Shoreline Preservation Committee.
It should be noted that this study represents the first step in what must be a carefully plannedprocess that may ultimately result in regional beaches enhanced by retention structures. Findingsin this report are based on reconnaissance-level evaluations.

1-2Moffatt & Nichol Engineers
1.3 SCOPE OF WORK
The scope of work for development of the sand retention strategy included the following tasks:
Task 1 – Review Existing Studies and Data
The focus of this task was to define the starting point for development of the Regional BeachSand Retention Strategy. The purpose was to summarize site conditions and retention structureperformance, augmented by available studies and data gathered by others. Key topics were toinclude:
� Littoral Processes and Sediment Budgets
� Efficacy of Natural and Artificial Sand Retention Measures
� Environmental Resources
A detailed bibliography of reviewed documents is provided in Section 6.0.
Task 2 – Evaluate Retention Strategies at Appropriate Locations
This task consisted of a methodical assessment of (1) needs, (2) constraints; and (3) opportunitiesfor sand retention strategies by location. Retention measures were considered on a region-widebasis to maximize regional benefits, and complement future possible replenishment activities. Atminimum, one measure was considered within each City.
Needs Assessment
In general, the sand retention strategy is focused on areas of greatest need for beachreplenishment. Beach sand provides benefit both in terms of increased recreational opportunitiesand enhanced shore protection. Recreational needs were assessed by considering potential forenhanced public usage associated with a widened beach, based on historic records of beachattendance and location relative to parking facilities and access routes.
Shore protection needs were also considered for both public and private property using theDBAW (California Department of Boating and Waterways) study of 1995 and recentapplications for shore protection in the region’s coastal cities (including the local comprehensivebeach and bluff plans). While the need for protection of public property is clearly in the publicinterest, widening of beaches fronting private property also provides a direct public benefit byreducing the need for seawalls and other hard shore-protective devices, and improving lateralpublic access.
Constraints Assessment
Given the establishment of needs by location, the next step in this task was to assess importantconstraints that may limit the location, extent and type of retention measure strategies consideredfor application. Existing detailed maps of sensitive environmental resources that may poseconstraints either to retention structure placement or potential for increased sand coverage and/or

1-3Moffatt & Nichol Engineers
lagoon in-filling associated with structure implementation were closely reviewed. Secondly, thepotential for downcoast impacts associated with retention measure implementation was criticallyassessed, along with acceptable mitigation measures. Thirdly, certain aesthetic or recreationalconstraints were considered that may also limit and/or possibly eliminate certain measuresotherwise considered effective candidates.
Opportunities Assessment
The focus of the opportunities assessment was to analyze both existing natural and man-madefeatures that function as effective sand-blocking structures and assess both their performance aswell as potential impacts. Opportunities to further enhance the beneficial sand blocking effectwhile not producing unacceptable downcoast impacts were assessed in the same fashion.
Opportunities were evaluated for application of retention measures in areas where need has beenestablished and yet insufficient opportunity to augment existing natural or man-made featuresexists. This resulted in recommendations for new, man-made measures at these locations. Man-made measures range from traditional features (groins and offshore breakwaters) to less-traditional features (naturalized headlands or reefs) and were considered based on site-specificneeds and community characteristics.
Opportunities to use man-made measures to protect or enhance nearshore reef habitat andlagoons were considered in their evaluation.
Strong emphasis was placed on opportunities to utilize innovative construction materials andmethods to improve the aesthetic quality of any proposed sand retention measures by givingthem a naturalized appearance.
Task 3 – Perform Screening-Level Analysis Of Sand Retention Concepts
The potential to increase the cost effectiveness of beach replenishment through sand retentionwas assessed on a site by site basis. The assessment of efficacy included both the initial re-distribution of existing and with project beach fills, as well as the expected frequency andamount of future fills to provide an agreed upon minimum beach width. Associated firstconstruction and future maintenance costs were estimated for the purposes of alternative ranking.For new features, the analysis generally included the steps of:
� Determining the beach area created by the feature at future equilibrium;
� Converting the area into the sand quantity;
� Calculating the cost to install the feature (if applicable) and pre-fill it with sand tocreate the equilibrium form (assuming that no downcoast effects will result or thatthey are fully mitigable);
� Defining the most appropriate downcoast beach mitigation measure and calculatingany mitigation costs;

1-4Moffatt & Nichol Engineers
� Calculating the cost to nourish the beach without the feature to create the equilibriumform;
� Assessing the potential environmental impacts and/or benefits of the feature, possibleenvironmental issues to be considered in design, and possible environmentalmitigation costs; and
� Assessing the performance and cost-effectiveness of the feature by comparing thesecosts.

2-1Moffatt & Nichol Engineers
2.0 EVALUATION OF RETENTION STRATEGIES ATAPPROPRIATE LOCATIONS
The general approach of this assessment was to contact individual cities to determine what theyfelt the key needs and constraints were such that opportunities for sand retention could befocused appropriately. City representatives also provided input regarding types of retentionstrategies they felt were appropriate for their respective cities, though generally taking care toqualify that their recommendations were based on their opinions of what they felt would bedesired and acceptable, and not necessarily advocating such strategies.
A brief glossary of coastal engineering terms used in this report is included in Section 5.0 of thisreport.
2.1 NEEDS ASSESSMENT
Each of the coastal communities focused primarily on recreational beach area, propertyprotection behind the beach, and the preservation or enhancement of surf breaks as their mostnoteworthy concerns. The first two focus on the character of the beach and the third on thecharacter of the nearby seabed. Needs were stated in meetings with City staff and aresummarized below.
Oceanside
Oceanside identified the need to reduce future coastal armoring by increasing the beach width.City staff requested that a groin or group of groins be evaluated at Buccaneer Beach oralternatively a single groin be evaluated adjacent to the pier. Any structures to be constructedwere specified to be exposed above the water surface to be visible and not present a submergednavigation or safety hazard. If possible, they should be naturalized in appearance. A chiefconcern was to not cause downcoast impacts to the region. Any local or regional project shouldbe coordinated with a potential federal project to mitigate Harbor impacts.
Carlsbad
Carlsbad requested the evaluation of a submerged reef, with a possible emergent componentlocated offshore the beach between Pacific Avenue and Oak Avenue. Encinas Creek Beach, justsouth of Terra Mar Point, was selected as an alternative site. Staff noted they would prefer afeature along their more intensively-used downtown coastal area. The structure should haveeffects that are not detrimental to Agua Hedionda or Buena Vista Lagoons. The proposal toextend the north jetty at Agua Hedionda Lagoon was to be referenced but was not identified tobe the retention measure assessed as a part of this study. The fillet beach to be created waspreferred to be long and narrow rather than short and wide.

2-2Moffatt & Nichol Engineers
Encinitas
Encinitas identified three objectives to meet for a sand retention measure. One is to promotesand accretion; a second is to allow sand to pass by the feature while retention occurs and thethird is to preserve and enhance (if possible) surfing as a resource. A submerged structure waspreferred, but an emergent component may also be appropriate if required for sand retentionperformance. It must look natural if it is emergent. The sand deposit must not block longshoresediment transport. Moonlight Beach is the primary site for the structure, and Leucadia is asecondary site. Creation of habitat should also be a goal with any structural feature.
Solana Beach
Solana Beach desires increased recreational beach area and a pilot project that could be appliedto increase property protection in the future. The City staff indicated a submerged reef atFletcher Cove would be preferred for sand retention. An emergent component would also beconsidered if necessary. A submerged reef should be designed to not adversely affect surfing,but rather to improve it. An emergent reef should appear naturalized.
Del Mar
Del Mar possesses the attribute of an accretional beach at the north portion of the coast and maynot need a beach retention structure in their jurisdiction. Rather, a retention strategy could be toplace future sand north of Powerhouse Park to maximize its retention within the City. Creationof new habitat should be a criterion for the project
San Diego
The City of San Diego is concerned about protecting Highway 101 along Torrey Pines StateBeach. A submerged reef at the south end of the Penasquitos Lagoon was suggested forconsideration to widen the beach and protect the highway. Improved surfing would also be adesirable benefit provided by the reef. Adverse impacts should not occur at the State beachsouth and Del Mar to the north.
Coronado
Coronado needs a strategy that will retain sand, provide a recreational benefit, is safe for thepublic and does not adversely effect the beach at the Hotel Del Coronado. The site for thestrategy is the 3,000-foot long reach south of the groin structure at the Hotel Del Coronado. Itborders the Coronado Shores condominium complex and is north of the US Navy AmphibiousBase. Options include a submerged reef that provides a surfing benefit, or a groin similar to thatat the Hotel Del Coronado, or a new stub groin off of the existing groin. A relic shipwreck existsoff of the Shores condominiums and presents a public safety hazard. The City needs to cap itwith material to eliminate protrusions through the sand at low tide. A project over the site couldadd the benefit of covering the ship.

2-3Moffatt & Nichol Engineers
Imperial Beach
Imperial Beach needs a wider beach along the southern 3,000-foot long reach at Seacoast Drive,between the south end of the street and Imperial Beach Pier. They desire less hard shoreprotection along this coast by widening the beach. A submerged reef that provides a surfingbenefit was identified as a preferred measure, or expanding the Tijuana River delta to advancethe entire coast seaward. Impacts to the Tijuana River Estuary and dunes complex are to becompletely avoided.
Summary
The needs as described by each local city is summarized in Table 2-1.
Table 2-1 Results of Interviews forSANDAG- Retention Measure Strategies in Each City
City LocationRetention
Measure(s) Considerations/CommentsOceanside Buccaneer Beach Groin Compartment Place sand dredged from harbor on beach
downcoast from groins; design to avoiddowncoast impacts; consider integrationwith Federal project; Alternative could begroin under pier.
Carlsbad North beach area, betweenpacific Ave., and Oak Ave.
Reef – submerged ora mix with anemergent component
Do not analyze Agua Hedionda LagoonJetty extension, but refer to previousSANDAG work done on it, caveated as notbeing as detailed as current effort; projectwould benefit recreation and tourist area.Surfing benefit would be a plus.
Encinitas Moonlight Beach; Alternatesite is Leucadia (betweenBeacons and Moonlight)
Reef – submerged (ifpossible); wouldconsider emergentreef if necessary
Make larger than Pratte's Reef in ElSegundo and use rock. If emergent, reefmust look naturalized; reef must retain sandand allow sand to pass between reef and thebeach; reef must provide a surfing resourceand biological habitat.
SolanaBeach
Fletcher Cove Reef – eithersubmerged oremergent
Compare performance of submergent versusemergent. If submergent, design as surf reeffor acceptance. If emergent, make looknatural where exposed. Estimate costdifference surfing versus non-surfing reef.Design for habitat creation.
Del Mar Between Powerhouse Parkand the northern Cityboundary
Natural acccretional Area naturally retains sand, and it should beconsidered as the placement area for anyfuture replenishment efforts.
San Diego Torrey Pines with MissionBeach as an alternate site
Reef –eithersubmerged oremergent
Prefer submerged; would protect Highway101 at Torrey Pines. Avoid lagoon (North)and surfgrass (South). Property is State-owned. Must provide surfing and offshorehabitat benefits. Alternative would be agroin under Crystal Pier.

2-4Moffatt & Nichol Engineers
Table 2-1 Results of Interviews forSANDAG- Retention Measure Strategies in Each City
(Continued)
City LocationRetention
Measure(s) Considerations/CommentsCoronado The Shores Condominium
south of the Hotel DelCoronado
Extend existing hotelgroin perpendicularto beach or installnew groin to south tomimic existing groin;alternative could besubmerged/emergentreef
Measure must not pose a safety hazard oraffect downcoast, particularly at the Hotel'sbeach. A narrow beach exists south ofexisting groin from development on sandand portions of a sunken shipwreck areexposed at low tide. Want to encaseportions of ship in concrete that may beopportunity for reef construction. Considerdredging from Zuniga shoal as done byNAVY, and improve sand trapping functionof jetty by "sealing" it and installing dog-legon end to south. Consider NAVY and Statefor funding.
ImperialBeach
South end of Seaccoast Drive Should have surfing component; avoid kelpbeds as constraints.
2.2 CONSTRAINTS ASSESSMENT
Constraints to sand retention exist along the region’s coast. They consist of sensitiveenvironmental resources and existing surfing locations. The map attached with this reportidentifies constraints in a qualitative fashion, with coastal areas designated with a green color baras not constrained, a yellow bar as moderately constrained and a red bar as highly constrained.North County beaches are the most constrained, with South County being less constrained. Allsites could realize benefits from placement of reef habitat. Either reef would be created where itdoes not exist or existing higher quality reefs would be expanded. Particularly good candidatesites are identified below in the discussion for each city.
Oceanside
The Oceanside shoreline exhibits only moderate constraints consisting of nearshore scatteredrocks at the southern beaches. Buccanneer Beach is not constrained.
Carlsbad
Carlsbad is more constrained, with sensitivity near two lagoon mouths, nearshore reef, surfgrassareas, kelp beds and surfing sites. Constraints are mostly moderate, with only two locations ofhigh constraints at Agua Hedionda Lagoon and Terra Mar Point. North Carlsbad is moderatelyto highly constrained. The north end of South Carlsbad State Beach is less constrained and is agood candidate for expansion of higher quality nearshore reef. A biological benefit may berealized from placing an artificial reef at this location. More biological reconnaissance workmay be needed to define potential impacts at this site.

2-5Moffatt & Nichol Engineers
Encinitas
Encinitas is similarly constrained with nearshore reef areas, surfgrass areas, historic kelp bedsand surfing sites. Two sites are highly constrained at Swami’s Park and Cardiff Reef and the restare moderately constrained. Moonlight Beach is less constrained, and is also a good candidatefor expansion of higher quality nearshore reef than presently exists. A biological benefit may berealized from placing an artificial reef at this location as well. Leucadia is moderatelyconstrained.
Solana Beach
Solana Beach is moderately constrained throughout to highly constrained at Seaside andTabletop Reefs. Fletcher Cove at the south end is less constrained, and is also a good candidatefor expansion of higher quality nearshore reef than presently exists. A biological benefit may berealized from placing an artificial reef at this location as well. More biological reconnaissancework may be needed to define potential impacts at this site.
Del Mar
Del Mar is either not constrained or only moderately constrained throughout the City. Amoderate constraint exists at the mouth of San Dieguito Lagoon and no other constraints existnorth of Powerhouse Park. South of Powerhouse Park the City is moderately constrained byreefs.
San Diego
San Diego ranges from no constraints, to moderate and then to highly constrained. Torrey PinesBeach is not constrained immediately south of Los Penasquitos Lagoon, then moderatelyconstrained at the south end.
Coronado
Coronado Beach is not constrained.
Imperial Beach
Imperial Beach is only constrained at the very south end toward the Tijuana River. The southend of Seacoast Drive is moderately constrained with kelp offshore.
Summary
Sites that are either not constrained or only moderately constrained for sand retention at eachCity are summarized in Table 2-2.

2-6Moffatt & Nichol Engineers
Table 2-2 Sites With Moderate to No Environmental Constraints
City Locations with Moderate to No Environmental ConstraintsOceanside Buccaneer BeachCarlsbad South Carlsbad State Beach at the north endEncinitas Moonlight BeachSolana Beach Fletcher Cove (south end)Del Mar North of Powerhouse ParkSan Diego Torrey Pines just south of the Los Penasquitos Lagoon inletCoronado Off of the Shores condominiumsImperial Beach South end of Seacoast Drive
2.3 OPPORTUNITIES ASSESSMENT
Coastal engineering design is greatly aided by prior experience with similar structures in similarenvironments. A critical aspect in the development of the retention strategy, therefore, was theassessment of existing natural and artificial features that function as effective sand blockingstructures. Unfortunately, there is a general deficiency of both natural and artificial structures inthe San Diego region that retain substantial beaches, particularly within the Oceanside LittoralCell from Oceanside Harbor to Point La Jolla.
A key first step in the assessment of sand retention opportunities was to summarize ourunderstanding of sand transport within the region. Accurate net and gross longshore sandtransport rates are required to predict the functional behavior of structures and to forecast theirimpacts on downcoast beaches. A summary of the longshore sand transport characteristicswithin the region is provided in Appendix 2.
Given our understanding of sand transport within the region, the next step was to assess theperformance of existing sand retention structures in the region. The assessment included bothnatural features and artificial structures. Results of this opportunities assessment are summarizedin Table 2-3 and Table 2-4. Please refer to Appendix 3 for more detailed analysis anddiscussion.

2-7Moffatt & Nichol Engineers
Table 2-3 Assessment of Sand Retention Opportunities in Oceanside Littoral Cell
Structure(s) Natural orArtificial Comments
ReferenceFigure
• Headland North ofPonto Beach(Carlsbad)
• Swami’s Headland(Encinitas)
• Reef off San ElijoLagoon (Encinitas)
• Reef at North SolanaBeach
Natural • These natural features retain very little drybeach width for their size
• Offer limited clues that could be used in designof artificial measures
• Point La Jolla Natural • Effective sand retention feature• Prevents sand passing to south• Retains beach at La Jolla Shores• Effectiveness relative to impact of La Jolla
Canyon unclear• North Breakwater at
Oceanside HarborArtificial • Present configuration constructed in 1963
• Retains beach up to 4,500 feet to the north• Retained beach area from 600,000 to 750,000
square feet• Acts like a groin• Fillet angle of 6 degrees• Blocking distance of 500 feet• Significant downcoast impacts
Figure 2-1
• South Breakwater atOceanside Harbor
Artificial • Complex orientation (two segments with outersegment oriented to the southeast) does notallow for useful assessment of performancefactors
Figure 2-1
• Groin at Mouth of SanLuis Rey River(Oceanside)
Artificial • Constructed in 1968• Performance affected by proximity to
Oceanside Harbor• Blocking distance on upcoast (north) side of
500 feet• Blocking distance on downcoast (south) side of
650 feet• Fillet angle in offshore direction due to
shadowing effect of harbor• Temporary Groin at
Buccaneer Beach(Oceanside)
Artificial • Constructed in early 1970s as temporarystructure to assist in construction of outfallthrough surf zone
• Photo gives no indication of sand fillet• Blocking distance on upcoast side of 800 to
1,000 feet• Blocking distance on downcoast side of 700 to
900 feet• Insufficient time for shoreline to reach dynamic
equilibrium, so blocking distances notrepresentative of long term performance
Figure 2-2

2-8Moffatt & Nichol Engineers
Table 2-3 Assessment of Sand Retention Opportunities in Oceanside Littoral Cell(Continued)
Structure(s)Natural orArtificial Comments
ReferenceFigure
• North and SouthJetties at AguaHedionda Lagoon(Carlsbad)
Artificial • Constructed in 1954• Purpose was to control entrance location and
keep it open to allow continuous supply ofcooling water
• Act as groins• Apparent blocking distance on north and south
jetties is 150 feet and 250 feet, respectively• Performance assessment complicated by
proximity of hardened shoreline and functionwithin a lagoon barrier shoreline
• Fillet angle of approximately 2.5 degrees• May be functioning more to prevent shoreline
from curving inward at the lagoon outlet thanretaining sand as sediment blocking structures
• North and SouthJetties at AguaHedionda Lagoon atPower Plant Outfall(Carlsbad)
Artificial • Constructed in mid-1950s• Similar assessment as jetties to the north
• North and SouthJetties at BatiquitosLagoon (Carlsbad)
Artificial • Excluded from assessment since have not beenin place for sufficient time to attain dynamicequilibrium.

2-9Moffatt & Nichol Engineers
Figure 2-1 North Breakwater at Oceanside Harbor and the Upcoast Retained Beach(February 1975)
Figure 2-2 Aerial Photograph of a Temporary Groin at Buccaneer Beach (1971)

2-10Moffatt & Nichol Engineers
In contrast to the Oceanside Littoral Cell, natural retention structures are primarily responsiblefor the configuration of the Silver Strand Littoral Cell, which stretches from the Zuniga Jetty atthe entrance to San Diego Bay to a rocky headland at the south end of the Playas de Tijuana.The primary natural retention structures include the Point Loma headland at the north end of thecell, and the Tijuana River delta to the south.
In addition to natural retention structures in the Silver Strand Cell, four permanent and onetemporary artificial structure either retain beach presently, retained beaches in the past, or weredesigned to retain beaches without success. The performance of both natural and artificialretention structures is summarized below in Table 2-4.
Table 2-4 Assessment of Sand Retention Opportunities in Silver Strand Littoral Cell
Structure(s)Natural orArtificial Comments
ReferenceFigure
• Point Loma headland Natural • Blocks and diffracts waves that approach from thenorth and northwest
• Reduces the amount of unobstructed deep waterwave energy that reaches the north half of the cell inits lee
• Tijuana River delta /Delta Point
Natural • Natural wave refraction and dissipation structure• Retains Delta Point which in turn holds the beach
position at this location (both to north and south)• Zuniga Jetty (Point
Loma)Artificial • Constructed in 1893-1904
• Largest of artificial sediment blocking structures inthe Silver Strand Cell
• Prevents sand from moving from south into entranceto San Diego Bay
• Holds beach up to 1,250 feet wider than pre-jetty(and pre-beachfill) shoreline
• Any modification to this structure would be of littlenet benefit to public beaches
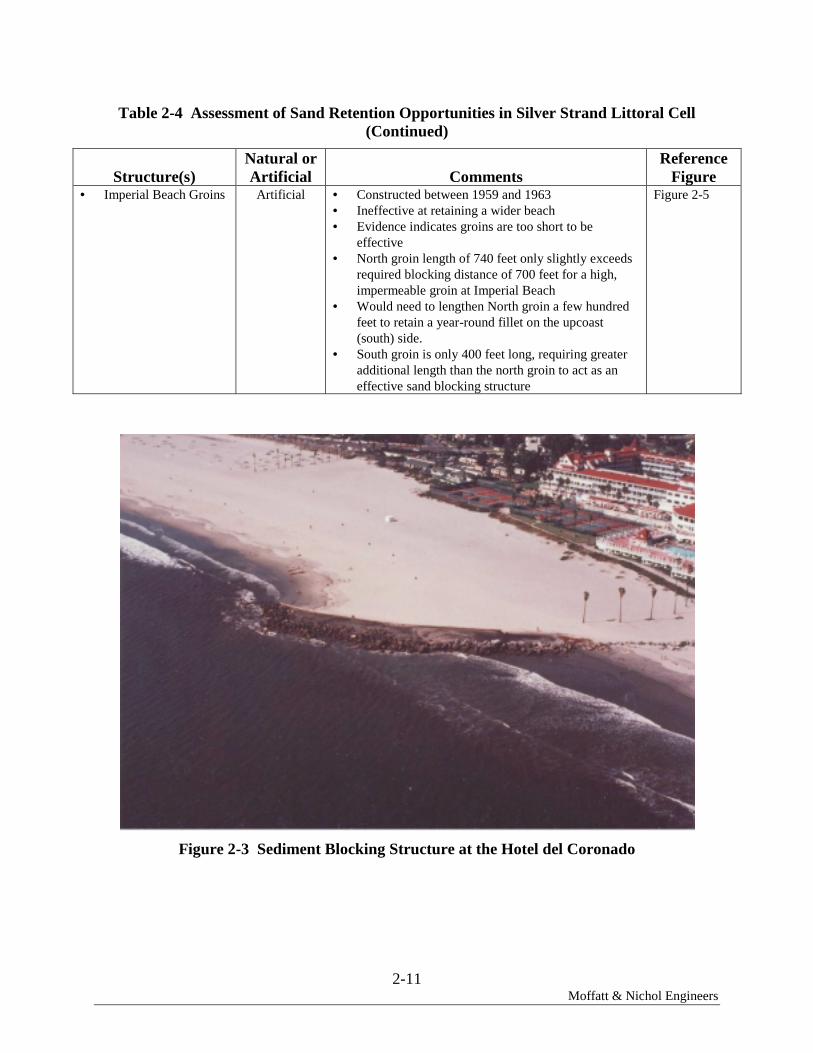
• Hotel del Coronadogroin (Coronado)
Artificial • Constructed in 1897-1900• Original purpose to provide calm water for
launching and mooring of small craft• Functions as sediment blocking structure (groin) and
wave blocking/diffraction structure (breakwater)• Intriguing feature in that it retains sand on its
downcoast (north) side• Historically retained 350,000 square feet of beach
prior to major beachfills• Prior to major beachfills, had shore-normal blocking
distance of 700 feet (comparable to Imperial Beach),with fillet angle of 2-3 degrees
• Presently retains less than one acre of beach
Figure 2-3Figure 2-4
• Historic shipwreck(Coronado)
Artificial • Observed in 1938 photograph• Created salient of 50,000 square feet• Provides useful information regarding efficacy of
small offshore breakwater
Figure 2-4
2-11Moffatt & Nichol Engineers
Table 2-4 Assessment of Sand Retention Opportunities in Silver Strand Littoral Cell(Continued)
Structure(s)Natural orArtificial Comments
ReferenceFigure
• Imperial Beach Groins Artificial • Constructed between 1959 and 1963• Ineffective at retaining a wider beach• Evidence indicates groins are too short to be
effective• North groin length of 740 feet only slightly exceeds
required blocking distance of 700 feet for a high,impermeable groin at Imperial Beach
• Would need to lengthen North groin a few hundredfeet to retain a year-round fillet on the upcoast(south) side.
• South groin is only 400 feet long, requiring greateradditional length than the north groin to act as aneffective sand blocking structure
Figure 2-5
Figure 2-3 Sediment Blocking Structure at the Hotel del Coronado

2-12Moffatt & Nichol Engineers
Figure 2-4 Salient in Lee of Shipwreck off Coronado (1938 Photo)
Figure 2-5 Groins at Imperial Beach

2-13Moffatt & Nichol Engineers
2.4 RETENTION STRATEGIES BY LOCATION
The thrust of this overall task was to conduct a methodical assessment of needs, constraints andopportunities for sand retention strategies by location. A minimum of one measure was specifiedto be considered for each city. Table 2-5 summarizes the sand retention strategies considered foreach city, based upon input from each city as well as the results of theneeds/constraints/opportunities assessment described in this report section.
Table 2-5 – Sand Retention Strategies by Location
City Retention Strategy DiscussionOceanside • Groin Compartment at
Buccaneer Beach• City desires visible
(emergent) structures onlydue to public safety issues
• Opportunities assessment determined groins not effective unlessvery long
• Long groins pose major concern for downcoast impacts• The City of Oceanside requested that groins still comprise their
desired strategy, with possible modifications to the existingFederal sand bypassing at Oceanside Harbor to help offsetdowncoast impacts
• Downcoast impacts cannot be quantified at this level of study,but must be considered if groins remain the desired sandretention strategy within Oceanside
• Buccaneer Beach is in need of retention and is not constrained,and therefore the appropriate site in this City
Carlsbad • Reef in north beach area• Reef can be submerged or
include emergentcomponent
• See Section 3 for analysis of reef• Prior study (Moffatt & Nichol Engineers, 1999) included cursory
assessment of extending the North Jetty at Agua HediondaLagoon, indicating potential economic feasibility
• The present study included a more detailed look at the function ofthe Agua Hedionda jetties, and casts some doubt on their functionas sand retention structures (see Appendix 3)
• The efficacy of extending the north jetty is currently underinvestigation by others
• North Carlsbad too constrained; South Carlsbad State Beachnorth end is in need and only moderately constrained, and istherefore suitable for the measure
Encinitas • Reef in Moonlight Beach• Reef should be
submerged or includeemergent component ifnecessary
• See Section 3 for analysis• Needs are at Moonlight Beach and it is only moderately
constrained, and therefore the suitable site for the measure• Moonlight Beach is suitable for habitat improvement
SolanaBeach
• Reef in Fletcher Cove• Reef can be submerged or
include emergentcomponent if made tolook like natural feature
• See Section 3 for analysis• Fletcher Cove is highly in need of sand and only moderately
constrained and therefore the suitable site for the measure• Fletcher Cove is suitable for habitat improvement
Del Mar • Rely on natural sandaccretion area betweenPowerhouse Park andnorthern city boundary
• This coast naturally retains sand north of Powerhouse Park anddoes not need augmented retention. Future beach fills should beplaced here while avoiding impacts to the San Dieguito Rivermouth.

2-14Moffatt & Nichol Engineers
Table 2-5 – Sand Retention Strategies by Location(Continued)
City Retention Strategy DiscussionSan Diego • Reef at Torrey Pines
• Reef can be submergedor include emergentcomponent
• See Section 3 for analysis• Torrey Pines State Beach just south of the lagoon is in need
of sand retention and unconstrained, and therefore suitablefor a measure
• Retention would protect Highway 101Coronado • Extend existing Hotel
del Coronado groin orconstruct new groin tosouth
• Opportunities assessment determined groins not effectiveunless very long
• Could retain a significantly wider beach if long enough• Groin must be at least 800 feet long to maintain an all-season
fillet• Long groin would pose major concern for downcoast impacts• Groins not recommended as sand retention strategy• In lieu of groins, Coronado could consider an offshore
breakwater or emergent reef (Section 3)• The beach is in need of sand retention off of the Shores
condominiums and is unconstrained, and therefore thesuitable site for the measure
Imperial Beach • Submerged reef at southend of Seacoast Drive
• Should include surfingenhancement
• Health of the beach at Imperial Beach dependent onpreservation of the Tijuana River delta as a beach retentionstructure
• Delta Point is retained by the delta and, in turn, is responsiblefor the shoreline position to the north and south of it
• Retention strategy would need to avoid kelp beds whilemeeting City’s request for a submerged structure with asurfing component
• Options include (1) artificially raising the crest of the delta toimprove its function as a wave refraction and attenuationstructure and (2) construct an artificial submerged reef closerto shore, possibly connected to shore
• See Section 3 for analysis• The beach is in need of sand retention at the south end of
Seacoast Drive and is unconstrained, and therefore thesuitable site for the measure
Section 3 of this report describes a screening level analysis of the cost effectiveness of theproposed retention strategies.

3-1Moffatt & Nichol Engineers
3.0 SCREENING LEVEL ANALYSIS OF SANDRETENTION CONCEPTS
The purpose of this screening level analysis of sand retention concepts was to attempt todetermine the cost effectiveness of the various concepts relative to beach nourishment alonewithout retention measures. The procedure used for the analysis is described in Section 1.3
The first and foremost step in this analysis was establishing relationships between retentionmeasure characteristics and retained beaches. Measures identified in the preceding section thatwere recommended for sand retention strategies within each city include both submerged andemergent reefs; groins are analyzed as the retention strategy of choice for Oceanside, thoughconcerns remain for potentially significant downcoast impacts.
For purposes of this study, reefs are defined as either submerged or emergent (above water)structures that allow buildup of sand on a beach due to the creation of a wave shadow zone onthe beach through gradual dissipation and breaking of wave energy. The offshore reef slope isrelatively shallow to enhance surfing opportunities. Conversely, breakwaters, which also caneither be submerged or emergent, create a wave shadow zone primarily by direct wave blockingand wave diffraction. As a result they are much smaller in plan area, and provide no surfingenhancement. In fact, offshore breakwaters can result in a net loss of surfing area which shouldbe mitigated if considered part of a sand retention strategy.
Coastal engineers understand much more about the sand retention characteristics of bothemergent and submerged breakwaters than reef structures. It is of interest for purposes of thisstudy to provide an assessment of the economic viability of breakwaters as sand retentionmeasures, since much more is known about them. In addition, some cities may wish to considerthem as an optional strategy if they appear feasible with mitigable impacts.
Some general assumptions were required as part of this overall economic assessment as follows:
� A continuing large scale sand nourishment program was assumed to occur throughoutthe project life for all alternatives.
� Each fixed structure that is used in conjunction with beach nourishment should befilled to the upper limit of its holding capacity. Where uncertainties exist, fill shouldexceed the calculated upper limit of the holding capacity of the structure. Thepurpose of pre-filling the structure induced salient or fillet is to eliminate anydowncoast loss of sand due to deposition at the project site.

3-2Moffatt & Nichol Engineers
� All structures should minimize downcoast shoreline erosion.
� A structure life of 50 years is assumed. This is standard coastal engineering practicefor concrete and armor stone structures.
Sections 3.1 through 3.3 describe the development of the offshore breakwater, artificial sandretention reefs, and groin concepts, respectively. Section 3.4 describes the economic analysis ofeach concept.
3.1 OFFSHORE BREAKWATERS
3.1.1 Relationships Between Structure Characteristics and Retained Beaches
This section summarizes methodologies to forecast the relationship between offshorebreakwaters and sand retention. Methods are based on review of the performance of knownbreakwaters in Southern California, as well as published empirical relationships. Please refer toAppendix 4 for more detailed discussion and analysis.
Offshore breakwaters are established measures for artificial sand retention. They reduce waveheights and alter the wave direction in their lee, allowing sand to build up in their wave shadowzone. Too large of a wave shadow zone can result in buildup of beach sand all the way out to thebreakwater, resulting in what is termed a tombolo. A sand bulge that does not reach thebreakwater but allows for ongoing transport of sand through the breakwater lee is called asalient. Creation of a tombolo is typically not desired due to excessive buildup of sand on theupcoast side of the tombolo, and associated sand loss downcoast.
Approach
The key parameters that control the sand buildup behind an offshore breakwater include thefollowing:
� Shore-parallel length of the breakwater
� Distance offshore of the pre-project shoreline
� Wave transmission characteristics of the breakwater, i.e. amount of wave energy thatcan pass over and/or through the breakwater
� Local wave and tide climate
Existing literature and methods regarding the performance characteristics of offshorebreakwaters was augmented by our assessment of the behavior of the beach retained behind threeoffshore breakwaters in Southern California. These beaches include the salient in the lee of theSanta Monica breakwater, the salient (pre-beachfill) and later tombolo (post-beachfill) in the leeof the Venice Beach breakwater, and the salient in the lee of the ship wreck off Coronado. Thesebeaches are shown in Figures 3-1, 3-2 and 2-4, respectively.

3-3Moffatt & Nichol Engineers
Figure 3-1 Salient in the Lee of the Santa Monica Breakwater in 1940(USACE-LAD, 1995)
Figure 3-2 Venice Breakwater and Transient Tombolo

3-4Moffatt & Nichol Engineers
Figure 3-3 shows the resulting relationship between breakwater configuration and retained beacharea, based on a combination of established relationships augmented with Southern Californiaexperience described above. The plot is a culmination of a detailed performance assessmentdescribed in Appendix 4. The purpose of the plot was to develop a means to compare differentstructure lengths, distances from shore, and transmission coefficients, in terms of theirefficiencies in retaining a beach and their cost, for the Southern California wave climate. Basedon the figure, the most cost effective structure would be that with the highest value of As/Vb,where As represents the retained beach area and Vb represents the structure volume which isdirectly related to structure cost.
0
0.5
1
1.5
2
2.5
0 3 6 9 12 15 18 21As/Vb
L/Y
Kt = 0.8
Kt = 0.4
Kt = 0.2
Kt = 0
Santa Monica Breakwater (1960-1988)
Venice Breakwater (1960-1988)
Venice Breakwater
Coronado Wreck (1938)
note: developed for southern California wave climate
salient limits
Figure 3-3 Benefit to Cost Chart for a Standardized Breakwater
Inspection of Figure 3-3 leads to some general guidelines:
� Not unexpectedly, a breakwater that provides little wave transmission (either throughthe structure or due to overtopping of a low structure) will likely produce the bestbenefit-to-cost structure.
� The most effective sand-retention structure would be an emergent breakwater with atransmission coefficient of 0.2 and a length of structure (L) to distance offshore (y)ratio of 1.5. It should be noted, however, that an offshore breakwater with an L/yratio of 1.5 does pose the risk of tombolo formation which should be avoided.
� Fully submerged breakwaters structures (transmission coefficient at 0.4 and greater)do not appear to be cost effective, even very long ones close to shore.

3-5Moffatt & Nichol Engineers
As an additional comment, care must be taken when designing a submerged breakwater or reef.Experience has shown that offshore structures that overtop can cause seabed scour in their leeand high currents that can move sediments away from the salient.
Conceptual Design
Using this methodology, a generic offshore breakwater design was developed for the sandretention economic analysis. Specific characteristics of the breakwater include:
� Length of 1,000 feet
� Distance offshore of 1,000 feet to maximize cost/benefit and minimize risk oftombolo formation
� Maximum width (i.e. distance offshore) of salient of 500 feet
� Total length of retained beach (alongshore dimension) of 3,000 feet
� Total retained beach area of 750,000 square feet (about 17 acres)
� Structure crest elevation of +6 feet MLLW (about 3 feet above mean sea level).
Figure 3-4 illustrates the breakwater concept.

3-6Moffatt & Nichol Engineers
Scale in Feet
Figure 3-4 Offshore Breakwater Conceptual Design

3-7Moffatt & Nichol Engineers
3.1.2 Impacts and Mitigation
Limited effort was focused in this study regarding impacts and mitigation of offshorebreakwaters since this type of retention measure was not specified as a candidate structure forimplementation. Key impacts that would need to be considered would include an offset for sandimpounded behind the structure and loss of recreational surfing opportunities. As for the initialloss of sand to the littoral system associated with the growth of the salient behind the breakwater,this type of impact is typically mitigated by pre-filling the salient volume with sand importedfrom outside of the littoral system. Loss of surfing opportunities could be mitigated byconstruction of a separate artificial surf reef, for the sole purpose of enhanced surfingopportunities.
Other potentially key impacts may include direct burial of reef habitat and the potential forcreating bird roost habitat that could reduce water quality.
3.2 ARTIFICIAL SAND RETENTION REEFS
The following section summarizes a methodology to forecast the relationship between artificialreef characteristics and sand retention. Methods are based on review of the performance ofknown reefs in Southern California and elsewhere, as well as published empirical relationships,which are limited. It is important to reiterate that, at least based on available information, fewartificial reefs successfully retain permanent salients. More study is required. Please refer toAppendix 4 for more detailed discussion and analysis.
3.2.1 Relationships Between Structure Characteristics and Retained Beaches
Artificial reefs are three-dimensional features that reduce wave heights in their lee. All reefs inthis discussion have a surfing component as this was identified as being a desired quality by eachcity indicating an interest in an artificial retention reef strategy. As stated previously, theprimary difference between breakwaters and reefs is that breakwaters reduce wave energy bydirect blocking of wave energy while reefs reduce transmitted wave energy through breaking anddissipation. In addition, breakwaters eliminate surfing areas while reefs can actually enhancesurfing opportunities.
To effect wave dissipation, reefs are wide in the cross-shore direction. Large and irregularlyshaped reefs refract waves thereby altering their approach direction toward the shoreline.Changes in wave energy along the shore resulting from smaller reefs are due primarily to anattenuation or dissipation of wave energy as it passes over the structure. If the wave conditionsin the lee of an artificial reef are sufficiently altered, they produce a change in the longshorecomponent of wave energy resulting in a bulge in the shoreline that is retained in dynamicequilibrium. Two examples of Southern California reefs that retain sand are included in Figures3-5 and 3-6.

3-8Moffatt & Nichol Engineers
Figure 3-5 San Mateo Creek (Trestles)
Figure 3-6 Topanga Creek

3-9Moffatt & Nichol Engineers
Natural reefs that enhance sand retention and surfing are generally located nearshore with a crest(or plateau) elevation near the water level. These reefs can be either shore-connected oroffshore, each with varying shoreline responses. Submerged reefs rarely generate substantialadverse effects on neighboring beaches since they have little impact on the longshore littoraldrift. Shore connected reefs allow sand to pass on the beach, seaward, and over the top at times,while offshore reefs allow sand to pass in the lee of the reef. As sediment is carried along thecoast, it moves parallel to the undulating shoreline, just as it is transported parallel to theshoreline on adjacent beaches. As is the case with low-crested offshore breakwaters described inthe preceding section, overtopping may result in the ponding of water in the lee of the structure.Erosive currents may be the consequence, with negative impacts on the retained salient.
Approach
Quantitative guidance to predict the size of a salient in the lee of an artificial reef is limited. Theprocedure utilized in this study to predict reef performance is comparable to that for offshorebreakwaters in that the first step is to identify the critical parameters that affect reef performanceas a sand retention device. These parameters are illustrated in Figure 3-7, and include:
� Reef length (L) or the alongshore dimension of the reef
� Reef distance (Y) from shore
� Reef width (wr) normal to shore, and
� Reef freeboard or water depth over the reef (ds-hc) where ds is the water depth at thereef toe and hc is the crest elevation above the seabed.
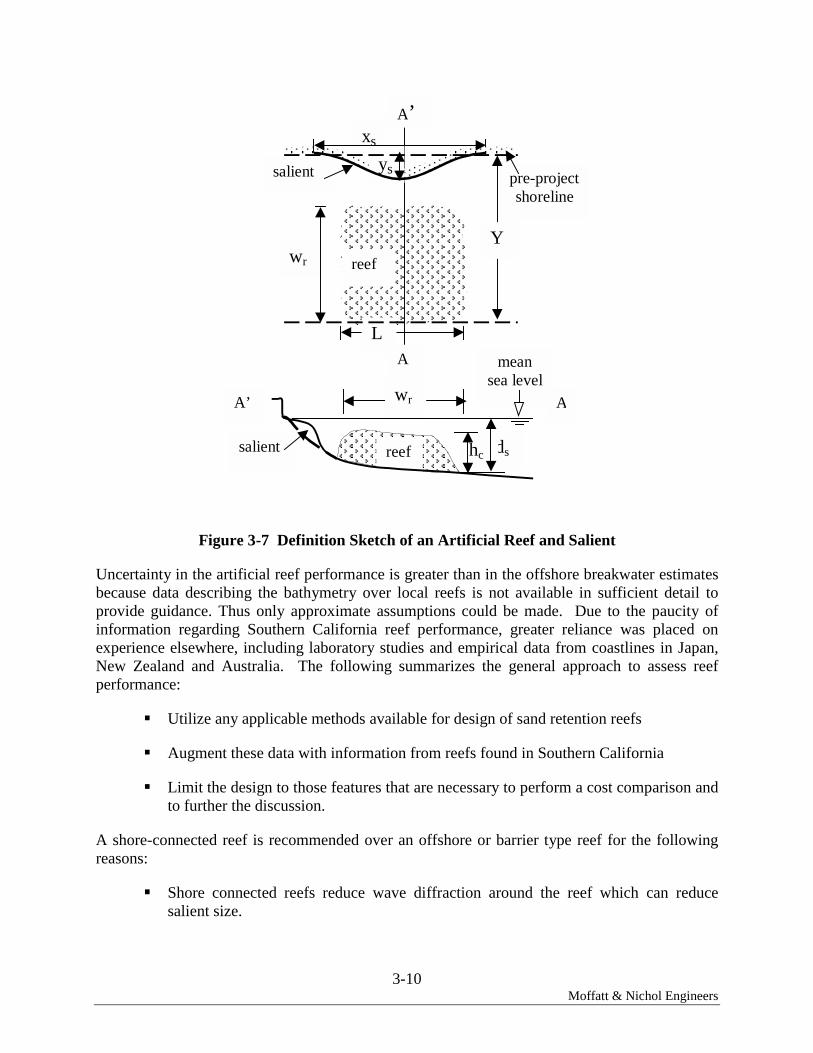
3-10Moffatt & Nichol Engineers
dshc
reef
salient pre-project shoreline
A’ A
wr
ys
L
Y
A’
salient
wr
xs
reef
A mean sea level
Figure 3-7 Definition Sketch of an Artificial Reef and Salient
Uncertainty in the artificial reef performance is greater than in the offshore breakwater estimatesbecause data describing the bathymetry over local reefs is not available in sufficient detail toprovide guidance. Thus only approximate assumptions could be made. Due to the paucity ofinformation regarding Southern California reef performance, greater reliance was placed onexperience elsewhere, including laboratory studies and empirical data from coastlines in Japan,New Zealand and Australia. The following summarizes the general approach to assess reefperformance:
� Utilize any applicable methods available for design of sand retention reefs
� Augment these data with information from reefs found in Southern California
� Limit the design to those features that are necessary to perform a cost comparison andto further the discussion.
A shore-connected reef is recommended over an offshore or barrier type reef for the followingreasons:
� Shore connected reefs reduce wave diffraction around the reef which can reducesalient size.

3-11Moffatt & Nichol Engineers
� Shore connected reefs force any water ponding to occur over the reef reducing thepossibility of scouring currents in the lee.
� The volume of a reef constructed close to shore is less because of the shallower water,resulting in lower construction cost.
� Natural examples of shore connected reefs in Southern California exist which canassist in development of design guidance.
With the lack of detailed bathymetry and reef shelf elevations, it was not possible to optimizethe reef design using a cost benefit approach as was done for the breakwaters in the precedingsection. Figure 3-8 summarizes the relationship developed in this study for the purposes ofpredicting salient area as a function of reef area.
0.1
1
10
100
1000
1 10 100 1000
Reef Area (acre)
Small Reefs
River Deltas
.
best fit
Figure 3-8 Salient Size as a Function of Reef Plan Area
Conceptual Design
A conceptual artificial sand retention reef design was developed based on methods describedabove. Specific reef and associated performance characteristics are summarized as follows.

3-12Moffatt & Nichol Engineers
� Total reef plan area of 5 acres
� Retained beach salient area of 2 acres
� Reef alongshore length (L) of 900 feet
� Reef width (wr) of 320 feet
� Offshore slope of 1:20 (vertical:horizontal) to enhance the surf break
� Shelf elevation ranges from –2 feet MLLW to +1 feet MLLW
� A schematic of the reef concept is shown in Figure 3-9.

3-13Moffatt & Nichol Engineers
South C
arlsbad
North
South
South C
arlsbad
DRYBEACHAREABEACH
SLOPEREEF
Figure 3-9 Sand Retention Reef Conceptual Design
3-14Moffatt & Nichol Engineers
3.2.2 Impacts and Mitigation
As described for the breakwater concept, impact of net sand loss to adjacent beaches associatedwith impounding of sand in the lee of the retention structure can be offset by pre-filling theestimate volume of the retained beach with sand from outside the littoral cell.
Although the beach would be widened as a result of construction of a shore-connected reef, therewould be a net loss of swimming beach length. It has not been determined whether this impact issignificant and requiring mitigation.
The focus of this screening analysis is on the implementation of artificial sand retention reefs.As stated previously in this report, sensitive biological habitat exists within North County SanDiego. A biological reconnaissance was done for the San Diego Regional Beach Sand Projectthat was used as the basis for assessment of potential impacts from this sand retention strategy.Impacts are determined assuming a submerged or emergent reef is the option at each site.Recommended sites are shown with arrows on the map attached with this report.
Table 3-1 summarizes information for the reef alternative. The first column in the table includesexisting sensitive resources at each candidate site. The second column addresses the beneficialimpact of creation of sub-tidal hard substrate habitat. The next three columns relate to directburial and/or indirect sedimentation to reef habitat. For the direct impacts, discrimination wasmade between reef habitat with sensitive resources (e.g., surfgrass) and ephemeral reef habitatwithout sensitive resources. Impacts to sensitive reef areas have the potential to be significant.Impacts to ephemeral reef habitats most likely would be adverse, but not significant. In fact,placement of higher relief reef habitat in an area of ephemeral reef may have habitatenhancement benefits. For the indirect impacts, only sedimentation to sensitive reef areas wasconsidered. Indirect sedimentation impacts to sensitive reef areas have the potential to besignificant. Sedimentation to ephemeral reefs is a natural seasonal phenomenon and would notconstitute a significant impact. The last column of the tables relates to proximity to nesting sitesof endangered least tern. Since turbidity will be generated during construction of either the reefor breakwater alternatives, sites within about 2 miles of nesting sites will be of potential concernto resource agencies, and construction schedules most likely would require agency review.
The Oceanside and Torrey Pines sites have no identified constraints at this time. Sites with noconstraints other than potential construction-related turbidity impacts to least terns includeCoronado and Imperial Beach. Two sites have a low potential for impacts to sensitive reefhabitat including Moonlight Beach and Solana Beach. Two sites have a higher potential forimpacts to sensitive reef habitat including North Carlsbad (hence selection of South Carlsbad)and Solana Beach. Placement of a reef at Torrey Pines has the potential for increasedsedimentation at the mouth of Los Penasquitos Lagoon if placed too far north. The potential forsignificant impacts to sensitive resources at sites considered to have a low potential or potentialfor impact requires further evaluation.

3-15Moffatt & Nichol Engineers
Another key impact to consider for submerged structures is public safety. Construction of anartificial structure in the surf zone could pose a public safety hazard to swimmers, surfers andboaters. Assessment of public safety impacts was beyond the scope of this study. Potentialmitigation measures could include public education, increased lifeguard patrol services, clear andeffective signage, and the like. Buoys delineating the reef extent may also be considered,although such structures in the surf zone may pose their own safety risk, including the potentialfor surfboard leashes to become entangled in the buoy mooring.

3-16Moffatt & Nichol Engineers
Table 3-1 Summary of Potential Impacts from a Sand Retention Reef
Location
Known/Potential SensitiveResources
Creationof HardSubstrate
Burial ofSensitive ReefHabitatInshore ofCreated Reef
Burial ofEphemeralReef Habitat
Sedimentationof Sensitive ReefHabitat
ConstructionTurbidity < 2Miles fromLeast TernNesting Site
1. Oceanside No Yes No No No No2. South Oceanside
(option)Scattered rock withpatchy surfgrass tosouth
Yes low potential low potential low potential No
3. North Carlsbad Scattered low to highrelief reef withsurfgrass
Yes Potential potential potential No
4. South Carlsbad(North)
Low to high reliefreef with surfgrass
Yes No No low potential No
5. Moonlight Limited scatteredreef, very sparsesurfgrass
Yes low potential potential low potential No
6. Solana Beach Scattered reef withpatchy surfgrass
Yes Potential potential potential Yes
7. Solana Beach(option)
Sand to patch reefwithout sensitiveresources
Yes low potential Potential low potential Yes
8. Torrey Pines No Yes No No No No9. Mission Beach No Yes No No No No10. North Coronado No Yes No No No Yes11. Imperial Beach No Yes No No No Yes12. Imperial Beach
(south)Kelp offshore Yes none known
inshore? No Yes

3-17Moffatt & Nichol Engineers
Mitigation for Biological Impacts
No significant impacts are expected at most sites and mitigation therefore may not be required.There is some low potential for impacts at South Carlsbad, Moonlight and Solana Beach.Additional evaluation may be needed to determine the significance of potential impacts andrequired mitigation at those sites.
3.3 GROIN FIELD
Groins are long, narrow structures placed approximately perpendicular to the shoreline to buildor widen a beach by trapping littoral drift. The widened beach can then serve recreational andshore protection functions. The desired sand retention strategy as conceived with the City ofOceanside consists of three major components: (1) construct groins long enough to providesufficient sand retention (2) pre-fill the groin fillets; and (3) modify the Federal sand bypassingat Oceanside Harbor to extend to south of the groin field thereby minimizing erosion impacts ondowncoast beaches.
3.3.1 Relationships Between Structure Characteristics and Retained Beaches
This section summarizes the method used to predict the relationship between a system of shoreperpendicular groins, known as a groin field, and the retained sandy beach. Groins arefundamentally different from breakwaters and artificial reefs in that they do not attempt tomodify transmitted wave energy as a mechanism for reducing longshore sediment transport, butinstead they directly block the currents that carry the suspended sediment along the coast.
Groins and groin fields have been used successfully to retain sand throughout the world and arerecognized coastal engineering structures. Conversely, if not applied properly, groins have alsobeen the primary cause of numerous cases of beach erosion. The accumulation of material(accretion) on the updrift side is accompanied by a corresponding amount of erosion on thedowndrift side of the groin. Knowing this, two essential site considerations are: (1) in order forsand to be trapped, there must be an adequate supply and (2) there is always a potential fordowndrift erosion problems.
Approach and Assumptions
Several general rules and guidelines are available to assist in this conceptual level design of agroin field. The approach and assumptions are listed here:
� Review previous studies and designs of similar work in the same project area (USACE,2000; Moffatt & Nichol Engineers, 1999; Noble, 1983a; and Noble, 1983b).
� Estimate the blocking distance for the project site based on nearby structures (Table 2-3).
� Estimate the fillet angle at the project site based on nearby structures (Table 2-3).
� Choose a desired beach area. In this case the beach area equals that of the OffshoreBreakwater Concept.

3-18Moffatt & Nichol Engineers
� Assume the net sediment transport direction at Bucaneer Beach is to the south. As statedin Appendix 2, the present understanding of the longshore sediment transport is weak inthe Oceanside Littoral Cell. It is known that the net to gross transport ratio is small, andthe general consensus is of net transport to the south.
� Calculate beach length, maximum width, and groin spacing based on fillet angle.
� Use the Shore Protection Manual for cross-section design (USACE, 1984).
� Assume the groins are nearly 100% impermeable to hold pre-filled sand in place.
Conceptual Design
Using this methodology, a groin field design was developed for the sand retention economicanalysis. Specific characteristics of the groin field are:
� Individual groin lengths of 930 feet
� Two groins spaced 1,500 feet apart
� Maximum fillet width of 280 feet
� Minimum beach width of 150 feet between groins
� Total retained beach area of 750,000 square feet (about 17 acres)
� Structure crest elevation of +14 feet MLLW at the beach berm, sloping down to +3 feetMLLW in the water
� The construction material has not been determined. Sand-filled geotextile bags orremovable sheet-piles could be used for a temporary pilot structure, and armor stonewould normally be used for a more permanent structure. Armor stone is assumed for thecost analysis.
Figure 3-10 illustrates the groin field concept.
Another alternative worth consideration is locating a single groin under the Oceanside Pier. Thislocation could reduce sand bypassing costs to the City as it would not extend the distance of theFederal sand bypassing project beyond where it is normally discharged. This alternative wouldminimize aesthetic impacts and impacts to recreational waters as the structure would be locatedimmediately adjacent to the existing pier.

3-19Moffatt & Nichol Engineers
SOUTH OCEANSIDE
Groin
Equilibrium Shoreline(Net Transport South)
100001000
Scale in Feet
Existing Beach Profile
Groin
Pre-Filled Sand
Horizontal Scale in Feet
200 0 200
+14 feet
-14 feet
+3 feet
0 feet MLLW
As-Built Shoreline
OCEANSIDE B
LVD.
ExtendedSand BypassDischargeLocation
Figure 3-10 Groin Field Conceptual Design

3-20Moffatt & Nichol Engineers
3.3.2 Impacts and Mitigation
Initial areas of concern for this alternative are impacts to bottom habitat due to sand placement,impacts to recreational surfing areas, and potential downcoast erosion. The site selection processincluded avoiding areas of reef habitat. There are notes of some scattered rock at the -30 footcontour that could be covered with sand due to beach widening. As possible mitigation, a largeamount of hard substrate subtidal habitat will be created with the addition of rocky groins.Experience at nearby groins indicates a possible improvement to recreational surfing, but thisaspect has not been studied for this project. No surfing mitigation is proposed for thisalternative. Downcoast erosion would be addressed by pre-filling the groin field, extending theFederal sand bypassing at Oceanside Harbor to south of the groins, regular beach monitoring,and possible re-nourishment. As an added benefit, the groins are expected to minimize theamount of sand migrating back north into Oceanside Harbor, thereby making this materialavailable for beaches to the south.
In addition, there is a potential for creating bird roost habitat that could reduce water quality.
3.4 ECONOMIC ANALYSIS OF SAND RETENTION STRATEGIES
The preceding sections describe development of offshore breakwaters, artificial reefs, and agroin field as sand retention measures, resulting in relationships between structure characteristicsand the amount of equilibrium beach area retained by the structure. The next step was toestimate life cycle costs of each concept for comparison with the life cycle cost of maintainingthe same beach area through periodic nourishment alone.
An economic analysis of various alternatives, e.g. structure vs. nourishment alone, requires acomparable cost basis. Costs presented in this report represent present value costs, i.e. theamount of capital required today to both build a structure and maintain it periodically in thefuture, taking into account inflation, current interest rates, and construction cost escalation (notnecessarily the same as the overall inflation rate). The project life for the economic analysis wasassumed to be 50 years.
3.4.1 Present Value Cost of Retention Strategies
Table 3-2 summarizes the present value cost analysis for construction of (1) a 1,000 foot longoffshore breakwater predicted to retain a 750,000 square foot beach (approximately 17 acres); (2)an artificial sand retention reef estimated to maintain a 87,000 square foot beach (approximately2 acres); and (3) a groin field predicted to retain a 750,000 square foot beach. Itemized costelements included:
� Initial construction cost for the structures
� Pre-filling the estimated retained beach volume with sand from outside the littoralzone as mitigation for impacts associated with sand impoundment behind thestructure

3-21Moffatt & Nichol Engineers
� Full mobilization costs were assumed for the beach pre-fill since it was notreasonable to assume that the construction would be concurrent with a regionalbeachfill project
� Future maintenance of the structures
� Allowance for future replenishment of the retained beach area due to storms
� Allowance for engineering, design, supervision and administration costs
� Allowance for surfing impact mitigation cost (breakwater only), assumed to beconstruction of an artificial surf reef (without sand retention characteristics) in thevicinity.
More detailed cost summaries are tabulated in Appendix 1.
Table 3-2 Present Value Costs for Sand Retention Strategies to MaintainSpecified Beach Areas for 50 Years
Sand Retention StrategyPresent Value Cost
($)
Cost per Square Foot ofRetained Beach
($/sf)Offshore Breakwater (17 Acres of Retained Beach)
w/o Allowance for Post-Storm Fill $25,600,000 $30w/ Allowance for Post-Storm Fill $33,400,000 $40
Artificial Sand Retention Reef(2 Acres of Retained Beach)
w/o Allowance for Post-Storm Fill $8,900,000 $100w/ Allowance for Post-Storm Fill $9,300,000 $110
Groin Field (17 Acres of Retained Beach)
w/o Allowance for Post-Storm Fill $16,200,000 $20w/ Allowance for Post-Storm Fill $20,400,000 $30
For more direct comparison purposes, a reduced breakwater concept was developed that wouldretain the same two-acre beach area as that predicted for the sand retention reef. The cost persquare foot of retained beach increased to $70 and $80 for the without and with post-storm fillingrequirements, respectively. The primary reason for the significant increase in cost was theincreased relative cost of the surfing mitigation. Similar values for a groin field retaining a two-acre beach are increased to $120 and $130 for without and with post-storm sand filling. Therelative increase is mainly due to the groin costs dropping by only 14 percent while the beacharea decreases by 88 percent.

3-22Moffatt & Nichol Engineers
3.4.2 Present Value Cost for Beach Nourishment Alone
The premise of this economic analysis was to compare total present value costs of the structure-retained beach areas to maintenance of the same beach area through nourishment alone. Presentvalue cost estimates were developed to estimate the present value cost of maintaining the samedry beach area as that estimated to be retained by the breakwater or reef, but through beachnourishment alone. As was done for the present value costs of the retention strategies, thepresent value costs for beach nourishment alone assume that the desired dry beach area will bemaintained over a 50 year period through periodic beachfills.
It is important to point out that the stability of these periodic beach fills is difficult to predict duein part to the following:
� limited data exists on beachfill longevity
� fill stability will be greatly affected by the future wave climate which can be highlyvariable
� the future frequency and volume of future regional beach fills in unclear.
Predictions were made of beachfill longevity based on available historic records and studies ofbeachfill erosion rates, including supporting studies for the Regional Beach Sand Projectcurrently under construction. It was predicted that Oceanside, Encinitas and Solana Beachwould require the most frequent re-nourishment, followed by Coronado and Imperial Beach,with Torrey Pines and South Carlsbad requiring the least frequent re-nourishment.
Table 3-3 summarizes estimates of the present value cost to maintain the same dry beach area asthat predicted for the retention strategies. More detailed cost information is included inAppendix 1.
Table 3-3 Present Value Costs to Maintain Specified Dry Beach Area for 50 Years
Beach Nourishment Size andLocation
Present Value Cost($)
Cost per Square Foot ofBeach ($/sf)
Oceanside / Encinitas / Solana Beach17 Acre Beach $57,000,000 $802 Acre Beach $20,300,000 $230
South Carlsbad / Torrey Pines17 Acre Beach $22,400,000 $302 Acre Beach $5,900,000 $70
Coronado / Imperial Beach17 Acre Beach $26,500,000 $402 Acre Beach $7,700,000 $90

3-23Moffatt & Nichol Engineers
3.4.3 Summary of Economic Analysis
Table 3-4 provides a comparison of the present value cost for structure-retained beach area andbeaches maintained by periodic nourishment alone.
Table 3-4 Comparison of Present Value Cost of Structure-Retained Beach Area and BeachArea Maintained By Nourishment Only
Beach Nourishment Size andLocation
Structure-RetainedBeach($/sf)
Beach Maintained byNourishment Only
($/sf)Oceanside / Encinitas / Solana Beach17 Acre Beach (Breakwater) $40 $802 Acre Beach (Reef) $110 $23017 Acre Beach (Groin Field) $30 $80South Carlsbad / Torrey Pines17 Acre Beach (Breakwater) $40 $302 Acre Beach (Reef) $110 $70Coronado / Imperial Beach17 Acre Beach (Breakwater) $40 $402 Acre Beach (Reef) $110 $90
Review of the above results indicates that for Oceanside, employing any of the three structurealternatives appears preferable over sand nourishment alone when considering only costs. Forthe other more erosive beach areas such as Encinitas and Solana Beach, implementation of eitheran offshore breakwater or artificial sand retention reef appears to be feasible based on cost alone.Although no city requested consideration of an offshore breakwater as their retention measure ofchoice, the results demonstrate their cost effectiveness relative to artificial reefs. This makessense given breakwaters utilize less volume of material and penetrate the water surface resultingin less wave transmission. Groin fields were not analyzed for locations other than Oceanside dueto a lack of interest. Even with the less effective retention reef measure, economic benefits aredemonstrated based on costs.
In less erosive beach areas, the analysis indicates that life cycle costs would be comparablebetween sand retention structures and nourishment alone, with sand retention structures beingslightly higher. Given this situation, the option of nourishment alone may be preferable, sincecurrent sentiment is generally against implementation of hard, artificial structures.
In summary, the economic analysis indicates that, based solely on a life cycle cost analysis, asand retention strategy incorporating artificial sand retention structures appears warranted alongthe more erosive beaches in San Diego county. Conversely, such structures do not appear to beeconomically justified in more stable beach locations. Again, this conclusion is based on costs,and does not quantitatively consider relative benefits between alternative strategies. Althoughthe benefits of a wider beach are inherently included since the analysis is based on retaining thesame amount of beach area, benefits not included are habitat enhancement (and detriment) andsurfing enhancement (vs. loss of swimming beach).

4-1Moffatt & Nichol Engineers
4.0 CONCLUSIONS AND RECOMMENDATIONS4.1 CONCLUSIONS
Artificial sand retention measures were found to have the potential to be cost effective inlocations demonstrating the greatest problems in beach erosion, with no clear choice in the lessererosive sites. This finding must be qualified in that significant assumptions were required to bemade that were integral to the economic assessment. Further site-specific and structure-specificstudy is required before final decisions can be made.
This study evaluated only those structures the communities asked for. Others might be aseffective or even more effective in retaining a beach. While the structures discussed certainlydeserve close scrutiny, decision-makers should fully appreciate the boundary between practicalcapability and wishful thinking. An especially important consideration is structure size. The sizeof the retained beach will almost always be proportional to the size and/or the number ofstructures, and hence their cost. Small structures will usually retain small beaches; structuresthat are too small will retain no beach.
The Regional Beach Sand Retention Strategy developed in this study evaluated the possibility of(1) enhancing natural retention structures like headlands and river deltas, (2) enhancing existingartificial structures that possess a beach retention function, such as jetties and groins, and (3)creating new artificial beach retention structures. The great benefit of detailed, phased, site-specific investigations comes because large, location-dependent differences in the incoming sandsupply, local shoreline orientation and irregularities, local bathymetry, and deep water waveclimate, all interact to produce substantial variations in the ratio of retained beach size tostructure dimensions for each of the three structure types considered. Choosing the rightstructure for the environment and optimizing its location, configuration and dimensions, is wherereal gains in efficiency can be made. The goal is practical in the sense it focuses on the mostfavorable options to retain a beach, including no structures.
Decisions that affect beaches usually consider factors other than beach and structure size. Amongthem are the probability of success, environmental consequences such as downcoast impacts,impacts on surfing and living resources, upfront and down-the-road costs, aesthetics,construction disruptions, legal considerations, and political factors including the desires ofpeople who want no coastal projects. Some of the beaches likely to be retained by artificialstructures will be “specialty” beaches that may superbly meet some needs, but not all of the widerange of beach recreational and protection functions that exist.

4-2Moffatt & Nichol Engineers
This effort is just the first step in the long journey that ends with an enhanced beach retained by astructure. Recommendations provided in this report are based on reconnaissance-levelevaluations. A great deal more work is needed to prove or disprove them as the “best” structuresfor the sites selected by the local government officials. More detailed functional investigationsare definitely warranted to fine tune the structures to the desired beaches. In all cases, theevaluations conducted in this analysis raised questions that require further functionalinvestigation before any design is begun on the suggested structures.
During the entirety of this process, permitting questions and funding will require close attention.Given the opposition to structures by some people, it is likely there will also be a certaineducation element required during the permitting process. Construction follows when all design,regulatory and funding questions have been resolved. Last, and ongoing is monitoring and beachreplenishment as needed. Due to cost savings, opportunistic sand sources with an appropriatenearby stockpile will be especially useful adjuncts to the continuing upkeep of structure-retainedbeaches in San Diego County.
4.2 RECOMMENDATIONS
This study provides a first step in establishing both a local and region-wide sand retentionstrategy. The results are promising, but a great deal more work must be done before decisionsfor implementation can be made with sufficient confidence in the results.
Artificial sand retention reefs were generally identified as the measure of choice. Given thelimited knowledge and performance data for this type of structure in Southern California, effortsshould be focused on expanding this knowledge base. Specific recommendations include:
� Closely track performance of the Narrowneck Reef developments in Australia.
� Augment findings of this study with the recently initiated study of sand retentionreefs sponsored by the California Coastal Conservancy.
� Update findings of this study with monitoring data from the Regional Beach SandProject now underway.
� Initiate a detailed measurement program of the physical features of existing naturalsand retention reefs followed by physical model studies of any proposed artificialsand retention reef.
� Construct a prototype sand retention reef in Southern California before fullimplementation. This structure could be built from large sand filled geotextile bags tominimize construction costs and to allow for relatively easy removal. It is suggestedthat this reef be built in two stages, with the second stage being a fine tuning andpossibly expansion of the primary design. This would yield invaluable engineeringdata to better optimize future designs. A detailed shoreline monitoring programwould be an essential element of this prototype-scale pilot study to assess bothperformance and impacts.

4-3Moffatt & Nichol Engineers
� A prototype-scale pilot study of groin performance could also be considered inOceanside. As for the retention reef concept, the temporary groin should beremovable, and possibly adjustable. Detailed monitoring would be a critical elementof project implementation, particularly due to the concerns regarding downcoastimpacts.

5-4Moffatt & Nichol Engineers
5.0 GLOSSARY OF TERMSThe following provides definitions of key terms. Definitions are presented in the context thatthey are referred to in the report.
BLOCKING DISTANCE – Minimum length of a sand blocking structure (e.g. groin) before itwill have any impact on retaining a permanent beach.
BREAKWATER – A structure protecting a shore area from waves for purposes of sandretention.
DELTA – An alluvial deposit formed at a river mouth.
DOWNCOAST – In the U.S., the coastal direction generally trending toward the south.
DOWNDRIFT – The direction of predominant movement of littoral materials.
DIFFRACTION – When part of a train of waves is interrupted by a barrier, such as a breakwater,the effect of diffraction is manifested by propagation of waves into the sheltered region withinthe barrier’s geometric shadow.
EMERGENT – Above normal water levels at all times.
FILLET – (pronounced fil’-let) Wedge-shaped area of sand accretion on the updrift side of agroin.
FILLET ANGLE – Angle between the groin-adjusted shoreline and the original shoreline.
GROIN – A sand retention structure built perpendicular to the shoreline to trap littoral drift orretard erosion of the updrift shore.
JETTY – A structure extending into a body of water, designed to prevent shoaling of a channelby littoral materials.
LEE – Shelter, or the part or side sheltered from the wind or waves.
LITTORAL CELL – A segment of the coast defined for understanding and quantifyingmovements of sediments that affect the behavior of the shoreline. Cell boundaries are usuallyestablished where alongshore movements of sediments into or out of them are known.

5-5Moffatt & Nichol Engineers
REFRACTION – The process by which the direction of a wave moving in shallow water at anangle to the bottom depth contours is changed: the part of the wave advancing in shallow watermoves more slowly than that part still advancing in deeper water, causing the wave crest to bendtoward alignment with the bottom contours.
SALIENT – A buildup of sand behind a sand retention structure such as an offshore breakwater.
SUBMERGED – Top of the structure is below water during the normal tide range.
TOMBOLO – A bar or spit that connects an offshore sand retention structure to the shoreline.
TRANSMISSION COEFFICIENT – Represents the total fraction of wave energy transmittedboth through and over an offshore sand retention structure.
UPCOAST – In the U.S., the coastal direction generally trending toward the north.
UPDRIFT – The direction opposite that of the predominant movement of littoral materials.
6-1Moffatt & Nichol Engineers
6.0 BIBLIOGRAPHYAhrens, John P, 1987, Characteristics of Reef Breakwaters, Technical Report CERC-87-17,Coastal Engineering Research Center, Department of the Army, Waterways Experiment Station,U.S. Army Corps of Engineers.
Ahrens, John P., 1989, “Stability of Reef Breakwaters,” Journal of Waterway, Port, Coastal, andOcean Engineering, Vol. 115, No. 2.
Bagley and Whitson, "Putting the Beach Back at Oceanside," Journal of the American Shore andBeach Preservation Association.
Bancroft, Stacey, 1999, Performance Monitoring of the Cable Station Artificial Surfing Reef,The University of Western Australia, Department of Environmental Engineering.
Bisher, Diana R. and Frederick W. West, 1992, "Jet Pumps and Fluidizers Working Together:The Oceanside Experimental Sand Bypass System," The State of the Art of Beach Nourishment,.Proc. of the 6th Annual National Conference on Beach Preservation Technology, St. Petersburg,FL, 10-12 February 1993, Compiled by S. Tait, FSBPA, Tallahassee, FL, pp 207-222.
Black, Kerry and Connon Andrews, Mal Green, Richared Gorman, Terry Healy, Terry Hume,Jamie Hutt, Shaw Mead, Andrew Sayce, 1997, “Wave Dynamics and Shoreline Response on andAround Surfing Reefs,” 1st International Surfing Reef Symposium, Sydney.
Bodge, Kevin R., Beach Fill Stabilization Structures: Experience in the Southeastern U.S.A. andCaribbean, Olsen Associates, Inc., Jacksonville, FL.
Bruno, Michael S. and Thomas G. McKee, Wayne M. Clark, 1992, Laboratory Study of anArtificial Reef Beach Erosion Mitigation Device, Technical Report SIT-DL-92-9-2676, DavidsonLaboratory for Breakwaters International Inc.
California Department of Boating and Waterways and San Diego Association of Governments,1994, Shoreline Erosion Assessment and Atlas of the San Diego Region, Volume I.
California Department of Boating and Waterways and the San Diego Association ofGovernments, 1994. Shoreline erosion Assessment and Atlas of the San Diego Region, VolumeII. , Sacramento, CA
CIRLA/CUR, 1991. Manual on the Use of Rock in Coastal and Shoreline Engineering.Construction Industry Research and Information Asso. Cirla Special publ. 83, Center for CivilEng. Research and Codes, Cur Report 154, Bell & Bain ltd., Glasgow, Great Britain.

6-2Moffatt & Nichol Engineers
City of Long Beach, 1992, Monitoring Report Coastal Development Permit # 5-91-695,Emergency East Beach Erosion Control Measure, Temporary Artificial Reef, Department ofParks, Recreation & Marine.
Coastal Environments, 1999, Report on Study of Sediment Transport Conditions in the Vicinityof Agua Hedionda Lagoon, La Jolla, CA.
Coastal Frontiers Corporation, 1998, SANDAG 1997 Regional Beach Monitoring Program,Compilation of Historical and Recent Beach Profile Data, Chatsworth, CA.
Coastal Frontiers Corporation, 1998, SANDAG 1997 Regional Beach Monitoring Program, FallSurvey, Chatsworth, CA..
Coastal Frontiers Corporation, 1999, SANDAG 1998 Regional Beach Monitoring Program,Compilation of Historical and Recent Beach Profile Data. Chatsworth.
Curren, Charles, R. and, E. Claude Chatham, Jr. E., Claude,1977, Imperial Beach, CaliforniaDesign of Structures for Beach Erosion Control Hydraulic Model Investigation, HydraulicsLaboratory, U.S. Aarmy Eengineer Waterways Experiment Station., Final Report.
Department of Navigation and Ocean Development, 1977, Assessment and Atlas of ShorelineErosion along the California Coast, State of California, The Resources Agency.
Department of the Navy, 1995, Final Environmental Impact Statement for the Development ofFacilities in San Diego/Coronado to Support the Homeporting on One NIMITZ Class AircraftCarrier, Southwest Division Naval Facilities Engineering Command.
Department of the Navy, 1997, Environmental Assessment for Beach Replenishment at SouthOceanside and Cardiff/Solana Beach, California, Southwest Division Naval FacilitiesEngineering Command.
Department of the Navy, 1997, Environmental Assessment for Beach Replenishment at NorthCarlsbad, South Carlsbad, Encinitas, and Torrey Pines, Southwest Division Naval FacilitiesEngineering Command.
Department of the Navy, 1999, Final Environmental Impact Statement for Developing HomePort Facilities for Three NIMITZ-Class Aircraft Carriers in Support of the U.S. Pacific Fleet.
Everts, Craig H. and Carolyn D. Eldon, 2000, “Beach-Retention Structures and Wide SandyBeaches in Southern California,” Journal of the American Shore & Beach PreservationAssociation, Vol. 68, No. 3.

6-3Moffatt & Nichol Engineers
Flick, Reinhard, E., and Jerome R. Wanetick, Thomas C. Fu, Allen H. Harker, Walton B.Waldorf, 1986, S.I.O. Reference Series, San Diego Regional Beach Profile Program FinalReport, University of California, San Diego, Reprinted June 1995.
Geotechnical Exploration Inc. Evaluation of Sea Crest/Sea View Condos at Several PacificStreet Houses.
Hales, L.Z., 1978, Coastal Processes Study of the Oceanside, California, Littoral Cell.Miscellaneous Paper H-78-8, U.S. Army Corps of Engineers, U.S. Army Engineer WaterwaysExperiment Station, Vicksburg, MS, Final Report, 60 pp., plus 13 appendices.
Herbich, John B., 1999, Handbook of Coastal Engineering, McGraw-Hill Handbooks.
Hetherington Engineering, Review of Scott Jenkins Wave Study and Rip-Rap Integrity atProperty on Pacific Street.
House Document No. 399, 1956, Oceanside, Ocean Beach, Imperial Beach, and Coronado, SanDiego County, Calif. Beach Erosion Control Study, 84th Congress, 2d Session, U.S.Government Printing Office, Washington, DC.
House Document No. 456, 1960, San Diego County, Calif., Appendix IV, Phase 2, BeachErosion Control Study, 86th Congress, 2 d Session, U.S. Government Printing Office,Washington, DC.
House Document No. 76, 1965, Oceanside Harbor, Oceanside (Camp Pendleton), California,89th Congress, 1st Session, U.S. Government Printing Office, Washington, DC.
Inman, D.L. and S.A. Jenkins, 1983, Oceanographic Report for Oceanside Beach Facilities. LaJolla, CA, prepared for the City of Oceanside, CA, 206 pp.
Inman, D.L., 1976, Man’s Impact on the California Coastal Zone.
Innes, Seamus and Jose Borrero, David Skelly, 2000, “Construction of and Monitoring theImpact of Pratte’s Reef, America’s First Artificial Surfing Reef,” American Geophysical UnionFall Meeting, 2000.
Jackson, Angus and Rodger Tomlinson, Kerry Black, Ed Couriel, 1997, “Proposed Surfing Reeffor the Northern Gold Coast,” 1st International Surfing Reef Symposium, Sydney, Australia.
Kuhn, G.G. and F.P. Shepard, 1984, Sea Cliffs, Beaches, and Coastal Valleys of San DiegoCounty: Some Amazing Histories and Some Horrifying Implications. University of CaliforniaPress, Berkeley and Los Angeles, CA.

6-4Moffatt & Nichol Engineers
Kuhn, Gerald, G. and P. Shepard, 1991, Sea Cliffs, Beaches and Coastal Valleys of San DiegoCounty: Same Amazing Histories and Some Horrifying Implications, University of CaliforniaPress, Berkeley, Los Angeles.
Leeds, Hill and Jewett Consulting Engineers, 1955, Shore Protection and Small-craft HarborDevelopment in the Oceanside- Camp Pendleton Area, California.
Leeds, Hill and Jewett, Consulting Engineers, 1949, Effects of Shore Erosion and AccretionAdjacent to Camp Pendleton Boat Harbor,. Prepared for U.S. Army Corps of Engineers.
Lin, Newman K., 1986, Research Report on the Performance of Prefabricated ErosionPrevention Reefs for Beach Erosion Control, Department of Ocean Engineering, Florida AtlanticUniversity.
Maloney, N. and K.M. Chan, 1974, A Summary of Knowledge of the Southern CaliforniaCoastal Zome and Offshore Areas, V. I, Report to the Bureau of Land Management, Dept. of theInterior, Washington, D.C.
Marine Advisers, 1961, A Statistical Survey of Ocean Wave Characteristics in SouthernCalifornia Coastal Zone and Offshore Areas, V. I, Report to the Bureau of Land Management,Dept. of the Interior, Washington, D.C.
Marine Advisors, 1960, Design Waves for Proposed Small Craft Harbor at Oceanside,California. Prepared for the U.S. Corps of Engineers, Los Angeles District, Los Angeles, CA.
Moffatt & Nichol Engineers, 1968, Shoaling Study Oceanside Small Craft Harbor., Prepared forOceanside Small Craft Harbor District, by Moffatt & Nichol Engineers, Long Beach, CA, 25 pp.,plus plates.
Moffatt & Nichol Engineers, 1981, Feasibility Study for an Artificial Surf Site at Oceanside, SanDiego County, California.
Moffatt & Nichol Engineers, 1983, Experimental Sand Bypass System at Oceanside Harbor,California-Phase 1 Report: Data Collection and Analysis.
Moffatt & Nichol Engineers, 1987, Experimental Sand Bypass System at Oceanside Harbor,Oceanside, California - Evaluation Guide.
Moffatt & Nichol Engineers, 1990, Sediment Budget Report Oceanside Littoral Cell. Coast ofCalifornia Storm and Tidal Waves Study, CCSTWS 90-2. Prepared for the U.S. Army EngineerDistrict Los Angeles, Los Angeles, CA, 110 p plus 12 appendices.

6-5Moffatt & Nichol Engineers
Moffatt & Nichol Engineers, 1993, Reconnaissance Report, Oceanside Shoreline, Oceanside,California, prepared for the U.S. Army Corps of Engineers, 73 pp., plus appendix.
Moffatt & Nichol Engineers, 1994, Draft Report Impacts of Oceanside Harbor on AdjacentBeaches. Unpublished report prepared for U.S. Army Engineer District Los Angeles, 61 pp.,plus appendix.
Moffatt & Nichol Engineers, 1998, Protection of Highway 101 Study Encinitas, California,prepared for the City of Encinitas, M&N File: 4243.
Moffatt & Nichol Engineers, 1999, San Diego Regional Beach Sand Project – Preliminary SandRetention Strategy Analysis, M&N File: 4305, for SANDAG.
Moffatt & Nichol Engineers, 1999, San Diego Regional Beach Sand Project – EconomicAnalysis of Sand Retention Structures, M&N File: 4305, for SANDAG.
Moffatt & Nichol, Engineers, 1968, Shoaling Study, Oceanside Small Craft Harbor., Preparedfor Oceanside Small Craft Harbor District, Oceanside California.
Moffatt & Nichol, Engineers, 1983, Experimental Sand Bypass System at Oceanside Harbor,California, Phase I Report: Data Collection and Analysis, Prepared for U.S. Army Corps ofEngineers, Los Angeles District.
Moffatt & Nichol, Engineers, 1987, San Diego Region Historic Wave and Sea Level DataReport, prepared for Los Angeles District, Corps of Engineers.
Moffatt & Nichol, Engineers, 1988, Coastal Design Information for Shore ProtectionImprovements at St. Malo, Oceanside, California.
Moffatt and Nichol Engineers, 1988, Sedimentation in Submarine Canyons in San Diego County,California, 1984-1987, Coast of California, Storm and Tidal Waves Study (CCSTWS), ReportNo. 88-2, US Army Engineer District, Los Angeles, 115 pp.
Nardon, T.R. and R. H. Osborne, D. J. Bottjer, R. C. Scheidemann Jr., 1981, "Holocene SeaLevel Curves for Santa Monica Shelf, California Continental Borderland", Science, V. 213, p.331-333.
National Oceanic and Atmospheric Administration, 1988, Sea Level Variations for the UnitedStates. 1855-1986,. U.S. Department of Commerce, National Ocean Service.
National Research Council, 1983, Changing Climate, Report of the Carbon Dioxide AssessmentCommittee, Board of Atmospheric Sciences and Climate, Commission on Physical Sciences,Mathematics, and Resources, National Academy Press, Washington, D.C.

6-6Moffatt & Nichol Engineers
Noble, R. M., 1983a, Letter Report Review of Proposed Groin Field Oceanside Beach, For theCity of Oceanside.
Noble, Ronald M., 1983b, Preliminary Engineering Report Beach Protection FacilitiesOceanside, California, for the City of Oceanside.
O'Hara, Susan Pritchard and Gregory Graves, 1991, Saving California's Coast, Army Engineersat Oceanside and Humbolt Bay.
Pacific Weather Analysis, 1983, Preparation of Extratropical Storm Wave Hindcasts, for Moffatt& Nichol, Engineers.
Pacific Weather Analysis, 1987, Preparation of Tropical Storm and Southern Hemisphere SwellHindcasts for Moffatt & Nichol, Engineers.
Pacific Weather Analysis, 1988, Storm Wave Hindcast Studies, for Moffatt and Nichol,Engineers.
Pattiaratchi, Charitha, Design Studies for an Artificial Surfing Reef: Cable Station, WesternAustralia, Centre for Water Research, Department of Environmental Engineering, TheUniversity of Western Australia.
Preliminary Report of January 1983 Coast Storm Damage, prepared for the California CoastalCommission, Feb. 14, 1983.
Public Mmeeting Report for Oceanside Reconnaissance Sstudy, June 9, 1993
R.M. Noble & Associates, 1983, Report Preliminary Engineering Study Beach and RiverProtective Devices for the City of Del Mar.
Robinson and Associates, Inc., 1988, Processes, Locations, and Rates of Coastal Cliff Erosionfrom 1887 to 1947, Dana Point to the Mexican Border, Coast of California Storm and TidalWaves Study (CCSTWS), Report No. 88-8, U.S. Army Engineer District, Los Angeles.
San Diego Association of Governments, 2000, San Diego Regional Beach Sand Project DraftEnvironmental Impact Report/Review Environmental Assessment.
Schwartzlose, R.A. and J.L. Reid, 1972, Nearshore Circulation in the California Current, Stateof California, Marine Res. Commission, California Coop. Oceanic Fisheries Investigation, CalCOFI Report No. 16, COE Ref # 410, p. 57-65.
Sea Surveyor, Inc., 1999, San Diego Regional Beach Sand Project, Offshore Sand Investigation,Prepared for SANDAG.

6-7Moffatt & Nichol Engineers
Secretary of the Army (The), 1956, Oceanside, Ocean Beach, Imperial Beach, and Coronado,San Diego County, Calif., Beach Erosion Control Study.
Seymour, Richard J., 1981, Evaluation of Sand Bypassing at Oceanside, CA, Unpublished paper,Prepared for U.S. Army Corps of Engineers.
Shaw, Martha J., 1980. S.I.O. Reference Series Artificial Sediment Transport and Structures inCoastal Southern California, University of California, Scripps Institution of Oceanography.
Simons, Li and Associates, 1988, River Sediment Discharge Study San Diego Region, Coast ofCalifornia Storm and Tidal Waves Study, CCSTWS 88-3. prepared for the U.S. Army EngineerDistrict Los Angeles, Los Angeles, CA, 38p plus an appendix.
Skelly, David, 1999, Draft Pratt’s Reef Monitoring Program, Dockweiler Beach Los Angeles,prepared for Surfrider Foundation.
Smith, O.P., 1986, Cost-Effective Optimization of Rubble-Mound Breakwater Cross Sections,Waterways Experiment Station, Corps of Engineers.
Tekmarine, Inc., 1988,. Sand Thickness Survey Report October-November 1987 San DiegoRegion. Coast of California Storm and Tidal Waves Study, CCSTWS 88-5. Prepared for theU.S. Army Engineer District Los Angeles, Los Angeles, CA, 21 p plus an appendix.
Tekmarine, Inc., 1987, Oceanside Littoral Cell Preliminary Sediment Budget Report. Coast ofCalifornia Storm and Tidal Waves Study, CCSTWS 87-4, Prepared for U.S. Army EngineerDistrict Los Angeles.
Tekmarine, Inc., 1987, San Diego Region Wind Transport and Wave Overwash Report, Coast ofCalifornia, Storm and Tidal Waves Study (CCSTWS). Report No. 87- 9, US Army EngineerDistrict, Los Angeles 36 pp. + Appendices.
Tekmarine, Inc., 1988, Sand Thickness Survey Report, October-November 1987, San DiegoRegion, Coast of California, Storm and Tidal Waves Study (CCSTWS), Report No. 88-5, USArmy Engineer District, Los Angeles, 21 pp.
U.S. Army Corps of Engineers, 1957, Oceanside, Ocean beach, Imperial Beach, and Coronado,San Diego County, California Beach Erosion Control Study, House Document No. 399.
U.S. Army Corps of Engineers, 1960, Beach Erosion Control Report on Cooperative Study ofSan Diego County, California, Appendix IV, Phase 2. , U.S. Army Engineer District LosAngeles, CA, Contract No. W-04 – 193 – Eng. 5196, (With Appendices).

6-8Moffatt & Nichol Engineers
U.S. Army Corps of Engineers, 1960, General Design of Shore Protection Works nearOceanside, California, U.S. Army Engineer District Los Angeles, CA.
U.S. Army Corps of Engineers, 1965, Interim Survey of Oceanside Harbor, Oceanside (CampPendleton), California, House Documents No.76.
U.S. Army Corps of Engineers, 1974, Position Paper on Beach Erosion Control Study -Oceanside Beach, California., U.S. Army Engineer District Los Angeles, CA.
U.S. Army Corps of Engineers, 1977, Progress Report on Beach Erosion Control Study, SanDiego County, California, in Vicinity of Oceanside, plus plates.
U.S. Army Corps of Engineers, 1980, San Diego County, Vicinity of Oceanside, California,Survey Report for Beach Erosion Control. Main Report, Environmental Impact Statement, andAppendices, U.S. Army Engineer District Los Angeles, CA.
U.S. Army Corps of Engineers, 1981, Coastal Engineering Technical Note, Groins - TheirApplications and Limitations, Coastal Engineering Research Center.
U.S. Army Corps of Engineers, 1981, Oceanside Beach Nourishment Letter Report. ShoreProtection Improvement Oceanside, California, U.S. Army Engineer District Los Angeles, CA,August 1981, 25 pp., plus enclosures.
U.S. Army Corps of Engineers, 1982, Report on a Program for Installing, Monitoring, andEvaluating the Effectiveness of a Sand Bypass System as a Means of Maintenance of the HarborChannels. Oceanside Harbor, Oceanside, California, U.S. Army Engineer District LosAngeles, CA.
U.S. Army Corps of Engineers, 1984, Geomorphology Framework Report, Dana Point to theMexican Border, Coast of California, Storm and Tidal Waves Study, CCSTWS 84-4, U.S.Army Engineer District Los Angeles, CA.
U.S. Army Corps of Engineers, 1984, Shore Protection Manual, 4th Ed., Volumes I and II, USArmy Engineer Waterways Experiment Station, Government Printing Office, Washington, DC.
U.S. Army Corps of Engineers, 1985, Littoral Zone Sediments, San Diego Region, October 1983– June 1984, Coast of California Storm and Tidal Waves Study, CCSTWS 85-11.
U.S. Army Corps of Engineers, 1987, Coast of California, Storm and Tidal Waves Study, SilverStrand Littoral Cell Preliminary Sediment Budget Report, CCSTWS 87-3, December.

6-9Moffatt & Nichol Engineers
U.S. Army Corps of Engineers, 1987, Shoreline Movement Investigations Report, PortuguesePoint to Mexican Border (1852 – 1982), Coast of California Storm and Tidal Waves Study,CCSTWS 87-10.
U.S. Army Corps of Engineers, 1988, Coast of California, Storm and Tidal Waves Study,Sediment Budget Report, Mission Bay Littoral Cell,. CCSTWS 88-7.
U.S. Army Corps of Engineers, 1989, Feasibility Report, Storm Damage Reduction andNavigation Improvements, Oceanside Harbor, San Diego County, CA, Final Report, MainReport and Environmental Assessment, U.S. Army Engineer District Los Angeles, CA.
U.S. Army Corps of Engineers, 1990, Coast of California, Storm and Tidal Waves Study,Sediment Budget Report Oceanside Littoral Cell, CCSTWS 90-2.
U.S. Army Corps of Engineers, 1991, State of the Coast Report San Diego Region, Coast ofCalifornia Storm and Tidal Waves Study, U.S. Army Engineer District Los Angeles, CA,Volume I – Main Report, Final .
U.S. Army Corps of Engineers, 1992, Oceanside Harbor San Diego County, CA, Storm DamageReduction and Navigation Improvements Design Memorandum. U.S. Army Engineer DistrictLos Angeles, CA.
U.S. Army Corps of Engineers, 1993, Beach Nourishment Sources along theCarlsbad/Oceanside Coast, San Diego County, California. U.S. Army Engineer District LosAngeles, CA, Final Report.
U.S. Army Corps of Engineers, 1994, Reconnaissance Report, Oceanside Shoreline, OceansideSan Diego County, California, Main Report.
U.S. Army Corps of Engineers, 1994, Reconnaissance Report, Oceanside Shoreline, Oceanside,San Diego County, California, Coastal Engineering Appendix, U.S. Army Engineer District LosAngeles, CA.
U.S. Army Corps of Engineers, 1996, Encinitas Shoreline, Main Report, EnvironmentalEvaluation, Appendix A. Pertinent Correspondence, Appendix B, Economics, Appendix C,Coastal Engineering, Appendix D, Geotechnical, and Appendix E, Design and Cost Estimates.
U.S. Army Corps of Engineers, 2000, San Diego County Shoreline Technical Report, LosAngeles District, Los Angeles, CA.
U.S. Department of the Navy, 1997, Environmental Assessment for Beach Replenishment atSouth Oceanside and Cardiff/Solana Beach, California.

6-10Moffatt & Nichol Engineers
Walker, J.R., C. Enson, T. Kashuba, 1987, "A Small Bypass System for Oceanside, California,"Coastal Zone '87, Seattle, Washington.
Walker, James R., and Emy E. Tatami, 1989, Perched Beaches and Submerged Breakwaters.
"Wave Overtopping at St. Malo Seawall," Journal of the American Shore & Beach PreservationAssociation, July 1989.

REGIONAL BEACH SANDRETENTION STRATEGY
APPENDICES
Prepared for:
SANDAG401 B Street
San Diego, California 92101
Prepared by:
MOFFATT & NICHOL ENGINEERS250 West Wardlow Road
Long Beach, California 90807
In Association with:
EVERTS COASTAL1250 Grand Avenue, #334
Arroyo Grande, California 93420
and
MEC ANALYTICAL SYSTEMS2433 Impala Drive
Carlsbad, California 92008
October, 2001
M&N File: 4758

CONTENTS
Appendix 1 Economic AnalysisAppendix 2 Longshore Sediment Transport in the RegionAppendix 3 Performance Assessment of Existing Structures in the RegionAppendix 4 Performance Assessment of Representative Retention Structures

APPENDIX 1
ECONOMIC ANALYSIS

1
Table 1 Breakwater Without Nourishment Cost
ITEM NO. DESCRIPTION QUANTITY UNIT UNIT PRICE AMOUNT
BREAKWATER CONSTRUCTION COST1 MOB., DEMOB. & PREP. WORK 1 LS $300,000 $300,0002 ARMOR STONE 54,000 TON $55 $2,970,0003 UNDERLAYER 39,000 TON $43 $1,677,0007 SUBTOTAL $4,947,0007 CONTINGENCY 15% $742,0508 SUBTOTAL $5,689,0509 ENGINEERING, DESIGN, PERMITTING 8% $455,124
10 CONSTRUCTION ENG. & MGMT. 10% $568,90511 BREAKWATER CONSTRUCTION COST $6,713,079
BREAKWATER MAINTENANCE12 MAINTENANCE @ YEAR 25 (PRESENT CONST. RATES) 20% $1,342,61613 FUTURE MAINTENANCE COST WITH INFLATION = Cost*(1+e*n) $2,114,620
14 PRESENT WORTH OF MAINTENANCE = Future*(1+i)-n $378,409
PRE-FILL SALIENT15 SAND MOB & DEMOB 1 LS $2,000,000 $2,000,00016 BEACH SAND PRE FILL 1,240,000 CY $7 $8,680,00017 SUBTOTAL $10,680,00018 CONTINGENCY 15% $1,602,00019 SUBTOTAL $12,282,00020 ENGINEERING, DESIGN, PERMITTING 8% $982,56021 CONSTRUCTION ENG. & MGMT. 10% $1,228,20022 SAND PRE-FILL COST $14,492,760
23 SURFING REEF MITIGATION 1 LS $4,000,000 $4,000,000
24 TOTAL PRESENT COST = CONST+MAINT+PRE-FILL+REEF $25,584,24825 ROUNDED $25,600,00026 SALIENT AREA 750,000 SF27 BEACH COST PER SF $3428 ROUNDED $30

2
Table 2 Nourished Breakwater Cost
ITEM NO. DESCRIPTION QUANTITY UNIT UNIT PRICE AMOUNT
BREAKWATER CONSTRUCTION 1 MOB., DEMOB. & PREP. WORK 1 LS $300,000 $300,0002 ARMOR STONE 54,000 TON $55 $2,970,0003 UNDERLAYER 39,000 TON $43 $1,677,0004 SUBTOTAL $4,947,0005 CONTINGENCY 15% $742,0506 SUBTOTAL $5,689,0507 ENGINEERING, DESIGN, PERMITTING 8% $455,1248 CONSTRUCTION ENG. & MGMT. 10% $568,9059 BREAKWATER CONSTRUCTION COST $6,713,079
BREAKWATER MAINTENANCE10 MAINTENANCE @ YEAR 25 (PRESENT CONST. RATES) 20% $1,342,61611 FUTURE MAINTENANCE COST WITH INFLATION = Cost*(1+e*n) $2,114,620
12 PRESENT WORTH OF MAINTENANCE = Future*(1+i)-n $378,409
BEACH SAND PRE FILL13 SAND MOB & DEMOB 1 LS $2,000,000 $2,000,00014 BEACH SAND PRE FILL 1,240,000 CY $7 $8,680,00015 SUBTOTAL $10,680,00016 CONTINGENCY 15% $1,602,00017 SUBTOTAL $12,282,00018 ENGINEERING, DESIGN, PERMITTING 8% $982,56019 CONSTRUCTION ENG. & MGMT. 10% $1,228,20020 SAND PRE-FILL COST $14,492,760
BEACH RE-NOURISHMENT21 SAND MOB & DEMOB 1 LS $0 $022 REEF NOURISH (50% ORIGINAL QTY.) 620,000 CY $7 $4,340,00023 CONTINGENCY 15% $651,00024 SUBTOTAL $4,991,00025 ENGINEERING, DESIGN, PERMITTING 8% $399,28026 CONSTRUCTION ENG. & MGMT. 10% $499,10027 ONE BEACH NOURISHMENT $5,889,380
PROJECT YEAR
FUTURE INFLATED
COST6
PRESENT
WORTH8
10 $7,243,937 $3,639,70620 $8,598,495 $2,170,73030 $9,953,052 $1,262,50040 $11,307,610 $720,672
28 TOTAL RE-NOURISH PRESENT COST $7,793,607
29 SURFING REEF MITIGATION 1 LS $4,000,000 $4,000,000
30 TOTAL PRESENT COST = CONST+MAINT+PRE-FILL+NOURISH+REEF $33,377,85531 ROUNDED $33,400,00032 SALIENT AREA 750,000 SF33 BEACH COST PER SF $4534 ROUNDED $40

3
Table 3 Reef Without Nourishment Cost
ITEM NO. DESCRIPTION QUANTITY UNIT UNIT PRICE AMOUNT1 MOB., DEMOB. & PREP. WORK 1 LS $300,000 $300,0002 ARMOR STONE 82,000 TON $55 $4,510,0003 UNDERLAYER 13,000 TON $43 $559,0004 SUBTOTAL $5,369,0005 CONTINGENCY 15% $805,3506 SUBTOTAL $6,174,3507 ENGINEERING, DESIGN, PERMITTING 8% $493,9488 CONSTRUCTION ENG. & MGMT. 10% $617,4359 REEF CONSTRUCTION COST $7,285,733
10 MAINTENANCE @ YEAR 25 (PRESENT CONST. RATES) 20% $1,457,14711 FUTURE MAINTENANCE COST WITH INFLATION = Cost*(1+e*n) $2,295,006
12 PRESENT WORTH OF MAINTENANCE = Future*(1+i)-n $410,689
13 SAND MOB & DEMOB 1 LS $500,000 $500,00014 BEACH SAND PRE FILL 59,400 CY $7 $415,80015 SUBTOTAL $915,80016 CONTINGENCY 15% $137,37017 SUBTOTAL $1,053,17018 ENGINEERING, DESIGN, PERMITTING 8% $84,25419 CONSTRUCTION ENG. & MGMT. 10% $105,31720 SAND PRE-FILL COST $1,242,741
21 TOTAL PRESENT COST = REEF CONST.+MAINT+PRE-FILL $8,939,16222 ROUNDED $8,900,00023 SALIENT AREA 87,000 SF24 BEACH COST PER SF $10325 ROUNDED $100

4
Table 4 Nourished Reef Cost
ITEM NO. DESCRIPTION QUANTITY UNIT UNIT PRICE AMOUNT
REEF CONSTRUCTION 1 MOB., DEMOB. & PREP. WORK 1 LS $300,000 $300,0002 ARMOR STONE 82,000 TON $55 $4,510,0003 UNDERLAYER 13,000 TON $43 $559,0006 SUBTOTAL $5,369,0007 CONTINGENCY 15% $805,3508 SUBTOTAL $6,174,3509 ENGINEERING, DESIGN, PERMITTING 8% $493,948
10 CONSTRUCTION ENG. & MGMT. 10% $617,43511 REEF CONSTRUCTION COST $7,285,733
REEF MAINTENANCE12 MAINTENANCE @ YEAR 25 (PRESENT CONST. RATES) 20% $1,457,14713 FUTURE MAINTENANCE COST WITH INFLATION = Cost*(1+e*n) $2,295,006
14 PRESENT WORTH OF MAINTENANCE = Future*(1+i)-n $410,689
BEACH SAND PRE FILL4 SAND MOB & DEMOB 1 LS $500,000 $500,0005 BEACH SAND PRE FILL 59,400 CY $7 $415,8006 SUBTOTAL $915,8007 CONTINGENCY 15% $137,3708 SUBTOTAL $1,053,1709 ENGINEERING, DESIGN, PERMITTING 8% $84,254
10 CONSTRUCTION ENG. & MGMT. 10% $105,31711 SAND PRE-FILL COST $1,242,741
NOURISHMENT15 SAND MOB & DEMOB 1 LS $0 $016 REEF NOURISH (50% ORIGINAL QTY.) 29,700 CY $7 $207,90017 CONTINGENCY 15% $31,18518 SUBTOTAL $239,08519 ENGINEERING, DESIGN, PERMITTING 8% $19,12720 CONSTRUCTION ENG. & MGMT. 10% $23,90921 ONE BEACH NOURISHMENT $282,120
PROJECT YEAR
FUTURE INFLATED
COST6
PRESENT
WORTH8
10 $347,008 $174,35420 $411,896 $103,98530 $476,783 $60,47840 $541,671 $34,522
22 TOTAL NOURISH PRESENT COST $373,339
23 TOTAL PRESENT COST = REEF CONST. + MAINT+PRE-FILL+NOURISH $9,312,50124 ROUNDED $9,300,00025 SALIENT AREA 87,000 SF26 BEACH COST PER SF $10727 ROUNDED $110

5
Table 5 Groin Field Without Nourishment Cost
ITEM NO. DESCRIPTION QUANTITY UNIT UNIT PRICE AMOUNT
BREAKWATER CONSTRUCTION 1 MOB., DEMOB. & PREP. WORK 1 LS $300,000 $300,0002 ARMOR STONE 35,700 TON $55 $1,963,5004 QUARRY RUN CORE & BEDDING 12,800 TON $43 $550,4005 SUBTOTAL $2,813,9006 CONTINGENCY 15% $422,0857 SUBTOTAL $3,235,9858 ENGINEERING, DESIGN, PERMITTING 8% $258,8799 CONSTRUCTION ENG. & MGMT. 10% $323,599
10 CONST. COST $3,818,462
STRUCTURE MAINTENANCE11 MAINTENANCE @ YEAR 25 (PRESENT CONST. RATES) 20% $763,69212 FUTURE MAINTENANCE COST WITH INFLATION = Cost*(1+e*n) $1,202,816
13 PRESENT WORTH OF MAINTENANCE = Future*(1+i)-n $215,243
BEACH SAND PRE FILL14 SAND MOB & DEMOB 1 LS $2,000,000 $2,000,00015 BEACH SAND PRE FILL 680,000 CY $7 $4,760,00016 SUBTOTAL $6,760,00017 CONTINGENCY 15% $1,014,00018 SUBTOTAL $7,774,00019 ENGINEERING, DESIGN, PERMITTING 8% $621,92020 CONSTRUCTION ENG. & MGMT. 10% $777,40021 SAND PRE-FILL COST $9,173,320
INCREASE TO BYPASSING22 ADDL. PIPE MOB/DEMOB (ASSUMED) 1 LS $100,000 $100,00023 ADDL. BOOSTER PUMP 164,000 CY $0.75 $123,00024 CONTINGENCY 15% $18,45025 SUBTOTAL $141,45026 ENGINEERING, DESIGN, PERMITTING 8% $11,31627 CONSTRUCTION ENG. & MGMT. 10% $14,14528 ONE INCREASE TO BYPASSING $166,91129 PRESENT WORTH OF ANNUAL BYPASSING (SEE NOTES) 17.77 $2,966,008
30 TOTAL PRESENT COST = CONST+MAINT+PRE-FILL+BYPASS $16,173,03331 ROUNDED $16,200,00032 SALIENT AREA 750,000 SF33 BEACH COST PER SF $2234 ROUNDED $20

6
Table 6 Nourished Groin Field
ITEM NO. DESCRIPTION QUANTITY UNIT UNIT PRICE AMOUNT
BREAKWATER CONSTRUCTION 1 MOB., DEMOB. & PREP. WORK 1 LS $300,000 $300,0002 ARMOR STONE 35,700 TON $55 $1,963,5004 QUARRY RUN CORE & BEDDING 12,800 TON $43 $550,4005 SUBTOTAL $2,813,9006 CONTINGENCY 15% $422,0857 SUBTOTAL $3,235,9858 ENGINEERING, DESIGN, PERMITTING 8% $258,8799 CONSTRUCTION ENG. & MGMT. 10% $323,59910 CONST. COST $3,818,462
STRUCTURE MAINTENANCE11 MAINTENANCE @ YEAR 25 (PRESENT CONST. RATES) 20% $763,69212 FUTURE MAINTENANCE COST WITH INFLATION = Cost*(1+e*n) $1,202,816
13 PRESENT WORTH OF MAINTENANCE = Future*(1+i)-n
$215,243
BEACH SAND PRE FILL14 SAND MOB & DEMOB 1 LS $2,000,000 $2,000,00015 BEACH SAND PRE FILL 680,000 CY $7 $4,760,00016 SUBTOTAL $6,760,00017 CONTINGENCY 15% $1,014,00018 SUBTOTAL $7,774,00019 ENGINEERING, DESIGN, PERMITTING 8% $621,92020 CONSTRUCTION ENG. & MGMT. 10% $777,40021 SAND PRE-FILL COST $9,173,320
INCREASE TO BYPASSING22 ADDL. PIPE MOB/DEMOB (ASSUMED) 1 LS $100,000 $100,00023 ADDL. BOOSTER PUMP 164,000 CY $0.75 $123,00024 CONTINGENCY 15% $18,45025 SUBTOTAL $141,45026 ENGINEERING, DESIGN, PERMITTING 8% $11,31627 CONSTRUCTION ENG. & MGMT. 10% $14,14528 ONE INCREASE TO BYPASSING $166,91129 PRESENT WORTH OF ANNUAL BYPASSING (SEE NOTES) 17.77 $2,966,008
BEACH RE-NOURISHMENT30 SAND MOB & DEMOB 1 LS $0 $031 REEF NOURISH (50% ORIGINAL QTY.) 340,000 CY $7 $2,380,00032 CONTINGENCY 15% $357,00033 SUBTOTAL $2,737,00034 ENGINEERING, DESIGN, PERMITTING 8% $218,96035 CONSTRUCTION ENG. & MGMT. 10% $273,70036 ONE BEACH NOURISHMENT $3,229,660
PROJECT YEAR
FUTURE INFLATED
COST6
PRESENT
WORTH7
10 $3,972,482 $1,995,96820 $4,715,304 $1,190,40030 $5,458,125 $692,33840 $6,200,947 $395,207
37 TOTAL RE-NOURISH PRESENT COST $4,273,914
38 TOTAL PRESENT COST = CONST+MAINT+PRE-FILL+BYPASS+RE-NOURISH $20,446,94739 ROUNDED $20,400,00040 SALIENT AREA 750,000 SF41 BEACH COST PER SF $2742 ROUNDED $30

7
Table 7 Nourishment Alone for Breakwater Salient Area at Oceanside, Encinitas or SolanaBeach
ITEM NO. DESCRIPTION QUANTITY UNIT UNIT PRICE AMOUNT
INITIAL FILL1 MOB & DEMOB 1 LS $0 $0
2 BEACH FILL 1,240,000 CY $7 $8,680,000
3 SUBTOTAL $8,680,0004 CONTINGENCY 15% $1,302,0005 SUBTOTAL $9,982,0006 ENGINEERING, DESIGN, PERMITTING 8% $798,5607 CONSTRUCTION ENG. & MGMT. 10% $998,2008 INITIAL FILL $11,778,760
NOURISHMENT9 MOB & DEMOB 1 LS $200,000 $200,000
10 BEACH FILL 1,125,000 CY $7 $7,875,00011 SUBTOTAL $8,075,00012 CONTINGENCY 15% $1,211,25013 SUBTOTAL $9,286,25014 ENGINEERING, DESIGN, PERMITTING 8% $742,90015 CONSTRUCTION ENG. & MGMT. 10% $928,62516 ONE BEACH NOURISHMENT $10,957,775
Project Year
FUTUREINFLATED
COST9PRESENT
WORTH10
0 $10,957,775 $10,957,7755 $12,217,919 $8,660,50210 $13,478,063 $6,772,03415 $14,738,207 $5,249,06720 $15,998,352 $4,038,85825 $17,258,496 $3,088,38930 $18,518,640 $2,349,00635 $19,778,784 $1,778,36340 $21,038,928 $1,340,88145 $22,299,072 $1,007,394
17 TOTAL MAINTENANCE PRESENT COST $45,242,268
18 TOTAL PRESENT COST= INITIAL FILL + $57,021,02819 ROUNDED $57,000,00020 SALIENT AREA 750,000 SF21 BEACH COST PER SF $7622 ROUNDED $80

8
Table 8 Nourishment Alone for Reef Salient Area at Oceanside, Encinitas or Solana Beach
ITEM NO. DESCRIPTION QUANTITY UNIT UNIT PRICE AMOUNT
INITIAL FILL
1 MOB & DEMOB2 1 LS $0 $02 SINGLE BEACH FILL 143,550 CY $7 $1,004,8503 SUBTOTAL $1,004,8504 CONTINGENCY 15% $150,7285 SUBTOTAL $1,155,5786 ENGINEERING, DESIGN, PERMITTING 8% $92,4467 CONSTRUCTION ENG. & MGMT. 10% $115,5588 ONE BEACH NOURISHMENT $1,363,581
NOURISH
9 MOB & DEMOB2 1 LS $0 $010 SINGLE BEACH FILL 483,750 CY $7 $3,386,25011 SUBTOTAL $3,386,25012 CONTINGENCY 15% $507,93813 SUBTOTAL $3,894,18814 ENGINEERING, DESIGN, PERMITTING 8% $311,53515 CONSTRUCTION ENG. & MGMT. 10% $389,41916 ONE BEACH NOURISHMENT $4,595,141
Project Year
FUTURE INFLATED
COST6
PRESENT
WORTH8
0 $4,595,141 $4,595,1415 $5,123,582 $3,631,78010 $5,652,024 $2,839,85115 $6,180,465 $2,201,19620 $6,708,906 $1,693,69425 $7,237,347 $1,295,11630 $7,765,789 $985,05535 $8,294,230 $745,75640 $8,822,671 $562,29845 $9,351,112 $422,450
17 TOTAL NOURISH PRESENT COST $18,972,338
18 TOTAL PRESENT COST =INITIAL FILL + NOURISHMENT $20,335,92019 ROUNDED $20,300,00020 SALIENT AREA 87,000 SF21 BEACH COST PER SF $23422 ROUNDED $230

9
Table 9 Nourishment Alone for Breakwater Salient Area at South Carlsbad or TorreyPines
ITEM NO. DESCRIPTION QUANTITY UNIT UNIT PRICE AMOUNT
INITIAL FILL1 MOB & DEMOB 1 LS $0 $0
2 BEACH FILL 1,240,000 CY $7 $8,680,000
3 SUBTOTAL $8,680,0004 CONTINGENCY 15% $1,302,0005 SUBTOTAL $9,982,0006 ENGINEERING, DESIGN, PERMITTING 8% $798,5607 CONSTRUCTION ENG. & MGMT. 10% $998,2008 INITIAL FILL $11,778,760
NOURISHMENT9 MOB & DEMOB 1 LS $0 $0
10 BEACH FILL 270,000 CY $7 $1,890,00011 SUBTOTAL $1,890,00012 CONTINGENCY 15% $283,50013 SUBTOTAL $2,173,50014 ENGINEERING, DESIGN, PERMITTING 8% $173,88015 CONSTRUCTION ENG. & MGMT. 10% $217,35016 ONE BEACH NOURISHMENT $2,564,730
Project Year
FUTURE INFLATED
COST9
PRESENT
WORTH10
0 $2,564,730 $2,564,7305 $2,859,674 $2,027,04010 $3,154,618 $1,585,03315 $3,449,562 $1,228,57420 $3,744,506 $945,31825 $4,039,450 $722,85530 $4,334,394 $549,79835 $4,629,338 $416,23640 $4,924,282 $313,84145 $5,219,226 $235,786
17 TOTAL NOURISHMENT PRESENT COST $10,589,212
18 INITIAL FILL + MAINTENANCE $22,367,97219 ROUNDED $22,400,00020 SALIENT AREA 750,000 SF21 BEACH COST PER SF $3022 ROUNDED $30

10
Table 10 Nourishment Alone for Reef Salient Area at South Carlsbad or Torrey Pines
ITEM NO. DESCRIPTION QUANTITY UNIT UNIT PRICE AMOUNT
INITIAL FILL1 MOB & DEMOB 1 LS $0 $02 BEACH FILL 143,550 CY $7 $1,004,8503 SUBTOTAL $1,004,8504 CONTINGENCY 15% $150,7285 SUBTOTAL $1,155,5786 ENGINEERING, DESIGN, PERMITTING 8% $92,4467 CONSTRUCTION ENG. & MGMT. 10% $115,5588 INITIAL BEACH FILL COST. $1,363,581
NOURISH
9 MOB & DEMOB2 1 LS $0 $010 BEACH FILL 116,100 CY $7 $812,70011 SUBTOTAL $812,70012 CONTINGENCY 15% $121,90513 SUBTOTAL $934,60514 ENGINEERING, DESIGN, PERMITTING 8% $74,76815 CONSTRUCTION ENG. & MGMT. 10% $93,46116 ONE BEACH NOURISHMENT $1,102,834
Project Year
FUTURE INFLATED
COST9
PRESENT
WORTH10
0 $1,102,834 $1,102,8345 $1,229,660 $871,62710 $1,356,486 $681,56415 $1,483,312 $528,28720 $1,610,137 $406,48725 $1,736,963 $310,82830 $1,863,789 $236,41335 $1,990,615 $178,98140 $2,117,441 $134,95245 $2,244,267 $101,388
17 TOTAL MAINTENANCE PRESENT COST $4,553,361
18 INITIAL FILL + MAINTENANCE $5,916,94319 ROUNDED $5,900,00020 SALIENT AREA 87,000 SF21 BEACH COST PER SF $6822 ROUNDED $70

11
Table 11 Nourishment Alone for Breakwater Salient Area at Imperial Beach or Coronado
ITEM NO. DESCRIPTION QUANTITY UNIT UNIT PRICE AMOUNT
INITIAL FILL1 MOB & DEMOB 1 LS $0 $0
2 BEACH FILL 1,240,000 CY $7 $8,680,000
3 SUBTOTAL $8,680,0004 CONTINGENCY 15% $1,302,0005 SUBTOTAL $9,982,0006 ENGINEERING, DESIGN, PERMITTING 8% $798,5607 CONSTRUCTION ENG. & MGMT. 10% $998,2008 INITIAL FILL $11,778,760
NOURISHMENT
9 MOB & DEMOB2 1 LS $0 $010 BEACH FILL 375,000 CY $7 $2,625,00011 SUBTOTAL $2,625,00012 CONTINGENCY 15% $393,75013 SUBTOTAL $3,018,75014 ENGINEERING, DESIGN, PERMITTING 8% $241,50015 CONSTRUCTION ENG. & MGMT. 10% $301,87516 ONE BEACH NOURISHMENT $3,562,125
Project Year
FUTURE INFLATED
COST9
PRESENT
WORTH10
0 $3,562,125 $3,562,1255 $3,971,769 $2,815,33410 $4,381,414 $2,201,43515 $4,791,058 $1,706,35320 $5,200,703 $1,312,94125 $5,610,347 $1,003,96630 $6,019,991 $763,60935 $6,429,636 $578,10640 $6,839,280 $435,89045 $7,248,924 $327,481
17 TOTAL NOURISHMENT PRESENT COST $14,707,239
18 INITIAL FILL + NOURISHMENT $26,485,99919 ROUNDED $26,500,00020 SALIENT AREA 750,000 SF21 BEACH COST PER SF $3522 ROUNDED $40

12
Table 12 Nourishment Alone for Reef Salient Area at Imperial Beach or Coronado
ITEM NO. DESCRIPTION QUANTITY UNIT UNIT PRICE AMOUNT
INITIAL FILL1 MOB & DEMOB 1 LS $0 $02 BEACH FILL 143,550 CY $7 $1,004,8503 SUBTOTAL $1,004,8504 CONTINGENCY 15% $150,7285 SUBTOTAL $1,155,5786 ENGINEERING, DESIGN, PERMITTING 8% $92,4467 CONSTRUCTION ENG. & MGMT. 10% $115,5588 INITIAL BEACH FILL COST. $1,363,581
NOURISHMENT
9 MOB & DEMOB2 1 LS $0 $010 BEACH FILL 161,250 CY $7 $1,128,75011 SUBTOTAL $1,128,75012 CONTINGENCY 15% $169,31313 SUBTOTAL $1,298,06314 ENGINEERING, DESIGN, PERMITTING 8% $103,84515 CONSTRUCTION ENG. & MGMT. 10% $129,80616 ONE BEACH NOURISHMENT $1,531,714
Project Year
FUTURE INFLATED
COST9
PRESENT
WORTH10
0 $1,531,714 $1,531,7145 $1,707,861 $1,210,59310 $1,884,008 $946,61715 $2,060,155 $733,73220 $2,236,302 $564,56525 $2,412,449 $431,70530 $2,588,596 $328,35235 $2,764,743 $248,58540 $2,940,890 $187,43345 $3,117,037 $140,817
17 TOTAL MAINTENANCE PRESENT COST $6,324,113
18 INITIAL FILL + MAINTENANCE $7,687,69419 ROUNDED $7,700,00020 SALIENT AREA 87,000 SF21 BEACH COST PER SF $8822 ROUNDED $90

13
Table 13 Standard Assumptions Used in All Cost Analyses
1 Sand mob & demob and unit costs based on 2001 SANDAG bid summaries, 2nd lowest estimate.2 Armor stone & quarry run unit costs from SANDAG 4305 2/25/99.3 Annual Interest Rate: i= 7.13%4 Annual Rate of inflation (ENR 1977 to 2050): e = 2.30%5 Project Life (years) = n: n= 506 Future Cost = Present Cost * (1+e*n). Amount paid for the same work n years in the future.
7 Present Worth = Future Cost/(1+i)n. Amount placed in a bank account today.8 For nourishment alone, mob & demob are part of a larger project.9 Oceanside Harbor bypassing rate from USACE, San Diego County Shoreline Technical Report, 5/5/00.
10 Bypassing unit costs from communication with A. Alcorn 9/3/01 and A. Shak 9/21/01.11 Bypassing present worth of annual amount + uniform gradient = $Value ((P/A,i,n)+e(P/G,i,n))
=$Value(13.8007+.023(172.9051)) = $Value*17.77 17.77

APPENDIX 2
LONGSHORE SEDIMENT TRANSPORT IN THE REGION

1
This appendix contains a description of longshore sediment transport processes in the SANDAGregion and accompanies the Regional Beach Sand Retention Strategy. It begins with adescription of sediment tranport in the Oceanside littoral cell followed by the Silver Strandlittoral cell.
OCEANSIDE
The Oceanside Littoral Cell refers to the natural, unimpeded longshore sediment transportsystem that, before construction began on the Camp Pendleton-Oceanside Harbor complex,extended from Dana Point to Point La Jolla, an alongshore distance of 51 miles. Dana Point andPoint La Jolla are large natural sediment-blocking structures that almost completely impede thealongshore movement of sand around them. With the construction of the north jetty at CampPendleton Harbor in 1941, the littoral cell was effectively cut in two. And, at least sinceOceanside Harbor was constructed in 1963 all sediment that passed the harbor entrance wasartificially bypassed to the south. Hereafter the Camp Pendleton-Oceanside Harbor complex isreferred to as Oceanside Harbor. For purposes of this stuyd, problem beaches in the OceansideLittoral Cell lie between the harbor and Point La Jolla.
When adequate recreational beach is not present, and when property adjacent to the beach isbeing eroded, the cause of the problem is always a beach that is too narrow. It may have beennarrow and the seacliffs may have been retreating before the hinterland behind it was developed,which is the case with much of the Oceanside Cell. It may also be narrow because developmentoccurred on the beach, which is the case at north Oceanside and south of the San Dieguito Riverin Del Mar. Alternately it may be too narrow because the sediment budget was negative at thetime of the development or the budget became negative after development.
A sediment budget reflects the difference between the amount of sand that enters a littoralsystem and the amount that is lost. Sediment enters the littoral system south of Oceanside Harborby artificial bypassing from north to south at the harbor, from rivers, from eroding seacliffs, dueto beaches that retreat into previously static geologic deposits, and by artificial contributionsfrom on-land, bay, lagoon, river channel, and presently offshore sources. Net onshore transportfrom the continental shelf has not been documented in the Oceanside Littoral Cell. Sedimenttransport into the Scripps and La Jolla Submarine Canyon complex at the south end of the celldrains sand from the system. Sand may also be carried in a net offshore direction, but that fluxhas not been quantified. Sand is transported naturally into Agua Hedionda Lagoon andartificially removed at about the rate it enters when averaged over an interval of years. Sandcarried into Batiquitos Lagoon since jetties were constructed at its entrance about five years agohas not yet been artificially recycled to the nearby beach, but that will happen as the lagoon fills.Over time intervals of decades or more the sediment budget must be in near dynamic equilibriumif a beach is to persist. Narrow beaches were common in the Oceanside Cell before developmentand the sediment budget in those days was probably in long-term balance. So the restoration ofthe pre-development river sediment discharge flux to the coast will not create beaches wider thanexisted in the pre-development days.
Despite all of the studies that have been conducted, the present understanding of the longshoresediment transport regime is weak in the Oceanside Littoral Cell. Even the net is not well

2
understood. Past investigations that took place before 1978 suggest a net rate near 200,000 cubicyards per year (cyy) to the south. Yet, CDIP data from directional wave gages and other sourcessince 1978 suggest it may be an order of magnitude less and in some years the net flux may evenbe to the north. Recent evidence suggests that the majority of sediment that is artificiallybypassed from the entrance to Oceanside Harbor returns north from whence it came. Much, butby no means all, of the evidence supports the conclusion the rate really has changed in the last20+ years. However, it does seem clear that the net rate today is in the 10,000-50,000 cyy rangeto the south with a much larger gross. The net to gross transport ratio is estimated to be in the0.05 to 0.2 range south of Oceanside Harbor. With this much uncertainty, it seems that sandretention in the lee of a structure, rather than retention upcoast of a structure, is the better bet.The net to gross transport ratio is not as important a factor in a wave blocking and diffraction ora refraction structure. In addition, unless a tombolo is retained, the impacts of the structures onneighboring beaches is usually less than with a sediment-blocking structure such as a groin.
The key element in the design of a beach retention structure is to develop a shoreline seaward ofits present position along which the sediment budget is in balance. In most cases of relativelyshort beaches this simply means a beach without a gradient in the net longshore sedimenttransport rate. The altered shoreline planform of an artificially widened beach is the reason sandis lost. As the beach tends toward its equilibrium with the natural supply, the positive netlongshore sediment transport gradient that is the cause of the loss is reduced.
SILVER STRAND
The 17-mi long Silver Strand Littoral Cell extends from Zuniga jetty at the North Island NavalAir Station to a rocky headland at the south end of Playas de Tijuana. The Playas de Tijuanaportion of the cell is a reach about 2.8 miles long south of the US-Mexico border. Sandy beachesare continuous the entire length of the cell. The shoreline configuration as viewed from above isthat of a double hook, controlled by four huge retention structures: (1) Point Loma, (2) ZunigaJetty, (3) the rocky Tijuana River delta, and (4) the rocky headland at the south end of Playas deTijuana. Humans constructed Zuniga jetty, but the other features are natural. Sand movementswithin the cell have been locally affected by three smaller artificial structures: the curvedbreakwater-groin at the Hotel del Coronado, and two groins of different length at ImperialBeach.
Accurate net longshore sediment transport rate estimates are required to predict the functionalbehavior of a structure and to forecast its impacts on downcoast beaches. The gross longshoretransport rate is also needed to develop a relationship between the size of the retained beach andthe size and other characteristics of the structure.
In the natural scheme of things the Tijuana River delivered sand to near the south end of the cellfrom whence it was moved mostly to the north. Large annual fluctuations in the river supplyvaried with rainfall in the watershed, but over long periods the discharge averaged out andbeaches were probably in a state of near-dynamic equilibrium (supply equaled loss). Humanintervention, however, overwhelmed this natural order of things after 1893 when constructionbegan on the Zuniga jetty. From 1887 to at least 1982, the cell has had a remarkably positivebudget of sediments north of Imperial Beach. As illustrated in Figure 1, the position of theshoreline advanced in a net seaward direction everywhere except in the problem reach south

3
from the Imperial Beach Pier to the Tijuana River mouth. Problem reaches and structuresdiscussed in this section are located on the figure.
-10000
0
10000
20000
30000
40000
50000
-30000 -20000 -10000 0 10000
east/west direction, ft
no
rth
/so
uth
dir
ecti
on
, ft
18871933196019721982
1 23
4
56
1 Zuniga Jetty 2 Hotel Breakwater 3 Coronado problem reach 4 groins 5 Imperial Beach problem reach 6 Tijuana river mouth
Figure 1 Shoreline changes in the Silver Strand Littoral Cell between 1887 and 1982between the Tijuana River and Zuniga jetty; predominant longshore sediment transport is
north; sediment naturally enters the littoral system at the river mouth.
A substantial redistribution of sediment at the north end of the cell followed the 1893-1904construction of Zuniga Jetty as shown in Figure 2. Over the 11-year construction period, the jettyfunctioned as a sediment-blocking structure with an increasing impact due to wave diffraction asits tip was extended 7000-feet beyond the 1887 shoreline. By 1933, the fillet had expanded about7000-feet to the south and about 1000-feet seaward along the jetty. Other evidence indicates thejetty-altered shoreline had reached an equilibrium state by about 1915, suggesting a capture rateof 150,000 to 200,000 cyy between 1893 and 1915. Since the structure was a near-completebarrier to the longshore movement of sand in this period, and artificial beach filling had yet tobegin, the capture rate is probably a good indication of the net north-directed longshore sedimenttransport rate in the North Island region during the first quarter of the 20th century. The netaccretion of sediment in the littoral cell in this period, about 175,000 to 200,000 cyy, is equal tothe estimated discharge rate for the Tijuana River before the watershed was severely affected byhuman incursions.

4
0
10000
20000
30000
40000
50000
60000
70000
-20002004006008001000
shoreline offset distance between surveys, ft
sh
ore
line
dis
tan
ce
no
rth
of
pre
se
nt
mo
uth
of
Tiju
an
a R
ive
r, f
t
baseline
1933-1887
1960-1933
1972-1960
1982-1972
1 Zuniga Jetty 2 Hotel Breakwater 3 Coronado problem reach 4 groins 5 Imperial Beach problem reach 6 Tijuana River mouth
1
6
5
4
3
2
Figure 2 Shoreline changes in the Silver Stand Littoral Cell by survey interval: 1887-1982.
By far the largest influence on shoreline behavior has been artificial beach enhancement,especially an unprecedented 26 million cubic yard (cy) beachfill in 1946. The impact of this filland a 2 million cy fill in 1941 is apparent in the huge advance of the shoreline between 1933 and1960 shown in Figure 2. All of the Silver Strand Cell north of the Imperial Beach groins waspositively affected. In the past 60 years artificial beachfill has resulted in more sand being addedto the littoral cell than was delivered by the river in the past 150 years. Table 1 is a list of thoseartificial contributions up to 1985. Of the 26 million cy dredged from San Diego Bay by the USNavy and placed on the beach in 1946, about 6 million cy of its finest component (silt and very-fine sand) was later carried seaward beyond the 30-feet isobath along the north end of the fillsite, leaving 20 million cy of fine sand remaining in the littoral zone. Sediment samples collectedbefore and after the 1941 and 1946 placements indicate a decrease in the median diameter due towave reworking from 0.32 mm in 1940, to 0.16 mm in 1967, and to 0.22 mm in 1985, in the fourmiles of coast nearest Zuniga jetty (USACE-LAD, 1987).
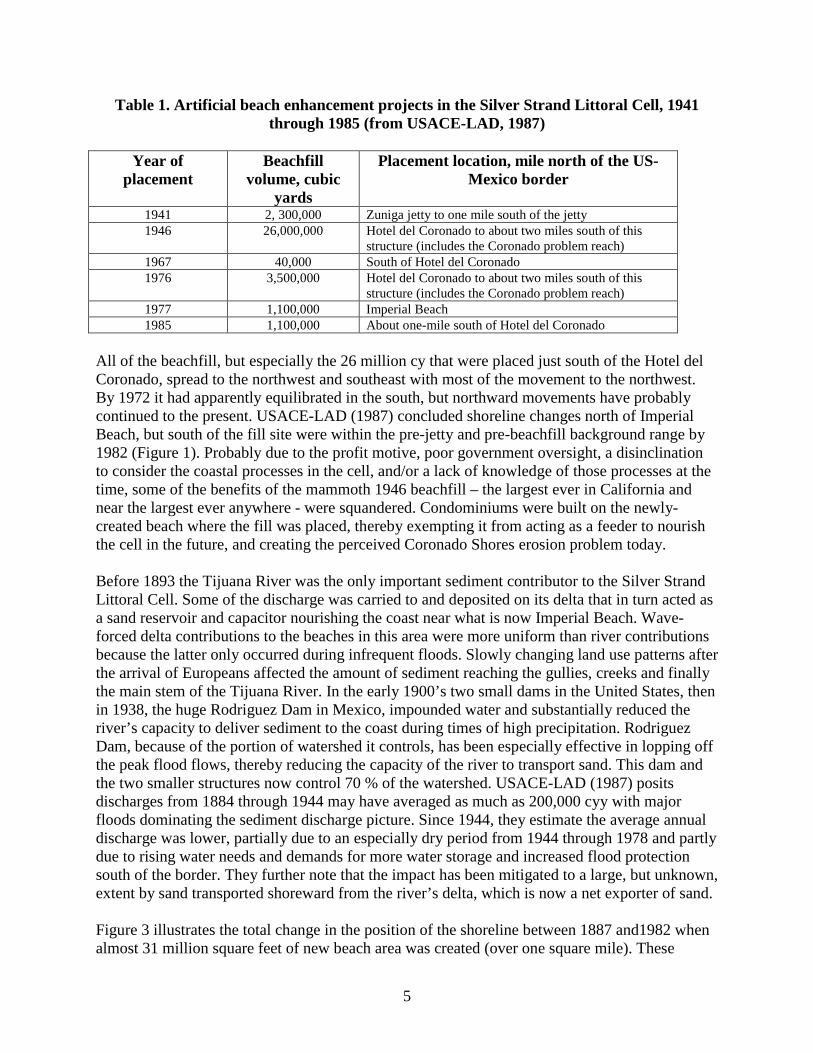
5
Table 1. Artificial beach enhancement projects in the Silver Strand Littoral Cell, 1941through 1985 (from USACE-LAD, 1987)
Year ofplacement
Beachfillvolume, cubic
yards
Placement location, mile north of the US-Mexico border
1941 2, 300,000 Zuniga jetty to one mile south of the jetty1946 26,000,000 Hotel del Coronado to about two miles south of this
structure (includes the Coronado problem reach)1967 40,000 South of Hotel del Coronado1976 3,500,000 Hotel del Coronado to about two miles south of this
structure (includes the Coronado problem reach)1977 1,100,000 Imperial Beach1985 1,100,000 About one-mile south of Hotel del Coronado
All of the beachfill, but especially the 26 million cy that were placed just south of the Hotel delCoronado, spread to the northwest and southeast with most of the movement to the northwest.By 1972 it had apparently equilibrated in the south, but northward movements have probablycontinued to the present. USACE-LAD (1987) concluded shoreline changes north of ImperialBeach, but south of the fill site were within the pre-jetty and pre-beachfill background range by1982 (Figure 1). Probably due to the profit motive, poor government oversight, a disinclinationto consider the coastal processes in the cell, and/or a lack of knowledge of those processes at thetime, some of the benefits of the mammoth 1946 beachfill – the largest ever in California andnear the largest ever anywhere - were squandered. Condominiums were built on the newly-created beach where the fill was placed, thereby exempting it from acting as a feeder to nourishthe cell in the future, and creating the perceived Coronado Shores erosion problem today.
Before 1893 the Tijuana River was the only important sediment contributor to the Silver StrandLittoral Cell. Some of the discharge was carried to and deposited on its delta that in turn acted asa sand reservoir and capacitor nourishing the coast near what is now Imperial Beach. Wave-forced delta contributions to the beaches in this area were more uniform than river contributionsbecause the latter only occurred during infrequent floods. Slowly changing land use patterns afterthe arrival of Europeans affected the amount of sediment reaching the gullies, creeks and finallythe main stem of the Tijuana River. In the early 1900’s two small dams in the United States, thenin 1938, the huge Rodriguez Dam in Mexico, impounded water and substantially reduced theriver’s capacity to deliver sediment to the coast during times of high precipitation. RodriguezDam, because of the portion of watershed it controls, has been especially effective in lopping offthe peak flood flows, thereby reducing the capacity of the river to transport sand. This dam andthe two smaller structures now control 70 % of the watershed. USACE-LAD (1987) positsdischarges from 1884 through 1944 may have averaged as much as 200,000 cyy with majorfloods dominating the sediment discharge picture. Since 1944, they estimate the average annualdischarge was lower, partially due to an especially dry period from 1944 through 1978 and partlydue to rising water needs and demands for more water storage and increased flood protectionsouth of the border. They further note that the impact has been mitigated to a large, but unknown,extent by sand transported shoreward from the river’s delta, which is now a net exporter of sand.
Figure 3 illustrates the total change in the position of the shoreline between 1887 and1982 whenalmost 31 million square feet of new beach area was created (over one square mile). These

6
changes are consistent with the USACE-LAD (1987) river discharge and net longshore sedimenttransport estimates when the beachfill placements in Table 1 are considered (along with theestimated 6 million cy that was so fine it was carried offshore and out of the littoral zone).Assuming the net artificial contribution was about 28 million cy and 1.3 cy of sand results in 1 sqfeet of new beach, the net change in sand in the cell from all sources was 40 million cy, or 12million cy more than was artificially placed. This volume translates to an average 125,000 cyythat must have come from the Tijuana River and its delta. Since after about 1960 some materialmoved offshore at Zuniga jetty, and the river contribution was reduced, it is not unreasonable toconclude about 175,000 cyy was carried into the cell between 1887 and 1938, or about 9 millioncy. For this near-natural condition, USACE-LAD estimated the net longshore transport rate fromthe river mouth north to the ebb-tidal delta of San Diego Bay (known now as Zuniga shoal) wasbetween 150,000 and 200,000 cyy-north.
0
10000
20000
30000
40000
50000
60000
70000
-2000200400600800100012001400
shoreline offset distance 1887 - 1982, ft
sho
relin
e d
ista
nce
no
rth
of
pre
sen
t m
ou
th
of
Tiju
ana
Riv
er, f
t
baseline
total offset
1 Zuniga Jetty 2 Hotel Breakwater 3 Coronado problem reach 4 groins 5 Imperial Beach problem reach 6 Tijuana River mouth
1
65
4
32
Figure 3. Net shoreline change between 1887 and 1982 in the Silver Strand Littoral Cell.
Shoreline fluctuations from one survey period to another were largest in the last century within 2miles of the river mouth, i.e., the Imperial Beach problem reach. Up to 200-feet shifts in theposition of the shoreline shown in Figure 2 (range is almost 400 feet) reflect the dischargehistory of the river preceding the date the surveys were made. This short reach is the only placein the cell north of the Tijuana River that experienced a net retreat of the shoreline between 1887and 1982 (Figure 3), probably due to reduced river contributions after 1938.

7
Of special interest is the pattern of shoreline change that forms the “indent” in the shorelineadvance at the north end of the 1946 beachfill as illustrated in Figure 3. Given the north-directednet longshore sediment transport, one might expect a greater loss south of the fill site than northof it. What is observed is apparently a classic erosion wave that moves ahead of an accretionwave in the direction of the net flux due to enhancement-modified shoreline orientations. Thisphenomenon is caused by a greater longshore sediment transport rate on the downcoast side ofthe accretional lobe than on its upcoast side. If an erosional wave indeed exists, greater losses areexpected south of the Hotel del Coronado and more accretion north of the hotel after 1982. Eventhough Figure 3 indicates an uneven distribution of shoreline advance in the last century, whenthe cumulative change in beach area north of the Tijuana River is plotted, a smooth andprogressive increase to the north is found, as shown in Figure 4, suggestive of a pattern onewould expect if the net transport rate was to the north without a substantial alongshore gradient.
0
10,000
20,000
30,000
40,000
50,000
60,000
70,000
-505101520253035
cumulative change in beach area north of the Tijuana River mouth: 1887 - 1982, millions of sq.ft.
sho
relin
e d
ista
nce
no
rth
of
pre
sen
t m
ou
th
of
Tiju
ana
Riv
er, f
t
baseline
cumulative area
1 Zuniga Jetty 2 Hotel Breakwater 3 Coronado problem reach 4 groins 5 Imperial Beach problem reach 6 Tijuana River mouth
1
65
4
32
Figure 4 Cumulative change in beach area north of the Tijuana River: 1887-1982
In conclusion, it appears the net longshore sediment transport rate, based on sediment budgetconsiderations and past estimates is between 150,000 and 200,000 cyy-north. The net to grossratio is unknown, but analysis of CDIP data suggests it is less and probably much less than 0.5.In addition, the discharge of sediment from the Tijuana River has been reduced from perhaps150,000 to 200,000 cyy before 1938 to perhaps 70,000 cyy or less today. The impact of thisdecline on the beach at Imperial Beach has not been fully realized because a
8
portion of the river contribution has historically been deposited directly on the beach and aportion has been carried to the river’s delta from whence it subsequently moved onto the beach.Delta contributions will likely decline in the future as the supply of delta sand is exhausted.Since Imperial Beach is at the upcoast end of the longshore sediment transport path, thereduction in the river and delta supply will be most acute within the Imperial Beach problemreach. Further analysis is needed to forecast the impact of migration of the accretion and erosionwave at Coronado Shores, but that problem reach is also likely to experience more rather thanless shoreline retreat in future unless sand is artificially added and/or retention structures areconstructed to retain it.

APPENDIX 3
PERFORMANCE ASSESSMENT OF EXISTING STRUCTURES
IN THE REGION

1
This appendix contains a performance assessment of existing sand retention structures in theSANDAG region. The shoreline reach within the Oceanside Littoral Cell is presented first,followed by the Silver Strand Cell.
OCEANSIDE LITTORAL CELL
Performance of Natural Features
Natural features, including the headland north of Ponto Beach in Carlsbad, Swami’s headland atthe Self Realization Fellowship in Encinitas, the reef off the present location of the outlet of SanElijo Lagoon. These features, for their size, retain very little dry beach and thus offer little in theway of clues that could be used in the design of artificial structures south of Oceanside Harbor.Conversely, Point La Jolla is an effective beach retention feature. It prevents sand from passing itto the south and retains the beach at La Jolla Shores. However, because La Jolla Shores is in thelee of the broad head of La Jolla Submarine Canyon, it is not possible to separate the sediment-blocking function of the headland from the influence of the underwater valley. Some smallheadland-like features retain minute amounts of cobbles and gravel and a few retain smallpockets of sand, but none are notably effective in retaining beaches year around.
Performance of Artificial Structures
Artificial structures that are presently retaining substantial beaches within the Oceanside LittoralCell, or those that might be thought to have the potential for retaining sandy beaches, include thefollowing:
• North breakwater of Oceanside Harbor• South breakwater of Oceanside Harbor• Groin at the San Luis Rey River mouth• North jetty at Agua Hedionda Lagoon• South jetty at Agua Hedionda Lagoon• Outlet structures at the power plant in south Carlsbad• North jetty at Batiquitos Lagoon• South jetty at Batiquitos Lagoon
A temporary groin installed in south Oceanside in the early 1970s also provided some cluesconcerning the blocking distance of sediment retaining structures in that location. Excludedfrom the evaluation are the jetties at Batiquitos Lagoon since they have not been in place longenough for the beaches on either side to attain a dynamic equilibrium. Also excluded is the southbreakwater at Oceanside Harbor because it is in two segments with its outer segment oriented tothe southeast, or into the direction sediment approaches it, making any performance factorsderived from it complex and difficult to understand.
North Breakwater of Oceanside Harbor
The north Camp Pendleton breakwater was constructed as part of a military harbor in 1941. Overtime it was extended, and in 1963 Oceanside Harbor was constructed. Both harbors now share

2
the same entrance, but since 1941, the north breakwater, shown in a February 1975 obliquephotograph at Figure 1, has been impounding sand to the north.
Figure 2 shows the evolution of the blocking distance, based on shoreline position mapsdeveloped for the Corps of Engineers. Blocking distance is the exposed length of the structurebetween its outer end and the shoreline against the structure. It is the distance a groin mustprotrude beyond the shoreline for it to have any impact in retaining a permanent beach.
In addition to the blocking distance, another fundamental design parameter for sediment-blocking structures is the angle between the pre-project shoreline and the fillet shoreline, i.e. thefillet angle. The fillet reached a state of dynamic equilibrium around 1960 as indicated by thefluctuating, but seemingly constant blocking distance of 500 feet after that time (see Figure 2).The blocking distance is referenced to the end of the landward breakwater segment shown inFigure 1. This segment is oriented at 75 degrees to the shoreline and the next segment after thedogleg is aligned at 36 degrees to the shoreline. Since the second segment is much closer toshore-parallel, it was assumed that it does not substantially block the alongshore movement ofsediment. If that is not the case, the mean 500-feet blocking distance attributed to the northbreakwater would be greater.
Figure 1. Oblique view of the north breakwater and the upcoast retained beach inFebruary 1975.

3
0
200
400
600
800
1000
1200
1400
1900 1910 1920 1930 1940 1950 1960 1970 1980 1990
year
referenced to firstbreakwater segment
referenced to shore normalfirst breakwater segment
breakwater construction in 1941
18901880
second order polynomial fit
blocking distance after 1941
EN
SO
sh
ore
line
po
sit
ion
re
lati
ve
to
en
d o
f fi
rst
bre
ak
wa
ter
se
gm
en
t, f
t
Figure 2. Blocking distance of the fillet against the north breakwater at Oceanside Harbor(data from Corps of Engineers shoreline position maps).
Blocking distance is proportional to the inverse of the net to gross longshore sediment transportratio. That is, it increases as the net rate declines and the gross rate increases. The blockingdistance shown in Figure 2 appears to have declined between 1941 and about 1960 when itdynamically stabilized at about 500 feet. If the net to gross ratio changed in the late 1970’s,there is no evidence of that change. If the net to gross ratio declined, one would expect to see anincrease in the blocking distance that is not evident in Figure 2. In its mature state the mean sealevel shoreline extends out along the breakwater about 400 feet from where it would have been ifthe structure were not there.
This fillet lies within the sweep zone of the Santa Margarita River, which complicates theestablishment of a fillet angle. Periodic floods and the creation of a delta at the river mouth, andgeneral shoreline fluctuations between the base of the seacliffs and a line about 200 feet seawardof the seacliffs, complicate the establishment of an upcoast limit of the fillet. Two methods wereused to define that position: (1) a comparison of shoreline change rates upcoast of the structurebefore and after it was constructed to determine the point where they accelerated followingconstruction, and (2) measurements of the orientation of the shoreline, in segments, to determinewhere it deviated from its regional alignment (Table 2). In both tests the alongshore length ofthe structure-retained beach was found to be 4000-4500 feet. The plan area of dry beach in thefillet is between 600,000 and 750,000 square feet, and the fillet angle is 6 degrees. Shorelinecomparisons showed that severe storms or clusters of storms, like those of the strong El Nino in1982-83, caused the shoreline to retreat at a near constant rate the length of the fillet. Itrecovered in the same manner. Seasonal shifts were also expected, with the shoreline against the

4
breakwater advanced between late November and April in most years and retreated from Maythrough October.
Table 2. Orientation of Shoreline Segments North of the Oceanside Harbor BreakwaterAfter 1970.
Distance north of thestructure (feet)
0-1400 1400-2800 2800-4200 4200-5600 5600-6200
Shoreline orientation(degrees)
156 148.5 147 145 145
Groin at the Mouth of the San Luis Rey River
A long groin was constructed on the north side of the mouth of the San Luis Rey River in 1968.Prior to 1960, the shoreline was in a recessional position in this location due to sand entrapmentnorth of the Oceanside Harbor breakwater and a lack of substantial artificial sand bypassing tothe beaches south of it. Dredged material released when Oceanside Harbor was constructed inthe early 1960’s widened this beach, and after the groin was constructed the blocking distancenorth of the structure declined to about 500 feet by the late 1980’s as shown in Figure 3. In thesame period, the blocking distance increased south of the structure indicating a net south-directedsediment flux. Updrift advance and downdrift retreat against the structure is indicative of thekind one would expect to be associated with a groin. However, since the groin is in the lee ofOceanside Harbor and at the mouth of the San Luis Rey River, the blocking distances may bemisleading if applied elsewhere. In the late 1980’s the blocking distance on the updrift (north)side was about 500 feet or nearly the same as on the updrift side of the north breakwater. On thedowndrift side of the groin the blocking distance in the late 1980’s was about 650 feet. Sincemore recent shoreline data were not available to this investigation it is unknown whether theseblocking distances represent mature values or whether they are still maturing. The fillet angle isin an offshore direction due to the shadowing effect of the harbor.

5
300
400
500
600
700
800
900
1000
1950 1960 1970 1980 1990
year
referenced to groin segment,north sidereferenced to groin segment,south side
second order polynomial fit,
north
second order polynomial fit, south
groin construction in 1964
blo
ck
ing
dis
tan
ce
, ft
Figure 3 Blocking distance on both sides of the groin at the mouth of the San Luis ReyRiver (data from Corps of Engineers shoreline position maps)
Temporary Groin at Buccaneer Beach
A temporary double sheet pile trestle was used to construct an outfall in south Oceansidesometime in the early 1970’s. This feature lends itself to function as a type of groin.The only available evidence of its performance as a beach retention structure is the aerialphotograph dated 1971 shown in Figure 4. This photo indicates the structure was not successfulin the short time it was in existence. There is no evidence of a substantial fillet on either side.Depending on whether the end of the groin is the muted whitewater off the end of the visiblestructure or is where the wave approaching from south of shore-normal is clearly breakingagainst it, the groin is either 900 or 1125 feet from the wetted bound shoreline. That boundary isthe color change from white (landward) and gray (seaward) on the photo.

6
Figure 4 Aerial photograph of a temporary groin that was constructed at BuccaneerBeach, Oceanside, in 1971
In the Oceanside area, the wetted bound identified in aerial photographs is usually between 7 and10 feet above mean sea level (msl), or between 60 and 100 feet landward of the msl-shoreline.Thus the blocking distance on the north side of the structure was 800 to 1000 feet when the photowas taken. Below the wetted bound there appears to be a small fillet on the south side thatextends seaward perhaps 200 feet, so the blocking distance on that side may have been 700-900feet at the time the photo was taken. This fillet would have formed due to north-directedlongshore transport, perhaps in response to the large waves that are approaching and breakingfrom the south in the photo. A fillet takes time to reach maturity if it evolves naturally asevidenced in the up to 20 years that were required in Figure 2 for the fillet to mature against thenorth breakwater at Oceanside Harbor. Thus, it is reasonable to conclude the blocking distanceshown in Figure 4 did not represent the mature distance and that if a mature beach would havebeen retained by this structure it would have formed on the north side. North to south transportis the supposed net direction in south Oceanside.
North and South Jetties at Agua Hedionda Lagoon
Jetties were constructed on both sides of the outlet of Agua Hedionda Lagoon in 1954. Thepurpose was to control the entrance location and keep it open to maintain a continuous supply ofcooling water for the nearby power plant. Figure 5 illustrates the time-history of the blockingdistances adjacent to the north and south jetties. The apparent blocking distance at the north jettyis about 150 feet while it is about 250 feet against the south jetty. The small blocking distance atthe north jetty (large advance of the shoreline) in the mid-1960’s was due to a huge influx ofsand placed on the beach when Oceanside Harbor was constructed. Similarly, the small blocking

7
distance at the south jetty from the mid-1950’s to the mid-1960’s was due to the huge amount ofsand placed south of the jetty as Agua Hedionda Lagoon was deepened. After these beachfills,the blocking distances seem to have reached a state of dynamic equilibrium. The cause of thedifference in the apparent 150-foot blocking distance at the north jetty and the 500-foot blockingdistance at the north breakwater of Oceanside Harbor is unclear.
Figure 5 Blocking distances for the north and south jetties at Agua Hedionda Lagoon (datafrom Corps of Engineers shoreline position maps)
An argument against the north structure retaining a beach plus stabilizing the lagoon outlet mightbe that the shoreline was hardened in the mid-20th century. In 1887-89 and 1933-34, theshoreline was about 150 feet landward of the present shoreline north of the lagoon entrance and75 feet landward of the present shoreline south of the lagoon, suggesting the jetties may have hada positive effect in advancing the shoreline and that the blocking distances in Figure 5 areauthentic. In the mid-20th century, however, the back of the beach upcoast as well as downcoastof the jetties was stabilized by ample supplies of cobbles plus artificial revetments designed toprotect a parking lot (north side) and Carlsbad Boulevard (south side). These features fixed theposition of the backbeach line on both sides and likely played a role in maintaining the beachseaward of its earlier position. Also complicating an understanding of the process is the locationof the shoreline on other lagoon barrier beaches. Although the 1887-89 and 1933-34 barriershorelines at Agua Hedionda were further landward of the present shoreline than they were atany of the other lagoons in San Diego County, it is also true most of the other lagoon barriershorelines in earlier years were also landward of their present position. Lastly, the fillet anglebetween the mean 1887-89 and 1933-34 shoreline and the mean post-1960 shoreline is 3 degrees.However, the advance of the shoreline to its present alignment only straightened it from a curvedlandward configuration in the vicinity of the lagoon mouth. Only during the early 1960’s periodof abundant sediment supply, when the blocking distance was 50-100 feet less than it was in the
0
50
100
150
200
250
300
1950 1960 1970 1980 1990
year
jetty
con
stru
ctio
n
blo
ckin
g d
ista
nce
as
a fu
nct
ion
of
tim
e fo
r th
e n
ort
h je
tty,
ft
0
50
100
150
200
250
300
1950 1960 1970 1980 1990
year
jetty
con
stru
ctio
n
blo
ckin
g d
ista
nce
as
a fu
nct
ion
of
tim
e fo
r th
e so
uth
jett
y, f
t

8
1970’s and 1980’s, did a fillet form that projected the shoreline seaward from the general trendof the upcoast shoreline. In this case the angle was 2.5 degrees, further suggesting the AguaHedionda jetties are not retaining sediment as blocking structures, but only preventing theshoreline from curving inward at the lagoon outlet.
North and South Jetties at the Power Plant Outfall at Agua Hedionda Lagoon
Jetties at the power plant outfall add a second level of evidence to refute the contention the northlagoon-mouth jetty is functioning like a sediment-blocking structure and retaining a beach. Theshoreline also advanced on both sides of the power plant outfall jetties after they wereconstructed about 2500 feet south of the lagoon jetties in the mid-1950’s. In the 1970’s and1980’s (the last shoreline data available to this investigation) the apparent blocking distance atthe north outfall jetty was about 125 feet; it was about 175 feet at the south jetty (Figure 6). Inboth cases, these shorelines were 175 feet seaward of the 1887-89 and 1933 shorelines. Soalthough the difference in blocking distances was an expected decline from north to south, andabout half as large as it was across the lagoon, it is unlikely the structures were responsible forthe 175 feet advance of the shoreline.
0
50
100
150
200
250
1950 1960 1970 1980 1990
year
jetty
co
nst
ruct
ion
blo
ckin
g d
ista
nce
as
a fu
nct
ion
of
tim
e at
th
e n
ort
h j
etty
ou
tfal
l, f
t
0
50
100
150
200
250
1950 1960 1970 1980 1990
year
jetty
co
nst
ruct
ion
blo
ckin
g d
ista
nce
as
a fu
nct
ion
of
tim
e at
th
e so
uth
jet
ty o
utf
all,
ft
Figure 6 Blocking distances for the north and south jetties at the power plant outfall insouth Carlsbad (data from Corps of Engineers shoreline position maps)

9
SILVER STRAND LITTORAL CELL
Performance of Natural Structures
Natural retention structures are responsible for the configuration of the Silver Strand LittoralCell. The 12-mile long, deeply indented, hook-shaped coast from Zuniga Jetty south to theprotrusion of the coast in south Imperial Beach, herein referred to as Delta Point, owes itsconfiguration and position to the Point Loma headland in the north and to the Tijuana River deltain the south. Delta Point is the site of the Imperial Beach problem reach. Point Loma functionsto block and diffract waves that approach from the north and northwest and to reduce thepercentage of unobstructed deep water wave energy that reaches the north half of the cell in itslee. Zuniga Jetty fixes the position of the shoreline at the northern, hooked-portion of this part ofthe cell. Delta Point, which is retained by wave refraction and wave attenuation over the TijuanaRiver delta, controls the position of the shoreline at its southern end. The reduction in waveenergy reaching shore close to Point Loma and in the immediate lee of Zuniga jetty is evidencedin the tightest shoreline curvature, mildest beach and shoreface slope, and smallest sedimentsizes near the jetty. Shoreline curvature is mild in the south, slopes are steeper, and sedimentsizes are larger. Nonetheless, Pawka and Guza (1983) estimate only 40 % of swell from 280degrees, decreasing to 10 % of swell from 320 degrees, reaches deep water off Imperial Beach.
The Tijuana River delta is a wave refraction and dissipation structure that, in turn, functions toretain Delta Point. A project to artificially advance Delta Point would benefit not only theImperial Beach problem reach, but would affect the entire littoral cell.
Delta Point is also the north retention structure, and the headland at the south end of Playas deTijuana is the south retention structure, that retains the five-mile long beach at the south end ofthe Silver Strand Littoral Cell. Delta Point is a less effective retention feature than Point Lomaand for this reason the southern shoreline is only mildly hooked in comparison to the deeplyindented shoreline to the north. The headland in Mexico seems to be a complete barrier to thelongshore movement of sand (USACE-LAD, 1987).
The large, shallow delta of the Tijuana River has apparently been losing sand since RodriguezDam began affecting flood flows in the river over 60 years ago. Review of USGS smooth sheetsshows the delta has not lost elevation and sand contributed from the inner shelf and shorefacecame from either side of the rocky delta. The internal makeup and scour rate of the delta isunknown (USACE-LAD, 1987) and it has not been cored, but the surface sediment distributionincludes armoring with a layer of cobbles and boulders. The water depth above the delta isincreasing due to a slow rise in sea level of about 0.6-feet/century and this affects itstransmission coefficient and function as a natural reef.
Performance of Artificial Structures
Four “permanent” structures and one temporary structure that function or have functioned toretain beaches in the Silver Strand Littoral Cell, or that were designed to retain beaches, arelisted in Table 3 and addressed in this section.

10
Table 3 Artificial Structures in the Silver Strand Littoral Cell (from USACE-LAD, 1987)
Structure Location, milenorth of theUS-Mexico
border
Dimensions Yearconstructed
Purpose
Zuniga jetty 13.6 7500-feet long 1893-1904 Stabilize entranceto San Diego Bay
Hotel delCoronado groin
10.0 1400-feet long,hook-shaped
1897-1900 Create a smallcraft harbor
Wrecked ship thatfunctions like asurface-piercingoffshorebreakwater
9.5 About 200-feetlong, 700-feetfrom shore andoriented diagonalto the shoreline
Observed on anaerial photographtaken in 1938
North groin,Imperial Beach
3.8 600-feet long,extended to 720feet
1959 and 1963 Shore stabilization
South groin,Imperial Beach
3.5 400-feet long 1961 Shore stabilization
Zuniga Jetty
Zuniga Jetty at the northwest end of the cell the shoreline advanced in two steps due to itssediment-blocking function and to the advancement of the beach as a result of the beachenhancements. Zuniga jetty is the largest of the artificial structures in the Silver Strand LittoralCell, lying in the lee of Point Loma and preventing sand from moving into the entrance to SanDiego Bay. Because of its length, it also acts as a wave-diffracting headland, though its functionin that regard is secondary to Point Loma.
Figure 7 shows the advance of the shoreline seaward along the jetty after its constructionbetween 1883 and 1904. The fillet reached dynamic equilibrium about 1915 and probably did notchange much until 1941-46 when the US Navy placed about 28 million cubic yards of beachfillto the east and south of it. This advance of the shoreline forced the shoreline 450 feet furtherseaward against the jetty by 1960 as sand moved northwest from the 1946 fill site. From 1960until 1982, the jetty shoreline was in near equilibrium about 1250 feet beyond its pre-jettylocation. A modification to this structure for beach retention purposes is unlikely and would beof little benefit. Even if the jetty was raised or lengthened it would profit a government-controlled beach that is little used in comparison to those in the rest of the cell.

11
0
250
500
750
1000
1250
1500
1900 1910 1920 1930 1940 1950 1960 1970 1980 1990 2000
year
18901880187018601850
Zu
nig
a Je
tty
con
stru
ctio
n:
1894
- 1
904
*ref = 1887 shoreline position
1915
dyn
amic
eq
uili
bri
um
1946
bea
ch e
nh
ance
men
t
sho
reli
ne
adva
nce
alo
ng
Zu
nig
a Je
tty,
ft
*
Figure 7 Advance of the fillet against Zuniga jetty between 1887 and 1982
Hotel del Coronado Groin
A curved breakwater was constructed around the turn of the last century at the Hotel delCoronado. Its purpose was to provide calm water for launching and mooring small craft. Figure8 is a view of the structure taken in the 1980’s long after the shoreline was artificially advancedin the 1940’s. This structure has functioned as a combined sediment-blocking and wave-blockingand diffraction structure. It is an intriguing feature because of its downcoast-hookedconfiguration and the fact that the retained fillet tends to be on its downcoast side. There is noquestion that the hooked part of the structure functions like a breakwater and retains a tombolo-like triangular beach in its lee.

12
Figure 8 Sediment-blocking structure at the Hotel del Coronado; the net longshoresediment transport flux is from right to left in this photo
The Hotel del Coronado structure imposes an intermediate perturbation on the smooth, gentlycurved shoreline of the littoral cell as shown in Figure 10. Beneficial effects were morepronounced prior to the time the shoreline was artificially advanced in 1946 than afterwards. Thelower diagram illustrates the difference between the 1933 and 1960 structure-impactedshorelines. The 1933 shoreline can be compared to the1852 and 1887 average shoreline position,and the polynomial fit to those shorelines. Likewise the 1960 shoreline is plotted with thepolynomial fit to the 1960 shoreline. Note the polynomial shoreline traces without the influenceof the structure are very similar for the two periods. Both the 1933 shoreline and the 1960shoreline clearly show the downcoast fillet. In 1933, the shoreline upcoast of the structure wasseaward of the smoothed shoreline, but in 1960 and most times thereafter (upper diagram) itappears landward of it.

13
0
200
400
600
800
1000
1200
1400
1600
1800
-6000-4000-20000200040006000
alongshore distance, ft
cro
ss-s
ho
re d
ista
nce
, ft
1852 18871933 19601972 Mar-82Oct-61 Apr-68Mar-72 Dec-76Feb-83 Mar-84May-85 Mar-86
downcoast upcoast
1976 beachfill
structure
cross-shore exaggeration is 10x
0
200
400
600
800
1000
1200
1400
1600
-6000-4000-20000200040006000
alongshore distance, ft
cro
ss
-sh
ore
dis
tan
ce
, ft
1933
average 1852-1887
1960
Poly. (average 1852-1887)
Poly. (1960)
downcoast upcoast
structure
cross-shore exaggeration is 10x
Figure 10 Shoreline positions adjacent to the Hotel del Coronado beach retentionstructure: all shorelines used in the analysis are illustrated in the upper diagram while only
the 1933 and 1960 shorelines are shown in the lower diagram.
Seasonal changes in the position of the shoreline cannot be quantified with the shoreline positionmaps and aerial photographs available to this study. Qualitatively, the behavior of the beachseems to follow the patterns shown in Figures 11 and 12. Figure 11 shows the shoreline oneither side of the structure at the end of the winter season of typically upcoast sediment transportin this cell (transport toward Imperial Beach). Note a shoreline projection from one to the otherside of the structure would not be offset, suggesting that in the downcoast transport season thestructure does not retain a beach on either side. The only retained beach is in the lee of thestructure. In contrast, in the upcoast transport season, roughly from May through November,there appears to be a fillet on the downcoast side of the structure and an anti-fillet on the upcoastside as shown in Figure 12. Of further interest in these figures is the position of the breaker line.

14
In this and other photos taken after 1946, the breaker line is always seaward of the end of thestructure.
Figure 11 Aerial photograph showing the position of the shoreline adjacent to the Hotel delCoronado structure on 30 March 1987, near the end of the winter season of upcoast
transport.
Figure 12 Aerial photograph showing the position of the shoreline adjacent to the Hotel delCoronado structure on 26 July 1985, in the middle of the summer season of north-directed
(downcoast) transport.

15
The beach retained in the lee of the structure was present at all times. It size declined after theshoreline was advanced in 1946. Figure 13, an 11 July 1938 photo taken before the 1946enhancement, shows the upcoast shoreline was probably seaward of the shoreline downcoast ofthe beach in the lee of the structure before the shoreline was advanced. The implication is thatthe longer (pre 1946) breakwater functioned as a sediment-blocking structure and retained abeach upcoast of it. In addition, it appears that before 1946, the breakwater did not retain adowncoast fillet, but only retained a beach in its lee. That is, it only functioned like a wave-blocking and diffraction structure. Of additional interest in this photo is the salient that formed inthe lee of a grounded shipwreck.
Figure 13 Aerial photograph showing the beach retained in the lee of the Hotel delCoronado breakwater on 11 July 1938, before the beach was artificially advanced.
The advance of the shoreline from 1941 through 1946, due to the Navy beachfill, wasresponsible for a reduction in the size of the retained beach in the lee of the structure andpossibly for the slightly indented position of the upcoast shoreline evident in Figure 10. Figure14 shows the position of the shoreline at the structure location in the last century and a quarter.After the beachfill, the shoreline downcoast of the structure advanced faster than the upcoastshoreline. This occurred as sand moved north, probably due to the northward advance of theerosion wave evident in Figures 2 and 3 of Appendix 2. Prior to the 1946 beachfill, the structurecaptured sand upcoast as one would expect of a sediment-blocking structure. Sand movementpast the structure was then inhibited to a greater extent.
salientregional shoreline trend

16
Figure 14 Shoreline positions upcoast and downcoast of the Hotel del Coronadobreakwater: 1887-1982.
With the advance of the shoreline, the downcoast fillet area declined by almost an order of threefrom 1933 to the 1960-1985 average (290,000 to 110,000 square feet) as shown in this figure.The 1933 shoreline is the only one before the US Navy’s beach enhancement; the 1960-1985shoreline is the mean of five post beachfill shorelines. As the downcoast fillet area declined, theupcoast structure-impacted beach went from about +60,000 square feet to perhaps -50,000 squarefeet, but as suggested in Figures 11 and 12, there may be a seasonal effect that was notquantified. Clearly the structure is providing little benefit at the present time except along about500-feet of coast in its lee (Figure 10). The sum of the average upcoast anti-fillet and thedowncoast retained-beach is less than an acre of structure-retained beach. In 1933, the shore-normal blocking distance for this structure was 870 feet; in 1960 it was 370 feet. From itslandward origin the structure extends seaward about 900 feet and downcoast an equal distance.
Imperial Beach Groins
Groins at Imperial Beach have not been successful in retaining a wider beach. On only a fewaerial photographs of perhaps 15 that were checked was there any evidence of a fillet associatedwith the north groin. Similarly only a few very small seasonal fillets are in evidence adjacent tothat structure on shoreline maps. In all cases the fillets not preferentially located on either theupdrift or downdrift side of the groin. A retained beach was not evident on either side of thesouth groin on any aerial photographs. Figure 15 is typical. In this photo, the water depth at theend of the north groin is approximately one-foot below mean lower low water. It is near meanlower low water at the tip of the south groin.
-100
0
100
200
300
400
500
600
700
800
900
1000
1100
1900 1910 1920 1930 1940 1950 1960 1970 1980 1990 2000
time
downcoast
upcoast
partial data
18901880187018601850
1941 & 1946 beach fills
rate of change, ft/year upcoast downcoast1887-1933 2.50 -0.10 1960-1985 2.97 6.53
me
an
be
ac
h w
idth
, re
fere
nc
ed
to
0 w
idth
in
18
87

17
Figure 15. Groins at Imperial Beach in April 1993; note the lack of a fillet associated witheither structure; the Imperial Beach problem reach is in the background beyond (south of)
the pier; Delta Point is where the shoreline hooks landward beyond the problem reach.
These Imperial Beach sediment-blocking structures are too short to be effective. The northgroin, at 720 feet long, is near its effective length (beyond the mean position of the shoreline)where it will retain a beach. That is, the blocking distance for a high, impermeable, straight groinat Imperial Beach is about 700 feet. The north groin would have to be lengthened significantly toretain a year-around fillet on the south or updrift side where it would benefit Imperial Beach. Thesouth groin, because at 400-feet is effectively shorter, would have to be lengthened more than thenorth groin in order to be an effective full-time beach retention structure.

APPENDIX 4
PERFORMANCE ASSESSMENT OF REPRESENTATIVE
RETENTION STRUCTURES

1
This appendix contains a performance assessment of representative sand retention structures forthe Regional Beach Sand Retention Strategy. It begins with an analysis of offshore breakwatersfollowed by sand retention reefs.
OFFSHORE BREAKWATERS
Offshore breakwaters and artificial reefs differ in a few important aspects. For this reason theyare treated separately, beginning with the development of a methodology to forecast the size of asalient when the dimension, location, and transmission coefficient, are known or can bedetermined for offshore breakwaters subjected to the southern California wave climate.
Offshore breakwaters reduce wave heights and alter wave propagation directions in their lee.This changes the longshore component of wave energy flux (factor). Only after an alteration inthe configuration of the shoreline to that of a bulge will the net longshore sediment transportgradient be returned to zero, which is needed for a dynamic equilibrium state. The modifiedwave conditions in the lee of an offshore breakwater are due to a complete or partial blockage ofwave energy at the structure and diffraction at its ends. Wave energy is transmitted into theshadow zone by diffraction, wave overtopping, and transmission through the structure. Waveenergy is lost by dissipation on the structure and reflection from it. Sediment that creates ashoreline bulge may arrive naturally in the longshore sediment transport zone, or it may beartificially placed. One or the other source is required to form a salient or tombolo. It should benoted that breakwaters create specialized beaches mainly for swimming at the exclusion ofsurfing.
First level quantitative guidance to predict the size of a salient is at best rudimentary. In manycases they are somewhat misleading. None are based on all four of the most important controls:(1) shore-parallel length of a breakwater, (2) distance it is positioned seaward of the pre-projectshoreline, 3) transmission coefficient of the structure, and (4) local wave climate. The bestgeneral background on offshore breakwater design guides is Chasten et al. (1993). Mostreconnaissance level work has focused on defining the limiting conditions under which a salientwill form and a tombolo will not form as a function of the dimensionless ratio of the length ofthe structure, L, and its location seaward of the pre-project shoreline, Y. Wave climate is rarelyincluded. It is also one of the reasons there is such a wide discrepancy in the in the L/Y limitsbetween investigators. Most of the empirical data has been collected in sheltered waters and theresults are not directly applicable to exposed ocean sites in southern California. Wavetransmission through or over the structure is rarely considered. This control, however, is criticalif wave overtopping or energy transmission through the structure is likely. Direct guidance toevaluate a specific structure or to optimize a planned structure to maximize the area of beach itwill likely retain and to develop a benefit cost relationship is lacking. Indeed, even if this was adesign-level effort and resources to conduct a detailed numerical modeling analysis wereavailable along with a long wave record at each project site, the difficult task of estimating thewave transmission coefficient would still remain.
The approach taken to estimate the size of a salient when the L/Y ratio is specified is as follows:(1) develop a relationship between dimensionless, L/Y and the dimensionless ratio of thedistance a salient protrudes beyond the pre-project shoreline, ys, and Y for four southernCalifornia’s offshore breakwaters, (2) evaluate the L/Y and ys/Y relationships for these
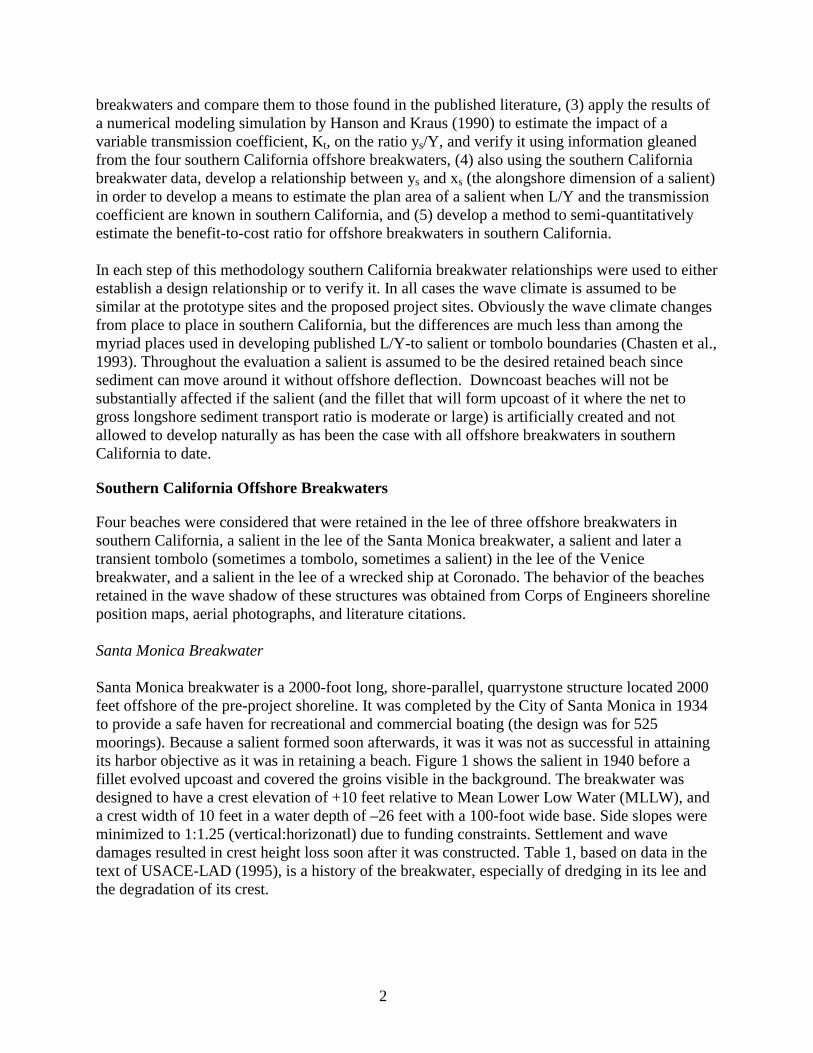
2
breakwaters and compare them to those found in the published literature, (3) apply the results ofa numerical modeling simulation by Hanson and Kraus (1990) to estimate the impact of avariable transmission coefficient, Kt, on the ratio ys/Y, and verify it using information gleanedfrom the four southern California offshore breakwaters, (4) also using the southern Californiabreakwater data, develop a relationship between ys and xs (the alongshore dimension of a salient)in order to develop a means to estimate the plan area of a salient when L/Y and the transmissioncoefficient are known in southern California, and (5) develop a method to semi-quantitativelyestimate the benefit-to-cost ratio for offshore breakwaters in southern California.
In each step of this methodology southern California breakwater relationships were used to eitherestablish a design relationship or to verify it. In all cases the wave climate is assumed to besimilar at the prototype sites and the proposed project sites. Obviously the wave climate changesfrom place to place in southern California, but the differences are much less than among themyriad places used in developing published L/Y-to salient or tombolo boundaries (Chasten et al.,1993). Throughout the evaluation a salient is assumed to be the desired retained beach sincesediment can move around it without offshore deflection. Downcoast beaches will not besubstantially affected if the salient (and the fillet that will form upcoast of it where the net togross longshore sediment transport ratio is moderate or large) is artificially created and notallowed to develop naturally as has been the case with all offshore breakwaters in southernCalifornia to date.
Southern California Offshore Breakwaters
Four beaches were considered that were retained in the lee of three offshore breakwaters insouthern California, a salient in the lee of the Santa Monica breakwater, a salient and later atransient tombolo (sometimes a tombolo, sometimes a salient) in the lee of the Venicebreakwater, and a salient in the lee of a wrecked ship at Coronado. The behavior of the beachesretained in the wave shadow of these structures was obtained from Corps of Engineers shorelineposition maps, aerial photographs, and literature citations.
Santa Monica Breakwater
Santa Monica breakwater is a 2000-foot long, shore-parallel, quarrystone structure located 2000feet offshore of the pre-project shoreline. It was completed by the City of Santa Monica in 1934to provide a safe haven for recreational and commercial boating (the design was for 525moorings). Because a salient formed soon afterwards, it was it was not as successful in attainingits harbor objective as it was in retaining a beach. Figure 1 shows the salient in 1940 before afillet evolved upcoast and covered the groins visible in the background. The breakwater wasdesigned to have a crest elevation of +10 feet relative to Mean Lower Low Water (MLLW), anda crest width of 10 feet in a water depth of –26 feet with a 100-foot wide base. Side slopes wereminimized to 1:1.25 (vertical:horizonatl) due to funding constraints. Settlement and wavedamages resulted in crest height loss soon after it was constructed. Table 1, based on data in thetext of USACE-LAD (1995), is a history of the breakwater, especially of dredging in its lee andthe degradation of its crest.

3
Figure 1 Santa Monica breakwater and the salient it retained in 1940 (photo fromUSACE-LAD, 1995).
Table 1 Selective History of the Santa Monica Breakwater
Change in breakwater Year RemarksConstruction 1934 2000-foot long, 2000 feet from shore, 1v to 1.25 h sidewalls, crest
elevation +10 ft (MLLW) and crest width 10 ftLoss of crest elevation due tosettling and wave action
1935 1 foot lost
Approximately 61,000 cydredged from mooring area
1930 Sand placed on beaches to the south of the pier
Hyperion beachfill advancesbeaches to the south
1946-48
Dredging removes 960,000cy from mooring area
1949 Sand placed on beaches to the south of the pier
Additional loss of crest height 1935-1956
3 more feet lost; photograph identified as circa 1950 in USACE-LAD(1995) clearly shows a much higher crest than existed in 1988; 1940photos show a continuous breakwater crest of perhaps +10 ft MLLW.
Dredging removes 600,000cy from mooring area
1957 Sand placed on beaches to the south of the pier
Dredging removes 780,000cy from mooring area
1958 Sand placed on beaches to the south of the pier
Salient shoreline returns to itsapproximate pre-1949 pre-
By 1960

4
Change in breakwater Year Remarksdredging positionAdditional loss of crest height 1956-
19720.6 ft more lost; structure crest now +5.4 ft (MLLW)
Salient reaches its maximumseaward extent according toUSACE-LAD (1990)
1982 Actually it recovered after 1983 storms to near the 1982 position
Additional loss of crestelevation during a strongENSO winter
1982-83 1983 survey shows the average crest elevation was –5.4 ft (MLLW)or almost totally submerged, but 44 feet wide; side slopes now 2h:1von seaward side and 1.8h:1v on the landward side; crest now mostlyexposed quarry run (2-ft dia) versus original armor stone (6-ft dia)(USACE-LAD, 1995, pB-2) Note: photographs taken in 1988 andpresented in USACE-LAD (1995) clearly show at least 50% of thebreakwater above the sea surface to perhaps +4 ft (MLLW)
According to USACE-LAD (1995) the apex of the salient reached an equilibrium position in1949. It was mined of 960,000 cubic yards (cy) of sand in 1949, possibly an unknown amount in1957, and 780,000 cy more in 1958, and it again reached an equilibrium position in 1964. Itsposition that year was about 750 feet from the base of the bluffs just as it was in 1949 and 1974.Reportedly it degraded following the storms of 1982-83. USACE-LAD (1995) also reports theirsediment budget shows net longshore transport into the system from the west at 220,000-350,000cubic yards per year. The net to gross ratio is probably between 0.6 and 0.8 at Santa Monica.
As shown in Figure 2, the salient formed first, followed by a fillet that began forming soonafterwards. In a high net to gross transport region such as this one, salients act as sediment-blocking structures and retain beaches upcoast of them. Between 1960 and 1988, the seawardprojection of the Santa Monica salient fluctuated but appeared stable between 690 and 990 feetfrom the unaltered pre-project shoreline (Figure 2). In this period there was no evidence of itsretreat due to a loss of crest elevation. As it lost crest height the crest gained width as detailed inTable 1. The area of beach retained in the salient was between 2 and 2.5 million square feet, andunchanging between 1960 and 1988. Throughout this period the upcoast fillet gained an average100,000 square feet per year, also without an apparent decline, clearly indicating it was stillgrowing.

5
0
500
1000
1500
2000
2500
-3000030006000900012000
alongshore distance, ftcr
oss
-sh
ore
dis
tan
ce, f
t
Sep-33 Sep-35Sep-60 Feb-63Mar-64 May-65Dec-66 Jan-67Apr-68 Jul-70Jul-72 Jun-74Dec-76 Mar-78Sep-80 Jun-82Aug-83 Mar-84Aug-84 Aug-85Mar-87 Jan-88
upcoast downcoast
Figure 2 Shoreline changes in the vicinity of the Santa Monica breakwater (data fromCorps of Engineers shoreline maps).
Venice Breakwater
A 600-foot long rubble mound breakwater was constructed at Venice in 1905 (Leidersdorf et al.,1994) and soon afterwards a salient formed. Between 1946 and 1948 an enormous quantity ofbeachfill was added, the Venice Beach shoreline advanced 500 feet, and the salient became anephemeral or transient tombolo. The latter condition is shown looking upcoast in Figure 3. Notea groin-like structure between the center of the breakwater and the mainland tends to stabilize thetombolo.

6
Figure 3 Venice breakwater with a transient tombolo in it’s lee.
The behavior of the shoreline in the vicinity of the breakwater is shown in Figure 4. In 1935, thebreakwater was 1070 feet from the adjacent shoreline and the salient projected about 370 feetseaward toward it. In the 1960-1988 period it projected an average 420 to 470 feet seaward andthe breakwater was 520 feet from the adjoining shoreline. In 1935 the plan area of the salientwas about 600,000 square feet; in the 1960-88 period it was about 400,000 square feet.

7
0
200
400
600
800
1000
1200
1400
-6000-5000-4000-3000-2000-10000100020003000
alongshore distance, ftcr
oss
-sh
ore
dis
tan
ce,
ft
Sep-35 Sep-60May-65 Dec-66Jan-67 Apr-68Sep-80 Jun-82Aug-83 Mar-84Aug-84 Aug-85Mar-87 Jan-88Jul-70 Jul-72Jun-74 Dec-76
upcoast downcoast
Figure 4 Shoreline changes in the vicinity of the Venice breakwater (data from Corps ofEngineers shoreline maps).
Coronado Wreck
Figure 5 is a target of opportunity. The salient shown in the center of this figure is in the lee of awrecked ship. The ship, which is functioning like an offshore breakwater, is about 200 feet long(160 feet parallel to shore) and about 700 feet from where the shoreline would be if the salientwas not present. Figure 5 indicates the ship’s freeboard is high and very likely negligible waveenergy (at this state of degradation) is transmitted to its lee by overtopping or transmissionthrough it. The seaward salient projection appears to be 120-150 feet; its alongshore length isabout 700 feet. The total retained beach area in the salient is about 50,000 square feet (about20% the size of the beach retained in the lee of the Hotel del Coronado breakwater).

8
Figure 5 Aerial photograph showing the beach retained in the lee of a wrecked ship (July11, 1938)
Published Empirical Relationships
Many investigators have empirically defined a dimensionless breakwater parameter equal to thelength of the structure divided by its distance from the pre-project shoreline (called the averageshoreline by Chasten et al., 1993). They used this L/Y parameter to suggest bounds betweenconditions that will result in the formation of a tombolo, a salient, or essentially no beachresponse. In most cases, the bound is between the formation of a tombolo and a salient. In mostcases the empirical data is based on surface-piercing, shore-parallel, two-dimensional prototypes.Wave and tide conditions are usually not included. Table 2 is a list of the bounds recommendedby five authors referenced in Chasten et al.(1993).

9
Table 2 Summary of Conditions for Tombolo, Salient, and Minimal Response in the Lee ofan Offshore Breakwater (Chasten et al., 1993)
Minimal response Salient Tombolo ReferenceL/Y<1.0 L/Y>2.0 SPM (1984)L/Y < 0.4 to 0.5 L/Y>2.0 (dbl tombolo) Gourlay (1981)
L/Y<0.125 L/Y = 0.5 to 0.67 L/Y>1.5 to 2.0 Dally and Pope (1986)L/Y<1.0 L/Y>1.0 Suh and Dalrymple
(1987)
L/Y<0.27 L/Y<0.8 to 1.5 L/Y>2.5 Ahrens and Cox (1990)
Clearly, the variability in L/Y conditions displayed in Table 2 precludes its use in anyquantitative exercise to separate the conditions under which a salient or tombolo will form. Itprovides no information concerning the size of a salient that might form, nor does it consider thetransmission coefficient. Figure 6 is an overlay of those bounds. Horizontal bounds are the limitsbelow which the investigators felt a salient will surely form; vertical bounds are the limits abovewhich the investigators felt a tombolo will surely form. An increase in the density of the hatchingto the right and up indicates an increase in the overlap of the various forecasts. For example, allfive would agree that when L/Y > 2.5 a tombolo will be retained. They would also agree thatwhen it is less than about 0.45 a salient will be retained. Note the important region(0.45<L/Y<2.5) for which there is no consensus. The small squares in the lower left are limitstwo of the investigators felt no bulge would form.
0
0.5
1
1.5
2
2.5
3
0 0.5 1 1.5 2 2.5 3
tombolo, L/Y
sa
lie
nt,
L/Y
Santa Monica salient
Venice salient
Coronado salient
Venice tombolo/salient
SPM (1984)
Gourlay (1981)
Dally & Pope (1986)
Suh & Dalrymple (1987)
Ahrens & Cox (1990)
Figure 6 Comparison of salient and tombolo bounds defined by the ratio L/Y for fiveinvestigators (from Chasten et al, 1993).

10
Southern California offshore breakwaters are plotted on the figure for comparison purposes.Table 3 is a summary of the characteristics of these breakwaters. The breakwater at Venice,which retained a transient tombolo after 1948 (1960-1988 data shown), provides a realisticL/Y=1.15 bound for the tombolo-salient boundary in southern California. Above that bound anoffshore breakwater is expected to retain a tombolo. Adverse downcoast impacts would beenough to preclude its creation without further analysis. If the net to gross longshore sedimenttransport ratio is zero (and will remain zero over the life of the structure) a tombolo would notlikely cause problems on adjacent beaches.
Table 3 Characteristics of Selected Southern California Offshore Breakwaters and theBeaches They Retain
Structure L, ft Y, ft ys , ft xs, ft As, sq ftSanta Monica breakwater(salient: 1960-1988)
2000 2000 690-990 5000 2,250,000
Venice breakwater(salient: 1935)
600 1070 370 4000 600,000
Venice breakwater(tombolo: 1960-1988)
600 520 420-470 2000 400,000
Coronado Wreck(salient: 1938)
160 700 120-150 700 50,000
Salient Size
From Figure 6, it can be seen that the transient tombolo – a salient that sometimes intercepts thebreakwater and sometimes doesn’t – is near the lower L/Y limits of the published estimates ofwhere other investigators defined the boundary between tombolos and salients. Thus, with thechanged conditions from salient to transient tombolo that occurred at Venice when the shorelinewas artificially advanced a boundary becomes available to us for wave climatological conditionscommon to southern California. Figure 7 is a scatterplot showing the relationship between L/Yand ys/Y for the local breakwaters obtained from Table 3. Figure 7 indicates good correlationbetween the size of the salient when the breakwater is high and relatively impermeable (Veniceand Coronado structures). It also shows the salient in the lee of Santa Monica breakwater issmaller than it would be if its transmission coefficient were zero, indicating the approach isqualitatively correct so far. Santa Monica breakwater in recent years had a crest elevation nearMean Sea Level (MSL). The bold lower diagonal line on Figure 7 is a measure of the size of asalient when the transmission coefficient is zero. When ys/Y = 1.0, a tombolo should bepermanent and will probably not detach, even temporarily, from the breakwater. When ys/Y =0, asalient will not exist. The transient tombolo is in the range ys/Y = 0.8 to 0.9. Based on theephemeral nature of the Venice tombolo, it appears the effective limits of a salient that will veryinfrequently or never attach to its breakwater in southern California is about ys/Y = 0.75.

11
0
0.5
1
1.5
2
2.5
0 0.2 0.4 0.6 0.8 1 1.2 1.4ys/Y
L/Y
Kt = 0.8
Kt = 0.4
Kt = 0.2
Kt = 0
sa
lie
nt
tra
ns
ien
t to
mb
olo
salient permanently attached to
structure
tom
bo
lo
Venice Breakwater (1960-1988)
Santa Monica Breakwater (1960-1988)
Venice Breakwater (1935)
Coronado Wreck (1938)
note: developed for southern California wave climate
Figure 7 L/Y Versus ys/Y for Southern California Breakwaters
Transmission Coefficient
Wave diffraction is the only way energy reaches the lee of a high, impermeable breakwater. Inthis situation the transmission coefficient is zero. The goal is to forecast salient characteristics ifthe transmission is greater than zero, such as the deflection of the Santa Monica breakwatersalient from the zero-transmission coefficient line in Figure 7. Transmission coefficients arenotoriously hard to quantify, even though many procedures have been suggested to estimatethem. For design work, it is usually prudent to define Kt using a physical model. In this section ascheme was developed to assign transmission coefficients based on crest elevation and todevelop the series of transmission coefficient lines shown on Figure 7.
Hansen and Kraus (1990) provide the basic data set that was used to assign a salient projectiondistance, ys, if the transmission coefficient is greater than zero. Using a numerical one-line modelthat simulated conditions at dynamic equilibrium behind a single breakwater, while holding allrelevant variables constant except the transmission coefficient, they quantified the salientadvance distance, ys, for different coefficients. Their results are normalized for a zerotransmission coefficient in Table 4. Using the Kt = 0 relationship in Figure 7, ys/Y lines fortransmission coefficients of 0.2, 0.4 and 0.8 were determined and are plotted in Figure 7.

12
Table 4. Normalized Salient Projection Distance Versus Transmission Coefficient (adaptedfrom Hanson and Kraus (1990)
Normalized ys 1.0 0.64 0.29 0.075 0Kt 0 0.2 0.4 0.8 1.0
Relationship between Salient Projection Distance and Salient Plan Area
Salient plan area is approximately equal to one-half the alongshore dimension of the feature, xs,and its seaward projection, ys. Alongshore dimensions of selected southern California salients aregiven in Table 3 and plotted versus the shore-normal dimension in Figure 8. Although the scatteris rather great and the population of salients is small, an alongshore salient dimension of about 6times the seaward dimension seems to be about the best fit to the data. From a practicalstandpoint it also simplifies the next step by defining the plan area of the salient in terms of theprojection distance only.
0
100
200
300
400
500
600
700
800
900
1000
0 1000 2000 3000 4000 5000
Xs, feet
Santa Monica Breakwater (1960-1988)
Venice Breakwater (1960-1988)
Coronado Wreck (1938)
Venice Breakwater (1935)
Xs = 6Ys
Ys,
fee
t
Figure 8 Scatterplot: xs vs ys.
Procedure to Evaluate Benefit-to-Cost ratios
A goal is to develop a means to compare different structure lengths, distances from shore, andtransmission coefficients, in terms of their efficiencies in retaining a beach and their cost, for thesouthern California wave climate. In this section a figure was created that can be used to

13
compare the plan area of a salient with the volume of material that will be required to constructits breakwater. Assumptions in using the latter parameter are that the cost of a rubble-moundstructure is a direct function of its volume, its cross-section is a triangle, and the transmissioncoefficient is dependent upon how far the pointy-crest projects above or is submerged belowMSL. To ensure its usefulness, the goal of this derivation is to utilize L,Y, and Kt values inFigure 7, from which ys can be obtained. From Figure 8 and an inspection of salients in southernCalifornia, the plan shape of a salient is assumed to be a triangle with its seaward projectionequal to ys, and it’s alongshore length is equal to 6 ys, so the plan area of the salient, As, isapproximated as
A ys s= 3 2 . (1)
Units are L2. The variables Y, L, and Kt, plus some constants used in all evaluations areincorporated to find the the volume of the structure. Assuming the depth of water at thebreakwater, zb, is a function of its distance from the pre-project shoreline, Y, thenz AYb = 2 3/ where A is taken to be about 0.2 in southern California. In addition, the cross-sectionof the breakwater is assumed to be a triangle with an elevation, Czb, with C = a fraction of thedistance from the MSL depth of the structure. C can also be negative if the structure issubmerged. Kt is considered a function of the exposure or submergence of the structure crestwith Kt and C values as follows: Kt=0/C=0.5, 0.2/0.2, 0.4/-0.1, and lastly, 0.8/-0.3. i.e., thetransmission coefficient is 0.8 when the crest of the structure is 0.3 times the water depth (at thetoe of the structure) below MSL. If h/v = run/rise (slope) of the sides of the structure, and theslope of both sides are the same, the volume of the structure, Vb, can be shown to be
( )V hv
C C LYb = + +0 04 1 2 2 4 3. / (2)
which meets the goal of retaining parameters used in Figure 7. Units are L7 3/ .
A plot of L/Y versus the ratio of the area of the salient to the volume of the breakwater is givenin Figure 9. This figure incorporates the assumption that the transmission coefficient is afunction of the height of the structure (and hence a function of its volume), and its sideslopes are1.5:1 (horizontal:vertical). Also plotted on this figure are the As/Vb ratios for the southernCalifornia breakwaters. The ratio shown in Figure 9 is dimensional (Y-1/3). Accordingly it isnecessary to multiply the value of the ratio obtained when As/Vb is calculated for an existingstructure by Y 1 3/ to locate it on Figure 9. For the wave climate of southern California, this figuresupports the conditions that (1) the volume of a breakwater is proportional to its distance fromshore (or the depth in which it is constructed) and to its height above the sea surface (or depthbelow that surface), and (2) the transmission coefficient declines with submergence, butsubmergence also reduces the volume of a structure with respect to its distance from shore. Thesalient limits in the figure are those shown for ys/Y = 0.75 in Figure 7.

14
0
0.5
1
1.5
2
2.5
0 3 6 9 12 15 18 21As/Vb
L/Y
Kt = 0.8
Kt = 0.4
Kt = 0.2
Kt = 0
Santa Monica Breakwater (1960-1988)
Venice Breakwater (1960-1988)
Venice Breakwater
Coronado Wreck (1938)
note: developed for southern California wave climate
salient limits
Figure 9 L/Y versus As/Vb where the latter ratio is a measure of the benefit to anticipatedcost ratio of the structure (benefit is equal to the estimated plan area of the retained salient;
cost is assumed proportional to the volume of materials in a standardized breakwater).
Figure 9 is an attempt to provide a means to objectively evaluate structures that would beaffected by the southern California wave climate with respect to the variables L, the structurelength parallel to shore, Y, the structure distance from the pre-project shoreline, and Kt, thetransmission coefficient of the structure. An inspection of the positions of the prototypestructures indicates a comparison evaluation of proposed structures in southern California wouldprobably be qualitatively correct using this figure. Quantitatively, it would not be too accurate,probably because the standardized structure shape and side slopes used in developing it onlyapproximate the actual shape of any structure, including those prototypes shown in the figure(that is, the uncertainty lies mostly in how Vb was defined). The Venice breakwater and theCoronado wreck are probably both of larger volume than the standardized structure wouldindicate. If so, they would shift to the left in the figure and more nearly coincide with the Kt = 0boundary line. The Venice breakwater in 1935 probably did have a Kt >0 because it was furtheroffshore (Table 3) and subject to larger waves and conceivably to overtopping during highenergy wave events.
Application
An inspection of Figure 9 leads to some guides:
(1) Not unexpectedly, the condition of no wave transmission (through the structure or asovertopping) to a wave transmission coefficient of not more than about 0.25 will likely

15
produce the best benefit-to-cost structure. Structures in this range are all surface piercing.The Santa Monica breakwater which does not have the best benefit to cost ratio, is awashat a MSL-sea surface elevation today, even though its crest is stated to be below MSL(Table 2).
(2) The most effective salient-retaining structure according to this figure would be a surface-piercing breakwater with its exposure 0.2 times the water depth (C = 0.2 zb in Equation 2,so the transmission coefficient is 0.2) with a length to distance from shore ratio of about1.5. The high, surface-piercing structure with a zero transmission coefficient at the samebenefit to cost ratio might retain a tombolo at infrequent times and therefore be lessacceptable due to its potential to be responsible for an adverse downcoast impact. As acaution, see (4) below why a breakwater that allows overtopping might not be such agood idea.
(3) Submerged structures (Kt = 0.4 and more), even very long ones constructed close toshore, will not be very effective from a benefit to cost perspective. In addition they maypose additional problems (see below).
(4) By transmitting wave energy, especially by overtopping, submerged breakwaters or reefsmay cause seabed scour in their lee. Water ponding that tends to increase withovertopping has been found to produce undesirable currents because the water cannotreturn seaward except at the ends of the structure (current velocities are related tofreeboard, structure length, structure width, distance to shore, and wave characteristics).Ponded water tends to move alongshore which increases the movement of sediment awayfrom the salient. For instance, Dean et al. (1994) found the pumping mechanism over alow freeboard artificial reef created a strong current pattern toward the ends of the reefthen offshore in a laboratory study (the PEP reef). Currents approximately followed thediffraction isobars. A channel parallel to and just in the lee of the Santa Monicabreakwater was found in surveys made after the 1982-83 storms (USACE-LAD, 1995)suggesting overtopping during that strong ENSO winter was responsible. Return currentscaused by non-uniform wave heights that created water surface gradients between theshadow zone and the unsheltered adjacent coast, of course, can be reduced by raising thecrest elevation of a breakwater to reduce overtopping or by increasing the permeability ofthe structure. Permeability can also reduce the superelevation of the ponded waterproduced by overtopping.
Figure 9 could be applied at any exposed ocean coastal site in San Diego County. It should beused with caution. Results are at best semi-quantitative and will remain so until the methodologyhas been tested and improved with many more local prototype structures and more detailedanalysis performed. Tide range impacts are implicit in the relationships in the figure, but morework is needed to establish the tidal influence on Kt>0 breakwaters in southern California. Inaddition, a standardized structure shape and a transmission-structure crest relationship were usedin its development and they may not be appropriate for all situations. That said, an examplemight be useful to illustrate a structure/salient relationship somewhere in San Diego County.
Example

16
Assume a 1000-foot long breakwater with a transmission coefficient of 0.2 (C in Equation 2would also be 0.2) is constructed with a 1:1.5 (vertical:horizontal) slope 1000 feet from shore tomaintain a L/Y ratio of 1.0 and minimize the possibility of forming a tombolo. What is the sizeof the salient that will likely be retained in its lee? From Figure 7, it can be seen that the ys/Yratio is 0.5 and since Y=1000 feet, the expected projection of the salient seaward of the pre-project shoreline would be an estimated 500 feet. From Figure 8 its longshore dimension couldbe 3000 feet and its area from Equation 1 would be 750,000 square feet. From the breakwatersketch in Figure 10, the structure volume is calculated to be about 33,000 cubic yards. The crestof this structure would be about 3 feet above MSL. Figure 10 shows a sample breakwater planview and cross section placed in South Carlsbad.

17
Scale in Feet
Figure 10 Offshore Breakwater Conceptual Design

18
SAND RETENTION REEFS
Artificial reefs are three-dimensional features that reduce wave heights in their lee. All reefs inthis discussion have a surfing component as this was identified in the needs section of this studyas being a desired quality. The main difference between breakwaters and reefs is thatbreakwaters reduce wave energy by stopping transmission or breaking the wave while reefsreduce transmitted wave energy through breaking and dissipation. In addition, breakwaterseliminate surfing areas while reefs can actually enhance surfing opportunities. To effect wavedissipation, reefs are wide in the cross-shore direction. Large and especially irregularly shapedreefs refract waves thereby altering their approach direction toward the shoreline. Structure-induced changes in the alongshore flux of smaller reefs are due primarily to an attenuation ordissipation of wave energy as it passes over the structure. If the wave conditions in the lee of anartificial reef are sufficiently altered, they produce a change in the longshore component of waveenergy flux (factor) such that a new shoreline configuration is required to reduce the alongshoregradient in that flux to zero. In this stable condition, the bulge is retained in dynamicequilibrium.
Reefs for sand retention and surfing are generally located nearshore with a crest (or plateau)elevation near the water level. These reefs are either shore connected or offshore, each behavingvery different from the other. Submerged reefs rarely generate substantial adverse effects onneighboring beaches since they have little impact on the longshore littoral drift. Shore connectedreefs allow sand to pass on the beach, seaward, and over the top at times, while offshore reefsallow sand to pass in the lee of the reef. As sediment is carried downcoast, it moves parallel tothe undulating shoreline, just as it is transported parallel to the shoreline on adjacent beaches. Aswith low-crested offshore breakwaters, overtopping may result in the ponding of water in the leeof the structure. Erosive currents may be the consequence, with negative impacts on the retainedsalient.

19
dshc
reef
salient pre-project shoreline
A’ A
wr
ys
L
Y
A’
salient
wr
xs
reef
A mean sea level
Figure 11 Definition Sketch, Artificial Reef and Salient.
Approach
Quantitative guidance to predict the size of a salient in the lee of an artificial reef is difficult tocome by. Few artificial reefs anywhere on earth have successfully retained permanent salients.Salient dimensions are estimated as a function of: (1) reef length, L, or the alongshore dimensionof the reef, (2) reef distance from shore, Y, (3) reef width, wr, normal to shore, and (4) freeboardor water depth over the reef, ds-hc, where ds is the water depth at the reef toe and hc is the crestelevation above the seabed. Uncertainty in the artificial reef results is greater than in the offshorebreakwater estimates because bathymetry over local reefs is not available in enough detail toprovide guidance. Thus, comparison data for the southern California wave climate is rough andmust rely more on the results of laboratory studies and empirical data from coastlines in Japan,New Zealand and Australia. The conceptual design follows the following steps: 1) utilize anyapplicable methods available for design sand retention reefs, 2) augment these data withnaturally occcurring reefs found in southern California, 3) limit the design to those features thatare necessary to perform a cost comparison and to further the discussion. With the lack ofdetailed bathymetry and reef shelf elevations it is not possible to optimize the reef design using acost benefit approach as was done for the breakwaters in the previous section.

20
Existing Methods
In a study of 123 submerged offshore reefs in Australia and New Zealand (Black et al., 1997) adata set was created which allow the prediction of a salient size based on reef dimensions. Thisrelationship, illustrated in Figure 12, uses the dimensionless value, L/Y to predict thedimensionless value of wr/L, leading to the distance of the tip of the salient from the end of thereef. While this figure excludes reef freeboard and transmission coefficients it does allow one todetermine the possible range of reefs observed in nature. It does not however give guidance onthe design of reef freeboard.
0
0.5
1
1.5
2
2.5
3
3.5
4
4.5
5
0 0.5 1 1.5 2 2.5
L/Y
wr/
L
New Zealand & Australia
Uppers
Lowers
Churches
N. Solana
Hazards
Ventura River
San Mateo Pt.
Tijuana River
Power (New Zealand & Australia)
Figure 12 L/Y versus wr/L for submerged reefs in New Zealand and New South Wales,Australia (Black et al., 1997).
To supplement the existing data available in Figure 12, several California reefs were measuredand added to the chart. They are called out in Figure 12 as all other data points below NewZealand and Australia. These California reefs fit the original curve reasonably well and verifythe use of this curve for local design. The California reefs are described in the following section.
Natural California Prototypes
Shore connected reefs exist in southern California in those rather uncommon places where asandy beach follows around a seaward projection of the coast. In most places there is noevidence of a sandy beach in such circumstances. Rarely is there a sandy perimeter around a

21
headland, for example. The most important unknown is the bathymetry (freeboard and widthnormal to shore) of the natural reefs that retain sandy beaches in their lee. Unfortunately, verylittle detailed hydrography has been collected to establish these parameters. The offshore orbarrier type reefs were not found in southern California and are not further included in this study.While they do exist in nature and have been built artificially, examples under the southernCalifornia wave and tide regime are limited. Perhaps the most dramatic salients are in the lee ofrocky stream deltas near the Coast Range. Two examples of which are shown in Figure 13.
Figure 13 Sandy beaches at the perimeter of salients retained in the lee of the rocky deltasof San Mateo Creek (upper photo) and Topanga Creek (lower photo)
Table 5 is a list of the significant characteristics of some naturally occurring reefs. Values arefrom measurements made on topographic maps and aerial photographs. There is inherentuncertainty in these values due to an absence of detailed shallow water bathymetry on the maps.Even where the topographic maps included bathymetry, it was only in the form of –6 and –12feet isobaths. The Y value is to the –12 feet (MSL) isobath. Where topographic maps were not
22
available, the Y value is at the offshore edge of the breakers. As a consequence of theuncertainty inherent in the bathymetry, the reef width values are at best guesses.
Table 5 Characteristics of Natural Reefs
Name / Location Y (feet) wr (feet) ReefArea(acre)
ys (feet) xs (feet) SalientArea(acre)
Salient /Reef
Note
Topanga Creek,CA
? ? ? 650 2800 21 River delta
Tijuana Slough,CA
2200 1200 83 1000 13000 149 1.8 River delta
San Mateo Point,CA
2800 800 37 2000 10500 241 6.6 River delta wCobble cover
Ventura River, CA 3200 1200 110 2000 9000 207 1.9 River deltaMalibu Creek, CA 1700 6500 River deltaUppers, CA 560 310 6 250 1800 5 0.8 Cobble ReefLowers, CA 380 230 3 150 990 2 0.6 Cobble ReefChurches, CA 430 340 6 90 1580 2 0.3 Cobble ReefTabletop Reef,Solana Beach, CA
800 610 9 190 1220 3 0.3 BedrockReef
Hazards, San LuisObispo, CA
840 590 8 250 680 2 0.2 BedrockReef
The reefs in Table 5 can be grouped into two size categories, with river deltas having areas onthe order of 100 acres and the smaller reefs with areas less than 10 acres. The salient to reef arearatio given in Table 5 is useful to compare the relative efficiency of the different reefs atproducing salients. The salient to reef area ratio at river deltas are much higher than for thesmall reefs. This may be attributable to the additional sediment input of the rivers, while thesalient in the lee of the small reef is solely due to the presence of the reef. While the river deltasmay be useful for understanding the natural processes of sand retention reefs, they are beyond aconstructable scale. For this reason the remaining focus remains on the smaller reefs.
Three reefs in this table (Uppers, Lowers, and Churches) are all located within San Mateo Point,also known as Trestles. Both Uppers and Lowers can be seen in the top photograph of Figure 13.These three cobble reefs are generally submerged only becoming emergent during the lowesttides. The estimated plateau or shelf elevation is approximately equal to Mean Lower LowWater (MLLW) plus or minus one foot. Tabletop Reef, located at the north end of SolanaBeach, is comprised of bedrock, with an estimated average shelf elevation of +2 feet MLLWplus or minus 2 feet. It should be noted that the reef at Hazards is located in central Californiaand is therefore subject is a larger wave environment than that found in southern California.Hazards is responsible for a sandy beach backed by a soft sandstone bluff. Based onobservations of reef exposure to varying tides, the estimated shelf ranges from MLLW to +6 feetMLLW plus or minus 2 feet.
All the reef and resulting salient areas are plotted below in Figure 14. This chart makes itpossible to estimate a salient acreage based on the known reef area (assuming the reef is builtsimilar to naturally occuring shapes). Or, if the desired beach area is known, one could estimatethe necessary reef area to hold that size salient.

23
0.1
1
10
100
1000
1 10 100 1000
Reef Area (acre)
Small Reefs
River Deltas
.
best fit
Figure 14 Salient Size as a Function of Reef Plan Area
Artificial Prototypes
Few submerged artificial reefs for surfing or beach retention have been constructed. Noneexcept the PEP reef in Florida has had a substantial impact on the adjacent shoreline. And thePEP reef – so called – was really a submerged breakwater and the beach behind it actuallyeroded at a faster rate than nearby beaches during the short time these concrete units were inplace. Dean and Chen (1996) posit this adverse impact was due to ponding of water in the lee ofthe structure and its release in an alongshore direction may have caused the scour. Table 6 is asummary of available information on artificial reefs. References are included for moreinformation. This table is not used in design, but is included to illustrate the sizes andconfigurations of artificial reefs that have been planned or constructed so far.

24
Table 6 Characteristics of Artificial Reefs
Name /Location
Y(feet)
Wr(feet)
ReefArea(acre)
ys (feet) Xs (feet) SalientArea(acre)
Note/Reference
Pratts Reef, ElSegundo, CA
300 50 0.1 0 0 0 Sand Bags, fieldmeasured
Sunset Beach 800 30 0.8 Notconstructed
Notconstructed
Notconstructed
Not constructed/USACE-LAD, 1999
Imperial Beach 700 11 Notconstructed
Notconstructed
Notconstructed
Not constructed /USACE – LAD,1978
PEP, PalmBeach, FL
240 1 .05 Someerosion
2000 0 Dean and Chen,1996
Natural reef,Palm Beach, FL
900 400 unknown
0 Unknown unknown Chen, 1996
Narrowneck,Queensland,Australia
2500 2000 40 160predicted
Notcomplete
Notcompete
not complete, SandBags, Gold CoastCity Council 2001
Cable Station,WesternAustralia
800 200-250
2 Notapplicable
Notapplicable
Notapplicable
Granite Stone,Parriaratchi, 1997
Sand retention reefs to date have not been designed to emulate natural reefs either in shape orsize. The PEP, Sunset Beach, and Imperial Beach reefs have been more submerged breakwaterswhile Pratte’s Reef is essentially too small and too far from shore to have noticeable impacts onthe shoreline. The structure and size of Pratte’s Reef were measured by Moffatt & Nichol staffprior to and during this study. While Cable Station may have proper crest elevation and size, itwas not designed for sand retention, and is generally too far from shore to impact the beach. Thereef at Narrowneck, Australia was designed primarily for sand retention with surfing as asecondary benefit. While most of the reef is complete, the design crest elevation has not yetbeen reached. Therefore results of the reef on the shoreline have yet to be determined.
Conceptual Design
The bare minimum required to develop a cost comparison of reefs, breakwaters and beaches aregenerally the reef material, volume, and the resulting salient pre-fill volume. Further, a graphicaldescription of the proposed reef and salient geometry are useful for discussion.
As mentioned earlier, a shore connected reef is preferred over an offshore or barrier type reef.This has four major benefits:1) a shore connected reef reduces diffracted wave impacts to the salient which would reduce
salient size;2) a shore connected reef forces any water ponding to occur over the reef reducing the
possiblitiy of scouring currents in the lee;3) the volume of a reef built close to shore is less because of the shallower water. This results is
smaller construction costs; and

25
4) there are natural examples of shore connected reefs in southern California from which designcriteria can be determined.
The major drawback for a shore connected reef is that it would make swimming more difficultdue to the close proximity of a hard rock substrate. For these reasons conceptual designproceeds with the assumption of a shore connected reef with a specialty beach focused on surfingat the exclusion of swimming. If it should be determined that a specialty beach is not feasible,the offshore reef concept is not excluded. The offshore reef would require a greater level offunding and research. With the assumption that the reef should be constructable, this brings therelative scale or size of the reef to those labeled “small reefs” in Figure 14.
Example
Assume a middle sized reef from the “small reefs” shown in Figure 14 and Table 5. With anarea of 5 acres, using Figure 14 results in a salient area ofs 2 acres. An L/Y value of 1.5 liesbetween the data points of Uppers and Lowers in Figure 12. The resulting wr/L value is 0.35.Multiplying the average wr/A values of "small reefs" by the reef area yields a wr of 318 feet andan L of 909 feet. Knowing L and L/Y, Y can be found as 606 feet. Modifying the shape from arectangle to a more triangular planform while maintaining the wr distance and plan area makesthe reef more suitable for surfing while retaining the salient holding features. The conceptualreef plan and cross section is shown in Figure 15 overlayed on a typical cross shore profile likethat found at CB 760 in South Carlsbad. Since little is known about southern Californiaprototype reef bathymetry some assumptions will be made based on required surfing parameters.The offshore slope is 1:20 (vertical:horizontal) based on recommendations by Walker (1974).The shelf elevation ranges from –2 feet MLLW to +1 feet MLLW. The shore side of this reefwould be exposed during most low tides. A pre-filled salient with the same slope as the existingbeach is recommended to preclude sand loss from nearby beaches. Fine tuning the reef toimprove surfing characteristics is a more straightforward part of reef design and not required forthis level of analysis. Extensive discussion of surfing parameters is given by Walker (1974,1997).

26
South C
arlsbad
North
South
South C
arlsbad
DRYBEACHAREABEACH
SLOPEREEF
Figure 15 Sand Retention Reef Conceptual Design