environmental impact report/ review ......environmental impact report/ review environmental...
TRANSCRIPT
E N V I R O N M E N T A L I M P A C T R E P O R T /R E V I E W E N V I R O N M E N T A L A S S E S S M E N T
f o r t h e
San Diego RegionalBeach Sand Project
J U N E 2 0 0 0
F I N A L
San Diego Association of Governments (SANDAG)401 B Street, Suite 800San Diego, CA 92101-4231www.sandag.cog.ca.us
United States Department of the NavySouthwest Division Naval Facilities EngineeringCommand1220 Pacific HighwaySan Diego, CA 92132
MEMBER AGENCIES: Cities of Carlsbad, Chula Vista, Coronado, Del Mar, El Cajon, Encinitas, Escondido, Imperial Beach, La MesaLemon Grove, National City, Oceanside, Poway, San Diego, San Marcos, Santee, Solana Beach, Vista, and County of San Diego.
ADVISORY/LIAISON MEMBERS: California Department of Transportation, Metropolitan Transit Development Board,North San Diego County Transit Development Board, U.S. Department of Defense, San Diego Unified Port District,
San Diego County Water Authority, and Tijuana/Baja California/Mexico
THE SAN DIEGO REGIONAL BEACH SAND PROJECT
FINAL ENVIRONMENTAL IMPACT REPORT/ENVIRONMENTAL ASSESSMENT
June 2000
State Clearinghouse Number 1999041104

Board of DirectorsSAN DIEGO ASSOCIATION OF GOVERNMENTS
The 18 cities and county government are SANDAG serving as the forumfor regional decision-making. The Association builds consensus, makes
strategic plans, obtains and allocates resources, and provides information on abroad range of topics pertinent to the region’s quality of life.
CHAIRMAN: Hon. Art MadridVICE CHAIR: Hon. Ramona Finnila
SECRETARY-EXECUTIVE DIRECTOR: Kenneth E. Sulzer
CITY OF CARLSBADHon. Ramona Finnila, Councilmember(A) Hon. Bud Lewis, Mayor(A) Hon. Matt Hall, Mayor Pro Tem
CITY OF CHULA VISTAHon. Shirley Horton, Mayor(A) Hon. Mary Salas, Councilmember
CITY OF CORONADOHon. Thomas Smisek, Mayor(A) Hon. Chuck Marks, Councilmember
CITY OF DEL MARHon. Richard Earnest, Councilmember(A) Hon. Crystal Crawford, Deputy Mayor
CITY OF EL CAJONHon. Richard Ramos, Councilmember(A) Hon. Mark Lewis, Mayor
CITY OF ENCINITASHon. Dennis Holz, Councilmember(A) Hon. Christy Guerin, Councilmember
CITY OF ESCONDIDOHon. Keith Beier, Mayor Pro Tem(A) Hon. June Rady, Councilmember
CITY OF IMPERIAL BEACHHon. Diane Rose, Mayor(A) Hon. Mayda Winter, Councilmember(A) Hon. Patricia McCoy, Mayor Pro Tem
CITY OF LA MESAHon. Art Madrid, Mayor(A) Hon. Barry Jantz, Councilmember(A) Hon. Jay La Suer, Vice Mayor
CITY OF LEMON GROVEHon. Mary Sessom, Mayor(A) Hon. Jill Greer, Councilmember
CITY OF NATIONAL CITYHon. Ron Morrison, Councilmember(A) Hon. George H. Waters, Mayor
CITY OF OCEANSIDEHon. Carol McCauley, Deputy Mayor(A) Hon. Colleen O’Harra, Councilmember
CITY OF POWAYHon. Don Higginson, Deputy Mayor(A) Hon. Mickey Cafagna, Mayor(A) Hon. Robert Emery, Councilmember
CITY OF SAN DIEGOHon. Susan Golding, Mayor(A) Hon. Byron Wear, Councilmember(A) Hon. Valerie Stallings, Councilmember
CITY OF SAN MARCOSHon. Hal Martin, Councilmember(A) Hon. Pia Harris-Ebert, Vice Mayor
CITY OF SANTEEHon. Jack Dale, Mayor(A) Hon. Hal Ryan, Vice Mayor(A) Hon. Jim Bartell, Councilmember
CITY OF SOLANA BEACHHon. Marion Dodson, Councilmember(A) Hon. Joe Kellejian, Mayor(A) Hon. Marcia Smerican, Councilmember
CITY OF VISTAHon. Gloria E. McClellan, Mayor(A) Hon. Judy Ritter, Mayor Pro Tem
COUNTY OF SAN DIEGOHon. Pam Slater, Supervisor(A) Hon. Greg Cox, Supervisor
STATE DEPARTMENT OF TRANSPORTATION(Advisory Member)JoÑe Medina, Director(A) Gary Gallegos, District 11 Director
METROPOLITAN TRANSIT DEVELOPMENT BOARD(Advisory Member)
NORTH SAN DIEGO COUNTY TRANSITDEVELOPMENT BOARD(Advisory Member)
U.S. DEPARTMENT OF DEFENSE(Liaison Member)CAPT Robert L. Phillips, CEC, USNCommander, Southwest DivisionNaval Facilities Engineering Command(A) CAPT Robert Schenk, CEC, USN
SAN DIEGO UNIFIED PORT DISTRICT(Advisory Member)Jess Van Deventer, Commissioner
SAN DIEGO COUNTY WATER AUTHORITY(Advisory Member)Frank Chenelle(A) John Fowler
TIJUANA/BAJA CALIFORNIA/MEXICO(Advisory Member)Hon. Gabriela Torres RamirezConsul General of Mexico
Revised March 6, 2000
ACKNOWLEDGMENTS
The San Diego Regional Beach Sand Project Final Environmental Impact Report/ReviewEnvironmental Assessment was prepared by KEA Environmental for SANDAG and the U.S.Navy. The Shoreline Erosion Committee advises SANDAG on coastal issues, and has guidedthe development of the Regional Beach Sand Project. The Shoreline Erosion Committeemembership is:
Hon. Ann Kulchin, Chair, City of CarlsbadHon. Chuck Marks, City of CoronadoHon. Crystal Crawford, City of Del MarHon. James Bond, City of EncinitasHon. Dan Malcolm, City of Imperial BeachHon. Colleen O’Hara, City of OceansideHon. Harry Mathis, City of San DiegoHon. Joe Kellejian, City of Solana BeachHon. Pam Slater, County of San DiegoComm. Jess Van Deventer, San Diego Unified Port DistrictDan Muslin, U.S. Navy
The following staff of the San Diego Association of Governments participated in theenvironmental document process:
Rob Rundle, Senior Planner, Project ManagerSteve Sachs, Senior PlannerGreg Smith, Intern
The environmental document was prepared by:
KEA EnvironmentalMEC Analytical SystemsMoffatt and Nichol EngineersGeoArch Marine Archaeology Consultants
FINAL ENVIRONMENTAL IMPACT REPORT (FEIR)/ENVIRONMENTAL ASSESSMENT (EA)
FOR THE REGIONAL BEACH SAND PROJECTSAN DIEGO REGION, CALIFORNIA
Lead Agency for the EIR: San Diego Association of Governments (SANDAG)
Lead Agency for the EA: Department of the Navy
Title of Proposed Action: Regional Beach Sand Project
Affected Jurisdictions: Cities of Oceanside, Carlsbad, Encinitas, Solana Beach, Del Mar,San Diego, and Imperial Beach, all
located in the State of California
Designation: Final EIR/EA Submitted Pursuant to Public Resources Code 21000 et seq.,14 California Code Regulations 15000 et seq., and 42 U.S.C. 4332(2)(C)
State Clearinghouse #: 1999041104
ABSTRACT
This joint EIR/EA has been prepared in accordance with California Environmental Quality Act (CEQA) andNational Environmental Policy Act (NEPA) statutes and guidelines to dredge and place approximately 2million cubic yards (cy) of sand on a maximum of 13 receiver sites in the San Diego region. The local CEQAproject evaluated in this EIR/EA is the proposed dredging and replenishment of up to 13 receiver sites withbeach-quality sand. The NEPA federal action is necessary because a majority of the project’s fundingderives from the federal government, as appropriated by Congress in fiscal year 1998 SupplementalAppropriations and Recission Act.
The EIR/EA evaluates two alternatives. Alternative 1 would involve replenishment of 12 receiver sites usingapproximately 2 million cy of dredged sediment from six borrow sites. There would be two possibleconstruction variations: (a) would occur on a 24-hour, 7-day per week schedule and (b) would occur withrestrictions on construction times and days consistent with local noise ordinances, where applicable.Alternative 2 would involve replenishment of nine receiver sites using approximately 2 million cy of dredgedsediment from six borrow sites (one of the receiver sites proposed under Alternative 2 is not proposed underAlternative 1). There would also be two possible construction variations as described for Alternative 1. Alsoevaluated is the No Action Alternative, in which no beach replenishment or dredging activities would beimplemented. This EIR/EA analyzes potential environmental impacts relating to geology and soils, coastalwetlands, water resources, biological resources, cultural resources, land and water use, aesthetics,socioeconomics, public health and safety, structures and utilities, traffic, air quality, and noise. Although nolong-term significant impacts are expected, a post-construction monitoring plan would be implemented toverify no significant impacts to marine biological resources, lagoons, and underwater archaeologicalresources.
The SANDAG contact person is Rob Rundle, Senior Regional Planner, SANDAG, 401 B Street, Suite 800,San Diego, CA 92101-4231. Telephone: (619) 595-5649, fax: (619) 595-5305, and email:[email protected].
Page 1 of 3
DATE: July 17, 2000
TO: Interested Agencies, Organizations, and Individuals
FROM: SANDAG Staff
SUBJECT: Changes Incorporated into the Final Environmental Impact Report/EnvironmentalAssessment (EIR/EA) for the San Diego Regional Beach Sand Project (RBSP)
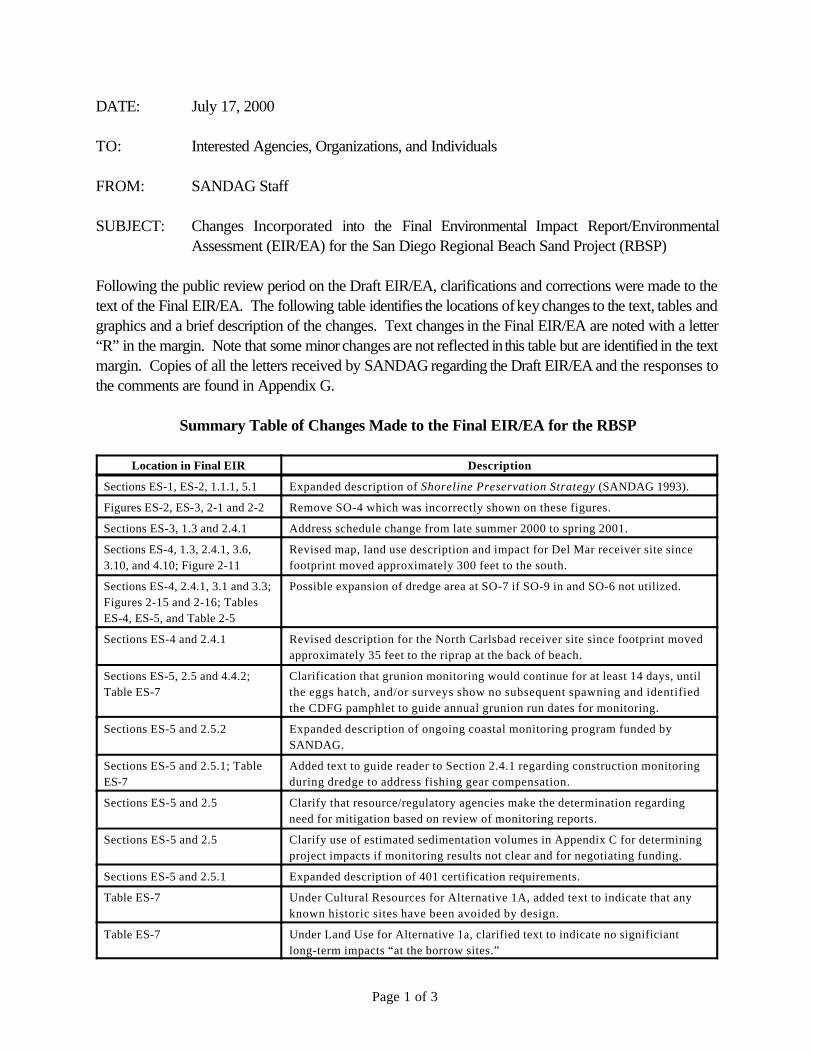
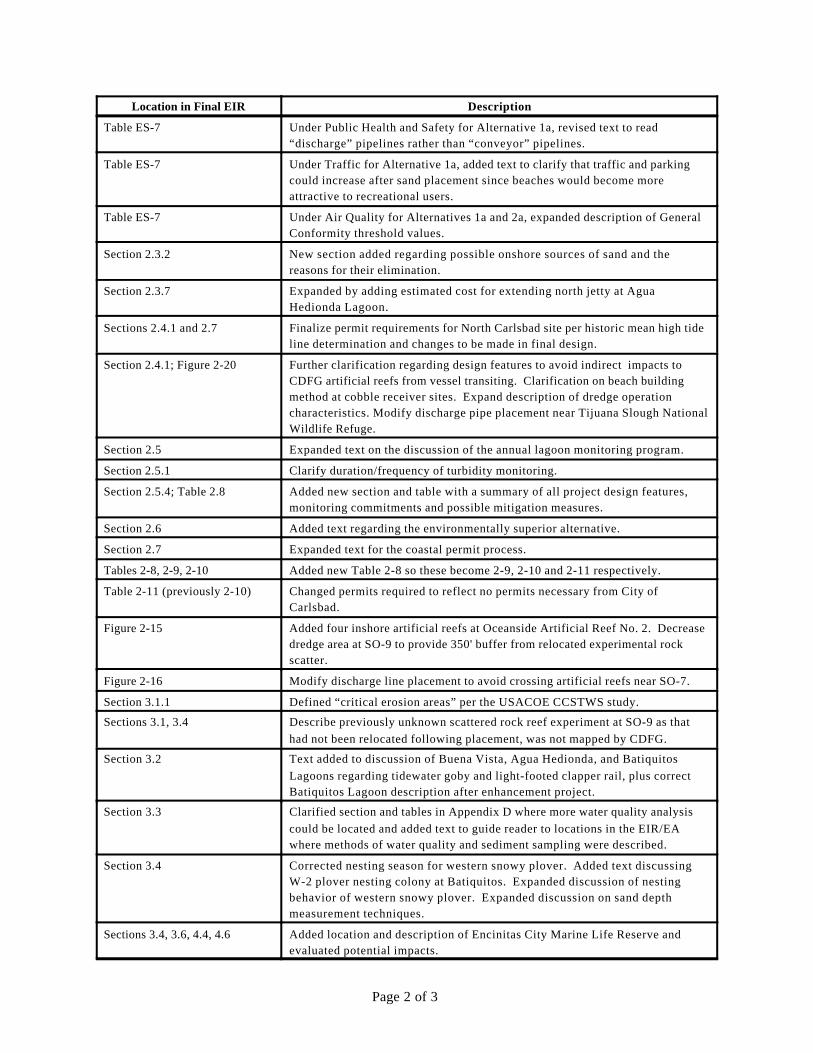
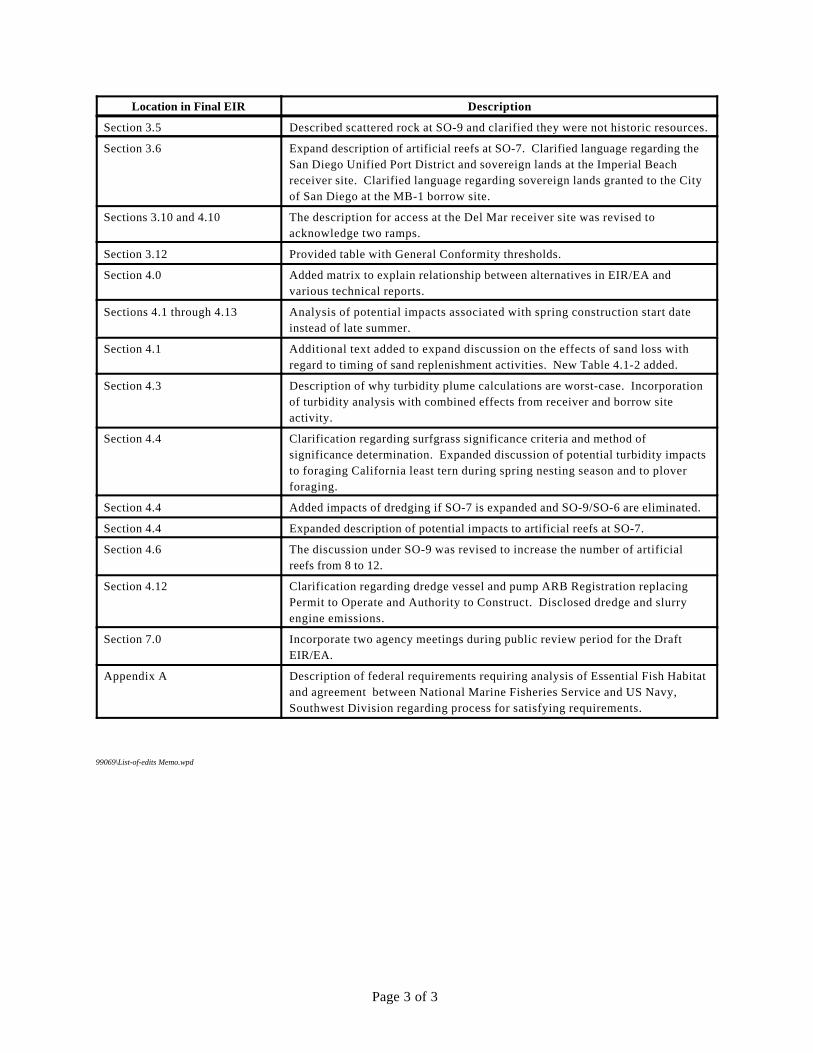
Following the public review period on the Draft EIR/EA, clarifications and corrections were made to thetext of the Final EIR/EA. The following table identifies the locations of key changes to the text, tables andgraphics and a brief description of the changes. Text changes in the Final EIR/EA are noted with a letter“R” in the margin. Note that some minor changes are not reflected in this table but are identified in the textmargin. Copies of all the letters received by SANDAG regarding the Draft EIR/EA and the responses tothe comments are found in Appendix G.
Summary Table of Changes Made to the Final EIR/EA for the RBSP
Location in Final EIR Description
Sections ES-1, ES-2, 1.1.1, 5.1 Expanded description of Shoreline Preservation Strategy (SANDAG 1993).
Figures ES-2, ES-3, 2-1 and 2-2 Remove SO-4 which was incorrectly shown on these figures.
Sections ES-3, 1.3 and 2.4.1 Address schedule change from late summer 2000 to spring 2001.
Sections ES-4, 1.3, 2.4.1, 3.6,3.10, and 4.10; Figure 2-11
Revised map, land use description and impact for Del Mar receiver site sincefootprint moved approximately 300 feet to the south.
Sections ES-4, 2.4.1, 3.1 and 3.3;Figures 2-15 and 2-16; TablesES-4, ES-5, and Table 2-5
Possible expansion of dredge area at SO-7 if SO-9 in and SO-6 not utilized.
Sections ES-4 and 2.4.1 Revised description for the North Carlsbad receiver site since footprint movedapproximately 35 feet to the riprap at the back of beach.
Sections ES-5, 2.5 and 4.4.2;Table ES-7
Clarification that grunion monitoring would continue for at least 14 days, untilthe eggs hatch, and/or surveys show no subsequent spawning and identifiedthe CDFG pamphlet to guide annual grunion run dates for monitoring.
Sections ES-5 and 2.5.2 Expanded description of ongoing coastal monitoring program funded bySANDAG.
Sections ES-5 and 2.5.1; TableES-7
Added text to guide reader to Section 2.4.1 regarding construction monitoringduring dredge to address fishing gear compensation.
Sections ES-5 and 2.5 Clarify that resource/regulatory agencies make the determination regardingneed for mitigation based on review of monitoring reports.
Sections ES-5 and 2.5 Clarify use of estimated sedimentation volumes in Appendix C for determiningproject impacts if monitoring results not clear and for negotiating funding.
Sections ES-5 and 2.5.1 Expanded description of 401 certification requirements.
Table ES-7 Under Cultural Resources for Alternative 1A, added text to indicate that anyknown historic sites have been avoided by design.
Table ES-7 Under Land Use for Alternative 1a, clarified text to indicate no significiantlong-term impacts “at the borrow sites.”
Location in Final EIR Description
Page 2 of 3
Table ES-7 Under Public Health and Safety for Alternative 1a, revised text to read“discharge” pipelines rather than “conveyor” pipelines.
Table ES-7 Under Traffic for Alternative 1a, added text to clarify that traffic and parkingcould increase after sand placement since beaches would become moreattractive to recreational users.
Table ES-7 Under Air Quality for Alternatives 1a and 2a, expanded description of GeneralConformity threshold values.
Section 2.3.2 New section added regarding possible onshore sources of sand and thereasons for their elimination.
Section 2.3.7 Expanded by adding estimated cost for extending north jetty at AguaHedionda Lagoon.
Sections 2.4.1 and 2.7 Finalize permit requirements for North Carlsbad site per historic mean high tideline determination and changes to be made in final design.
Section 2.4.1; Figure 2-20 Further clarification regarding design features to avoid indirect impacts toCDFG artificial reefs from vessel transiting. Clarification on beach buildingmethod at cobble receiver sites. Expand description of dredge operationcharacteristics. Modify discharge pipe placement near Tijuana Slough NationalWildlife Refuge.
Section 2.5 Expanded text on the discussion of the annual lagoon monitoring program.
Section 2.5.1 Clarify duration/frequency of turbidity monitoring.
Section 2.5.4; Table 2.8 Added new section and table with a summary of all project design features,monitoring commitments and possible mitigation measures.
Section 2.6 Added text regarding the environmentally superior alternative.
Section 2.7 Expanded text for the coastal permit process.
Tables 2-8, 2-9, 2-10 Added new Table 2-8 so these become 2-9, 2-10 and 2-11 respectively.
Table 2-11 (previously 2-10) Changed permits required to reflect no permits necessary from City ofCarlsbad.
Figure 2-15 Added four inshore artificial reefs at Oceanside Artificial Reef No. 2. Decreasedredge area at SO-9 to provide 350' buffer from relocated experimental rockscatter.
Figure 2-16 Modify discharge line placement to avoid crossing artificial reefs near SO-7.
Section 3.1.1 Defined “critical erosion areas” per the USACOE CCSTWS study.
Sections 3.1, 3.4 Describe previously unknown scattered rock reef experiment at SO-9 as thathad not been relocated following placement, was not mapped by CDFG.
Section 3.2 Text added to discussion of Buena Vista, Agua Hedionda, and BatiquitosLagoons regarding tidewater goby and light-footed clapper rail, plus correctBatiquitos Lagoon description after enhancement project.
Section 3.3 Clarified section and tables in Appendix D where more water quality analysiscould be located and added text to guide reader to locations in the EIR/EAwhere methods of water quality and sediment sampling were described.
Section 3.4 Corrected nesting season for western snowy plover. Added text discussingW-2 plover nesting colony at Batiquitos. Expanded discussion of nestingbehavior of western snowy plover. Expanded discussion on sand depthmeasurement techniques.
Sections 3.4, 3.6, 4.4, 4.6 Added location and description of Encinitas City Marine Life Reserve andevaluated potential impacts.
Location in Final EIR Description
Page 3 of 3
Section 3.5 Described scattered rock at SO-9 and clarified they were not historic resources.
Section 3.6 Expand description of artificial reefs at SO-7. Clarified language regarding theSan Diego Unified Port District and sovereign lands at the Imperial Beachreceiver site. Clarified language regarding sovereign lands granted to the Cityof San Diego at the MB-1 borrow site.
Sections 3.10 and 4.10 The description for access at the Del Mar receiver site was revised toacknowledge two ramps.
Section 3.12 Provided table with General Conformity thresholds.
Section 4.0 Added matrix to explain relationship between alternatives in EIR/EA andvarious technical reports.
Sections 4.1 through 4.13 Analysis of potential impacts associated with spring construction start dateinstead of late summer.
Section 4.1 Additional text added to expand discussion on the effects of sand loss withregard to timing of sand replenishment activities. New Table 4.1-2 added.
Section 4.3 Description of why turbidity plume calculations are worst-case. Incorporationof turbidity analysis with combined effects from receiver and borrow siteactivity.
Section 4.4 Clarification regarding surfgrass significance criteria and method ofsignificance determination. Expanded discussion of potential turbidity impactsto foraging California least tern during spring nesting season and to ploverforaging.
Section 4.4 Added impacts of dredging if SO-7 is expanded and SO-9/SO-6 are eliminated.
Section 4.4 Expanded description of potential impacts to artificial reefs at SO-7.
Section 4.6 The discussion under SO-9 was revised to increase the number of artificialreefs from 8 to 12.
Section 4.12 Clarification regarding dredge vessel and pump ARB Registration replacingPermit to Operate and Authority to Construct. Disclosed dredge and slurryengine emissions.
Section 7.0 Incorporate two agency meetings during public review period for the DraftEIR/EA.
Appendix A Description of federal requirements requiring analysis of Essential Fish Habitatand agreement between National Marine Fisheries Service and US Navy,Southwest Division regarding process for satisfying requirements.
99069\List-of-edits Memo.wpd
Acronyms and Abbreviations
Regional Beach Sand Project EIR/EA Page i99-69\sect-toc.wpd 7/17/00
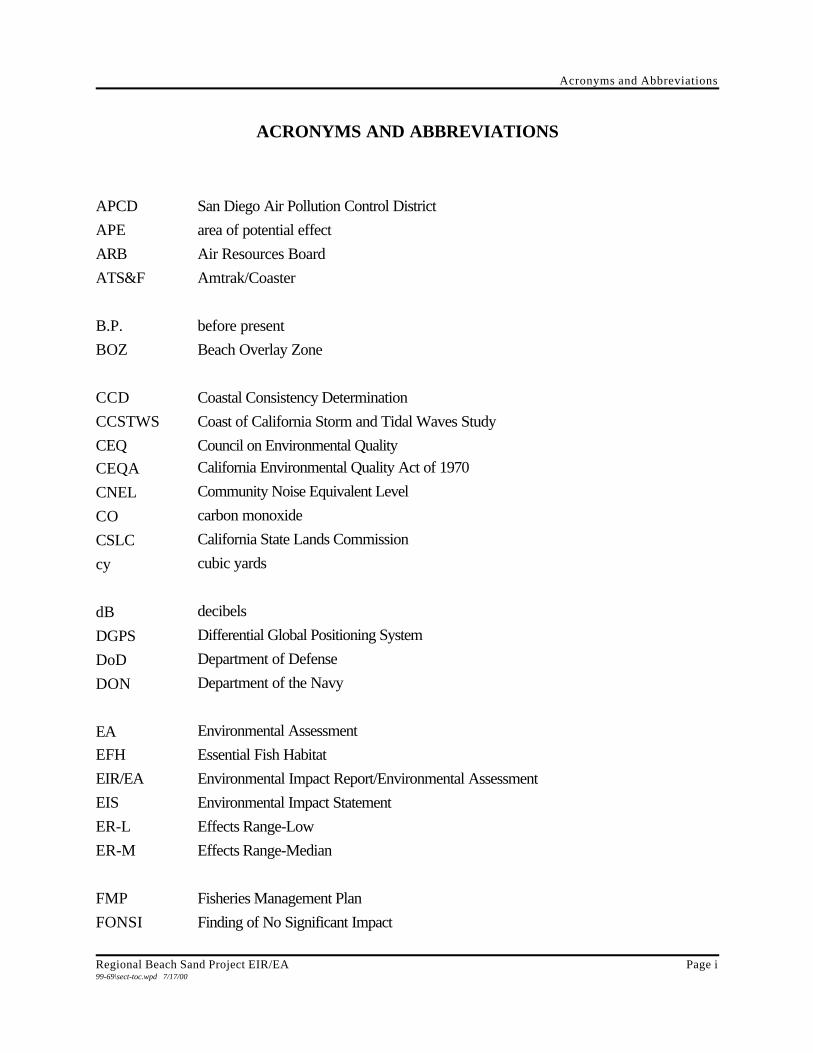
ACRONYMS AND ABBREVIATIONS
APCD San Diego Air Pollution Control District
APE area of potential effect
ARB Air Resources Board
ATS&F Amtrak/Coaster
B.P. before present
BOZ Beach Overlay Zone
CCD Coastal Consistency Determination
CCSTWS Coast of California Storm and Tidal Waves Study
CEQ Council on Environmental Quality
CEQA California Environmental Quality Act of 1970
CNEL Community Noise Equivalent Level
CO carbon monoxide
CSLC California State Lands Commission
cy cubic yards
dB decibels
DGPS Differential Global Positioning System
DoD Department of Defense
DON Department of the Navy
EA Environmental Assessment
EFH Essential Fish Habitat
EIR/EA Environmental Impact Report/Environmental Assessment
EIS Environmental Impact Statement
ER-L Effects Range-Low
ER-M Effects Range-Median
FMP Fisheries Management Plan
FONSI Finding of No Significant Impact
Acronyms and Abbreviations
Page ii Regional Beach Sand Project EIR/EA99-69\sect-toc.wpd 7/17/00
GENESIS Generalized Model for Simulating Shoreline Change
GIS Geographic Information System
HDPE HDPE The line may be a combination of plastic
LCP Local Coastal Program
Ldn or DNL Day-Night Average noise level
LUP Land Use Plan
MBAR Mission Bay Artificial Reef
MCB Unites States Marine Corps Base
mg/l milligrams per liter
MLLW mean lower low water
MMS Mineral Management Service
MSL mean sea level
NAAQS national ambient air quality standards
Navy Department of the Navy
NEPA National Environmental Policy Act of 1969
NHPA National Historic Preservation Act
NMFS National Marine Fisheries Service
NO2 nitrogen dioxide
NOAA National Oceanographic and Atmospheric Administration
NOP Notice of Preparation
NOx oxides of nitrogen
NRHP National Register of Historic Places
NTU national turbidity units
O3 ozone
PAHs polycyclic aromatic hydrocarbons
Pb lead
PCBs polychlorinated biphenyls
PM10 particulate matter equal to or less than 10 microns in size

Acronyms and Abbreviations
Regional Beach Sand Project EIR/EA Page iii99-69\sect-toc.wpd 7/17/00
PM2.5 fine particulate matter equal to or less than 2.5 microns in size
ppm parts per million
ppt parts per thousand
RAQS Regional Air Quality Strategies
RONA Record of Non-Applicability
ROV remotely operated vehicle
RWQCB Regional Water Quality Control Board
SANDAG San Diego Association of Governments
SCE Southern California Edison
SDAB San Diego Air Basin
SDUPD San Diego Unified Port District
SEC Shoreline Erosion Committee
SIP State Implementation Plan
SO2 sulfur dioxide
SONGS San Onofre Nuclear Generating Station
SPCC Spill Prevention Control and Counter-Measure Plan
SWPPP Stormwater Pollution Prevention Plan
TIN triangulated irregular network
USACOE U.S. Army Corps of Engineers
USEPA U.S. Environmental Protection Agency
USFWS U.S. Fish and Wildlife Service
VOC volatile organic compounds
[µm] microns
Executive Summary
Regional Beach Sand Project EIR/EA Page ES-199-69\SANDAG EIREA es.wpd 7/17/00
EXECUTIVE SUMMARY
ES-1 INTRODUCTION/BACKGROUND
This joint Environmental Impact Report/Environmental Assessment (EIR/EA) addresses the potential
environmental consequences of the Regional Beach Sand Project which proposes dredging and placement
of sand on numerous potential receiver sites in the San Diego region. This document has been prepared
jointly by the San Diego Association of Governments (SANDAG) (local lead agency) and the U.S.
Department of the Navy (federal lead agency) in accordance with the California Environmental Quality Act
of 1970 (CEQA) statutes (Cal. Pub. Res. Code, § 21000 et seq., as amended) and implementing
guidelines (Cal. Code Regs., Title 14, § 15000 et seq. (1998)); the National Environmental Policy Act of
1969 (NEPA) (42 U.S.C. § 4332 (1994)) in accordance with the Council on Environmental Quality
(CEQ) regulations implementing NEPA (40 C.F.R. §§1500-1508); and U.S. Navy regulations
implementing NEPA (32 C.F.R. Part 775).
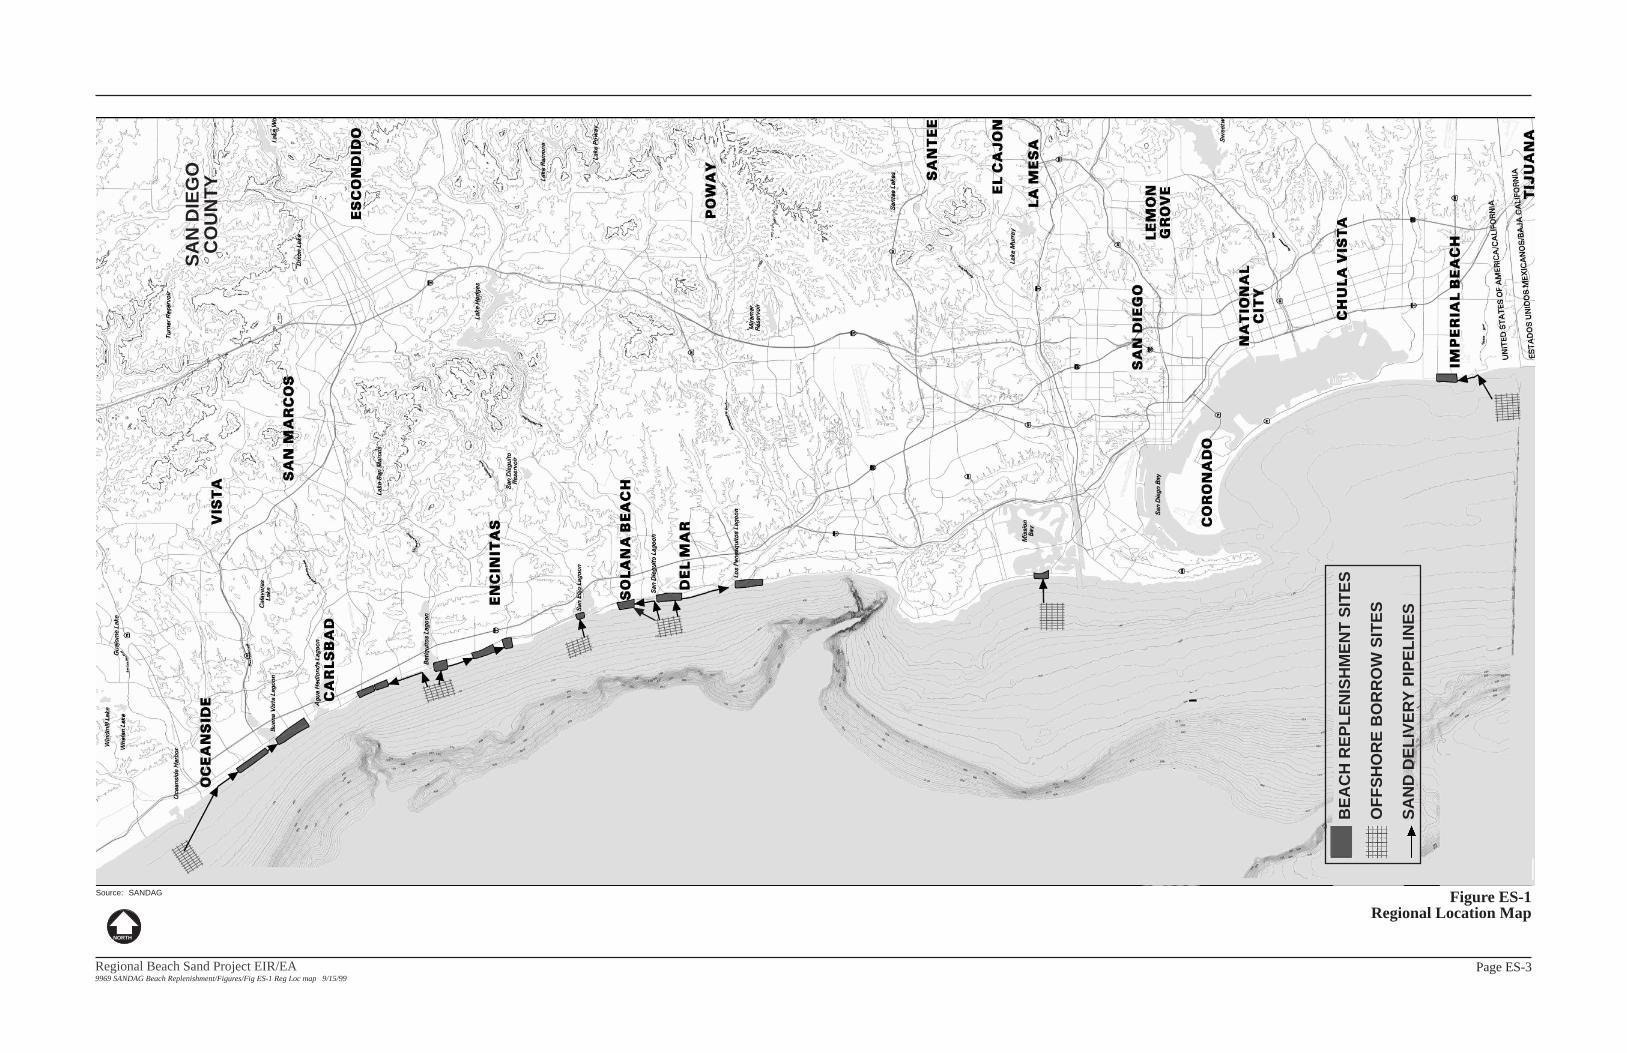
The proposed action is to replenish approximately 2 million cubic yards (cy) of clean beach-quality sand
on up to 13 receiver sites in the San Diego region. The receiver sites are located from Oceanside in the
north to Imperial Beach in the south. Sand would be dredged from up to six offshore borrow sites. A
regional location map, including the proposed receiver sites and sand borrow sites, is shown in Figure ES-
1.
In 1993, SANDAG prepared the Shoreline Preservation Strategy for the San Diego Region, which
identified regional coastal areas with critical shoreline problems and recommended a strategy to address
the issue. That strategy involved various components including beach replenishment, sand retention R
structures, property protection structures, and policies regarding the use of the shoreline and bluff tops. R
Independent of that report, the Navy began to analyze a separate action in the Final Environmental
Impact Statement (EIS) for the Development of Facilities in San Diego/ Coronado to Support the
Homeporting of One NIMITZ Class Aircraft Carrier (Department of the Navy 1995). In order to
accommodate the carrier, the Navy proposed to dredge the carrier berthing area, turning basin, and the
San Diego Bay navigation channel. A portion of the dredged sediment was initially believed to be suitable
for beach replenishment. As one option to dispose of the dredged material from the Homeporting project,
the Navy evaluated nine beach receiver sites in the San Diego region in that EIS.
Executive Summary
Page ES-2 Regional Beach Sand Project EIR/EA99-69\SANDAG EIREA es.wpd 7/17/00
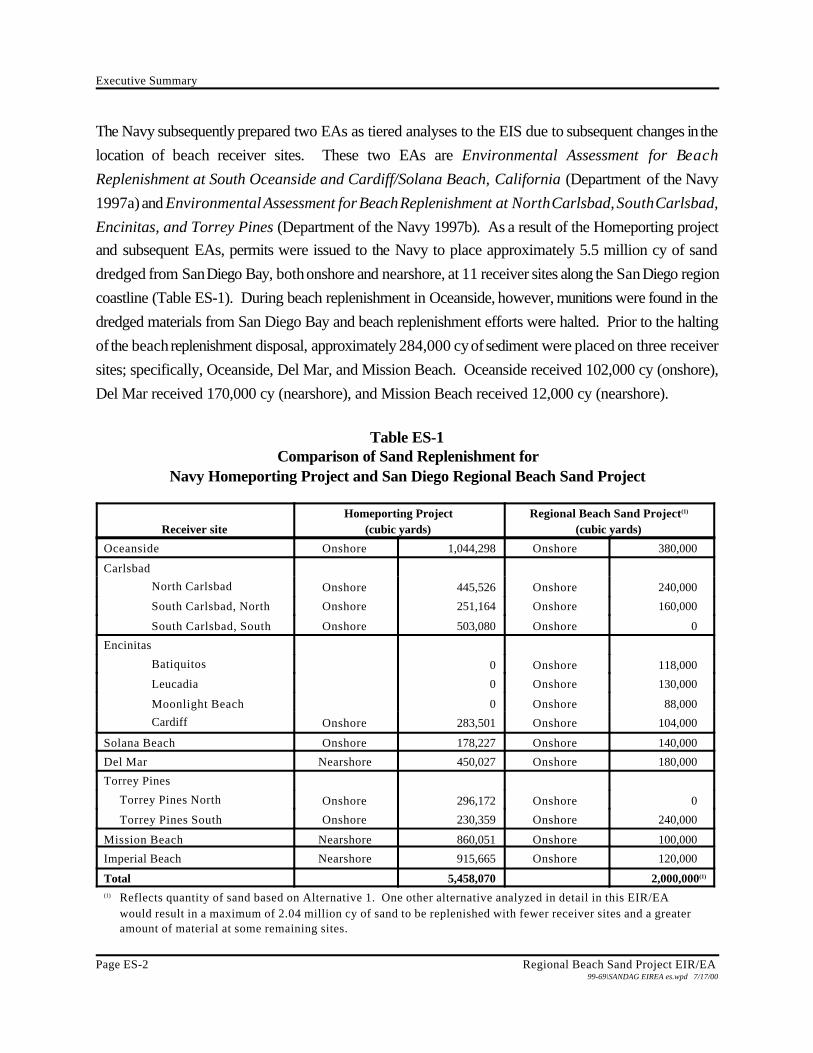
The Navy subsequently prepared two EAs as tiered analyses to the EIS due to subsequent changes in the
location of beach receiver sites. These two EAs are Environmental Assessment for Beach
Replenishment at South Oceanside and Cardiff/Solana Beach, California (Department of the Navy
1997a) and Environmental Assessment for Beach Replenishment at North Carlsbad, South Carlsbad,
Encinitas, and Torrey Pines (Department of the Navy 1997b). As a result of the Homeporting project
and subsequent EAs, permits were issued to the Navy to place approximately 5.5 million cy of sand
dredged from San Diego Bay, both onshore and nearshore, at 11 receiver sites along the San Diego region
coastline (Table ES-1). During beach replenishment in Oceanside, however, munitions were found in the
dredged materials from San Diego Bay and beach replenishment efforts were halted. Prior to the halting
of the beach replenishment disposal, approximately 284,000 cy of sediment were placed on three receiver
sites; specifically, Oceanside, Del Mar, and Mission Beach. Oceanside received 102,000 cy (onshore),
Del Mar received 170,000 cy (nearshore), and Mission Beach received 12,000 cy (nearshore).
Table ES-1Comparison of Sand Replenishment for
Navy Homeporting Project and San Diego Regional Beach Sand Project
Receiver siteHomeporting Project
(cubic yards)Regional Beach Sand Project(1)
(cubic yards)
Oceanside Onshore 1,044,298 Onshore 380,000
Carlsbad
North Carlsbad Onshore 445,526 Onshore 240,000
South Carlsbad, North Onshore 251,164 Onshore 160,000
South Carlsbad, South Onshore 503,080 Onshore 0
Encinitas
Batiquitos 0 Onshore 118,000
Leucadia 0 Onshore 130,000
Moonlight Beach 0 Onshore 88,000
Cardiff Onshore 283,501 Onshore 104,000
Solana Beach Onshore 178,227 Onshore 140,000
Del Mar Nearshore 450,027 Onshore 180,000
Torrey Pines
Torrey Pines North Onshore 296,172 Onshore 0
Torrey Pines South Onshore 230,359 Onshore 240,000
Mission Beach Nearshore 860,051 Onshore 100,000
Imperial Beach Nearshore 915,665 Onshore 120,000
Total 5,458,070 2,000,000(1)
(1) Reflects quantity of sand based on Alternative 1. One other alternative analyzed in detail in this EIR/EAwould result in a maximum of 2.04 million cy of sand to be replenished with fewer receiver sites and a greateramount of material at some remaining sites.
4.0 Environmental Consequences
Source: SANDAG
Page ES-3
NORTH
Figure ES-1Regional Location Map
BE
AC
H R
EP
LE
NIS
HM
EN
T S
ITE
S
OF
FS
HO
RE
BO
RR
OW
SIT
ES
SA
ND
DE
LIV
ER
Y P
IPE
LIN
ES
SA
N D
IEG
OC
OU
NT
Y
Regional Beach Sand Project EIR/EA9969 SANDAG Beach Replenishment/Figures/Fig ES-1 Reg Loc map 9/15/99

Executive Summary
Page ES-4 Regional Beach Sand Project EIR/EA99-69\SANDAG EIREA es.wpd 7/17/00
The proposed Regional Beach Sand Project proposes placement of less total material (2 million vs. 5.5
million cy) over generally the same receiver sites as the Navy’s permitted project. The proposed project
does differ in that the sand source has changed from dredged material in San Diego Bay to dredged
material from six offshore borrow sites, and additional receiver site locations have been added. Table ES-1
provides a comparison between the Homeporting project which was permitted and partially implemented,
and the alternative under the Regional Beach Sand Project with the maximum number of receiver sites.
ES-2 PURPOSE AND NEED
The purpose of the proposed beach replenishment project is to replenish beaches in accordance with the
request submitted to the Navy by SANDAG’s Shoreline Erosion Committee (SEC) in 1996. The 1993
Shoreline Preservation Strategy for the San Diego Region (SANDAG 1993) identified regional coastal
areas with critical shoreline erosion problems. The Shoreline Preservation Strategy is a strategy with a R
menu of solutions to address shoreline erosion including beach building by placing large amounts of sand R
on eroded beaches, structures such as groin fields to help hold sand in place, structures such as seawalls R
and sand berms to protect property, and policies and regulations regarding the use of the shoreline and its R
development such as bluff top building setbacks. Further, these tactics are divided into regional scale R
actions (beach building, redistributing sand via groins, breakwaters, etc.) and local scale methods (requiring R
setbacks, bluff top erosion management via irrigation controls, seawalls and revetments). The SEC has R
used this strategy as a basis for identifying up to 13 receiver sites which have experienced erosion and need
replenishment. The proposed action would provide immediate benefit by placing suitable beach fill directly
onto the region’s beaches rather than placing some of it in the nearshore zone. The proposed action would
serve four main functions: 1) to replenish the three littoral cells and receiver sites with suitable beach sand;
2) to provide enhanced recreational opportunities and access at the receiver sites; 3) to enhance the tourism
potential of the San Diego region; and 4) to increase protection of public property and infrastructure.
As the project has evolved, it has become apparent that predicting sand movement in the highly dynamic
ocean system is difficult. Another project feature is to establish replenishment sites which can be useful in
evaluating the predictions of the state-of-the-art modeling used in this process and thereby assist with any
future beach replenishment efforts in the region.
ES-3 PROPOSED ACTION
The proposed action is beach replenishment of the San Diego region’s eroding beaches using
approximately 2 million cy of dredged sediment from six offshore borrow sites. The project was originally R

Executive Summary
Regional Beach Sand Project EIR/EA Page ES-599-69\SANDAG EIREA es.wpd 7/17/00
scheduled to start in late summer 2000. The schedule has since been modified to spring 2000 based on R
the recommendation of the SEC at their May 2000 meeting. The Draft EIR/EA evaluated a possible R
construction schedule of late summer/early fall. Both construction schedules are now addressed in Chapter R
4.0. Based on the recommendation of the SEC, one replenishment action would involve up to 12 receiver R
sites using dredged sediment from six borrow sites. This is the SEC’s preferred alternative. This document
also evaluates, at an equal level of detail, one possible alternative for replenishment at nine receiver sites
and the same six offshore borrow sites. Between the two alternatives, a total of 13 receiver sites are
proposed. Most of the 13 possible receiver sites are within suburban areas of the San Diego region and
are bordered by residential, commercial, or light industrial uses. All or portions of the beaches in Carlsbad,
Encinitas, and San Diego are State Beaches. All of the proposed borrow sites are surrounded by ocean
water; the primary recreational activities occurring nearby are boating, sailing, and diving pursuits.
ES-4 ALTERNATIVES
Based on the thorough alternatives evaluation process completed to date, two alternatives were selected
for detailed evaluation in this EIR/EA. Both would result in placement of approximately 2 million cy of sand
along the San Diego region coastline. Table ES-2 illustrates the sand quantities at each beach receiver site
under both alternatives and the borrow site which would provide material for each receiver site. Figures
ES-2 and ES-3 illustrate the receiver sites associated with each alternative
Additionally, there are two possible construction variations – one involves the potential for construction
seven days a week, 24 hours a day (7/24) and the other involves some restrictions on construction times
and days consistent with local noise ordinances, where applicable. These two construction schedules are
addressed as variations (a) and (b) for each alternative. The vast majority of dredge operations utilize a
7/24 time frame to increase efficiency, maximize sand replenishment at each receiver site, and minimize
cost. Given the fixed budget for this project, any increase in construction cost would translate to a
decrease in sand volume placed at each receiver site. Generally, adherence to applicable noise ordinances
would result in construction duration increasing 30 percent and the volume of sand reducing by up to 50
percent. Finally, the No Action Alternative is evaluated.
A more detailed description of the individual receiver sites under each alternative is provided below.

Imperial Beach
Mission Beach
SouthOceanside
Batiquitos (118,000 cy)Leucadia (130,000 cy)Moonlight Beach (88,000 cy)Cardiff (104,000 cy)
Solana Beach
Del Mar
Torrey Pines
North Carlsbad
(380,000 cy)
(240,000 cy)
South Carlsbad North(160,000 cy)
(140,000 cy)
(180,000 cy)
(240,000 cy)
(100,000 cy)
(120,000 cy)
SO-9
SO-7
SO-6
SO-5
SO-4
MB-1
SS-1
CALIF
PROJECT LOCATION
OFFSHORE BORROW SITE
ONSHORE RECEIVER SITE
SO: SOUTH OCEANSIDE LITTORAL CELL BORROW SITE
MB: MISSION BEACH LITTORAL CELL BORROW SITE
SS: SILVER STRAND LITTORAL CELL BORROW SITE
X.X Section Name
Source: DoN 1993
Regional Beach Sand Project EIR/EA9969 SANDAG Beach Replenishment\Figures\Fig ES-2 Sites 1/11/00
Page ES-6
NORTH
Figure ES-2Alternative 1
Borrow and Receiver Sites

Imperial Beach
Mission Beach
SouthOceanside
Cardiff
Solana Beach
Del Mar
Torrey Pines
(570,000 cy)
South Carlsbad North(218,000 cy)
(140,000 cy)
(180,000 cy)
(360,000 cy)
(150,000 cy)
(180,000 cy)
SO-9
SO-7
SO-6
SO-5
SO-4
MB-1
SS-1
CALIF
PROJECT LOCATION
OFFSHORE BORROW SITE
ONSHORE RECEIVER SITE
SO: SOUTH OCEANSIDE LITTORAL CELL BORROW SITE
MB: MISSION BEACH LITTORAL CELL BORROW SITE
SS: SILVER STRAND LITTORAL CELL BORROW SITE
South Carlsbad South(142,000 cy)
(104,000 cy)
X.X Section Name
Source: DoN 1993
Regional Beach Sand Project EIR/EA9969 SANDAG Beach Replenishment\Figures\Fig ES-3 Sites 1/11/00
Page ES-7
NORTH
Figure ES-3Alternative 2
Borrow and Receiver Sites
Executive Summary
Page ES-8 Regional Beach Sand Project EIR/EA99-69\SANDAG EIREA es.wpd 7/17/00
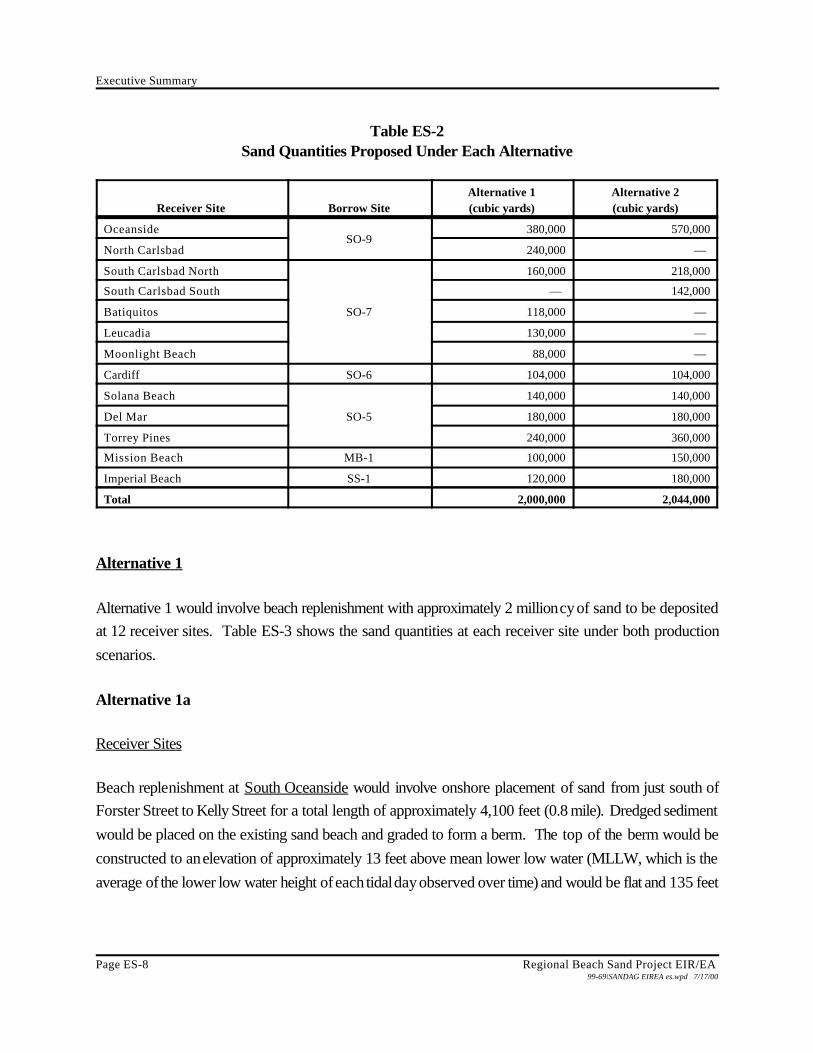
Table ES-2Sand Quantities Proposed Under Each Alternative
Receiver Site Borrow SiteAlternative 1(cubic yards)
Alternative 2(cubic yards)
OceansideSO-9
380,000 570,000
North Carlsbad 240,000 —
South Carlsbad North
SO-7
160,000 218,000
South Carlsbad South — 142,000
Batiquitos 118,000 —
Leucadia 130,000 —
Moonlight Beach 88,000 —
Cardiff SO-6 104,000 104,000
Solana Beach
SO-5
140,000 140,000
Del Mar 180,000 180,000
Torrey Pines 240,000 360,000
Mission Beach MB-1 100,000 150,000
Imperial Beach SS-1 120,000 180,000
Total 2,000,000 2,044,000
Alternative 1
Alternative 1 would involve beach replenishment with approximately 2 million cy of sand to be deposited
at 12 receiver sites. Table ES-3 shows the sand quantities at each receiver site under both production
scenarios.
Alternative 1a
Receiver Sites
Beach replenishment at South Oceanside would involve onshore placement of sand from just south of
Forster Street to Kelly Street for a total length of approximately 4,100 feet (0.8 mile). Dredged sediment
would be placed on the existing sand beach and graded to form a berm. The top of the berm would be
constructed to an elevation of approximately 13 feet above mean lower low water (MLLW, which is the
average of the lower low water height of each tidal day observed over time) and would be flat and 135 feet
Executive Summary
Regional Beach Sand Project EIR/EA Page ES-999-69\SANDAG EIREA es.wpd 7/17/00
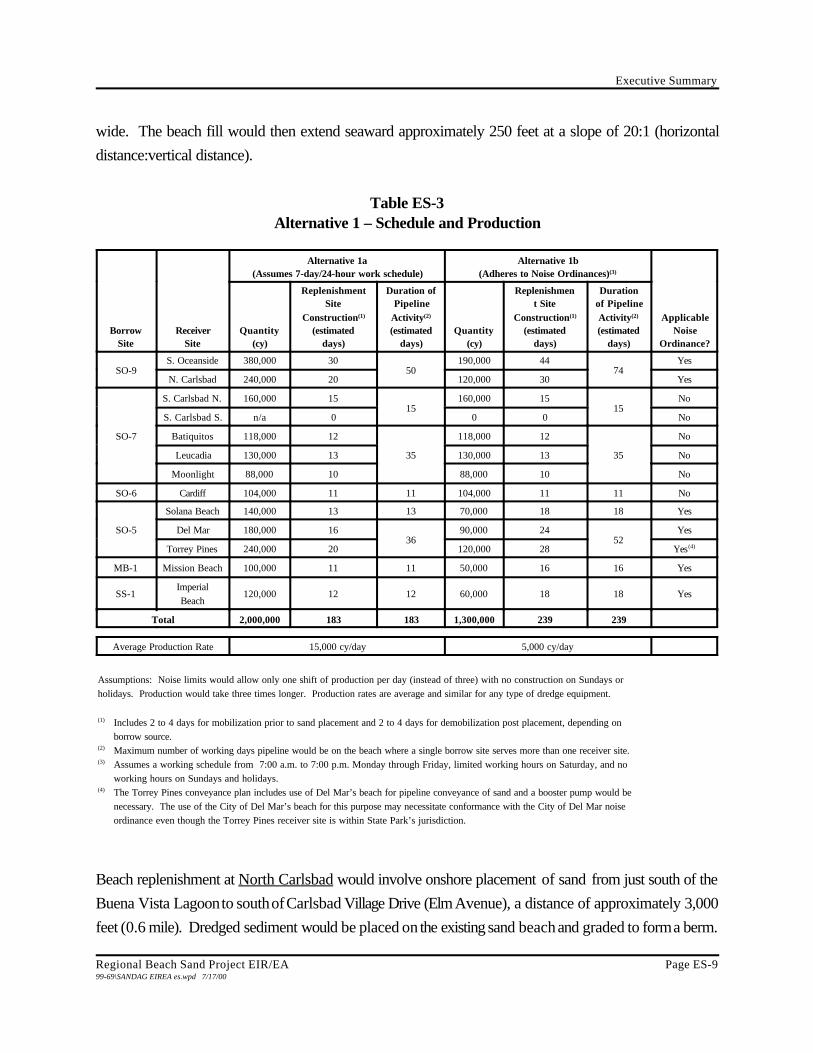
wide. The beach fill would then extend seaward approximately 250 feet at a slope of 20:1 (horizontal
distance:vertical distance).
Table ES-3Alternative 1 – Schedule and Production
BorrowSite
ReceiverSite
Alternative 1a(Assumes 7-day/24-hour work schedule)
Alternative 1b(Adheres to Noise Ordinances)(3)
ApplicableNoise
Ordinance?Quantity
(cy)
ReplenishmentSite
Construction(1)
(estimateddays)
Duration ofPipeline
Activity(2)
(estimateddays)
Quantity(cy)
Replenishment Site
Construction(1)
(estimateddays)
Durationof PipelineActivity(2)
(estimateddays)
SO-9S. Oceanside 380,000 30
50190,000 44
74Yes
N. Carlsbad 240,000 20 120,000 30 Yes
SO-7
S. Carlsbad N. 160,000 1515
160,000 1515
No
S. Carlsbad S. n/a 0 0 0 No
Batiquitos 118,000 12
35
118,000 12
35
No
Leucadia 130,000 13 130,000 13 No
Moonlight 88,000 10 88,000 10 No
SO-6 Cardiff 104,000 11 11 104,000 11 11 No
SO-5
Solana Beach 140,000 13 13 70,000 18 18 Yes
Del Mar 180,000 1636
90,000 2452
Yes
Torrey Pines 240,000 20 120,000 28 Yes(4)
MB-1 Mission Beach 100,000 11 11 50,000 16 16 Yes
SS-1ImperialBeach
120,000 12 12 60,000 18 18 Yes
Total 2,000,000 183 183 1,300,000 239 239
Average Production Rate 15,000 cy/day 5,000 cy/day
Assumptions: Noise limits would allow only one shift of production per day (instead of three) with no construction on Sundays orholidays. Production would take three times longer. Production rates are average and similar for any type of dredge equipment.
(1) Includes 2 to 4 days for mobilization prior to sand placement and 2 to 4 days for demobilization post placement, depending onborrow source.
(2) Maximum number of working days pipeline would be on the beach where a single borrow site serves more than one receiver site.(3) Assumes a working schedule from 7:00 a.m. to 7:00 p.m. Monday through Friday, limited working hours on Saturday, and no
working hours on Sundays and holidays.(4) The Torrey Pines conveyance plan includes use of Del Mar’s beach for pipeline conveyance of sand and a booster pump would be
necessary. The use of the City of Del Mar’s beach for this purpose may necessitate conformance with the City of Del Mar noiseordinance even though the Torrey Pines receiver site is within State Park’s jurisdiction.
Beach replenishment at North Carlsbad would involve onshore placement of sand from just south of the
Buena Vista Lagoon to south of Carlsbad Village Drive (Elm Avenue), a distance of approximately 3,000
feet (0.6 mile). Dredged sediment would be placed on the existing sand beach and graded to form a berm.
Executive Summary
Page ES-10 Regional Beach Sand Project EIR/EA99-69\SANDAG EIREA es.wpd 7/17/00
The top of the berm would be constructed to an elevation of approximately 12 feet above MLLW and
would be flat, with a width of approximately 150 feet. The beach fill would then slope seaward
approximately 150 feet at a slope of 10:1. The North Carlsbad receiver site would be moved back R
approximately 35 feet to the rip-rap at the back of the beach during final design. R
Beach replenishment at the South Carlsbad North site would consist of the placement of dredged sediment
near the Palomar Airport Road intersection with Carlsbad Boulevard, stretching to the south for 2,100 feet
(0.4 mile) near the Encinas Creek outlet. A berm would be constructed to an elevation of approximately
12 feet above MLLW. The berm would be flat with a width of approximately 170 feet. The beach fill
would then slope seaward approximately 100 feet at a slope of 10:1.
Beach replenishment at Batiquitos would involve the placement of dredged sediment from a point
approximately 850 feet south of the Batiquitos Lagoon, into the community of Leucadia and Leucadia State
Beach, a distance of approximately 1,390 feet (0.3 mile). The northern part of the site is known as
“Ponto.” A berm would be constructed to an elevation of approximately 12 feet above MLLW and would
have a width of approximately 110 feet. The beach fill would then slope seaward approximately 375 feet
at a slope of 20:1.
The Leucadia beach fill plan would include creation of a berm of approximately 12 feet above MLLW,
extending seaward approximately 70 feet. The top of the berm would be flat. The beach fill would then
slope seaward approximately 125 feet at a slope of 10:1. The proposed receiver site at the Leucadia site
extends approximately 2,700 feet (0.5 mile) from just south of the Grandview access stairs to Glaucus
Street.
The Moonlight Beach receiver site’s berm would be constructed to a height of approximately 12 feet above
MLLW. The beach fill would be relatively flat and would extend seaward approximately 130 feet seaward
and would then slope seaward at a slope of 20:1. Toward the north, the slope would extend approximately
150 feet, while at the southern part of the berm, the slope would extend approximately 250 feet. The
proposed receiver site would be approximately 770 feet (0.1 mile) long.
Beach replenishment at the Cardiff site would consist of the placement of dredged sediment along 780 feet
(0.1 mile) of Cardiff State Beach south of the San Elijo Lagoon inlet and Restaurant Row. A berm would
be constructed at this location to an elevation of approximately 12 feet above MLLW. The beach fill would
be flat and extend seaward approximately 115 feet. The beach fill would then slope seaward
approximately 350 feet at a slope of 20:1.

Executive Summary
Regional Beach Sand Project EIR/EA Page ES-1199-69\SANDAG EIREA es.wpd 7/17/00
Beach replenishment at the Solana Beach site would consist of the placement of dredged sediment along
approximately 1,800 feet (0.3 mile) of the beach. The northern boundary of the proposed fill site starts just
south of Fletcher Cove and extends southward. A berm would be constructed at this location to an
elevation of approximately 12 feet above MLLW. The berm would be flat and extend seaward
approximately 100 feet. The beach fill would then slope seaward approximately 135 feet at a slope of
10:1.
The berm at Del Mar’s receiver site would be built to a height of approximately 11 feet above MLLW and
would extend seaward approximately 170 feet. The beach fill would then slope seaward approximately R
150 feet at a slope of 10:1. The receiver site extends from just north of 27th Street to Powerhouse Park, R
a distance of approximately 3,110 feet (0.6 mile). R
The beach replenishment berm at the Torrey Pines site would be constructed to an elevation of
approximately 11 feet above MLLW, and would extend for approximately 1,620 feet (0.3 mile). The berm
would be flat with a width of approximately 300 feet. The beach fill would then slope seaward
approximately 200 feet at a slope of 10:1.
The Mission Beach receiver site would be constructed to create a berm of approximately 10 feet above
MLLW and approximately 150 feet wide, stretching approximately 1,590 feet (0.3 mile) from Nantasket
Court to Santa Barbara Place. The beach fill would then slope seaward at a slope of 20:1. The width of
the slope would be approximately 125 feet at the northern end and 250 feet to the south, where the
underwater slope is more gradual.
In Imperial Beach, the beach replenishment berm would be built to approximately 10 feet above MLLW
and would be approximately 120 feet wide, stretching from just Admiralty Way to approximately 600 feet
south of Encanto Avenue. The total length would be approximately 2,310 feet (0.4 mile). The beach fill
would then slope seaward approximately 125 feet at a slope of 20:1.
Borrow Sites
The six borrow sites would be located offshore along the coast from Oceanside to Imperial Beach, in
relative proximity to each receiver site. The term borrow site refers to a larger location that has been
investigated as part of this project in terms of sediment characteristics, marine resources, ocean surface,
etc. Within that large area, a smaller dredge area has been identified and evaluated where the actual
material would be removed. Table ES-4 provides a summary of borrow site characteristics including the

Executive Summary
Page ES-12 Regional Beach Sand Project EIR/EA99-69\SANDAG EIREA es.wpd 7/17/00
volume of material to be dredged, the surface area affected, the depth of dredge, and the water depth.
Subsequent to the issuance of the Draft EIR/EA, engineers have recommended decreasing the dredge area R
or eliminating borrow sites SO-9 and SO-6. Additional material may be removed from SO-7 instead. R
This modification would not change any significance conclusion in the Final EIR/EA. R
Table ES-4Alternative 1 – Borrow Site Characteristics
Borrow SitesVolume of Sand tobe Dredged (in cy)
Approx. SurfaceArea to be Dredged
(in acres)Depth of Dredge
(in feet)Water Depth
(in feet, MLLW)
SO-9(1) R706,000(2) R63 Max. 15 45 to 55
SO-7(3) R496,000 R70 R1 to 11 R60 to 85 R
SO-6 104,000 29 3 to 4 60 to 80
SO-5 656,000(2) 127 Max. 6 50 to 80
MB-1 100,000 19 Max. 6 68 to 75
SS-1 120,000 22 Max. 6 40 to 53(1) With dredge area modified to provide a larger buffer between previously unmapped artificial reef areas, R
the dredge area would be reduced by approximately 25 percent. The borrow site may be eliminated Rduring final design. R
(2) Volume includes overfill factor (Moffatt & Nichol 2000c). R(3) Possible expansion to 1.5 million cy with total surface area of 150 acres if SO-9 and SO-6 are eliminated. R
Maximum depth of dredge would be 15 feet. R
Alternative 1b
Under Alternative 1b, the proposed action would be implemented at the same receiver sites using the same
borrow sites as described for Alternative 1a; however, adherence to applicable noise ordinances would
limit the hours and number of days per week that beach replenishment could occur. Table ES-3 identifies
which receiver sites would be subject to local noise ordinances and provides a comparison of the schedule
and production capability under either construction variation. As shown, the overall quantity of sand would
be 1.3 million cy under Alternative 1b versus 2 million cubic yards under Alternative 1a.
Alternative 2
Alternative 2 would involve sand replenishment at nine beach receiver sites, all but one of which would be
associated with Alternative 1. The same six borrow sites would provide the material for replenishment and
the dredging and discharge plan would be the same, except where some receiver sites would be eliminated.
Individual receiver sites are described below as they would vary from Alternative 1.
Executive Summary
Regional Beach Sand Project EIR/EA Page ES-1399-69\SANDAG EIREA es.wpd 7/17/00
Alternative 2a
Receiver sites
Alternative 2 would have eight beach receiver sites common to Alternative 1 and one new site (South
Carlsbad South) for a total of nine. In three of the sites, the quantity and location of replenishment would
be identical to Alternative 1, and they would be built to the same specifications (e.g., height, slope). Five
of the sites would be similar in location as under Alternative 1, although the sand quantity would increase.
Accordingly, the length of the footprint would increase. Below is a description of the boundaries of each
receiver site.
Under this maximum length alternative, beach replenishment at South Oceanside would involve onshore
placement of sand from Seagaze Drive to Vista Way, a distance of approximately two miles. The berm
elevation would be the same, but the width would decrease to 75 feet.
Beach replenishment at the South Carlsbad North site would consist of the placement of dredged sediment
near the Palomar Airport Road intersection with Carlsbad Boulevard, stretching to the south for 2,800 feet
(0.5 mile) near the Encinitas Creek outlet. Other characteristics of the proposed fill would be similar to
Alternative 1.
The South Carlsbad South receiver site begins just south of the South Carlsbad North receiver site and the
Encinas Creek outlet. The site is approximately 1,830 feet (0.3 mile) in length. A berm would be
constructed to an elevation of approximately 12 feet above MLLW. The berm would be flat with a width
of approximately 170 feet. The beach fill would then slope seaward approximately 100 feet at a slope of
10:1.
Beach replenishment at the Cardiff, Solana Beach, and Del Mar receiver sites would be identical to that
proposed under Alternative 1a.
The Torrey Pines receiver site would stretch approximately 2,470 feet (0.5 mile) and is located on Torrey
Pines State Beach. The northern boundary of the fill site would be identical to Alternative 1. Other
characteristics of the proposed fill would be similar to Alternative 1.
Executive Summary
Page ES-14 Regional Beach Sand Project EIR/EA99-69\SANDAG EIREA es.wpd 7/17/00
The Mission Beach receiver site would stretching from Ostend Court to Santa Barbara Place, a distance
of approximately 2,380 feet (0.5 mile). The southern boundary of the fill site would be identical to
Alternative 1. Other characteristics of the proposed fill would be similar to Alternative 1.
In Imperial Beach, the beach replenishment berm would be built along approximately 3,470 feet (0.7 mile)
of beach, from Imperial Beach Boulevard to approximately 1,000 feet south of Encanto Avenue. This
receiver site footprint would be longer than proposed under Alternative 1 at both the north and south ends.
Other characteristics of the proposed fill would be similar to Alternative 1.
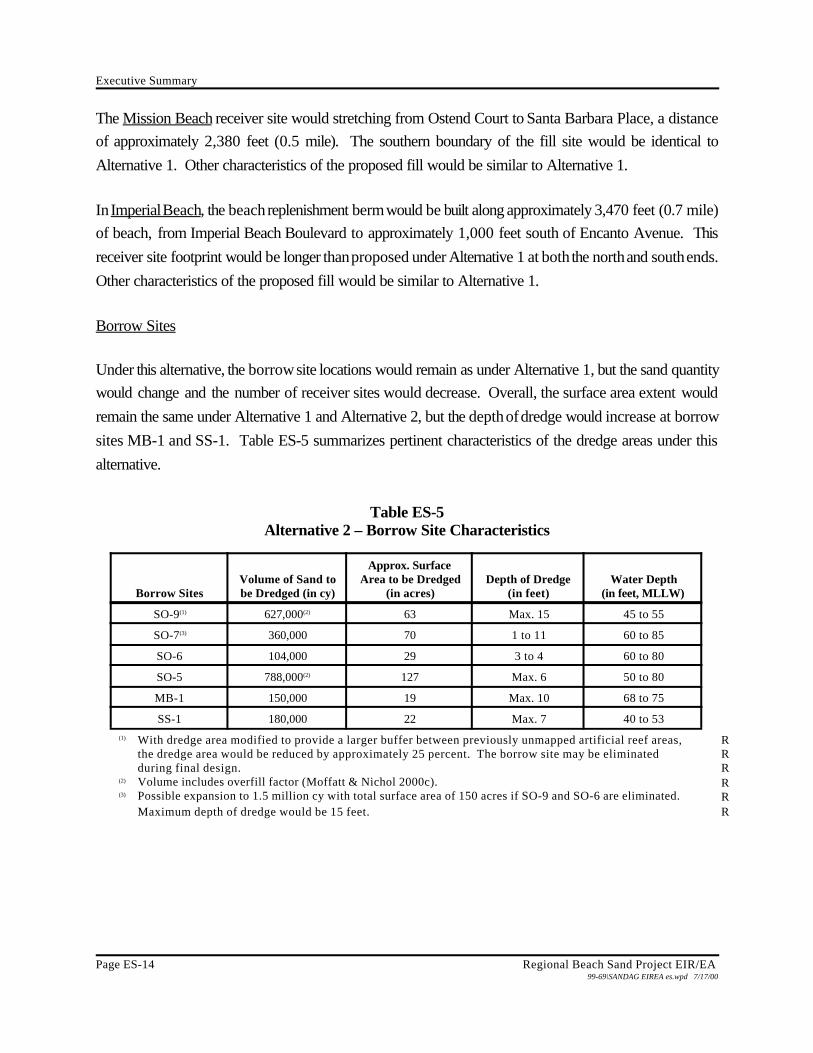
Borrow Sites
Under this alternative, the borrow site locations would remain as under Alternative 1, but the sand quantity
would change and the number of receiver sites would decrease. Overall, the surface area extent would
remain the same under Alternative 1 and Alternative 2, but the depth of dredge would increase at borrow
sites MB-1 and SS-1. Table ES-5 summarizes pertinent characteristics of the dredge areas under this
alternative.
Table ES-5Alternative 2 – Borrow Site Characteristics
Borrow SitesVolume of Sand tobe Dredged (in cy)
Approx. SurfaceArea to be Dredged
(in acres)Depth of Dredge
(in feet)Water Depth
(in feet, MLLW)
SO-9(1) 627,000(2) 63 Max. 15 45 to 55
SO-7(3) 360,000 70 1 to 11 60 to 85
SO-6 104,000 29 3 to 4 60 to 80
SO-5 788,000(2) 127 Max. 6 50 to 80
MB-1 150,000 19 Max. 10 68 to 75
SS-1 180,000 22 Max. 7 40 to 53(1) With dredge area modified to provide a larger buffer between previously unmapped artificial reef areas, R
the dredge area would be reduced by approximately 25 percent. The borrow site may be eliminated Rduring final design. R
(2) Volume includes overfill factor (Moffatt & Nichol 2000c). R(3) Possible expansion to 1.5 million cy with total surface area of 150 acres if SO-9 and SO-6 are eliminated. R
Maximum depth of dredge would be 15 feet. R

Executive Summary
Regional Beach Sand Project EIR/EA Page ES-1599-69\SANDAG EIREA es.wpd 7/17/00
Alternative 2b
This alternative would be implemented at the same receiver sites and using the same borrow sites as
described for Alternative 2a; however, adherence to applicable, local noise ordinances would limit the
hours and number of days per week that beach replenishment could occur. The construction schedules
and associated sand quantities associated with variations 2a and 2b are shown in Table ES-6. The overall
quantity of sand would be 1.25 million cy under Alternative 2b versus 2.04 million cy under Alternative 2a.
Table ES-6Alternative 2 – Schedule and Production
BorrowSite
ReceiverSite
Alternative 2a(Assumes 7-day/24-hour work schedule)
Alternative 2b(Adheres to Noise Ordinances)(3)
ApplicableNoise
Ordinance?Quantity
(cy)
ReplenishmentSite
Construction(1)
(estimated days)
Duration ofPipeline
Activity(2)
(estimateddays)
Quantity(cy)
ReplenishmentSite
Construction(1)
(estimated days)
Duration ofPipeline
Activity(2)
(estimateddays)
SO-9S. Oceanside 570,000 42
42285,000 63
63Yes
N. Carlsbad 0 0 0 0 N/A
SO-7
S. Carlsbad N. 218,000 1932
218,000 1932
No
S. Carlsbad S. 142,000 13 142,000 13 No
Batiquitos 0 0
0
0 0
0
N/A
Leucadia 0 0 0 0 N/A
Moonlight 0 0 0 0 N/A
SO-6 Cardiff 104,000 11 11 104,000 11 11 No
SO-5
Solana Beach 140,000 13 13 70,000 18 18 Yes
Del Mar 180,000 1644
90,000 2464
Yes
Torrey Pines 360,000 28 180,000 40 Yes(4)
MB-1MissionBeach
150,000 14 14 75,000 21 21 Yes
SS-1ImperialBeach
180,000 16 16 90,000 24 24 Yes
Total 2,044,000 172 172 1,254,000.00 233 233
Average Production Rate 15,000 cy/day 5,000 cy/day
Assumptions: Noise limits would allow only one shift of production per day with no construction on Sundays or holidays. This wouldlimit volume by 50 percent due to cost constraints and production to 1/3 (3 times longer). Production rates are average and similar foreither hopper or cutterhead dredge.
(1) Includes 2 to 4 days for mobilization prior to sand placement and 2 to 4 days for demobilization post placement, depending on borrowsource.
(2) Maximum number of working days pipeline would be on the beach where a single borrow site serves more than one receiver site.(3) Assumes a working schedule from 7:00 a.m. to 7:00 p.m. Monday through Friday, limited working hours on Saturday, and no working
hours on Sundays and holidays.(4) The Torrey Pines conveyance plan includes use of Del Mar’s beach for pipeline conveyance of sand. The use of the City of Del Mar’s
beach for this purpose may necessitate conformance with the noise ordinance.
Executive Summary
Page ES-16 Regional Beach Sand Project EIR/EA99-69\SANDAG EIREA es.wpd 7/17/00
No Action Alternative
Under the No Action Alternative, no dredging or beach replenishment activities would occur, and erosion
at the region’s beaches would continue without intervention. This would result in failure to enhance
recreational opportunities, enhance tourism value, or achieve property and infrastructure protection at
specific receiver sites. It would also preclude the addition of sand in the three littoral cells which could
thereby indirectly enhance other beach locations. Finally, it would not provide the opportunity to monitor
the post-project condition for purposes of increasing knowledge regarding the state-of-the-art modeling
process. While all these failures would be specific to the proposed specific receiver sites, there is a region-
wide benefit that would also be lost.
ES-5 MONITORING AND MITIGATION FRAMEWORK
Although sand replenishment has occurred along the San Diego region coastline for well over 50 years
(USACOE 1991), the effects of sand transport have not been effectively monitored to date. While there
are coastal engineering models to predict sand transport from beach replenishment, there is little local data
available to verify how the actual conditions compare to the predicted. As part of the permits issued to the
Navy for their beach replenishment project, a Coastal Monitoring Plan was approved by the U.S. Army
Corps of Engineers in 1997. That plan described a monitoring program to be implemented subsequent to
sand placement and for a four-year period following the action. The intent of the monitoring was to verify
that there were no long-term, significant impacts to sensitive biological resources. If impacts were
identified, then mitigation would be required. While sand placement was halted prior to completion, the
required monitoring continued by the Navy as required by the permit until 2001. Since the projects are
substantially the same, except with respect to sand source and less sand volume than the Navy’s project,
a similar monitoring program would be implemented for the Regional Beach Sand Project. A mitigation
commitment would also be necessary in case long-term, significant impacts are identified during monitoring.
This section summarizes the framework for monitoring and mitigation for the Regional Beach Sand Project.
The final details are most appropriately determined upon selection of an alternative and negotiation of
permit conditions with the resource agencies. Items such as exact monitoring locations would depend on
the alternative to be implemented.
Monitoring can be considered in terms of “during construction” and “post-construction.” Monitoring during
construction would be required to verify that specified site-specific, resources are not adversely impacted
Executive Summary
Regional Beach Sand Project EIR/EA Page ES-1799-69\SANDAG EIREA es.wpd 7/17/00
(e.g., grunion). Post-construction monitoring will be required to understand the long-term ramifications of
project implementation, which is especially pertinent because of the highly dynamic ocean system.
Monitoring During Construction
SANDAG is committed to coordinating with commercial fishermen to avoid gear loss in the transit and R
dredge areas. As described in Section 2.4.1, an observer would be aboard the dredge to document any R
fishing gear in these areas and determine compensation responsibility if gear is lost. Other specifics of the R
noticing procedure prior to and during construction are in that section. R
Construction monitoring would be performed to verify water quality (turbidity) remains within parameters
established by the Regional Water Quality Control Board (RWQCB) 401 Certification of Waste Discharge
Requirements. The 401 Certification requirement will establish the frequency and duration of monitoring. R
Monitoring would also occur during discharge operations at those receiver sites with suitable grunion habitat
to establish a buffer around observed grunion spawning locals. The buffer would remain in place for 14
days to allow grunion eggs to hatch, and surveys show no subsequent spawning has occurred in the same R
area. A schematic drawing of the diked buffer area would be submitted to the resource and regulatory R
agencies. Construction could continue elsewhere in the receiver site during this period. Monitoring by a R
qualified biologist would only occur during the spawning season (March through August) and during the R
dates specified by the California Department of Fish and Game in their annual pamphlet Expected Grunion R
Runs. R
While the dredge areas have been located to avoid locations high probability for underwater cultural
resources as much as possible, monitoring will be required at all receiver sites fed to verify no substantial
disturbance to resources occurs. If disturbance occurs, that portion of the borrow site would be
permanently avoided, a 250-foot buffer established, and the site recorded. Additionally, potential side-scan
targets at SO-9 and MB-1 would be investigated prior to dredging (by diver or remotely operated vehicle
(ROV)). If they are historic features they would be avoided and a suitable buffer established. Complete
side-scan will be obtained and interpreted at SO-9 and SS-1 to verify no historic targets and to ensure no
damage to the dredge.

Executive Summary
Page ES-18 Regional Beach Sand Project EIR/EA99-69\SANDAG EIREA es.wpd 7/17/00
Post-Construction Monitoring
The RBSP monitoring program will continue at as many of the existing Navy sites as practicable, while R
verifying no long-term impacts at the locations where this project predicts possible sand deposition. While R
the exact monitoring locations will be finalized in concert with the resource and regulatory agencies, R
tentative locations include Point Loma (control) and Cardiff (test) for rocky intertidal habitat; Cardiff, North R
Carlsbad and Leucadia (test) and one new site north of Table Tops or Swami’s (control) for subtidal R
habitat; and a new location off North Carlsbad, Solana Beach/Cardiff, Batiquitos, Moonlight R
Beach/Boneyards (test) and Point Loma, possibly Swami’s (control) for kelp habitat. A new transect R
perpendicular to the coast would be implemented at North Carlsbad under subtidal to verify no impacts R
to surfgrass. Current baseline data is available for existing Navy monitoring sites, but where new test and R
control sites would be selected, baseline monitoring would be completed prior to project initiation. Possible R
new sites that would require baseline monitoring include the perpendicular transect at North Carlsbad, the R
selected control site for subtidal habitat, and Batiquitos, Moonlight Beach/Boneyards and North Carlsbad R
test sites for kelp habitat. R
The monitoring program for rocky intertidal habitat would involve periodic checks of fixed plots and fixed
transects to observe identified target species of vegetation, barnacles, and sea stars. Species abundance
would be estimated based on counts and measurements within those fixed sample locations. Timed
searches and reconnaissance surveys would also be conducted, including video-recording. Surveys would
occur twice a year (spring and fall) for four years. Sample reports would be provided after each survey
and a yearly report would be required after each full year of monitoring. A final report would be prepared
at the completion of the four-year monitoring effort.
The subtidal monitoring would involve establishment of fixed transects inside a fixed quadrant within which
the substrate would be characterized in terms of percentage of sand, rock, rock type, vertical relief and
depth of sand cover. Within that quadrant, the biologist would census abundance of key indicator species.
Habitat type and species abundance along each transect would be mapped and digitized into a GIS
database. Persistence or change in habitat over time would be documented. Sediment markers would be
permanently established and monitored as well. It will be important in the monitoring plan to design a
standard method for accurately recording changes in sand depth. Surveys would occur twice annually in
spring and fall. Annual reports would be provided, as well as a final report at the end of four years.
Kelp monitoring would be performed using divers at the study reefs to sample the kelp and reef biota within
established areas. Transects would be established and substrate mapped to characterize the percentage

Executive Summary
Regional Beach Sand Project EIR/EA Page ES-1999-69\SANDAG EIREA es.wpd 7/17/00
of sand, rock, rock type, vertical relief and depth of sand cover. Key indicator species (plants and
invertebrates) would be inventoried for type and abundance. Photographs and video would be used for
recordation. Sediment markers and buoys would be established. For the first two years, monitoring would
occur periodically and thereafter annually. Sampling reports would be required as surveyed, annual reports
every year, and then a final report at the conclusion of monitoring (after four years).
The Navy committed to a four-year lagoon monitoring program at Agua Hedionda Lagoon, Batiquitos
Lagoon, San Elijo Lagoon, San Dieguito Lagoon, and Los Peñasquitos Lagoon to evaluate lagoon mouth
closures and/or increased sand accumulation rates. SANDAG is currently participating in an annual lagoon
monitoring program as part of that program. The intent of lagoon monitoring would be to determine to what
extent sand deposition and lagoon mouth closures are related to the Regional Beach Sand Project versus
other sand sources and coastal processes. The determination would be made by the USACOE in
consultation with the resource agencies. Project monitoring would rely on a comparison of surveyed beach
transects which bracket each lagoon mouth between current year changes and historical data, comparison
of triangulated irregular network (TIN) maps and transects to recent lagoon monitoring, aerial overflights,
as well as an evaluation of non-project inputs (i.e., other beach replenishment projects including
maintenance dredging) versus project inputs to determine how much of the material in the lagoon, if any,
is project-related. This monitoring effort would also occur for four years subsequent to the action. If the R
monitoring effort is unable to determine to the satisfaction of the resource agencies, the project impact at R
a specific lagoon, then quantities up to the potential, worst-case sedimentation derived in Appendix C may R
be used. R
Post-Project Mitigation (If Necessary)
If monitoring documents a significant, long-term adverse impact to sensitive marine resources resulting from
discharge activities based on the resource agency/SANDAG consultation and review of the monitoring R
reports (twice yearly and at project completion), then restoration of like habitat at a 1:1 ratio would be R
proposed as a first priority. Consideration would be given to the construction of artificial reefs as mitigation
to offset project impacts at a 1:1 ratio if like habitat restoration efforts were not feasible as determined by
the USACOE, in consultation with the resource agencies. Like the Navy, SANDAG would negotiate a
“not-to-exceed” cap on mitigation costs as a key part of the permit conditions related to mitigation. The R
potential worst-case acreage for 1:1 enhancement/replacement is similar in size to the prior Navy project R
and a similar mitigation fund ($1.1 million) would likely be negotiated. R

Executive Summary
Page ES-20 Regional Beach Sand Project EIR/EA99-69\SANDAG EIREA es.wpd 7/17/00
If the monitoring effort is unable to determine to the satisfaction of the resource agencies, the project impact R
at a specific lagoon, then potential, worst-case sedimentation quantities as derived in Appendix C may be R
utilized. If the lagoons experience sand input above typical conditions, which are related to the RBSP, R
funding would be provided to allow for sediment removal or additional mouth opening in concert with other R
on-going maintenance efforts at each lagoon. This determination would be made in consultation with R
SANDAG/Resource agencies based on review of the monitoring reports (twice yearly and at project R
completion). Funding will be identified for potential mitigation, and a not-to-exceed cap negotiated, as part R
of the permit process. R
ES-6 AFFECTED ENVIRONMENT
This EIR/EA provides a description of the existing environmental conditions in the project areas. This
document describes existing conditions for the following resource categories: geology and soils; coastal
wetlands; water resources; biological resources; cultural resources; land and water use; aesthetics;
socioeconomics; public health and safety; structures and utilities; traffic; air quality; and noise.
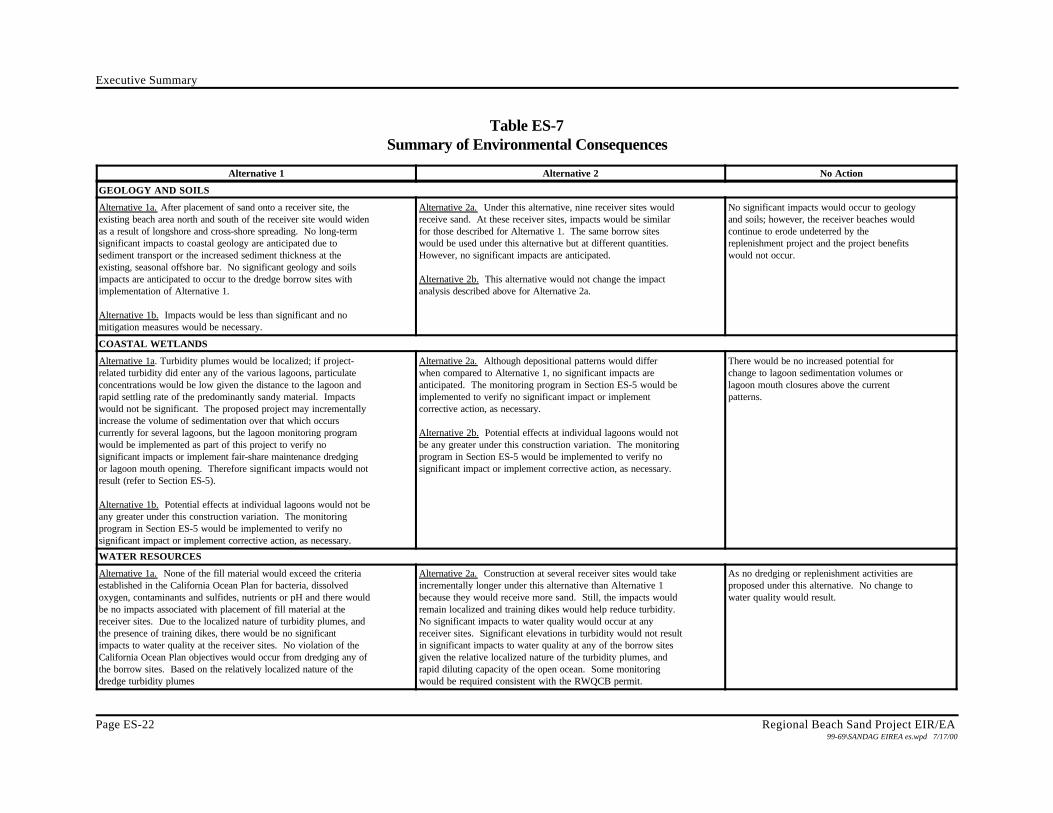
ES-7 ENVIRONMENTAL CONSEQUENCES
No long-term significant impacts are expected to occur from implementation of the project given the
monitoring and mitigation program as defined in subsection ES-5. As noted in that section, monitoring
would occur during construction to satisfy permit conditions and ensure avoidance of site-specific resources
(e.g., grunion). Monitoring would also occur for four years subsequent to the action to verify no significant
impacts to coastal lagoons and marine biological resources. If significant long-term impacts do occur, then
SANDAG would implement action to mitigate those impacts, generally lagoon dredging/mouth openings(s)
and/or reef restoration/creation. Table ES-7 summarizes the potential effects under all three alternatives
and both construction variations.
ES-8 CUMULATIVE IMPACTS
California guidelines implementing CEQA require a discussion of significant environmental impacts that
would result when the incremental effects of a project are considerable when viewed in combination with
the effects of “past, present, and probable future projects ” or in relation to “a summary of projections
contained in an adopted general plan or related planning document” (Cal. Code Regs., Title 14, § 15065(c)
and § 15130(b)(1)(A)(B)). Federal guidelines implementing NEPA define a cumulative impact as one that
would result from the incremental impact of an action when added to other past, present, and reasonably
foreseeable actions (40 C.F.R. § 1508.7).
Executive Summary
Page ES-22 Regional Beach Sand Project EIR/EA99-69\SANDAG EIREA es.wpd 7/17/00
Table ES-7Summary of Environmental Consequences
Alternative 1 Alternative 2 No Action
GEOLOGY AND SOILS
Alternative 1a. After placement of sand onto a receiver site, theexisting beach area north and south of the receiver site would widenas a result of longshore and cross-shore spreading. No long-termsignificant impacts to coastal geology are anticipated due tosediment transport or the increased sediment thickness at theexisting, seasonal offshore bar. No significant geology and soilsimpacts are anticipated to occur to the dredge borrow sites withimplementation of Alternative 1.
Alternative 1b. Impacts would be less than significant and nomitigation measures would be necessary.
Alternative 2a. Under this alternative, nine receiver sites wouldreceive sand. At these receiver sites, impacts would be similarfor those described for Alternative 1. The same borrow siteswould be used under this alternative but at different quantities. However, no significant impacts are anticipated.
Alternative 2b. This alternative would not change the impactanalysis described above for Alternative 2a.
No significant impacts would occur to geologyand soils; however, the receiver beaches wouldcontinue to erode undeterred by thereplenishment project and the project benefitswould not occur.
COASTAL WETLANDS
Alternative 1a. Turbidity plumes would be localized; if project-related turbidity did enter any of the various lagoons, particulateconcentrations would be low given the distance to the lagoon andrapid settling rate of the predominantly sandy material. Impactswould not be significant. The proposed project may incrementallyincrease the volume of sedimentation over that which occurscurrently for several lagoons, but the lagoon monitoring programwould be implemented as part of this project to verify nosignificant impacts or implement fair-share maintenance dredgingor lagoon mouth opening. Therefore significant impacts would notresult (refer to Section ES-5).
Alternative 1b. Potential effects at individual lagoons would not beany greater under this construction variation. The monitoringprogram in Section ES-5 would be implemented to verify nosignificant impact or implement corrective action, as necessary.
Alternative 2a. Although depositional patterns would differwhen compared to Alternative 1, no significant impacts areanticipated. The monitoring program in Section ES-5 would beimplemented to verify no significant impact or implementcorrective action, as necessary.
Alternative 2b. Potential effects at individual lagoons would notbe any greater under this construction variation. The monitoringprogram in Section ES-5 would be implemented to verify nosignificant impact or implement corrective action, as necessary.
There would be no increased potential forchange to lagoon sedimentation volumes orlagoon mouth closures above the currentpatterns.
WATER RESOURCES
Alternative 1a. None of the fill material would exceed the criteriaestablished in the California Ocean Plan for bacteria, dissolvedoxygen, contaminants and sulfides, nutrients or pH and there wouldbe no impacts associated with placement of fill material at thereceiver sites. Due to the localized nature of turbidity plumes, andthe presence of training dikes, there would be no significantimpacts to water quality at the receiver sites. No violation of theCalifornia Ocean Plan objectives would occur from dredging any ofthe borrow sites. Based on the relatively localized nature of thedredge turbidity plumes
Alternative 2a. Construction at several receiver sites would takeincrementally longer under this alternative than Alternative 1because they would receive more sand. Still, the impacts wouldremain localized and training dikes would help reduce turbidity. No significant impacts to water quality would occur at anyreceiver sites. Significant elevations in turbidity would not resultin significant impacts to water quality at any of the borrow sitesgiven the relative localized nature of the turbidity plumes, andrapid diluting capacity of the open ocean. Some monitoringwould be required consistent with the RWQCB permit.
As no dredging or replenishment activities areproposed under this alternative. No change towater quality would result.
Executive Summary
Regional Beach Sand Project EIR/EA Page ES-2399-69\SANDAG EIREA es.wpd 7/17/00
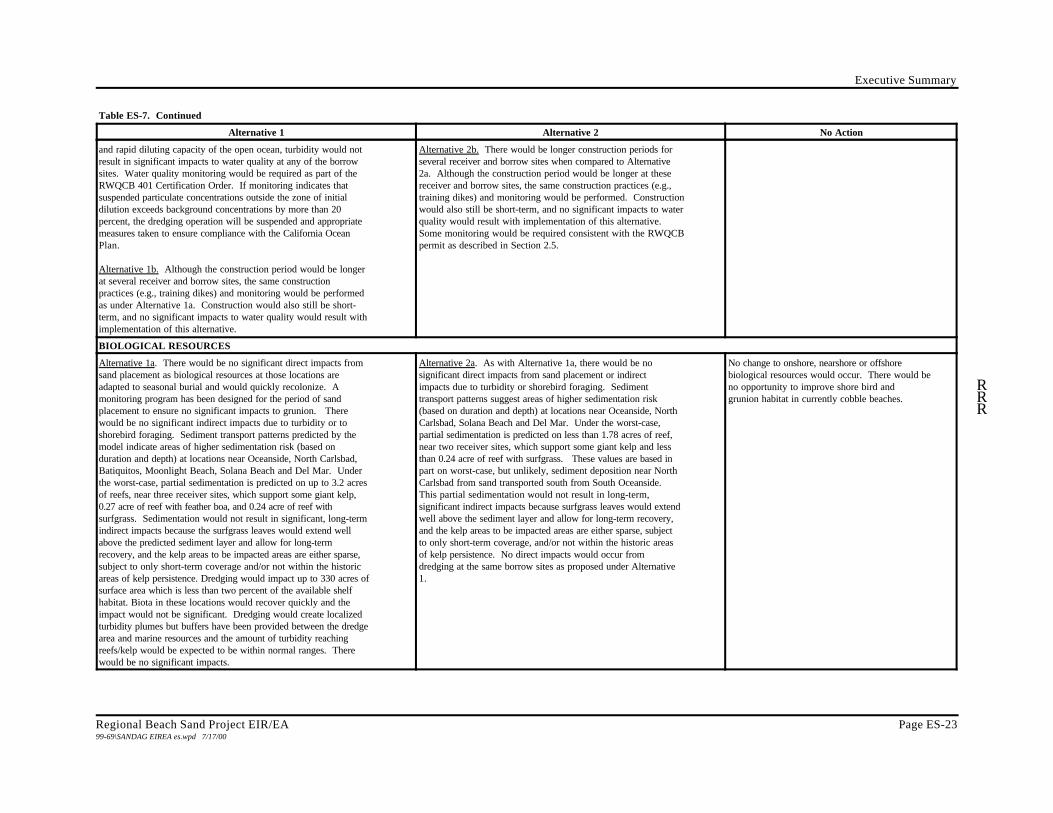
Table ES-7. Continued
Alternative 1 Alternative 2 No Action
and rapid diluting capacity of the open ocean, turbidity would notresult in significant impacts to water quality at any of the borrowsites. Water quality monitoring would be required as part of theRWQCB 401 Certification Order. If monitoring indicates thatsuspended particulate concentrations outside the zone of initialdilution exceeds background concentrations by more than 20percent, the dredging operation will be suspended and appropriatemeasures taken to ensure compliance with the California OceanPlan.
Alternative 1b. Although the construction period would be longerat several receiver and borrow sites, the same constructionpractices (e.g., training dikes) and monitoring would be performedas under Alternative 1a. Construction would also still be short-term, and no significant impacts to water quality would result withimplementation of this alternative.
Alternative 2b. There would be longer construction periods forseveral receiver and borrow sites when compared to Alternative2a. Although the construction period would be longer at thesereceiver and borrow sites, the same construction practices (e.g.,training dikes) and monitoring would be performed. Constructionwould also still be short-term, and no significant impacts to waterquality would result with implementation of this alternative. Some monitoring would be required consistent with the RWQCBpermit as described in Section 2.5.
BIOLOGICAL RESOURCES
Alternative 1a. There would be no significant direct impacts fromsand placement as biological resources at those locations areadapted to seasonal burial and would quickly recolonize. A Rmonitoring program has been designed for the period of sand Rplacement to ensure no significant impacts to grunion. There Rwould be no significant indirect impacts due to turbidity or toshorebird foraging. Sediment transport patterns predicted by themodel indicate areas of higher sedimentation risk (based onduration and depth) at locations near Oceanside, North Carlsbad,Batiquitos, Moonlight Beach, Solana Beach and Del Mar. Underthe worst-case, partial sedimentation is predicted on up to 3.2 acresof reefs, near three receiver sites, which support some giant kelp,0.27 acre of reef with feather boa, and 0.24 acre of reef withsurfgrass. Sedimentation would not result in significant, long-termindirect impacts because the surfgrass leaves would extend wellabove the predicted sediment layer and allow for long-termrecovery, and the kelp areas to be impacted areas are either sparse,subject to only short-term coverage and/or not within the historicareas of kelp persistence. Dredging would impact up to 330 acres ofsurface area which is less than two percent of the available shelfhabitat. Biota in these locations would recover quickly and theimpact would not be significant. Dredging would create localizedturbidity plumes but buffers have been provided between the dredgearea and marine resources and the amount of turbidity reachingreefs/kelp would be expected to be within normal ranges. Therewould be no significant impacts.
Alternative 2a. As with Alternative 1a, there would be nosignificant direct impacts from sand placement or indirectimpacts due to turbidity or shorebird foraging. Sedimenttransport patterns suggest areas of higher sedimentation risk(based on duration and depth) at locations near Oceanside, NorthCarlsbad, Solana Beach and Del Mar. Under the worst-case,partial sedimentation is predicted on less than 1.78 acres of reef,near two receiver sites, which support some giant kelp and lessthan 0.24 acre of reef with surfgrass. These values are based inpart on worst-case, but unlikely, sediment deposition near NorthCarlsbad from sand transported south from South Oceanside. This partial sedimentation would not result in long-term,significant indirect impacts because surfgrass leaves would extendwell above the sediment layer and allow for long-term recovery,and the kelp areas to be impacted areas are either sparse, subjectto only short-term coverage, and/or not within the historic areasof kelp persistence. No direct impacts would occur fromdredging at the same borrow sites as proposed under Alternative1.
No change to onshore, nearshore or offshorebiological resources would occur. There would beno opportunity to improve shore bird andgrunion habitat in currently cobble beaches.
Executive Summary
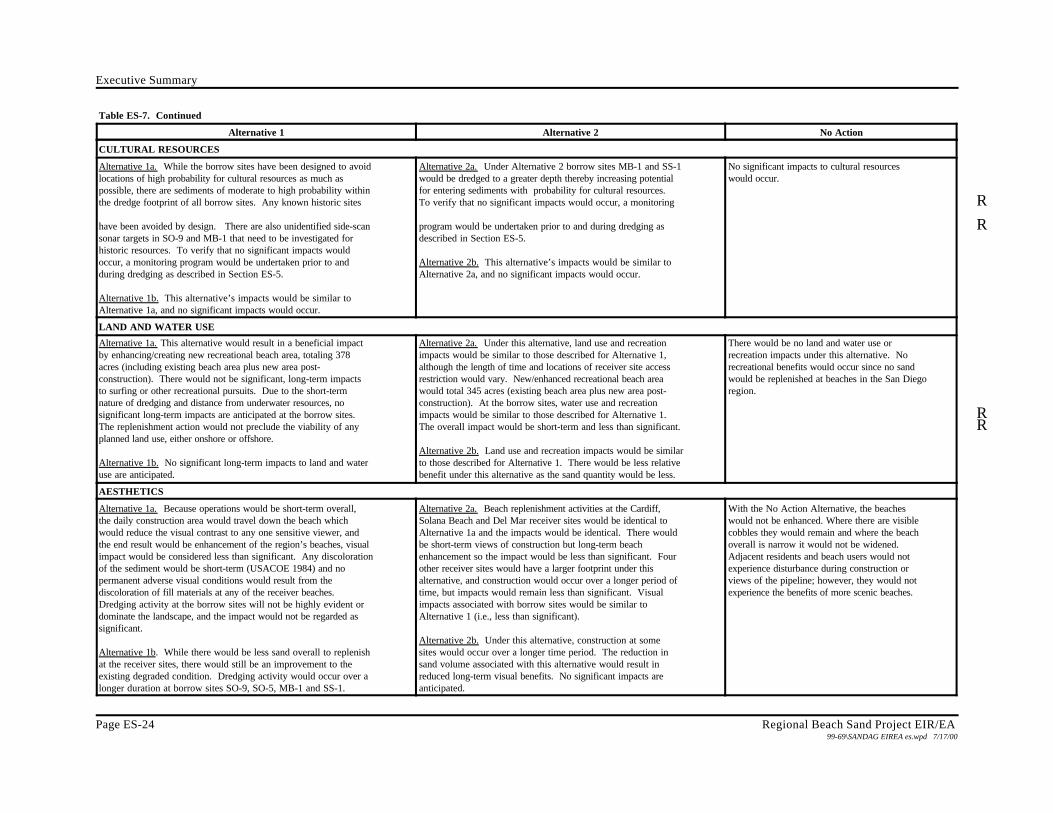
Table ES-7. Continued
Alternative 1 Alternative 2 No Action
Page ES-24 Regional Beach Sand Project EIR/EA99-69\SANDAG EIREA es.wpd 7/17/00
CULTURAL RESOURCES
Alternative 1a. While the borrow sites have been designed to avoidlocations of high probability for cultural resources as much aspossible, there are sediments of moderate to high probability withinthe dredge footprint of all borrow sites. Any known historic sites R
have been avoided by design. There are also unidentified side-scan Rsonar targets in SO-9 and MB-1 that need to be investigated forhistoric resources. To verify that no significant impacts wouldoccur, a monitoring program would be undertaken prior to andduring dredging as described in Section ES-5.
Alternative 1b. This alternative’s impacts would be similar toAlternative 1a, and no significant impacts would occur.
Alternative 2a. Under Alternative 2 borrow sites MB-1 and SS-1would be dredged to a greater depth thereby increasing potentialfor entering sediments with probability for cultural resources. To verify that no significant impacts would occur, a monitoring
program would be undertaken prior to and during dredging asdescribed in Section ES-5.
Alternative 2b. This alternative’s impacts would be similar toAlternative 2a, and no significant impacts would occur.
No significant impacts to cultural resourceswould occur.
LAND AND WATER USE
Alternative 1a. This alternative would result in a beneficial impactby enhancing/creating new recreational beach area, totaling 378acres (including existing beach area plus new area post-construction). There would not be significant, long-term impactsto surfing or other recreational pursuits. Due to the short-termnature of dredging and distance from underwater resources, nosignificant long-term impacts are anticipated at the borrow sites. RThe replenishment action would not preclude the viability of any Rplanned land use, either onshore or offshore.
Alternative 1b. No significant long-term impacts to land and wateruse are anticipated.
Alternative 2a. Under this alternative, land use and recreationimpacts would be similar to those described for Alternative 1,although the length of time and locations of receiver site accessrestriction would vary. New/enhanced recreational beach areawould total 345 acres (existing beach area plus new area post-construction). At the borrow sites, water use and recreationimpacts would be similar to those described for Alternative 1. The overall impact would be short-term and less than significant.
Alternative 2b. Land use and recreation impacts would be similarto those described for Alternative 1. There would be less relativebenefit under this alternative as the sand quantity would be less.
There would be no land and water use orrecreation impacts under this alternative. Norecreational benefits would occur since no sandwould be replenished at beaches in the San Diegoregion.
AESTHETICS
Alternative 1a. Because operations would be short-term overall,the daily construction area would travel down the beach whichwould reduce the visual contrast to any one sensitive viewer, andthe end result would be enhancement of the region’s beaches, visualimpact would be considered less than significant. Any discolorationof the sediment would be short-term (USACOE 1984) and nopermanent adverse visual conditions would result from thediscoloration of fill materials at any of the receiver beaches. Dredging activity at the borrow sites will not be highly evident ordominate the landscape, and the impact would not be regarded assignificant.
Alternative 1b. While there would be less sand overall to replenishat the receiver sites, there would still be an improvement to theexisting degraded condition. Dredging activity would occur over alonger duration at borrow sites SO-9, SO-5, MB-1 and SS-1.
Alternative 2a. Beach replenishment activities at the Cardiff,Solana Beach and Del Mar receiver sites would be identical toAlternative 1a and the impacts would be identical. There wouldbe short-term views of construction but long-term beachenhancement so the impact would be less than significant. Fourother receiver sites would have a larger footprint under thisalternative, and construction would occur over a longer period oftime, but impacts would remain less than significant. Visualimpacts associated with borrow sites would be similar toAlternative 1 (i.e., less than significant).
Alternative 2b. Under this alternative, construction at somesites would occur over a longer time period. The reduction insand volume associated with this alternative would result inreduced long-term visual benefits. No significant impacts areanticipated.
With the No Action Alternative, the beacheswould not be enhanced. Where there are visiblecobbles they would remain and where the beachoverall is narrow it would not be widened. Adjacent residents and beach users would notexperience disturbance during construction orviews of the pipeline; however, they would notexperience the benefits of more scenic beaches.

Executive Summary
Table ES-7. Continued
Alternative 1 Alternative 2 No Action
Regional Beach Sand Project EIR/EA Page ES-2599-69\SANDAG EIREA es.wpd 7/17/00
Because of the distance between borrow sites and viewers, therelatively small size of dredge area when viewed in the oceanhorizon, and the other boating activity that is also visible, therewould be no permanent significant visual impact.
SOCIOECONOMICS
Alternative 1a. There would be no significant direct impacts to thecommercial fishery as a result of area preclusion of fishing effort,long-term damage to target species populations as a result ofsedimentation of nursery habitat areas for commercial species, orloss of fishing gear as a result of dredging or sand placementoperations. In terms of the regional fishery, there would be no
significant impact to the overall fishery. Individual lobsterfishermen and, to a lesser extent, urchin and live trap (primarilycrab and sheephead) fishermen may experience temporary adverseimpacts from short-term displacement from favored small areafishing locations. Nursery habitat may experience short-termlocalized adverse impacts but the relative size of potentiallyaffected areas (0.24 acre surfgrass, 0.3 acre of feather boa, and 3.2acres kelp) would be insignificant to the overall available habitat. The potential for impacts resulting from gear loss will beminimized through a pro-active effort to coordinate withcommercial fishermen in advance of, and during, dredgingoperations for the borrow site and transit areas. In addition to Ronshore restricted access, an offshore area would be restricted to Rallow proper anchoring of the dredge and pumping operations and Rprotect public safety. Each of the dredge locations would be Rpublicized via a U.S. Coast Guard Notice to Mariners. At the Rinitiation of dredge activities, an observer would be aboard the Rdredge to document any fishing gear in the noticed transit or dredge Rareas. Gear within these areas, if damaged or destroyed, would not Rrequire compensation. If gear outside of the noticed dredge areas Ror transit corridors is damaged or destroyed, compensation would be Rthe responsibility of the contractor. Impacts to kelp harvesting Ractivities will be less than significant given the small area of kelpcoverage that will experience partial temporary sedimentation andthe generally poor quality of kelp habitat within the affectedlittoral cell. Impacts to sport fishermen and divers will be less thansignificant. Short-term adverse impacts may be experienced bydive operations in the “Wreck Alley” area off of Mission Beachduring the 11 days of dredging operations at the adjacent borrowsite, and there may be temporary impacts to sport fishing anddiving resulting from localized turbidity plumes at borrow andreceiver sites.
Alternative 2a. Impacts resulting from Alternative 2a would besimilar to those identified for Alternative 1a, but somewhatsmaller in area and different in specific location. Whiletemporary adverse impacts to commercial fisheries target speciesmay occur on a localized basis, or at the individual fishingoperation level due to temporary displacement from favored
fishing sites, no significant commercial fisheries impacts areidentified.
The benefits of enhanced beaches for recreation,property protection and tourism would notoccur. There would be no change to currentfisheries fluctuations.
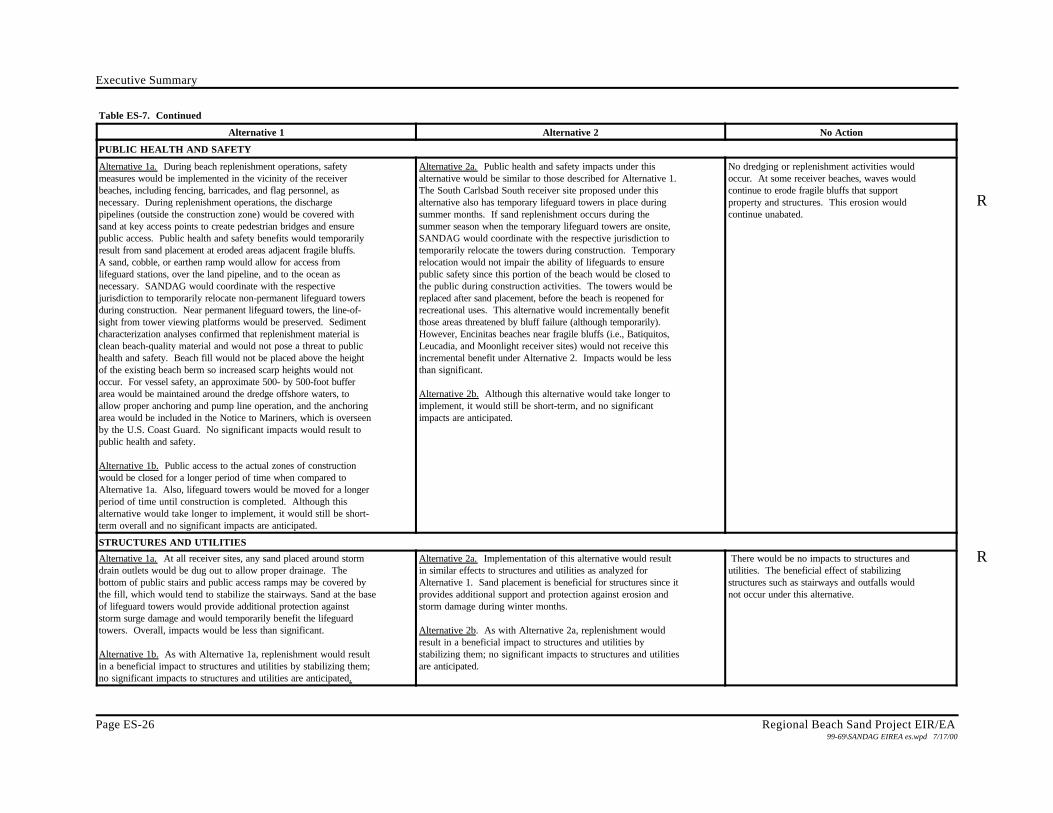
Executive Summary
Table ES-7. Continued
Alternative 1 Alternative 2 No Action
Page ES-26 Regional Beach Sand Project EIR/EA99-69\SANDAG EIREA es.wpd 7/17/00
PUBLIC HEALTH AND SAFETY
Alternative 1a. During beach replenishment operations, safetymeasures would be implemented in the vicinity of the receiverbeaches, including fencing, barricades, and flag personnel, asnecessary. During replenishment operations, the discharge Rpipelines (outside the construction zone) would be covered withsand at key access points to create pedestrian bridges and ensurepublic access. Public health and safety benefits would temporarilyresult from sand placement at eroded areas adjacent fragile bluffs. A sand, cobble, or earthen ramp would allow for access fromlifeguard stations, over the land pipeline, and to the ocean asnecessary. SANDAG would coordinate with the respectivejurisdiction to temporarily relocate non-permanent lifeguard towersduring construction. Near permanent lifeguard towers, the line-of-sight from tower viewing platforms would be preserved. Sedimentcharacterization analyses confirmed that replenishment material isclean beach-quality material and would not pose a threat to publichealth and safety. Beach fill would not be placed above the heightof the existing beach berm so increased scarp heights would notoccur. For vessel safety, an approximate 500- by 500-foot bufferarea would be maintained around the dredge offshore waters, toallow proper anchoring and pump line operation, and the anchoringarea would be included in the Notice to Mariners, which is overseenby the U.S. Coast Guard. No significant impacts would result topublic health and safety.
Alternative 1b. Public access to the actual zones of constructionwould be closed for a longer period of time when compared toAlternative 1a. Also, lifeguard towers would be moved for a longerperiod of time until construction is completed. Although thisalternative would take longer to implement, it would still be short-term overall and no significant impacts are anticipated.
Alternative 2a. Public health and safety impacts under thisalternative would be similar to those described for Alternative 1. The South Carlsbad South receiver site proposed under thisalternative also has temporary lifeguard towers in place duringsummer months. If sand replenishment occurs during thesummer season when the temporary lifeguard towers are onsite,SANDAG would coordinate with the respective jurisdiction totemporarily relocate the towers during construction. Temporaryrelocation would not impair the ability of lifeguards to ensurepublic safety since this portion of the beach would be closed tothe public during construction activities. The towers would bereplaced after sand placement, before the beach is reopened forrecreational uses. This alternative would incrementally benefitthose areas threatened by bluff failure (although temporarily). However, Encinitas beaches near fragile bluffs (i.e., Batiquitos,Leucadia, and Moonlight receiver sites) would not receive thisincremental benefit under Alternative 2. Impacts would be lessthan significant.
Alternative 2b. Although this alternative would take longer toimplement, it would still be short-term, and no significantimpacts are anticipated.
No dredging or replenishment activities wouldoccur. At some receiver beaches, waves wouldcontinue to erode fragile bluffs that supportproperty and structures. This erosion wouldcontinue unabated.
STRUCTURES AND UTILITIES
Alternative 1a. At all receiver sites, any sand placed around storm Rdrain outlets would be dug out to allow proper drainage. Thebottom of public stairs and public access ramps may be covered bythe fill, which would tend to stabilize the stairways. Sand at the baseof lifeguard towers would provide additional protection againststorm surge damage and would temporarily benefit the lifeguardtowers. Overall, impacts would be less than significant.
Alternative 1b. As with Alternative 1a, replenishment would resultin a beneficial impact to structures and utilities by stabilizing them;no significant impacts to structures and utilities are anticipated.
Alternative 2a. Implementation of this alternative would resultin similar effects to structures and utilities as analyzed forAlternative 1. Sand placement is beneficial for structures since itprovides additional support and protection against erosion andstorm damage during winter months.
Alternative 2b. As with Alternative 2a, replenishment wouldresult in a beneficial impact to structures and utilities bystabilizing them; no significant impacts to structures and utilitiesare anticipated.
There would be no impacts to structures andutilities. The beneficial effect of stabilizingstructures such as stairways and outfalls wouldnot occur under this alternative.

Executive Summary
Table ES-7. Continued
Alternative 1 Alternative 2 No Action
Regional Beach Sand Project EIR/EA Page ES-2799-69\SANDAG EIREA es.wpd 7/17/00
TRAFFIC
Alternative 1a. Beach replenishment activities would notsignificantly affect traffic, as Alternative 1 would generate veryfew trips. Personnel would park in public parking areas and wouldnot create significant parking impacts given the small size of theland-side beach construction crew (approximately 12 persons). Traffic and parking could increase after sand placement at some Rlocations, as beaches would become more attractive to recreational Rusers. However, sand is not expected to last for the long-term, and Rcongestion at beaches is an accepted occurrence. There would be Rno significant impacts to traffic.
Alternative 1b. With implementation of the longer constructionschedule proposed under Alternative 1b, construction vehicleswould require vicinity parking and access for a slightly longerperiod of time. Impacts would still be less than significant due tothe short-term nature of this alternative and the very small numberof trips.
Alternative 2a. Alternative 2 would result in similar impacts tothose described for Alternative 1. Impacts would be less thansignificant.
Alternative 2b. Because dredging and replenishment activitieswould take a longer amount of time, construction vehicles wouldrequire vicinity parking and access to the receiver sites for alonger period of time. Impacts would be less than significant dueto the short-term nature of construction and small number oftrips.
As no beach replenishment activities wouldoccur, no trips would be generated.
AIR QUALITY
Alternative 1a. The sand would be quite moist, and the potentialfor dust generation would be very low; impacts would be less thansignificant. The emissions of CO, ROC and NOx from dredge andconstruction equipment would be less than the General Conformity RRules threshold values, and much less than ten percent of the air Rbasin emissions. Therefore, the proposed action is presumed toconform to the State Implementation Plan (SIP), and a formalconformity determination is not required. Emissions would notexpose sensitive receptors to pollutant concentrations. Air qualityimpacts would be less than significant.
Alternative 1b. While the duration of construction would be longeroverall, the total emissions would not increase because there wouldbe no emissions during the period when construction was notoccurring. Impacts would be less than significant.
Alternative 2a. Project-related emissions are less than theGeneral Conformity Rules threshold values and the proposed Raction is presumed to conform with the SIP. There is a very lowpotential for dust generation because the material being moved isextremely wet. Therefore there would be no significant airquality impacts.
Alternative 2b. While the duration of construction would belonger overall, the total emissions would not increase becausethere would be no emissions during the period when constructionwas not occurring. The minimal amount of traffic and lack offugitive dust, plus conformity with the SIP would support theconclusion of no significant impact.
As no construction would occur, no air qualityimpacts would result.
NOISE
Alternative 1a. While dredging activity and placement of theconveyor pipe and sand distribution at the receiver sites wouldgenerate noise, the impact would be less than significant. Nighttime and weekend work at receiver beaches would beperformed under variance from the local noise ordinance whererequired. Residents of homes near the receiver sites would benotified prior to the work, and adverse nighttime noise eventswould occur for no more than three consecutive days within 200
Alternative 2a. While dredging activity and placement of theconveyor pipe and sand distribution at the receiver sites wouldgenerate noise, the impact would be less than significant. Nighttime and weekend work at receiver beaches would beperformed under variance from the local noise ordinance whererequired. Residents of homes near the receiver sites would benotified prior to the work, and adverse nighttime noise eventswould occur for no more than three consecutive days within 200
There would be no change to current noiselevels.

Executive Summary
Table ES-7. Continued
Alternative 1 Alternative 2 No Action
Page ES-28 Regional Beach Sand Project EIR/EA99-69\SANDAG EIREA es.wpd 7/17/00
feet of the homes. Booster pumps would be electric motor drivenor diesel engines that would be shielded to attenuate noise to lessthan significant levels.
Alternative 1b. Noise generation would be the same as Alternative1a. No noise ordinance variances would be required. Short-termnighttime and weekend impacts would not occur at receiver beacheswhere nighttime and weekend work is prohibited. Other impactsand noise reduction measures would be the same as for Alternative1a. Impacts would be less than significant.
feet of the homes. Booster pumps would be electric motordriven or diesel engines that would be shielded to attenuate noiseto less than significant levels.
Alternative 2b. Noise generation would be the same asAlternative 2a. No noise ordinance variances would be required. Short-term nighttime and weekend impacts would not occur atreceiver beaches where nighttime and weekend work isprohibited. Other impacts and noise reduction measures would bethe same as for Alternative 1a. Impacts would be less thansignificant.

Executive Summary
Regional Beach Sand Project EIR/EA Page ES-2999-69\SANDAG EIREA es.wpd 7/17/00
Cumulative impacts were analyzed in consideration of other reasonably foreseeable projects in the vicinity
of project areas. Cumulative projects considered in the analysis consist of other ongoing or proposed
beach nourishment projects adjacent to the receiver sites; capital improvement or development projects
proposed adjacent to receiver sites; and proposed actions adjacent to the borrow sites. The analysis
concludes that no significant cumulative impacts would result with implementation of Alternatives 1, 2, or
the No Action Alternative.
ES-9 OTHER NEPA/CEQA CONSIDERATIONS
This section of the EIS/EIR addresses various other topics required by NEPA and CEQA.
Significant Unavoidable Adverse Effects
The EIR/EA evaluated the proposed alternatives with respect to numerous issues. None of the potential
impacts associated with the proposed project, as defined to include the monitoring and mitigation plan
described in subsection ES-5, would be considered significant.
Short-term Uses and Long-term Productivity
Implementation of the proposed action would not result in any environmental impacts that would
significantly narrow the range of beneficial uses of the environment or pose long-term risks to health, safety,
or the general welfare of the public communities surrounding the receiver sites. Rather, the project would
provide for future beneficial beach resources (e.g., recreational activities, sandy shoreline habitat).
Irreversible/Irretrievable Commitments of Resources
The proposed action would result in the consumptive use of nonrenewable energy sources and labor
required to operate dredges, trucks, pumping equipment, and grading equipment. The proposed action
would not result in the use of a substantial amount of resources and would be short-term in nature.
Additionally, no natural resources would be permanently destroyed and beach replenishment would be
considered beneficial to the region.
Executive Summary
Page ES-30 Regional Beach Sand Project EIR/EA99-69\SANDAG EIREA es.wpd 7/17/00
Growth Inducement
The proposed action would result in a temporary increase in beach area and sand cover at up to 12
receiver sites. A benefit of the project would be enhancement or continuation of the recreational usage of
each of the receiver sites. The resulting temporary recreational benefits derived from the additional beach
area would not be expected to increase the demand for public services and utilities, nor create a need for
additional recreational facilities above current projections.
Effects Found Not to Be Significant
The Initial Study prepared for project evaluated several issues found not to be significant, and were
therefore not analyzed in this EIR/EA. These issues were hazards and hazardous materials, mineral
resources, public services, agricultural resources, and population and housing. The remainder of the issue
areas listed in the Initial Study form were evaluated in detail in this document in Chapter 4.0. This analysis
determined that the proposed San Diego Regional Beach Sand Project, as defined to include the monitoring
and mitigation program in subsection ES-5, would not have a long-term significant effect on any of the
evaluated issue areas.
Protection of Children from Environmental Health Risks and Safety Risks
There would be no disproportionate impacts to children during implementation of the proposed sand
replenishment project. No significant impacts would occur and there is no indication that any impacts
would disproportionately accrue to children. Areas of replenishment would be restricted during project
implementation for safety reasons and no long-term effects would occur after the beach areas were
reopened for public use.
Environmental Justice
The proposed sand replenishment project would not have a disproportionate impact on minority
populations or low-income populations because the areas encompassed by the replenishment sites do not
include disproportionately high minority populations or low-income populations compared to the contiguous
cities or the county.
Executive Summary
Regional Beach Sand Project EIR/EA Page ES-3199-69\SANDAG EIREA es.wpd 7/17/00
Essential Fish Habitat
The project action would not result in long-term or significant effects to sustainable fisheries present in the
Coastal Pelagics or Pacific Groundfish Fish Management Plans. During dredging activities, fish would
move from the area of active dredge, but these species would not be lost to the ecosystem nor would
migration patterns be affected. Fish that feed on benthic biota would experience short-term loss of prey,
but because the active area of dredge would be small, the affect would not be significant. All dredging
operations would be performed in conformance with the permit conditions established by the 401 permit
issued by the RWQCB to control turbidity.
ES-10 AGENCY COORDINATION
Federal, state, and local agencies were consulted prior to and during the preparation of this EIR/EA.
Agencies were notified of dredging and replenishment plans for closure and disposal activities by mailings;
by scheduled public meetings; and by publication of an NOP announcing preparation of a Draft EIR/EA,
as required by CEQA and NEPA. The agencies’ viewpoints were solicited with regard to activities within
their jurisdiction. In addition, close coordination has occurred among SANDAG, the Navy, local
jurisdictions and regulatory agencies since the inception of this project. The alternatives analyzed in this
document are the result of an iterative process to present information to the resource agencies, obtain their
input, incorporate modifications into project design, and present the revised plan. Numerous interactive
meetings were held between March 1999 and May 2000 to facilitate this process. R
1.0 Introduction
Regional Beach Sand Project EIR/EA Page 1-199-69\SANDAG EIREA 3.4.wpd 7/17/00
CHAPTER 1.0INTRODUCTION
1.1 BACKGROUND
This Environmental Impact Report (EIR)/Environmental Assessment (EA) addresses the potential
environmental consequences of the San Diego Association of Governments’ (SANDAG) proposed
Regional Beach Sand Project. SANDAG proposes to replenish approximately 2 million cubic yards (cy)
of clean beach-quality sand on up to 13 receiver sites in the San Diego region. The receiver sites are
located from Oceanside in the north to Imperial Beach in the south. Sand would be dredged from six
offshore borrow sites. A regional location map, including the proposed receiver sites and sand borrow
sites, is shown in Figure 1-1.
SANDAG is the state lead agency responsible for compliance with the California Environmental Quality
Act of 1970 (CEQA) statutes (Cal. Pub. Res. Code § 21 et seq., as amended) and implementing guidelines
(Cal. Code Regs., Title 14, § 15000 et seq. (1998); and the Department of the Navy (Navy) is the federal
lead agency responsible for compliance with the National Environmental Quality Act of 1969 (NEPA) (42
U.S.C. § 4332 (1994)) in accordance with the Council on Environmental Quality (CEQ) regulations
implementing NEPA (40 C.F.R. §§ 1500-1508) and U.S. Navy regulations implementing NEPA (32
C.F.R. Part 775). The two agencies have agreed to prepare a joint EIR/EA pursuant to both CEQA and
NEPA. The Navy will be contributing funds for this project as appropriated by Congress in fiscal year
1998 Supplemental Appropriations and Recission Act. An overview of NEPA and CEQA and other
applicable environmental laws and regulations is provided in Appendix A.
1.1.1 Project Background
The San Diego region’s beaches and seacliffs have been steadily eroding for several decades. The region
is experiencing a net loss of sand at numerous beaches along its coastline. The Coast of California Storm
and Tidal Waves Study (CCSTWS), a six-year, $6 million scientific evaluation of the San Diego region’s
shoreline conducted by the U.S. Army Corps of Engineers (USACOE) documented the factors causing
shoreline erosion and projected trends of increasing beach loss and property damage in the future
(USACOE 1991).

1.0 Introduction
1 The northern half of the Oceanside Littoral Cell extends from Oceanside to Dana Point in Orange County.
Page 1-2 Regional Beach Sand Project EIR/EA99-69\SANDAG EIREA 3.4.wpd 7/17/00
Beach sand is a product of weathering of the land. The primary natural source for the region’s beaches
is sediment carried from inland areas by rivers and streams. Over the past half century, human actions have
been the major influence affecting the shoreline. Through urban development activities, including water
reservoir and dam building, flood control systems and sand mining, natural sediment transport has been
hindered or eliminated. Most major coastal streams have at least one dam and reservoir. Much of the
fresh water that naturally flowed to coastal wetlands is diverted to farms and cities. These dams reduce
the size of flood flows and thus reduce the flushing of sediment from estuaries. They also trap sand that
would otherwise nourish coastal beaches. This beach sand is the primary buffer protecting seacliffs and
coastal development from erosion and storm damage. To offset the loss of natural sand sources no longer
reaching the shoreline, previous projects have built “man made” beaches. Most of the sand for this purpose
has come from the massive harbor dredging projects in San Diego Bay and Oceanside Harbor. While the
likelihood is low that sources of sand as large as these dredging projects will be available in the future, sand
replenishment projects would help to offset the gradual thinning and disappearance of the region’s beaches;
loss of environmental, recreational, economic, and aesthetic benefits; and the increasing destruction of
coastal property and development.
The natural sand cycle is a seasonal process. Typically for the San Diego region, beach sand loss occurs
in the winter due to large storms and waves, followed by a period of sand gain during the summer’s gentler
storms and surf. During the winter, sand shifts from the beach above the mean sea level to the larger
portion of the beach offshore covered by seawater. These combined seasonal processes, including both
winter and summer sand shifts, comprise a complete sedimentation cycle.
A coastal segment that contains a complete sedimentation cycle is defined as a littoral cell. It is the dynamic
interface between the ocean and the land. Along the San Diego region’s coast, there are three littoral cells
that cycle sand on and off the beaches (Figure 1-2). Bounded on one side by the landward limit of the
beach and extending seaward beyond the area of breaking waves, a littoral cell is the region where wave
energy dissipates. Littoral cells are physically interconnected; occurrences in one part of a littoral cell will
ultimately have an impact on other parts. The three littoral zones off of the San Diego region include the
southern half of the Oceanside Littoral Cell, the Mission Bay Littoral Cell, and the Silver Strand Littoral
Cell. The southern half of the Oceanside Littoral Cell stretches from Oceanside to La Jolla1 and includes
the shorelines of the cities of Oceanside, Carlsbad, Encinitas, Solana Beach, Del Mar, and San Diego. The
Mission Bay Littoral Cell includes Ocean, Mission, and Pacific beaches in the City of San Diego. The

4.0 Environmental Consequences
Source: SANDAG
Page 1-3
NORTH
Figure 1-1Regional Location Map
BE
AC
H R
EP
LE
NIS
HM
EN
T S
ITE
S
OF
FS
HO
RE
BO
RR
OW
SIT
ES
SA
ND
DE
LIV
ER
Y P
IPE
LIN
ES
Regional Beach Sand Project EIR/EA9969 SANDAG Beach Replenishment/Figures/Fig 1-1 Reg Loc map 9/15/99
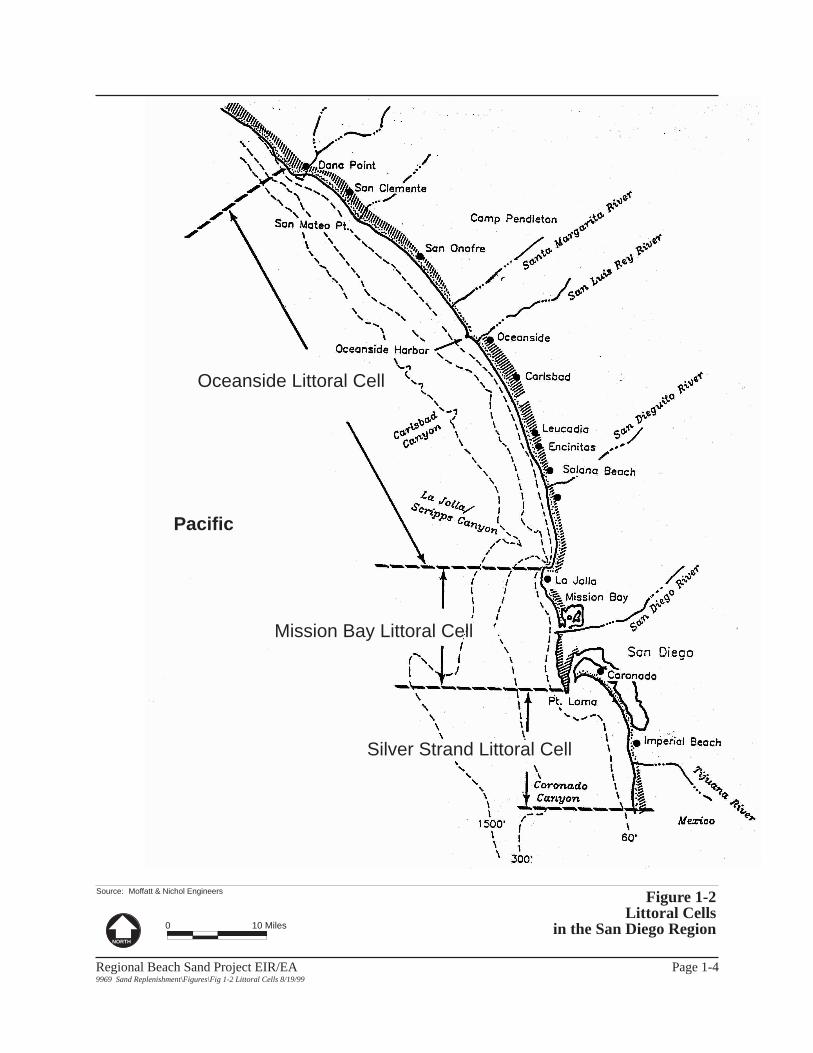
X.X Section Name
Source: Moffatt & Nichol Engineers
Regional Beach Sand Project EIR/EA9969 Sand Replenishment\Figures\Fig 1-2 Littoral Cells 8/19/99
Page 1-4
NORTH
Figure 1-2Littoral Cells
in the San Diego Region10 Miles0
Oceanside Littoral Cell
Pacific�������������
Mission Bay Littoral Cell
Silver Strand Littoral Cell

1.0 Introduction
2 The term “borrow” refers to material to be taken from one location to be used as fill at another location.
Regional Beach Sand Project EIR/EA Page 1-599-69\SANDAG EIREA 3.4.wpd 7/17/00
Silver Strand Littoral Cell extends from south of the international border to the Zuniga Jetty at San Diego
Bay and includes the shorelines of the cities of Imperial Beach and Coronado.
Within the littoral cell, sand can move up and down the coast as well as on and offshore. Sand can also
be carried by littoral drift into submerged canyons. For example, it has been estimated that Scripps
Submarine Canyon near La Jolla may, in some years, receives 220,000 cy of sand from littoral drift
(Moffatt & Nichol 2000a). Sand that drifts into submerged canyons essentially exits the littoral cell, and
it is no longer available to replenish beaches during the summer. The seaward edge of an active littoral cell
is defined as its “depth of closure.” Substantial quantities of sand from coastal littoral cells do not usually
travel outside of this depth and into the deeper ocean. Correspondingly, sand outside the depth of closure
does not move back into the littoral cell. In San Diego, the depth of closure ranges from approximately -26
to -46 feet (Moffatt & Nichol 2000a). The proposed dredging activities would take sand from borrow
sites2 outside (deeper than) the depth of closure and place sand within the three littoral cells. The new sand
being introduced to the system is expected to remain within the respective littoral cells and enter the
seasonal cycle of beach loss and gain. Conversely, dredging inside (shallower than) the depth of closure
would merely relocate sand material already within the littoral cell. (More information on littoral processes
and coastal geology is found in Sections 3.1 and 4.1 of this EIR/EA.)
In response to the concerns about erosion voiced by citizens and communities up and down the coast, and R
documented by the CCSTWS, SANDAG worked with member agencies to prepare the Shoreline R
Preservation Strategy for the San Diego Region (SANDAG 1993). The Shoreline Preservation R
Strategy is a strategy with a menu of solutions to address shoreline erosion including beach building by R
placing large amounts of sand on eroded beaches, structures such as groin fields to help hold sand in place, R
structures such as seawalls and sand berms to protect property, and policies and regulations regarding the R
use of the shoreline and its development such as bluff top building setbacks. Further, these tactics are R
divided into regional scale actions (beach building, redistributing sand via groins, breakwaters, etc.) and R
local scale methods (requiring setbacks, bluff top erosion management via irrigation controls, seawalls and R
revetments). R
R
The Shoreline Preservation Strategy recommends further engineering, economic and environmental R
design studies. It does not identify generalized locations for structures such as groins, but it does contain R
recommendations for sand volumes to be placed in each of the three littoral cells along the San Diego R
1.0 Introduction
Page 1-6 Regional Beach Sand Project EIR/EA99-69\SANDAG EIREA 3.4.wpd 7/17/00
region. A total of up to 30 million cy is identified in an initial beach building phase with a capital cost of R
approximately $150 million, to be supplemented by yearly maintenance. These estimates are qualified that R
any future design study could “recommend a less extensive, less costly program.” R
R
Funding sources to implement the Shoreline Preservation Strategy are identified in concept, anticipating R
that state and federal funds would cover only a portion of the total financing needs and that a major portion R
would have to come from local and regional sources. To date, the coastal cities have assessed themselves R
approximately $70,000 yearly to fund a coastal monitoring program. Other, one-time-only, funds totaling R
$14.3 million have been provided by the Navy and California Department of Boating and Waterways R
(Section 2.1.4). While the SEC continues to solicit funds to implement portions of the strategy, they have R
not been successful to date. In April 2000, a grant application for $64,000 to support a study on possible R
sand retention features was submitted to several state and federal entities for funding. All responded R
negatively. R
1.1.2 Previous Environmental Documentation
In 1993, SANDAG prepared the Shoreline Preservation Strategy for the San Diego Region, which
identified regional coastal areas with critical shoreline problems and recommended a strategy to address
the issue. Independent of that report, the Navy began to analyze a separate action in the Final
Environmental Impact Statement (EIS) for the Development of Facilities in San Diego/ Coronado
to Support the Homeporting of One NIMITZ Class Aircraft Carrier (Department of the Navy 1995).
In order to accommodate the carrier, the Navy proposed to dredge the carrier berthing area, turning basin,
and the San Diego Bay navigation channel. A portion of the dredged sediment was initially believed to be
suitable for beach replenishment. As one option to dispose of the dredged material from the Homeporting
project, the Navy evaluated nine beach receiver sites in the San Diego region in this EIS.
The Navy subsequently prepared two EAs as tiered analyses to the EIS due to subsequent changes in the
location of beach receiver sites. These two EAs are Environmental Assessment for Beach
Replenishment at South Oceanside and Cardiff/Solana Beach, California (Department of the Navy
1997a) and Environmental Assessment for Beach Replenishment at North Carlsbad, South Carlsbad,
Encinitas, and Torrey Pines (Department of the Navy 1997b). As a result of the Homeporting project
and subsequent EAs, permits were issued to the Navy to place approximately 5.5 million cy of sand
dredged from San Diego Bay, both onshore and nearshore, at 11 receiver sites along the San Diego region
coastline (Table 1-1). During beach replenishment in Oceanside, however, munitions were found in the
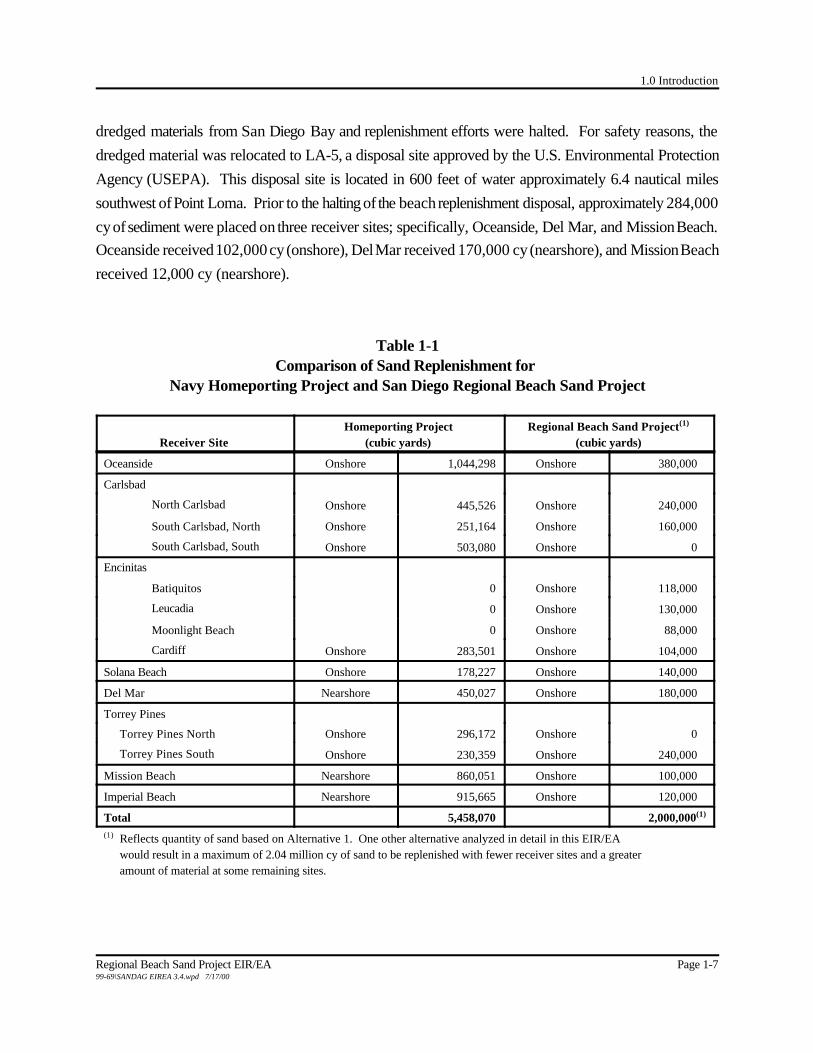
1.0 Introduction
Regional Beach Sand Project EIR/EA Page 1-799-69\SANDAG EIREA 3.4.wpd 7/17/00
dredged materials from San Diego Bay and replenishment efforts were halted. For safety reasons, the
dredged material was relocated to LA-5, a disposal site approved by the U.S. Environmental Protection
Agency (USEPA). This disposal site is located in 600 feet of water approximately 6.4 nautical miles
southwest of Point Loma. Prior to the halting of the beach replenishment disposal, approximately 284,000
cy of sediment were placed on three receiver sites; specifically, Oceanside, Del Mar, and Mission Beach.
Oceanside received 102,000 cy (onshore), Del Mar received 170,000 cy (nearshore), and Mission Beach
received 12,000 cy (nearshore).
Table 1-1Comparison of Sand Replenishment for
Navy Homeporting Project and San Diego Regional Beach Sand Project
Receiver SiteHomeporting Project
(cubic yards)Regional Beach Sand Project(1)
(cubic yards)
Oceanside Onshore 1,044,298 Onshore 380,000
Carlsbad
North Carlsbad Onshore 445,526 Onshore 240,000
South Carlsbad, North Onshore 251,164 Onshore 160,000
South Carlsbad, South Onshore 503,080 Onshore 0
Encinitas
Batiquitos 0 Onshore 118,000
Leucadia 0 Onshore 130,000
Moonlight Beach 0 Onshore 88,000
Cardiff Onshore 283,501 Onshore 104,000
Solana Beach Onshore 178,227 Onshore 140,000
Del Mar Nearshore 450,027 Onshore 180,000
Torrey Pines
Torrey Pines North Onshore 296,172 Onshore 0
Torrey Pines South Onshore 230,359 Onshore 240,000
Mission Beach Nearshore 860,051 Onshore 100,000
Imperial Beach Nearshore 915,665 Onshore 120,000
Total 5,458,070 2,000,000(1)
(1) Reflects quantity of sand based on Alternative 1. One other alternative analyzed in detail in this EIR/EAwould result in a maximum of 2.04 million cy of sand to be replenished with fewer receiver sites and a greateramount of material at some remaining sites.
1.0 Introduction
Page 1-8 Regional Beach Sand Project EIR/EA99-69\SANDAG EIREA 3.4.wpd 7/17/00
The proposed Regional Beach Sand Project proposes placement of less total material (2 million vs. 5.5
million cy) over generally the same receiver sites as the Navy’s permitted project. The proposed project
does differ, however, because the sand source has changed from dredged material in San Diego Bay to
dredged material from six offshore borrow sites, and additional receiver site locations have been added.
Table 1-1 provides a comparison between the Homeporting project which was permitted and partially
implemented, and the alternative under the Regional Beach Sand Project with the maximum number of
receiver sites. Existing data from the Navy’s prior analyses are used, where applicable, throughout this
EIR/EA and the monitoring program established by the Navy project permits is used as a framework for
designing the monitoring program for this project.
1.2 PURPOSE AND NEED
The purpose of the proposed beach replenishment project is to replenish beaches in accordance with the
Shoreline Preservation Strategy. This document identified regional coastal areas with critical shoreline
problems. SANDAG’s Shoreline Erosion Committee (SEC) has used this as a basis for identifying up to
13 receiver sites which have experienced erosion and need replenishment. The proposed action would
provide immediate benefit by placing suitable beach fill directly onto the region’s beaches rather than
placing some of it in the nearshore zone. The proposed action would serve four main functions: 1) to
replenish the three littoral cells and receiver sites with suitable beach sand; 2) to provide enhanced
recreational opportunities and access at the receiver sites; 3) to enhance the tourism potential of the San
Diego region; and 4) to increase protection of public property and infrastructure.
As the project has evolved, it has become apparent that predicting sand movement in the highly dynamic
ocean system is difficult. Another project feature is to establish replenishment sites which can be useful in
evaluating the predictions of the state-of-the-art modeling used in this process and thereby assist with any
future beach replenishment efforts in the region.
1.3 PROPOSED ACTION
The proposed action is beach replenishment of the San Diego region’s eroding beaches using
approximately 2 million cy of dredged sediment from offshore borrow sites located outside of the depth
of closure (i.e., outside of the respective littoral cells). Based on the recommendation of the SEC, one
replenishment action would involve up to 12 receiver sites using dredged sediment from six borrow sites.
This is the SEC’s preferred alternative. This document also evaluates, at an equal level of detail, one

1.0 Introduction
Regional Beach Sand Project EIR/EA Page 1-999-69\SANDAG EIREA 3.4.wpd 7/17/00
possible alternative for replenishment at nine receiver sites and the same six borrow sites. Between the two
alternatives, a total of 13 receiver sites are proposed and, along with the six proposed borrow sites, are
introduced below. A complete description of both alternatives is found in Section 2.4. The project was R
originally scheduled to start in late summer 2000 but the schedule has been modified to spring 2000 based R
on the recommendation of the SEC at their May 2000 meeting. R
Implementation of Alternative 1 would occur on the following 12 beaches in the San Diego region: South
Oceanside, North Carlsbad, South Carlsbad North, Batiquitos, Leucadia, Moonlight, Cardiff, Fletcher
Cove, Del Mar, Torrey Pines, Mission Beach, and Imperial Beach. In addition, a receiver site at South
Carlsbad South is proposed under Alternative 2 that is not associated with Alternative 1 (refer to Figure
1-1). Most of the 13 possible receiver sites are within suburban areas of the San Diego region and are
bordered by residential, commercial, or light industrial uses. All or portions of the beaches in Carlsbad,
Encinitas, and San Diego are State Beaches. The locations of all the potential receiver sites (north to south)
are identified briefly below. The locations reflect the receiver site footprint with the maximum length under
either alternative. Refer to Section 2.4 for a detailed description of receiver sites under each alternative.
The South Oceanside receiver site is near Buccaneer Beach and stretches for approximately two miles from
Seagaze Drive to Vista Way under the maximum length alternative. The proposed receiver site consists
of a narrow, eroded beach with rip-rap (large boulders) slopes from the back of existing residences to the
approximate high tide mark. The receiver site gently slopes from the high tide mark into the surf zone.
Because the immediate area has not been developed, there is a sandy beach approximately 150 feet wide
and 125 feet from the road to the line of rip-rap which protects homes to the north and south of Buccaneer
Beach.
The North Carlsbad receiver site is located south of the Buena Vista Lagoon and extends for over 3,000
feet (0.6 mile) to just south of Carlsbad Village Drive (Elm Avenue). This beach segment consists of a
predominantly flat and narrow sandy beach, extending from the surf line to rip-rap slopes and sea walls that
protect existing beach front residences and fragile bluffs.
The South Carlsbad receiver sites, both North and South, are adjacent to the Carlsbad State Beach
campground facilities near Encinas Creek. These beach segments cover approximately 0.4 mile and 0.3
mile, respectively. The existing beach in this area consists of an eroded and flat sandy beach with scattered
cobbles and vegetated bluffs. The proposed receiver sites lie at the base of a steep slope varying in height
from approximately 60 to 80 feet.

1.0 Introduction
Page 1-10 Regional Beach Sand Project EIR/EA99-69\SANDAG EIREA 3.4.wpd 7/17/00
The Batiquitos receiver site is located approximately 1,000 feet south of the Batiquitos Lagoon (the area
is also known as “Ponto”), stretching for approximately 1,390 feet (0.3 mile) into the community of
Leucadia and Leucadia State Beach. At the northern part of the receiver site, a relatively flat, sandy and
cobbly beach exists. Steep cliffs abut the southern portion of the proposed receiver site, where a gently
sloping sand beach with scattered rocks, cobbles, and rip-rap exists. During high tide, the beach is
completely washed over by incoming surf. Several residences are located on the bluff above.
The proposed receiver site at Leucadia extends approximately 2,700 feet (0.5 mile) from just south of the
Grandview access stairs to Glaucus Street. The Leucadia receiver site is similar to the southern end of the
Batiquitos receiver site in that steep cliffs abut the beach. The beach consists of a gently sloping sand beach
with scattered rocks, cobbles, and rip-rap. At high tide waves crash against the bluffs. Several residences
are located on the bluff above.
The proposed Moonlight Beach receiver site is located at the foot of Encinitas Boulevard at Moonlight
State Beach. The proposed receiver site is approximately 770 feet long (0.1 mile) and is adjacent to
residential uses. Moonlight State Beach consists of a gently sloping beach with sand and cobbles.
The Cardiff receiver site is located south of the San Elijo Lagoon mouth and also south of Restaurant Row
along Coast Highway 101. The receiver site extends approximately 780 feet (0.1 mile). The severely
eroded beach is mostly cobbles and is steeply sloping. The beach and surfing area is also known as
George’s.
The Solana Beach receiver site’s northern boundary is just south of Fletcher Cove Beach Park, and
extends approximately 1,800 feet (0.3 mile) to the south. Steep cliffs abut the receiver site and the beach
consists of a gently sloping sand beach with scattered rocks and cobbles. Rip-rap and other revetments
line the cliffs in an ongoing effort to slow wave-induced erosion. At high tide the beach is not visible along
the majority of the receiver site as waves crash directly against the cliffs. The only exception is the small
sandy beach at Fletcher Cove which sits above the high tide mark.
The Del Mar receiver site consists of a gently sloping and relatively wide sandy beach. Residential uses
abut the receiver site, which extends from 27th Street to Powerhouse Park, a distance of approximately
3,110 feet (0.6 mile). R
1.0 Introduction
Regional Beach Sand Project EIR/EA Page 1-1199-69\SANDAG EIREA 3.4.wpd 7/17/00
The Torrey Pines receiver site, located within the City of San Diego, is bordered by the Los Peñasquitos
Lagoon and Torrey Pines State Reserve. The receiver site, under the maximum length alternative, stretches
for approximately 2,470 feet (0.5 mile) and is located on Torrey Pines State Beach. The beach is a gently
sloping thin sand beach with scattered cobbles and high bluffs along Torrey Pines State Reserve. During
high tide, waves crash against the bluffs along the southern portion of the receiver site. There is also rip-rap
in some areas to protect North Torrey Pines Road from storm wave action.
The Mission Beach receiver site, also within the City of San Diego, is north of the Mission Bay Entrance
Channel. Under the maximum length alternative, the proposed receiver site extends approximately 2,380
feet (0.5 mile) from Ostend Court to Santa Barbara Place and is a gently sloping, relatively wide sandy
beach. The Boardwalk abuts the proposed receiver site.
The Imperial Beach receiver site is adjacent to the Tijuana Slough National Wildlife Park and
predominantly residential development. The receiver site, under the maximum length alternative, extends
for approximately 3,470 feet (0.7 mile) from Imperial Beach Boulevard to approximately 1,000 feet south
of Encanto Avenue. The northern end of the receiver site, from Imperial Beach Boulevard to Beach
Avenue, has some sand and cobble, but south of Beach Avenue the beach consists entirely of cobble.
All of the proposed borrow sites are surrounded by ocean water; the primary recreational activities
occurring nearby are boating, sailing, and diving pursuits.
1.4 PUBLIC INVOLVEMENT PROCESS
To identify key issues and concerns relevant to the scope of the EIR/EA, SANDAG and the Navy
encouraged participation in the environmental review process from public agencies, special interest groups,
and the general public. A major component of this process is public scoping. Scoping is a public process
designed to determine the breadth of issues to be addressed in the EIR/EA. The different aspects of the
public scoping discussed in this section include the Notice of Preparation (NOP), and areas of controversy
identified as a result of public scoping.

1.0 Introduction
Page 1-12 Regional Beach Sand Project EIR/EA99-69\SANDAG EIREA 3.4.wpd 7/17/00
1.4.1 Notice of Preparation (NOP)
Both NEPA and CEQA regulations require an early and open process for determining the scope of issues
that should be addressed prior to implementation of a proposed action. SANDAG initiated the 30-day
scoping process on April 21, 1999. NEPA does not require public notification for preparation of an EA.
The NOP provides formal notification to all federal, state, and local agencies involved with funding or
approval of the project, and to other interested organizations and members of the public, that an EIR/EA
will be prepared for the project. The NOP is intended to encourage interagency communication concerning
the proposed action and provide sufficient background information about the proposed action so that
agencies, organizations, and individuals can respond with specific comments and questions on the scope
and content of the EIR/EA. As part of the NOP, an Initial Study was prepared. Copies of the NOP and
Initial Study are included in Appendix B.
1.4.2 Comments Received During Scoping
During the 30-day public scoping period, a total of 17 written comment letters were received. All are
reproduced in Appendix B. Various issues raised during this process are summarized below by topic.
Description of Proposed Action and Alternatives
• need more information on timing of the proposed action
• clear description of project including schedule for beach replenishment
• need more information on how the construction training dikes will operate
• the proposed dikes should include design dimensions as well as construction and removal details
• indicate how offshore activity and piping will meet Coast Guard, U.S. Marine Corps, and navigational
requirements
Coastal Wetlands
• clearly describe potential impacts to all coastal wetlands
• include a description of any monitoring programs at coastal lagoons
• impacts from accumulation of sediments at lagoon inlets and creek and river outlets should be
addressed
1.0 Introduction
Regional Beach Sand Project EIR/EA Page 1-1399-69\SANDAG EIREA 3.4.wpd 7/17/00
Water Resources
• drainage in and around pipelines needs to be addressed at all storm drain areas
• describe any debris from discharge points that would end up on the beach
Biological Resources
• impacts to plants, fish, and wildlife populations and their habitats, energy supplies, and reproductive
requirements
• impacts to vegetated intertidal and subtidal areas should be addressed
• impacts to fisheries and clamming in and adjacent to the project area should be addressed
• impacts resulting from increased turbidity to biological resources and commercial invertebrate species
(e.g., lobster, urchins, crabs, and abalone) in their larval and post-larval invertebrate settlement stages
should be addressed
• impacts and mitigation for the Pismo clam (particularly in the Mission Beach and Silver Strand areas)
should be addressed
• impacts and mitigation for the California least tern, California brown pelican, and snowy plover should
be addressed
• the project should include a multi-year monitoring program for impacts to offshore marine resources
as well as a mitigation proposal to address any adverse impacts to marine habitat in the event they are
shown by the monitoring to occur
• need to locate, identify and describe all seagrass ecosystems and biological resources within the project
location
Cultural Resources
• impacts should be evaluated on prehistoric cultural resources, especially from the following offshore
borrow sites: AH-1, SO-7, SO-6 and SO-4
• mitigation should be provided for any found cultural materials during dredging activities
Land and Water Use
• impacts to State Lands Commission sovereign lands should be addressed
• a coastal development permit is needed per Coastal Act for all development within the coastal zone
• impacts to public access, recreation, small craft use, swimming, surfing should be addressed

1.0 Introduction
Page 1-14 Regional Beach Sand Project EIR/EA99-69\SANDAG EIREA 3.4.wpd 7/17/00
• include a table listing potential lengths of closure for each affected beach
• environmental impacts of the two different dredge types should be addressed
• identify the need for coastal development permits from the California Coastal Commission for both
dredging and disposal activities
• impacts to artificial reef site off of Mission Beach should be addressed
• address as applicable the potential impacts to County of Orange Coastal Regional Recreation Facilities
as a result of littoral drift, water quality impacts, and marine biology, with appropriate mitigation
measures
• recreation impacts to beach users should be addressed
• the discharge pipe network including submerged and floating segments should be mapped to assess
impacts to recreational beach and surf zone uses
• no construction should occur during special events at receiver sites
Aesthetics
• if nighttime pumping or lighting on the beach is contemplated, please include an analysis of potential
impacts to residents and conformance with the City of Oceanside Light Pollution Ordinance
Socioeconomics
• impacts to the livelihood of the San Diego region fishing community engaged in the commercial fisheries
of lobster, urchin, sheephead, and/or shrimp should be addressed
• turbidity effects on sea urchin industry fisheries should be addressed
Public Health and Safety
• the transition from offshore to onshore piping should be in a location and manner that meets public
safety, emergency access, and public access needs
• the sand discharge area needs to be staffed at all times and warning signs placed appropriately
• address impacts to lifeguard services
Noise
• evaluate construction and dredging/discharge equipment noise impacts
• include a noise analysis of the sand pumping operation
1.0 Introduction
Regional Beach Sand Project EIR/EA Page 1-1599-69\SANDAG EIREA 3.4.wpd 7/17/00
• the location, size and sound level of pumping activities and onshore heavy equipment should be
analyzed relative to the nearest sensitive receptors (residences)
• include the time period for pumping activities
• show location of any onshore staging areas and type of equipment/materials to be stored in these areas
• odor assessments and concerns should be addressed
1.4.3 Areas of Special Concern to Commentors
Members of the public and agencies have expressed concern about the potential effects to biological
resources, coastal wetlands, commercial fisheries, water quality, and recreation. These concerns are
addressed in the project objectives and analyzed in detail in Chapter 4.0 (Environmental Consequences)
of this document.
1.5 INTERAGENCY COORDINATION
The lead agency for this proposed action is SANDAG in cooperation with the Navy. The agencies listed
below have been coordinating with the lead agencies on the proposed action. Numerous representatives
of other non-agency interest groups have been contacted as part of project. A more detailed description
of the extensive agency and public coordination undertaken as part of this project is provided in Chapter
7.0.
U.S. Army Corps of Engineers
U.S. Environmental Protection Agency
U.S. Fish and Wildlife Service
National Marines Fisheries Service
California Coastal Commission
California Department of Fish and Game
California Department of Parks and
Recreation
California Regional Water Quality Control
Board (San Diego, Region 9)
California State Lands Commission
California Department of Boating and
Waterways
City of Oceanside
City of Carlsbad
City of Encinitas
City of Solana Beach
City of Del Mar
City of San Diego
City of Coronado
City of Imperial Beach
County of San Diego
Port of San Diego

2.0 Alternatives Considered
Regional Beach Sand Project EIR/EA Page 2-199-69\SANDAG EIREA 3.4.wpd 7/17/00
CHAPTER 2.0ALTERNATIVES CONSIDERED
This section discusses alternatives to satisfy the purpose and need. CEQA and NEPA require that an
EIR/EA evaluate a “reasonable” range of alternatives. According to the CEQA Guidelines, “...an EIR shall
describe a range of reasonable alternatives to the project, or to the location of the project, which would
feasibly attain most of the basic objectives of the project but would avoid or substantially lessen any of the
significant effects of the project, and evaluate the comparative merits of the alternatives”(Cal. Code Regs.,
Title 14, § 15126.6(a)). Under NEPA, reasonable alternatives are those that are practical or feasible from
a technical or economic perspective, and based on common sense (46 Fed. Reg. 18026, as amended, 51
Fed. Reg 15618). Under CEQA, the factors that can determine feasibility are site suitability, economic
limitations, General Plan consistency, other plan or regulatory limitations, and jurisdictional boundaries. An
EIR need not consider an alternative whose effects cannot be reasonably ascertained and whose
implementation is remote and speculative.
This chapter of the EIR/EA is organized into seven primary sections. Section 2.1 discusses the alternative
selection criteria. Section 2.2 briefly describes the process undertaken to generate and evaluate
alternatives, including a brief overview of the modeling process used to predict sand transport with
implementation of the project. Alternatives eliminated from detailed review in this EIR/EA and the reasons
for their elimination are addressed in Section 2.3. Section 2.4 provides detailed descriptions of the
alternatives evaluated in this EIR/EA. As with the Navy’s previous sand disposal project, monitoring would
be required to understand how the nearby ocean system responds to the introduction of this material over
time and mitigation commitments are identified given various outcomes. The framework for monitoring and
mitigation is provided in Section 2.5. A summary comparison of the potential impacts for each alternative
is provided in Section 2.6. Section 2.7 provides a list of permits and approvals required for the proposed
action.
2.1 ALTERNATIVE SELECTION CRITERIA
Various alternatives for beach replenishment were established based on the following selection criteria. In
total, up to a maximum of six sites were selected for dredging activities, and up to 13 sites were selected
for beach sand replenishment.
2.0 Alternatives Considered
Page 2-2 Regional Beach Sand Project EIR/EA99-69\SANDAG EIREA 3.4.wpd 7/17/00
2.1.1 Consistency With SANDAG Shoreline Preservation Strategy
SANDAG has developed the Shoreline Preservation Strategy for the San Diego Region (1993), which
identifies regional coastal areas with critical shoreline problems. Based on this study and input from local
communities, beaches in critical need of replenishment were identified. The SANDAG study was used to
determine site-specific alternatives for beach replenishment. Implementation of the proposed action reflects
the critical need for sand at the proposed receiver sites.
2.1.2 Avoidance of Sensitive Marine Resources
Beach sites along the San Diego coast were analyzed for onshore beach replenishment suitability. Areas
with significant sensitive marine resources, such as rocky intertidal reefs, subtidal vegetated reefs with
feather boa kelp, surfgrass, or sea palm, or nearshore reefs with giant kelp were avoided for direct sand
placement.
2.1.3 Compatibility of Material Between Receiver and Borrow Sites
Beach replenishment using dredged sediments is generally considered beneficial, assuming the dredged
material does not contain contaminants and consists primarily of sand of acceptable grain size (i.e., similar
to that of the beach to be nourished). The USACOE and U.S. Environmental Protection Agency (USEPA)
generally require a minimum of 80 percent or greater sand composition for beach replenishment. To
determine if beach replenishment is feasible, core samples of the material to be dredged are compared to
samples from the existing beach replenishment sites. Compatible material can be placed directly onshore.
Based on results of grain-size analysis and sampling of the sediments within the proposed dredge footprints,
over 30 million cy of dredged sediment from six offshore borrow sites would be considered suitable for
beach replenishment. This volume does not consider environmental or engineering constraints which would
limit the actual quantity available for replenishment (Sea Surveyor 1999).
2.1.4 Budget Considerations
The funding for the Regional Beach Sand Project consists of $14.3 million from two sources. The federal
government has committed $9.63 million and the State of California has committed $4.7 million. The funds
from the state are authorized by special legislation. The funds from the federal government were
2.0 Alternatives Considered
Regional Beach Sand Project EIR/EA Page 2-399-69\SANDAG EIREA 3.4.wpd 7/17/00
appropriated by Congress in fiscal year 1998 Supplemental Appropriations and Recission Act. The Navy
and the California Department of Boating and Waterways are the respective federal and state agencies
administering the funds. This funding source is providing for all engineering design and construction plans;
all environmental compliance costs, including CEQA/NEPA documentation, monitoring, and mitigation (if
necessary); all permitting activities; and construction.
2.2 PROCESS BY WHICH ALTERNATIVES WERE DERIVED
When the engineering design and environmental process was initiated in spring 1999, the SEC’s goal was
to replenish regional beaches with as much sand as they could achieve within the budget. Given the
available funds, estimated cost for environmental compliance, engineering design plan and costs for
dredging, an estimated range of 2 to 3 million cy was calculated. To achieve that goal, it was necessary
to design a project that minimized potential impacts to sensitive resources. By designing such a project,
SANDAG could more readily obtain necessary permit approvals, minimize costs for post-construction
monitoring and mitigation, and maximize funds to pay for dredging, thereby maximizing sand quantity.
SANDAG initiated an iterative process of identifying sensitive resources, defining appropriate borrow sites
and dredge locations, modeling sand transport and designing appropriate receiver sites and footprints.
Throughout this process, the resource agencies were consulted and their input utilized (Sections 1.5 and
7.0). The SEC was kept informed and provided guidance at key decision points. Over time, some
potential borrow sites were eliminated from further consideration, dredge locations were altered, receiver
site footprints were modified, and sand quantities varied.
To define appropriate borrow sites, ten potential offshore borrow sites were evaluated for beach
replenishment suitability based on grain size and sediment analysis (Sea Surveyor 1999). Of those, four
were eliminated. Within the remaining six borrow sites, the dredge locations were refined over time to
avoid resources that were identified during the environmental process, e.g., artificial reefs and underwater
archaeological sites. The borrow sites which were eliminated and/or modified are described in Section 2.3.
To predict the movement of sand once placed on the various receiver sites, and therefore potential impacts
to sensitive resources, both analytical and numerical modeling were performed. (Appendix C contains
more detailed information about both types of modeling.) Analytical modeling (diffusion method) was used
on receiver sites at Mission Beach and Imperial Beach. The diffusion method is a simplified condition that
assumes an idealized straight shoreline. Given the location of the beach fill and breaking wave height, sand

2.0 Alternatives Considered
Page 2-4 Regional Beach Sand Project EIR/EA99-69\SANDAG EIREA 3.4.wpd 7/17/00
is dispersed up and down the shoreline. This simplified model is appropriate for these sites because they
are geographically isolated from other fills, they have relatively straight coastlines, and lack sensitive
resources.
Numerical modeling was used for the remaining receiver sites because the northern coast of the San Diego
region is more varied with coves, promontories, lagoons, and built structures, and there would be multiple
beach fills in close proximity with overlapping effects. The model used for this project, the Generalized
Model for Simulating Shoreline Change (GENESIS), predicts sand movement up and down the coast only
(longshore) and does not predict on and offshore movement. Instead it assumes that sediment movement
on and off the beach (cross-shore) is seasonal and averages over the long-term and therefore, there would
be no long-term change in the beach profile. The GENESIS model is the most current technology. There
is no available model to simultaneously consider both longshore and seasonal cross-shore sediment
transport, which is the natural process.
GENESIS is intended to provide a generalized long-term trend in shoreline response. The results can
indicate anticipated general areas of sand gain (deposition) or erosion at orders of magnitude over large
scales. While modeling shoreline change over time is inherently imperfect, there is no better or more
accurate alternative available at this time. The modeling of longshore sediment transport was supplemented
by GENESIS with analysis of seasonal beach profile changes using an analytical method. The method
involves converting the new mean sea level position predicted by GENESIS into a new beach profile at
each beach profile location. The purpose of the work was to quantify the depth of sand cover in the
nearshore zone in the vicinity of the beach fills to assess potential effects to biota. A depth of sand cover
was calculated over the average winter profile at each location (for winter conditions) and over the average
summer profile at each location (for summer conditions). This was done at six month intervals for five years
after project construction to represent end of winter conditions (May) and end of summer conditions
(October) for each year. Once the depth of sand cover was calculated at each beach profile location, the
depth of cover at areas in between the profiles was interpolated from that at the profiles. A computer
program was prepared to calculate the depth of sand cover in between the profiles using a relationship that
was developed for all North County beaches between predicted changes in shoreline position and the depth
of sand cover along the length of the profile.
The modeling results were used in this process to guide the development of alternative receiver sites,
alternative footprint locations and to assist in estimating potential sedimentation impacts to marine biological
resources. Model-prediction in this inherently dynamic system are estimates only and cannot be considered
2.0 Alternatives Considered
Regional Beach Sand Project EIR/EA Page 2-599-69\SANDAG EIREA 3.4.wpd 7/17/00
definitive. Actual project impacts can only be determined based on post-project monitoring. However,
sensitivity analyses were performed to understand how results could vary based on input parameters and
a comparison of results with empirical data was performed to help understand the model predictions in this
context. The predictions were found to be relatively consistent with empirical data, and likely conservative
(Moffatt & Nichol 2000b). Also, when interpreting the results of the model, this analysis has consistently
utilized the worst-case, most conservative output.
Based on the results of initial modeling, four receiver sites were modified in length and location to avoid
direct impact to resources, typically reefs (Section 2.3). Modeling was performed again with a maximum
3 million cy alternative and the refined receiver sites. Potential worst-case impacts to sensitive marine
resources were quantified. In an attempt to further reduce impacts, two scenarios were generated with less
sand overall (2 million cubic yards). In October 1999, the SEC authorized their consideration. Under one
scenario, the total volume of sand at each receiver site was reduced by one-third (Scenario 1). Under the
other scenario (Scenario 2), reallocation of sand away from more sensitive beaches was reevaluated to
further reduce impacts. As a result, Moonlight Beach and Cardiff receiver sites were eliminated and that
sand placed at alternate northern beaches. The intent was to reduce potential impacts to marine resources
by decreasing the amount of sand introduced to the system and by avoiding direct sand placement at
offshore sensitive receiver sites. Based on additional sand transport modeling and evaluation of sand
deposition patterns, potential worst-case impacts to biological resources were again estimated.
Both of the 2 million cy scenarios, as well as the 3 million cy alternative, were presented to the SEC on
December 9, 1999. Based on direction from the SEC, both scenarios were modified slightly to increase
sand volume at the North Carlsbad receiver site from 160,000 cy to 240,00 cy. Preliminary evaluation
indicated that potential impacts to marine resources would be very similar in scale under either 2 million cy
scenario. At the December 1999 SEC meeting, Scenario 1 was selected as preferred, and the SEC
directed the evaluation of that scenario in this EIR/EA.
Subsequent to the December 1999 meeting, a preliminary evaluation of mitigation and monitoring
requirements was prepared using the previous Navy project’s permit requirements as a guide. That
evaluation identified monitoring requirements during construction as well as post-construction, and provided
preliminary cost estimates. Based on the high cost to mitigate impacts to reefs, another alternative was
generated. The modeling of various alternatives consistently predicted areas of persistent sand deposition
off North Carlsbad and Moonlight Beach. The depositional areas were located where mapping was not
available. Based on worst-case, conservative assumptions, the potential indirect impacts to reefs would
2.0 Alternatives Considered
Page 2-6 Regional Beach Sand Project EIR/EA99-69\SANDAG EIREA 3.4.wpd 7/17/00
be cost-prohibitive in terms of mitigation. Given the need to reduce potential impacts, receiver sites which
contributed to impacts at these two locations were eliminated. Therefore the North Carlsbad receiver site
was eliminated. Based on the shape of the coastline and subsequent longshore sand transport patterns,
most of the sand placed at receiver sites in Encinitas contributed to the deposition at Moonlight Beach, and
therefore the Batiquitos, Leucadia and Moonlight Beach receiver sites were eliminated.
At the SEC meeting in January 2000, the Committee directed preparation of the EIR/EA with two
alternatives. One was the 2 million cy alternative selected as preferred at the December 1999 meeting.
The other was the modified 2 million cy alternative generated subsequent to that meeting.
2.3 ALTERNATIVES ELIMINATED FROM DETAILED REVIEW
The following text provides more description of various alternatives originally considered for the proposed
action but eliminated from further detailed review in this environmental document. As described in Section
2.2, numerous alternatives were initially considered for borrow sites and receiver sites. Additionally, there
were various options for pipeline routes and sand placement (i.e., nearshore versus onshore or feeder
beaches). Methods to retain sand were also considered. As described in Section 2.2, various alternatives
have been modeled, evaluated in the technical reports, and presented to the SEC. Those that have been
eliminated from further detailed review are identified below.
2.3.1 Preliminary Offshore Borrow Sites
Under preliminary plans for beach replenishment, ten offshore borrow sites were tested for beach
replenishment suitability (Sea Surveyor 1999). Four of these borrow sites were eliminated as described
below.
SO-8 is located off Oceanside, south of the northernmost borrow site, SO-9. The site was tested to be
used as source material to replenish the South Oceanside and North Carlsbad receiver sites. Based on
testing of the borrow material, the material was determined to be too fine and silty and thus unsuitable.
Some suitable sand was found in a second layer of sediment, but would be too difficult and costly to dredge
in comparison to the suitable sediment available at S0-9 (Sea Surveyor 1999). Because SO-9 was found
to contain suitable dredge material for beach replenishment for the two receiver sites, SO-8 was eliminated
from further review.
2.0 Alternatives Considered
Regional Beach Sand Project EIR/EA Page 2-799-69\SANDAG EIREA 3.4.wpd 7/17/00
Similar to SO-8, AH-1 is located off of Oceanside, and would have served the South Oceanside and
North Carlsbad receiver sites. The material to be dredged from AH-1 was found to be too silty and fine
for beach replenishment purposes (Sea Surveyor 1999). Given the suitability of dredge material from SO-
9, AH-1 was dropped from further consideration.
SO-4, located off of Torrey Pines State Reserve/Beach, was originally considered for the source of borrow
material to replenish the Torrey Pines receiver site. Based on grain-size analysis, the material to be dredged
was too fine to match existing sand at the receiver site (Sea Surveyor 1999). Also, SO-4 has only a small
area with only two core samples that were deemed suitable for beach fill, and it therefore could not have
provided the quantity needed for replenishment. The SO-5 borrow site, located to the north off of Del
Mar, would contain enough material for deposition at the Torrey Pines receiver site in addition to the
Solana Beach and Del Mar receiver sites. Therefore, the SO-4 borrow site was eliminated from further
review.
Borrow site SS-2 was also considered for replenishment of the Imperial Beach receiver site. This borrow
site is located off of Imperial Beach, northwest of SS-1. During preliminary examination of the dredge
material from SS-2, approximately 0.7 million cy was found to be suitable for beach replenishment;
however, approximately 1.0 million cy of unsuitable material overlies the suitable sand. As a result,
dredging costs would be prohibitive at this borrow site, and the site was deemed unacceptable for beach
replenishment.
In addition to borrow sites being eliminated, other borrow sites were refined to obtain the best quality of
sediment or to avoid sensitive resources. For instance, after further review of sediment testing results at
SO-9, the dredge area was reduced in size because some of the material would be too fine for beach
replenishment purposes at the South Oceanside and North Carlsbad receiver sites. The preliminary dredge
areas at SO-7 and MB-1 were relocated to avoid direct impacts to artificial reefs created by the California
Department of Fish and Game (see Sections 3.6 and 4.6). Finally, the SS-1 dredge area was revised to
avoid the City of San Diego’s ocean outfall.
Further revisions to several borrow site footprints were made in order to avoid, to the maximum extent
possible, areas with a high probability of containing underwater archaeological resources. At SO-9, the
originally proposed footprint was relocated to the east and extended to the north and south. SO-7's dredge
area footprint was reduced. At SO-6, the footprint for dredging was relocated slightly to the east to avoid
a known shipwreck in the vicinity.

2.0 Alternatives Considered
Page 2-8 Regional Beach Sand Project EIR/EA99-69\SANDAG EIREA 3.4.wpd 7/17/00
2.3.2 Onshore Borrow Sites and Other Sand Sources R
R
Onshore sources of material were also considered including: (1) dredging sand from behind Henshaw Dam, R
or other dams that act as sediment “sinks”; (2) removing dams that currently interrupt river-borne sediment; R
or (3) terminating regional sand mining activities that prevent sand from reaching the shoreline. Dredging R
sand from behind any dam and transporting that material to the shoreline would involve the use of trucks R
for transportation. A typical truck carries 14 cy of material. Receiver sites for this action would vary in R
size from 100,000 to 570,000 cy resulting in over 7,140 trips for the smallest site and over 40,700 truck R
trips for the largest site. Transportation and construction from onshore borrow sites would result in air R
emissions, noise impacts and conflicts with beach users for parking and access that resulted in its R
elimination. R
R
San Diego is a semi-arid region and precipitation is highly variable. The need for a consistent source of R
water has lead to the construction of dams on all major water courses in the region, except the Santa R
Margarita River. Since the late 1940s, local water sources have been supplemented by imported water R
which has been stored in reservoirs created by those dams (Pryde 1992). The local supply of water is R
limited and efforts continue to increase the amount of water storage and improve the delivery system. The R
San Diego County Water Authority is currently implementing the Emergency Water Storage Project, which R
will provide additional local water supplies by constructing a new dam in Olivenhain as well as raise the R
height of the dam at the San Vicente Reservoir. The need for local water supplies for the growing R
population would make it infeasible to remove dams in the region and allow sediment to flow naturally to R
the ocean. R
R
Sand and aggregate mining in San Diego County is used to support the construction industry and provides R
raw material for making concrete, preparing road beds, and other uses. It is a necessary raw material also R
for road maintenance. The California Division of Mines and Geology Special Report 153 (n.d.) estimates R
a need for approximately 760 million tons of aggregate in San Diego County through the year 2030. If sand R
mining in San Diego were halted, or reduced, other sources would have to be found, mostly likely from R
Riverside and San Bernardino counties. This would necessitate additional truck trips to carry the material R
resulting in air and noise impacts, and there may not be enough material to support the local demand. Given R
the economic importance of the construction industry, it would not be feasible to interrupt the local supply R
and wait for local material to make its way down the river system to the ocean. R
2.0 Alternatives Considered
Regional Beach Sand Project EIR/EA Page 2-999-69\SANDAG EIREA 3.4.wpd 7/17/00
2.3.3 Preliminary Receiver Sites
Modeling was initially performed for expanded footprints at four receiver sites – North Carlsbad, Leucadia,
Solana Beach, and Torrey Pines. The expanded footprints aimed to place sand along a longer or different
stretch of these receiver sites, but results indicated that sensitive biological resources would be directly
impacted. Therefore, these receiver sites were redesigned to avoid the offshore resources. Below is a
description of the four preliminary receiver sites and how they differ from the footprints now proposed.
The North Carlsbad receiver site was initially located south of the Buena Vista Lagoon and extended for
approximately 6,420 feet (1.2 miles) to just south of Juniper Avenue. The initial receiver site extended
approximately 2,000 feet farther south than the site currently proposed (refer to Section 2.4). The initial
beach segment consisted of a predominantly flat sandy beach, extending from the surf line to rip-rap slopes
and sea walls that protect existing beach front residences and fragile bluffs.
The initial receiver site at the Leucadia site extended approximately 4,500 feet (0.9 mile) from Jasper Street
to south of South El Portal Street, which is farther south and 1,800 feet longer than the site currently
proposed. The Leucadia receiver site was similar to the southern end of the Batiquitos site in that steep
cliffs abut the beach. The beach consists of a gently sloping sand beach with scattered rocks, cobbles, and
rip-rap. Several residences are located on the bluff above.
Beach replenishment at the initial Solana Beach receiver site would have consisted of the placement of
dredged sediment along approximately 4,160 feet of the beach, including Fletcher Cove. The receiver site
extended from the foot of Cliff Street to south of Dahlia Street, stretching farther north and 2,360 feet
longer than the site currently proposed. Steep cliffs abutted the receiver site and the area consisted of a
gently sloping sand beach with scattered rocks and cobbles. Several residences and condominiums are
located on the bluff above.
The initial Torrey Pines receiver site, located within the City of San Diego, is bordered by the Los
Peñasquitos Lagoon and Torrey Pines State Reserve. The site stretched for approximately 4,860 feet (0.9
mile) and was located on Torrey Pines State Beach. The currently proposed receiver site under the
maximum length alternative is approximately 2,390 feet shorter in length. The beach is a gently sloping sand
beach with scattered cobbles and high bluffs along Torrey Pines State Reserve. There is also rip-rap in
some areas to protect North Torrey Pines Road from storm wave action.
2.0 Alternatives Considered
Page 2-10 Regional Beach Sand Project EIR/EA99-69\SANDAG EIREA 3.4.wpd 7/17/00
2.3.4 Preliminary Pipeline Routes
The S0-9 discharge pipeline was originally designed to make landfall at the closest point to the borrow site.
Under this scenario, landfall would have occurred to the north of the Oceanside Harbor, within the
boundary of the Unites States Marine Corps Base (MCB) Camp Pendleton. The discharge pipeline would
then have to be submerged underneath the harbor and routed south to the South Oceanside and North
Carlsbad receiver sites. Instead, the landfall location was moved south, which would facilitate sand delivery
without interfering with the harbor or the military base.
2.3.5 Nearshore Fill Placement
Nearshore placement of fill was originally discussed at four sites: Oceanside, Del Mar, Mission Beach, and
Imperial Beach. Placing sediment in the nearshore zone would introduce material to the littoral cell, which
would be beneficial, but would not be as beneficial as direct onshore placement. The amount of sand that
would actually occur on the intended receiver sites is unknown and the benefits of nearshore placement are
more uncertain. Also, as only four sites in the entire San Diego region were considered, the project was
not truly “regional” by nature. Because this method of sand replenishment would not have the same
immediate benefits to an intended receiver site, and would not fulfill the regional purpose and need of the
project, it was eliminated from further consideration.
2.3.6 Feeder Beach Replenishment
Under this alternative, sand would be replenished at Oceanside and Carlsbad, and then travel south in the
Oceanside Littoral Cell to replenish other north county beaches. Sand would also be placed at the Mission
Beach and Imperial Beach receiver sites to feed their respective littoral cells. In 1996, 2.1 million cy were
placed on Ponto Beach in southern Carlsbad. That action would be similar to this alternative. While this
previous replenishment project did introduce sand to the Oceanside littoral cell and did enhance that
specific location, the regional benefits have been difficult to quantify. Because the benefits of beach
replenishment at the southern reaches of the Oceanside Littoral Cell would also be difficult to quantify, and
there would not be immediate benefits at specific receiver sites, it is unlikely that this alternative would fulfill
the project’s regional objectives or desire to address specific beaches identified by the SEC with critical
erosion problems.
2.0 Alternatives Considered
Regional Beach Sand Project EIR/EA Page 2-1199-69\SANDAG EIREA 3.4.wpd 7/17/00
2.3.7 Sand Retention
Early in the alternatives development process, sand retention strategies from a regional perspective were
considered, including the incorporation of retention reefs, groins, jetties, and artificial headlands (Moffatt
& Nichol 1999). However, the high cost of constructing sand retention devices along the coastline made
them questionable from a cost-effectiveness standpoint, and would detract from the volume of sand to be
placed at each of the receiver sites, given the proposed action’s fixed budget. For example, the estimated R
cost of extending the north jetty at Agua Hedionda Lagoon by 150 feet was $5.2 million, not considering R
environmental or permitting costs. Consequently, the focus of the proposed action was defined only as R
sand replenishment. While regional sand retention may possibly be considered in the future as one element
of a shoreline protection strategy, it is too speculative to carry forward for detailed analysis in this EIR/EA.
2.3.8 3 Million CY Alternative
The SEC’s original goals was to replenish regional beaches with the maximum quantity of sand possible.
As described in Section 2.2, sand transport modeling was performed on an alternative with 13 receiver
sites and 3 million cy of sand dredged from six borrow sites to predict locations and duration of sand
deposition for the purposes of having data for permit application submittal. Technical reports supporting
this document (Appendices C and D) contain the analysis. However, as the environmental and engineering
process evolved, it became apparent that the cost of dredging and possible mitigation (potential worst-case
as preliminary identified in January 2000) would be prohibitive. Given the total project budget of $14.3
million, this alternative would not be feasible and was therefore eliminated from further consideration
(SANDAG 2000).
2.3.9 Reduced Quantity Alternative
As described in Section 2.2, two scenarios were generated with less sand overall (2 million cy) in an
attempt to reduce impacts associated with the 3 million cy alternative. Under either scenario, potential
worst-case biological impacts would be very similar in scale (see Appendix D). At the December 1999
SEC meeting, Scenario 1 was selected as preferred. Since Scenario 2 reflected only a slight variation in
impact and would not enhance the range of alternatives, it was eliminated from further review in this
document.

2.0 Alternatives Considered
Page 2-12 Regional Beach Sand Project EIR/EA99-69\SANDAG EIREA 3.4.wpd 7/17/00
2.4 DETAILED DESCRIPTION OF ALTERNATIVES
Based on the thorough alternatives evaluation process completed to date, two alternatives were selected
for detailed evaluation in this EIR/EA. Both would result in placement of approximately 2 million cy of sand
along the San Diego region coastline. Alternative 1 is the 2 million cy alternative identified as preferred by
the SEC on December 9, 1999. It includes most of the receiver sites selected as having critical need per
the 1993 Shoreline Erosion Preservation Strategy for the San Diego Region. Alternative 2 was
derived subsequent to the December 1999 recommendation and would have fewer receiver sites. Table
2-1 illustrates the sand quantities at each receiver site under both alternatives and the borrow site which
would provide material for each receiver site (Figures 2-1 and 2-2).
Table 2-1Sand Quantities Proposed Under Each Alternative
Receiver Site Borrow SiteAlternative 1(cubic yards)
Alternative 2(cubic yards)
OceansideSO-9
380,000 570,000
North Carlsbad 240,000 —
South Carlsbad North
SO-7
160,000 218,000
South Carlsbad South — 142,000
Batiquitos 118,000 —
Leucadia 130,000 —
Moonlight Beach 88,000 —
Cardiff SO-6 104,000 104,000
Solana Beach
SO-5
140,000 140,000
Del Mar 180,000 180,000
Torrey Pines 240,000 360,000
Mission Beach MB-1 100,000 150,000
Imperial Beach SS-1 120,000 180,000
Total 2,000,000 2,044,000

Imperial Beach
Mission Beach
SouthOceanside
Batiquitos (118,000 cy)Leucadia (130,000 cy)Moonlight Beach (88,000 cy)Cardiff (104,000 cy)
Solana Beach
Del Mar
Torrey Pines
North Carlsbad
(380,000 cy)
(240,000 cy)
South Carlsbad North(160,000 cy)
(140,000 cy)
(180,000 cy)
(240,000 cy)
(100,000 cy)
(120,000 cy)
SO-9
SO-7
SO-6
SO-5
MB-1
SS-1
CALIF
PROJECT LOCATION
OFFSHORE BORROW SITE
ONSHORE RECEIVER SITE
SO: SOUTH OCEANSIDE LITTORAL CELL BORROW SITE
MB: MISSION BEACH LITTORAL CELL BORROW SITE
SS: SILVER STRAND LITTORAL CELL BORROW SITE
X.X Section Name
Source: DoN 1993
Regional Beach Sand Project EIR/EA9969 SANDAG Beach Replenishment\Figures\Fig 2-1 Sites 1/11/00
Page 2-13
NORTH
Figure 2-1Alternative 1
Borrow and Receiver Sites

Imperial Beach
Mission Beach
SouthOceanside
Cardiff
Solana Beach
Del Mar
Torrey Pines
(570,000 cy)
South Carlsbad North(218,000 cy)
(140,000 cy)
(180,000 cy)
(360,000 cy)
(150,000 cy)
(180,000 cy)
SO-9
SO-7
SO-6
SO-5
MB-1
SS-1
CALIF
PROJECT LOCATION
OFFSHORE BORROW SITE
ONSHORE RECEIVER SITE
SO: SOUTH OCEANSIDE LITTORAL CELL BORROW SITE
MB: MISSION BEACH LITTORAL CELL BORROW SITE
SS: SILVER STRAND LITTORAL CELL BORROW SITE
South Carlsbad South(142,000 cy)
(104,000 cy)
X.X Section Name
Source: DoN 1993
Regional Beach Sand Project EIR/EA9969 SANDAG Beach Replenishment\Figures\Fig 2-2 Sites 1/11/00
Page 2-14
NORTH
Figure 2-2Alternative 2
Borrow and Receiver Sites
2.0 Alternatives Considered
Regional Beach Sand Project EIR/EA Page 2-1599-69\SANDAG EIREA 3.4.wpd 7/17/00
Additionally, there are two possible construction variations – one involves the potential for construction
seven days a week, 24 hours a day (7/24) and the other involves some restrictions on construction times
and days consistent with local noise ordinances, where applicable. These two variations are addressed as
variations (a) and (b) for each alternative. The vast majority of dredge operations utilize a 7/24 timeframe
to increase efficiency and minimize cost. Given the fixed budget for this project, any increase in
construction cost would translate to a decrease in sand volume. Generally, adherence to applicable noise
ordinances would result in construction duration increasing 30 percent and the volume of sand reducing by
up to 50 percent. Finally, the No Action Alternative is evaluated.
The description of Alternative 1 is structured as follows. First the receiver sites and borrow sites are
described in detail. Sand volumes are indicated based on the 7/24 construction practice (Alternative 1a).
Then, Alternative 1b is described where adherence to the applicable noise ordinance would affect length
of construction and sand quantity at some receiver sites. Following the description of these two variations
is a detailed description of the construction method – how the dredging would be performed, how beach
building would occur, location of staging areas and booster pumps, length of beach closures, etc.
Alternative 2 is also described in terms of variation (a) or (b) given the construction scenarios.
Construction methods would not vary under Alternative 2, although staging areas and booster pump
locations are identified as appropriate.
2.4.1 Alternative 1
Alternative 1 is beach replenishment in the San Diego region with up to 2 million cy of sand to be deposited
at 12 receiver sites. The receiver sites are located from Oceanside to Imperial Beach. Sand would be
dredged from 6 possible offshore borrow sites.
Alternative 1a
Receiver Sites
The general process for sand dredging, delivery, and spreading is similar for all receiver sites. After sand
is dredged from a borrow site, it is pumped through dredge discharge lines to the shore. Existing sand is
used to build a dike between the ocean and receiver site and the dredge material is placed behind the dike
to help reduce turbidity. As the material deposits, it is spread along the shore to create a berm higher than
the existing sand area. The berm would slope gently back to the existing beach elevation to form a berm

2.0 Alternatives Considered
Page 2-16 Regional Beach Sand Project EIR/EA99-69\SANDAG EIREA 3.4.wpd 7/17/00
using bulldozers and training dikes are constructed around the berms help to reduce turbidity. The sand
is spread using bulldozers and up to 12 crew persons. The construction scenario is described in further
detail below, following the detailed description of receiver sites and borrow sites.
For each receiver site, berm construction may be adjusted during fill placement depending on actual field
conditions. The measurements indicated for the width of each berm are the initial post-placement widths.
The berms would be immediately subject to the forces of the waves and weather once constructed, and
would most likely reduce in size.
Under Alternative 1a, implementation of the proposed action would occur around the clock, on a
7-day/24-hour basis. The longer construction hours would result in more efficient construction and greater
production rates, and would allow for more sand to be placed on some of the receiver sites (refer to Table
2-2). These construction hours would necessitate a noise variance from several jurisdictions
(i.e., Oceanside, Solana Beach, Del Mar, San Diego, and Imperial Beach).
Beach replenishment at South Oceanside would involve onshore placement of sand from just south of
Forster Street to Kelly Street for a total length of approximately 4,100 feet (0.8 mile), as shown in Figure
2-3. Dredged sediment would be placed on the existing sand beach and graded to form a berm. The top
of the berm would be constructed to an elevation of approximately 13 feet above mean lower low water
(MLLW), and would be flat and 135 feet wide. (MLLW is the average of the lower low water height of
each tidal day observed over time. A positive number indicates elevation above MLLW and a negative
number is below MLLW.) The beach fill would then extend seaward approximately 250 feet at a slope
of 20:1 (horizontal distance:vertical distance).
Beach replenishment at North Carlsbad would involve onshore placement of sand from just south of the
Buena Vista Lagoon to south of Carlsbad Village Drive (Elm Avenue), a distance of approximately 3,000
feet (0.6 mile) (Figure 2-4). Dredged sediment would be placed on the existing sand beach and graded
to form a berm. The top of the berm would be constructed to an elevation of approximately 12 feet above
MLLW and would be flat, with a width of approximately 125 feet. The beach fill would then slope
seaward approximately 150 feet at a slope of 10:1. The site would also have a slope to the east of the
berm at a slope of approximately 5:1 extending 35 feet back to the mean high tide line. The sand
placement, as described in this EIR/EA, would not extend from the existing revetment to the water edge. R
However, as disclosed in Section 2.7, during the final design phase, the fill site would be redesigned to R
flatten the berm at mid-beach and extend the material to the existing revetment. The footprint analyzed in R
this document represents a worst-case evaluation for visual quality for purposes of disclosure. R

X.X
Section Nam
e
Page 2-17
Source: Moffatt & Nichol Engineers
Regional B
each Sand Project EIR
/EA
9969 Beach R
eplenishment\F
igures\Fig 2-3 South O
ceanside Fill 8/31/99
Figure 2-3South Oceanside Beach Fill Plan
Alternatives 1 and 2 N
ORTH
TOP OF BERM
SLOPE OF BERM
750 Feet0
Beach Fill Elevation = +13 MLLWBeach Width = 75’
9,900
TOE OF SLOPE
TOP OF SLOPE
Seagaze Drive Oceanside Blvd Kelly StVista Way
Beach Fill Elevation = +13 MLLWBeach Width = 135’
4,100’
TOE OF SLOPE
TOP OF SLOPE
Seagaze Drive Oceanside Blvd Kelly StVista Way
ALTERNATIVE 1
ALTERNATIVE 2

X.X
Section Nam
e
Page 2-18
Source: Moffatt & Nichol Engineers
Regional B
each Sand Project EIR
/EA
9969 Beach R
eplenishment\F
igures\Fig 2-4 N
Carlsbad F
ill 8/31/99
Figure 2-4North Carlsbad Beach Fill Plan--Alternative 1
(Site Not Proposed Under Alternative 2) N
ORTH
3,000
Ocean
St
Pin
e A
v
TOP OF BERM
SLOPE OF BERM
Ch
estn
ut A
v
Oak
Av
Gra
nd
Av
State St
Carlsbad Blvd
750 Feet0
TOP OF SLOPE
Beach Fill Elevation = + 12’ MLLWBeach Width = 155’

2.0 Alternatives Considered
Regional Beach Sand Project EIR/EA Page 2-1999-69\SANDAG EIREA 3.4.wpd 7/17/00
Table 2-2Alternative 1 – Schedule and Production
BorrowSite
ReceiverSite
Alternative 1a(Assumes 7-day/24-hour work schedule)
Alternative 1b(Adheres to Noise Ordinances)(3)
ApplicableNoise
Ordinance?Quantity
(cy)
ReplenishmentSite
Construction(1)
(estimateddays)
Duration ofPipeline
Activity(2)
(estimateddays)
Quantity(cy)
ReplenishmentSite
Construction(1)
(estimated days)
Duration ofPipeline
Activity(2)
(estimateddays)
SO-9S. Oceanside 380,000 30
50190,000 44
74Yes
N. Carlsbad 240,000 20 120,000 30 Yes
SO-7
S. Carlsbad N. 160,000 1515
160,000 1515
No
S. Carlsbad S. 0 0 0 0 No
Batiquitos 118,000 12
35
118,000 12
35
No
Leucadia 130,000 13 130,000 13 No
Moonlight 88,000 10 88,000 10 No
SO-6 Cardiff 104,000 11 11 104,000 11 11 No
SO-5
Solana Beach 140,000 13 13 70,000 18 18 Yes
Del Mar 180,000 1636
90,000 2452
Yes
Torrey Pines 240,000 20 120,000 28 Yes(4)
MB-1 Mission Beach 100,000 11 11 50,000 16 16 Yes
SS-1ImperialBeach
120,000 12 12 60,000 18 18 Yes
Total 2,000,000 183 183 1,300,000 239 239
Average Production Rate 15,000 cy/day 5,000 cy/day
Assumptions: Noise limits would allow only one shift of production per day (instead of three) with no construction on Sundays orholidays. Production would take three times longer. Production rates are average and similar for any type of dredge equipment.
(1) Includes 2 to 4 days for mobilization prior to sand placement and 2 to 4 days for demobilization post placement, depending on
borrow source.(2) Maximum number of working days pipeline would be on the beach where a single borrow site serves more than one receiver site.(3) Assumes a working schedule from 7:00 a.m. to 7:00 p.m. Monday through Friday, limited working hours on Saturday, and no
working hours on Sundays and holidays.(4) The Torrey Pines conveyance plan includes use of Del Mar’s beach for pipeline conveyance of sand and a booster pump would be
necessary. The use of the City of Del Mar’s beach for this purpose may necessitate conformance with the City of Del Mar noiseordinance even though the Torrey Pines receiver site is within State Park’s jurisdiction.
Beach replenishment at the South Carlsbad North site would consist of the placement of dredged sediment
near the Palomar Airport Road intersection with Carlsbad Boulevard, stretching to the south for 2,100 feet
(0.4 mile) near the Encinas Creek outlet (Figure 2-5). A berm would be constructed to an elevation of
approximately 12 feet above MLLW. The beach fill would be flat with a width of approximately 170 feet.
The beach fill would then slope seaward approximately 100 feet at a slope of 10:1.
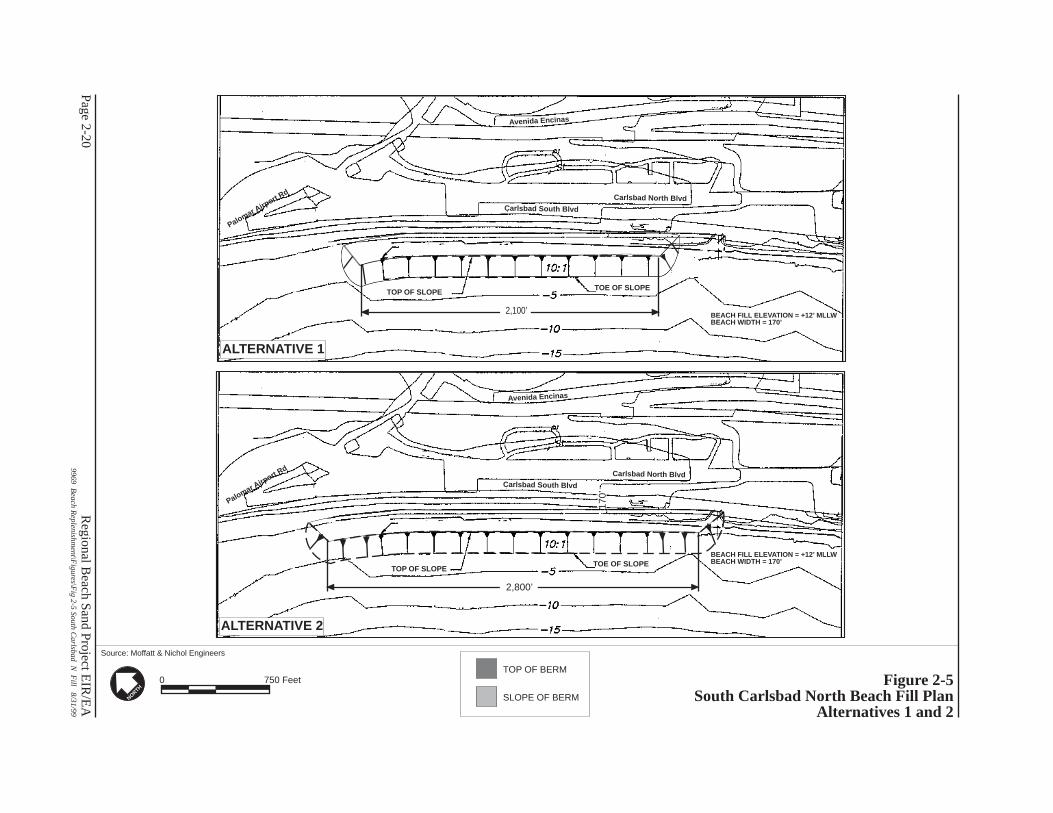
X.X
Section Nam
e
Page 2-20
Source: Moffatt & Nichol Engineers
Regional B
each Sand Project EIR
/EA
9969 Beach R
eplenishment\F
igures\Fig 2-5 South C
arlsbad N F
ill 8/31/99
Figure 2-5South Carlsbad North Beach Fill Plan
Alternatives 1 and 2 N
ORTH
TOP OF SLOPETOE OF SLOPE
2,800’
TOE OF SLOPE
170’
TOE OF SLOPE
170’
Palomar Airp
ort Rd
Carlsbad South Blvd
Carlsbad North Blvd
Avenida Encinas
TOP OF BERM
SLOPE OF BERM
TOP OF SLOPE TOE OF SLOPE
Palomar Airp
ort Rd
Carlsbad South Blvd
Carlsbad North Blvd
Avenida Encinas
TOE OF SLOPETOE OF SLOPE
2,800’
2,100’
BEACH FILL ELEVATION = +12’ MLLWBEACH WIDTH = 170’
BEACH FILL ELEVATION = +12’ MLLWBEACH WIDTH = 170’
ALTERNATIVE 1
ALTERNATIVE 2
750 Feet0

2.0 Alternatives Considered
Regional Beach Sand Project EIR/EA Page 2-2199-69\SANDAG EIREA 3.4.wpd 7/17/00
Beach replenishment at Batiquitos would involve the placement of dredged sediment from a point
approximately 850 feet south of the Batiquitos Lagoon, into the community of Leucadia and Leucadia State
Beach, a distance of approximately 1,390 feet (0.3 mile). The northern part of the site is known as
“Ponto.” A berm would be constructed to an elevation of approximately 12 feet above MLLW and would
have a width of approximately 110 feet (Figure 2-6). The beach fill would then slope seaward
approximately 375 feet at a slope of 20:1.
The Leucadia beach fill plan would include creation of a berm of approximately 12 feet above MLLW,
extending seaward approximately 70 feet (Figure 2-7). The top of the beach fill would be flat. The berm
would then slope seaward approximately 125 feet at a slope of 10:1. The proposed receiver site at the
Leucadia site extends approximately 2,700 feet (0.5 mile) from just south of the Grandview access stairs
to Glacus Street.
The Moonlight Beach receiver site’s berm would be constructed to a height of approximately 12 feet above
MLLW. The beach fill would be relatively flat and would extend seaward approximately 130 feet seaward
and would then slope seaward at a slope of 20:1. Toward the north, the slope would extend approximately
150 feet, while at the southern part of the berm, the slope would extend approximately 250 feet. The
proposed receiver site would be approximately 770 feet (0.1 mile) long (Figure 2-8).
Beach replenishment at the Cardiff site (Figure 2-9) would consist of the placement of dredged sediment
along 780 feet (0.1 mile) of Cardiff State Beach south of the San Elijo Lagoon inlet and Restaurant Row.
A berm would be constructed at this location to an elevation of approximately 12 feet above MLLW. The
berm would be flat and extend seaward approximately 115 feet. The beach fill would then slope seaward
approximately 350 feet at a slope of 20:1.
Beach replenishment at the Solana Beach site would consist of the placement of dredged sediment along
approximately 1,800 feet (0.3 mile) of the beach (Figure 2-10). The northern boundary of the proposed
fill site starts just south of Fletcher Cove and extends southward. A berm would be constructed at this
location to an elevation of approximately 12 feet above MLLW. The berm would be flat and extend
seaward approximately 100 feet. The beach fill would then slope seaward approximately 135 feet at a
slope of 10:1.
The berm at Del Mar’s receiver site would be built to a height of approximately 11 feet above MLLW and R
would extend seaward approximately 170 feet (Figure 2-11). The beach fill would then slope seaward R

TOE OF SLOPE
X.X
Section Nam
e
Page 2-22
Source: Moffatt & Nichol Engineers
Regional B
each Sand Project EIR
/EA
9969 Beach R
eplenishment\F
igures\Fig 2-6 B
atiquitos Fill 8/31/99
Figure 2-6Batiquitos Beach Fill Plan--Alternative 1(Site Not Proposed Under Alternative 2)
NORTH
TOP OF SLOPE
Carlsbad Blvd
Batiquitos Lagoon
TOP OF BERM
SLOPE OF BERM
Haymarket Rd
Wilton Rd
Parliament Rd
Aldersgate Rd
Tattenhorn Rd
Kennington Rd
Beach Fill Elevation = +12’ MLLWBeach Width = 110’
750 Feet0
1,390’

TOE OF SLOPE
X.X
Section Nam
e
Page 2-23
Source: Moffatt & Nichol Engineers
Regional B
each Sand Project EIR
/EA
9969 Beach R
eplenishment\F
igures\Fig 2-7 L
eucadia Fill 8/31/99
Figure 2-7Leucadia Beach Fill Plan--Alternative 1(Site Not Proposed Under Alternative 2)
NORTH
TOP OF SLOPE
Beach Fill Elevation = + 12’ MLLWBeach Width = 70’
Avo
cad
o S
t
Jup
iter
St
Neptune Ave
Gla
ucus
St
Sea
Blu
ffe
Gra
nd
view
St Ja
sper
St
TOP OF BERM
SLOPE OF BERM
Diana
St
750 Feet0
2,700’

X.X
Section Nam
e
Page 2-24
Source: Moffatt & Nichol Engineers
Regional B
each Sand Project EIR
/EA
9969 Beach R
eplenishment\F
igures\Fig 2-8 M
oonlight Beach F
ill 8/31/99
Figure 2-8Moonlight Beach Fill Plan--Alternative 1(Site Not Proposed Under Alternative 2)
NORTH
TOE OF SLOPE
Beach Fill Elevation = +12’ MLLWBeach Width = 130’
MoonlightBeach
D S
t
A S
t
TOP OF BERM
SLOPE OF BERM
E S
t
B S
t
4th St
4th St
4th St
750 Feet0
TOP OF SLOPE
770’

X.X
Section Nam
e
Page 2-25
Source: Moffatt & Nichol Engineers
Regional B
each Sand Project EIR
/EA
9969 Beach R
eplenishment\F
igures\Fig 2-9 C
ardiff Beach F
ill 8/31/99
Figure 2-9Cardiff Beach Fill Plan
Alternatives 1 and 2 N
ORTH
TOE OF SLOPE
San Elijo Lagoon
S Coast Highway 101
Seaside ReefParking Lot
Restaurant Row
TOP OF BERM
SLOPE OF BERM
750 Feet0
Beach Fill Elevation = +12’ MLLW
Beach Width = 115’
780’
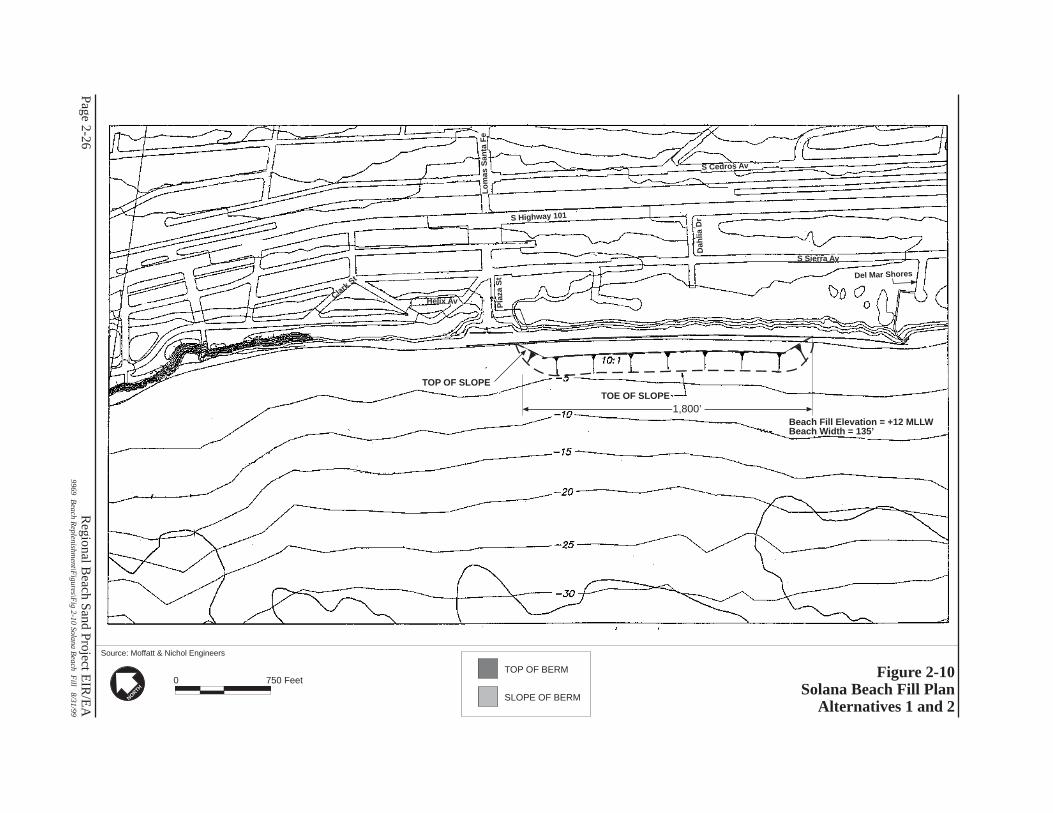
X.X
Section Nam
e
Page 2-26
Source: Moffatt & Nichol Engineers
Regional B
each Sand Project EIR
/EA
9969 Beach R
eplenishment\F
igures\Fig 2-10 Solana B
each Fill 8/31/99
Figure 2-10Solana Beach Fill Plan
Alternatives 1 and 2 N
ORTH
TOE OF SLOPE
Helix Av
S Sierra Av
Pla
za S
t
Lo
mas
San
ta F
e
TOP OF BERM
SLOPE OF BERM
750 Feet0
S Highway 101
Clark S
t Del Mar Shores
Dah
lia D
r
S Cedros Av
1,800’
TOP OF SLOPE
Beach Fill Elevation = +12 MLLWBeach Width = 135’

X.X
Section Nam
e
Page 2-27
Source: Moffatt & Nichol Engineers
Regional B
each Sand Project EIR
/EA
9969 Beach R
eplenishment\F
igures\Fig 2-11 D
el Mar B
each Fill 8/31/99
Figure 2-11Del Mar Beach Fill Plan
Alternatives 1 and 2 N
ORTH
TOE OF SLOPE
29th
St
Coast Blvd
Camino Del Mar
17th
St
15th
St
TOP OF BERM
SLOPE OF BERM
27th
St
26th
St
25th
St
24th
St
23rd
St
22n
d S
t
Stratford Ct
TOE OF SLOPE
17th
St
TOE OF SLOPE
17th
St
TOE OF SLOPE
17th
St
750 Feet0
TOP OF SLOPE
Beach Fill Elevation = +11 MLLWBeach Width = 170’
3,110
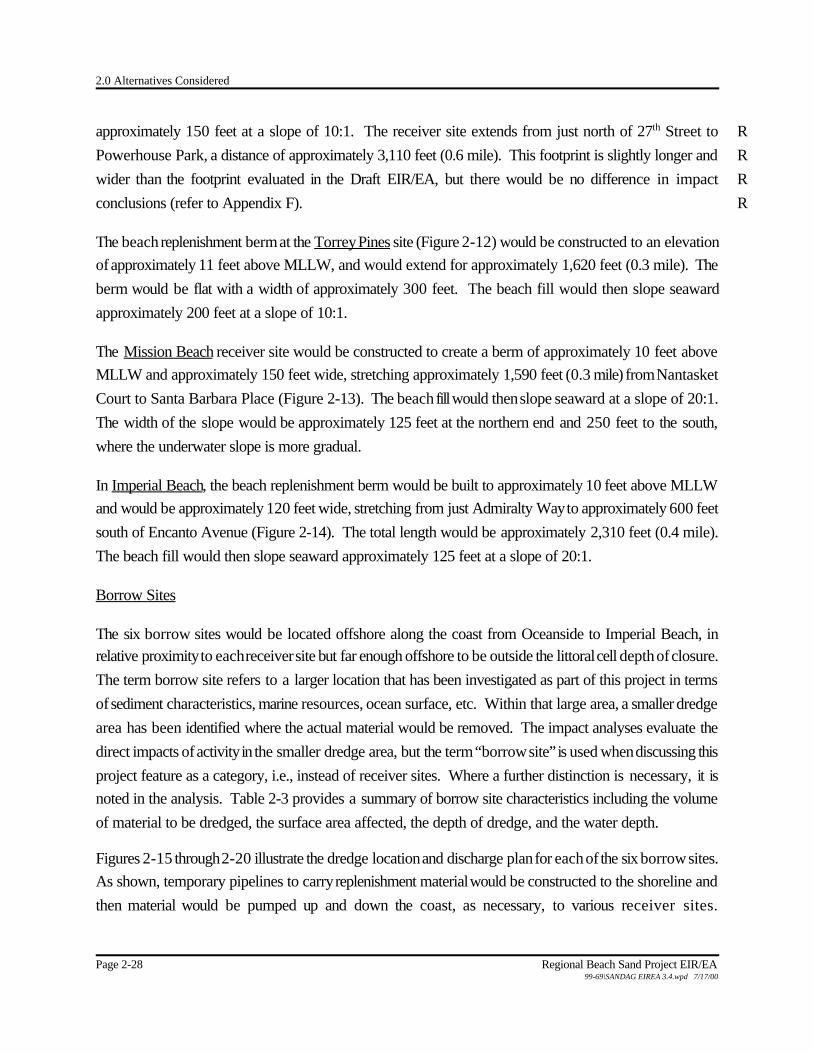
2.0 Alternatives Considered
Page 2-28 Regional Beach Sand Project EIR/EA99-69\SANDAG EIREA 3.4.wpd 7/17/00
approximately 150 feet at a slope of 10:1. The receiver site extends from just north of 27th Street to R
Powerhouse Park, a distance of approximately 3,110 feet (0.6 mile). This footprint is slightly longer and R
wider than the footprint evaluated in the Draft EIR/EA, but there would be no difference in impact R
conclusions (refer to Appendix F). R
The beach replenishment berm at the Torrey Pines site (Figure 2-12) would be constructed to an elevation
of approximately 11 feet above MLLW, and would extend for approximately 1,620 feet (0.3 mile). The
berm would be flat with a width of approximately 300 feet. The beach fill would then slope seaward
approximately 200 feet at a slope of 10:1.
The Mission Beach receiver site would be constructed to create a berm of approximately 10 feet above
MLLW and approximately 150 feet wide, stretching approximately 1,590 feet (0.3 mile) from Nantasket
Court to Santa Barbara Place (Figure 2-13). The beach fill would then slope seaward at a slope of 20:1.
The width of the slope would be approximately 125 feet at the northern end and 250 feet to the south,
where the underwater slope is more gradual.
In Imperial Beach, the beach replenishment berm would be built to approximately 10 feet above MLLW
and would be approximately 120 feet wide, stretching from just Admiralty Way to approximately 600 feet
south of Encanto Avenue (Figure 2-14). The total length would be approximately 2,310 feet (0.4 mile).
The beach fill would then slope seaward approximately 125 feet at a slope of 20:1.
Borrow Sites
The six borrow sites would be located offshore along the coast from Oceanside to Imperial Beach, inrelative proximity to each receiver site but far enough offshore to be outside the littoral cell depth of closure.
The term borrow site refers to a larger location that has been investigated as part of this project in terms
of sediment characteristics, marine resources, ocean surface, etc. Within that large area, a smaller dredge
area has been identified where the actual material would be removed. The impact analyses evaluate the
direct impacts of activity in the smaller dredge area, but the term “borrow site” is used when discussing this
project feature as a category, i.e., instead of receiver sites. Where a further distinction is necessary, it is
noted in the analysis. Table 2-3 provides a summary of borrow site characteristics including the volume
of material to be dredged, the surface area affected, the depth of dredge, and the water depth.
Figures 2-15 through 2-20 illustrate the dredge location and discharge plan for each of the six borrow sites.
As shown, temporary pipelines to carry replenishment material would be constructed to the shoreline and
then material would be pumped up and down the coast, as necessary, to various receiver sites.
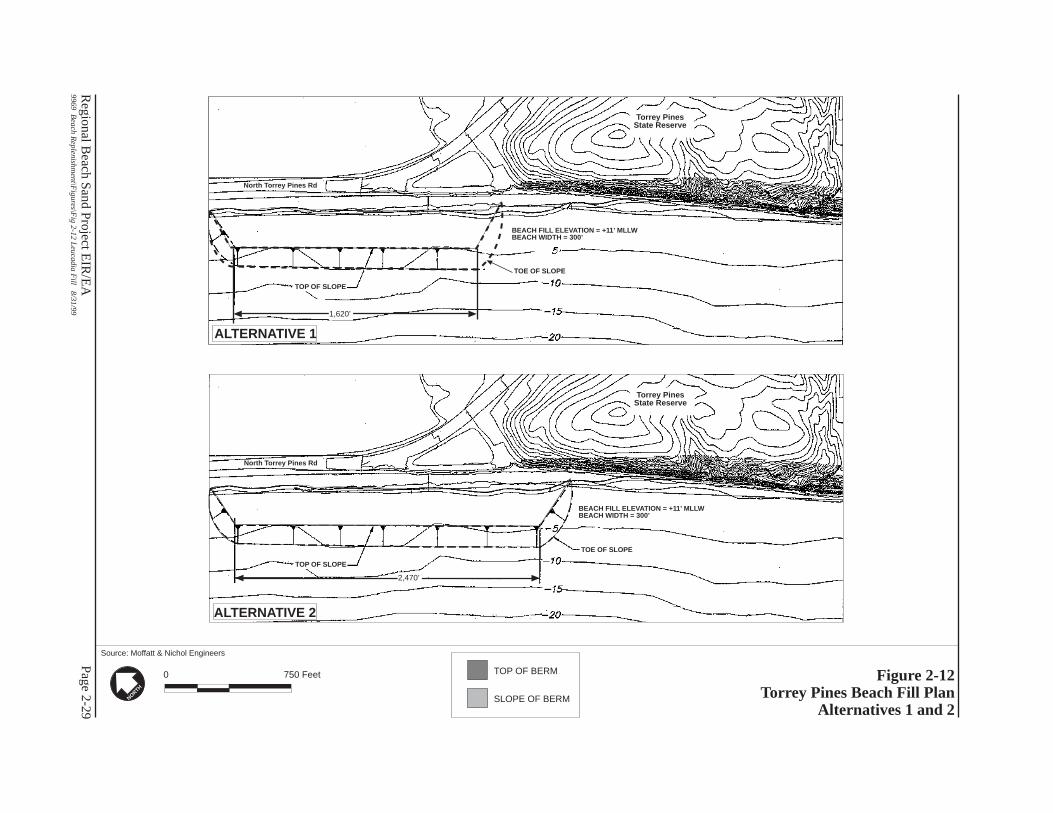
X.X
Section Nam
e
Page 2-29
Source: Moffatt & Nichol Engineers
Regional B
each Sand Project EIR
/EA
9969 Beach R
eplenishment\F
igures\Fig 2-12 L
eucadia Fill 8/31/99
Figure 2-12Torrey Pines Beach Fill Plan
Alternatives 1 and 2 N
ORTH
TOP OF BERM
SLOPE OF BERM
TOE OF SLOPE
Torrey PinesState Reserve
TOP OF SLOPE
North Torrey Pines Rd
TOE OF SLOPE
Torrey PinesState Reserve
TOP OF SLOPE
North Torrey Pines Rd
1,620’
2,470’
BEACH FILL ELEVATION = +11’ MLLWBEACH WIDTH = 300’
BEACH FILL ELEVATION = +11’ MLLWBEACH WIDTH = 300’
ALTERNATIVE 1
ALTERNATIVE 2
750 Feet0

X.X
Section Nam
e
Page 2-30
Source: Moffatt & Nichol Engineers
Regional B
each Sand Project EIR
/EA
9969 Beach R
eplenishment\F
igures\Fig 2-13 M
ission Beach F
ill 8/31/99
Figure 2-13Mission Beach Fill Plan
Alternatives 1 and 2 N
ORTH
TOP OF BERM
SLOPE OF BERM
TOE OF SLOPE
San Juan Place Santa Barbara Place
Mission Blvd
El Carmel Place
TOP OF SLOPE
Nantasket Court
ALTERNATIVE 1
Santa Clara PlaceOstend Court
1,590’
TOE OF SLOPE
San Juan PlaceSanta Barbara Place
Mission Blvd
Santa Clara Place
El Carmel Place
TOP OF SLOPE
Nantasket Court
ALTERNATIVE 2
2,380’
Ostend Court
ALTERNATIVE 1
ALTERNATIVE 2
750 Feet0
BEACH FILL ELEVATION = +10’ MLLWBEACH WIDTH = 150’
BEACH FILL ELEVATION = +10’ MLLWBEACH WIDTH = 150’
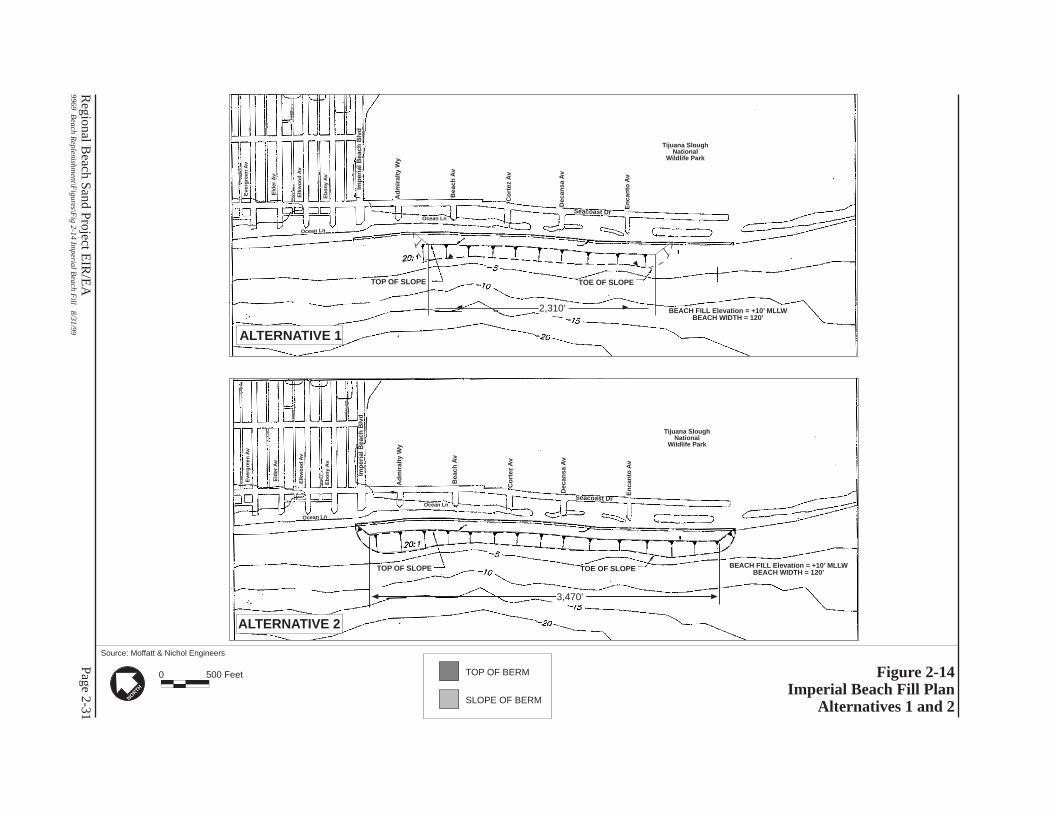
X.X
Section Nam
e
Page 2-31
Source: Moffatt & Nichol Engineers
Regional B
each Sand Project EIR
/EA
9969 Beach R
eplenishment\F
igures\Fig 2-14 Im
perial Beach F
ill 8/31/99
Figure 2-14Imperial Beach Fill Plan
Alternatives 1 and 2 N
ORTH
TOP OF BERM
SLOPE OF BERM
TOE OF SLOPE
Tijuana SloughNational
Wildlife Park
En
can
to A
v
Seacoast Dr
Imp
eria
l Bea
ch B
lvd
Eb
on
y A
v
Elk
wo
od
Av
Eld
er A
v
Eve
rgre
en A
v
Ocean Ln
Ad
mir
alty
Wy
Bea
ch A
v
Co
rtez
Av
Dec
ansa
Av
Ocean Ln
BEACH FILL Elevation = +10’ MLLWBEACH WIDTH = 120’
TOP OF SLOPE
2,310’
TOE OF SLOPE
Tijuana SloughNational
Wildlife Park
En
can
to A
v
Seacoast Dr
Imp
eria
l Bea
ch B
lvd
Eb
on
y A
v
Elk
wo
od
Av
Eld
er A
v
Eve
rgre
en A
v
Ocean Ln
Ad
mir
alty
Wy
Bea
ch A
v
Co
rtez
Av
Dec
ansa
Av
Ocean Ln
TOP OF SLOPE
ALTERNATIVE 2
3,470’
BEACH FILL Elevation = +10’ MLLWBEACH WIDTH = 120’
ALTERNATIVE 1
ALTERNATIVE 2
500 Feet0

#
#
#
#
#
#
#
#
#
#
#
#
Dredg e A rea
Regional Beach Sand Project EIR/EA
Sou rce : M of fat t & Nich ol En gine ers
Figure 2-15SO-9 Dredging
and Discharge Plan
9969.1 SANDAG\GIS\ Fig 2-15 SO9.apr 3/14/00
500 0 0 500 0 Fe et
-30
-40
-50-60
-70-80-90
-100
<
<
Sou th Oce an sideRe ceiver S ite
(M aximu m Len gth )
No rth CarlsbadReceiver S ite
(A ltern ative 1 Only)
App rox i m ate O cean s ide Ou tfa ll Lo cat ion to a
D e pth o f -1 05 '
<
Ocea ns id e H ar bor
Dredge
C D FG AR T IF IC IAL R E EFS# C D FG AR T IF IC IAL R E EFS#
SO-9
Page 2-32
Dischar
ge Lin
e
Bucca nee r B ea ch
-20
Bo rro wSite
4A3A
2A1A
4B
3B
2B
1B
4C
3C2C
1C
Rock ScatterPreviously Unmapped
(Note: Dredge areareduced in FEIR/EA
by approximately25 percent)

#
#
##
##
##
#
#
#
#
2
159
10
11
12 84
73
6
Enc i na W astew a te r Au th or ityApp rox i m ate S ew er L ine L oca tio n
to a D e pth of -1 80 '
9969.1 SANDAG\GIS\ Fig 2-16 so7.apr 3/14/00
Figure 2-16SO-7 Dredging
and Discharge Plan
Sou rce: M offat t & N ich ol En gin eer s
Regional Beach Sand Project EIR/EA
360 0 0 360 0 Fe et
-1 0
- 20-30
-40-50
-60-70
-80-90-100
Dredg e A rea
<<
Leu cadiaReceiver S ite
(A ltern ative 1 Only)
Ba tiq uitosReceiver S ite
(A ltern ative 1 Only)
So uth Carlsba d N orthReceiver S ite
So uth Carlsba d Sou thR eceiver S ite
(A ltern ative 2 Only)
D red ge D isch arg e Lin e<
<
C D FG AR T IF IC IAL R E EFS#
M oon ligh t Bea chReceiver S ite
(A ltern ative 1 Only)
D re dg eD ischar ge L ine
SO-7
Page 2-33
Bo rro w S ite
Po ssible D redg eExpan sio n A rea

9969.1 SANDAG\GIS\ Fig 2-17 so6.apr 3/14/00
Figure 2-17SO-6 Dredging
and Discharge Plan
Sou rce: M offat t & N ich ol En gin eer s
Regional Beach Sand Project EIR/EA
150 0 0 150 0 Fe et
Ca rdiff Receiver S ite
<
Dredg e A rea
Sa n Eli joSe w er O utfallLoca t ion to a D epth o f - 148 '
<
Page 2-34
S0-6
Bo rro w S ite
Discharge LineDredge
C ard if f by th e
Se a
San Elij oLag oo n
9969.1 SANDAG\GIS\ Fig 2-18 s05.apr 3/14/00
Figure 2-18SO-5 Dredging
and Discharge Plan
Sou rce: M offat t & N ich ol En gin eer s
Regional Beach Sand Project EIR/EA
415 0 0 415 0 Fe et
-10-20
-3 0-40
-50-60
-7 0-80
-90-100
To rre y Pine sReceiver S ite
So la na Be ach Receiver S ite
Dredg e A rea
S0-5
C ity of D el M a r
<
<
C ity of So lan a Be ach
D re dg eD ischar ge L ine
D re dg eD ischar ge L ine
D e l M ar R eceive r Si te
Page 2-35
Bo rro w S ite
<
Torr ey Pin esState R ese rve

#
#
#
#
#
#
#
N OS C To w er
9969.1 SANDAG\GIS\Fig 2-19 mb1.apr 3/14/00
Figure 2-19M B-1 Dredging
and Discharge Plan
Sou rce : M of fat t & Nich ol En gine ers
M iss ionBa y
#
Pr opo sed Yuko n Site
<
250 0 0 250 0 Fe et
#C D FG M iss io n Ba yA rt if ic ial R e ef
(M B AR )
Pro pose d S an D ie goU nde rw ate r
R ecre at ion A re a
Regional Beach Sand Project EIR/EA
D redg e
D ischarge L ine
-10-20
-30
-40
-50
-60
-7 0-80
-90
M iss io n Ba yBrid ge W recka ge 1
M iss io n Ba yBrid ge W recka ge 2
R uby E
M iss ion B ayC em e nt
Sho oter s 'Fa ntasy
El R ey
C D FG C oncr ete R ee f
Bo rro w S ite
Mission BeachRece iver Site
Dredg e A rea
MB-1
Page 2-36

<
#0
#0
400 0 0 400 0 Fe et
Regional Beach Sand Project EIR/EA
Sou rce: M offat t & N ich ol En gin eer sFigure 2-20
SS-1 Dredgingand Discharge Plan
9969.1 SANDAG\GIS\ Fig 2-20 ss1.apr 3/14/00
Dredg e A rea
SS-1App rox i m ate Lo cat ion of th e
C ity of Sa n D ieg o Ou tfa ll
<
Ti jua na R ive r Es tu ary
Imp erial Beach R eceiver S ite
-10-20-30-40
-5 0- 60
-70-90C ity Of Sa n D ieg o
Ocea n M on itori ng S ites
C ity o f Im p eri al B each
Page 2-37
Bo rro w S ite
-80
Dred
ge
Disc
harg
eLi
ne
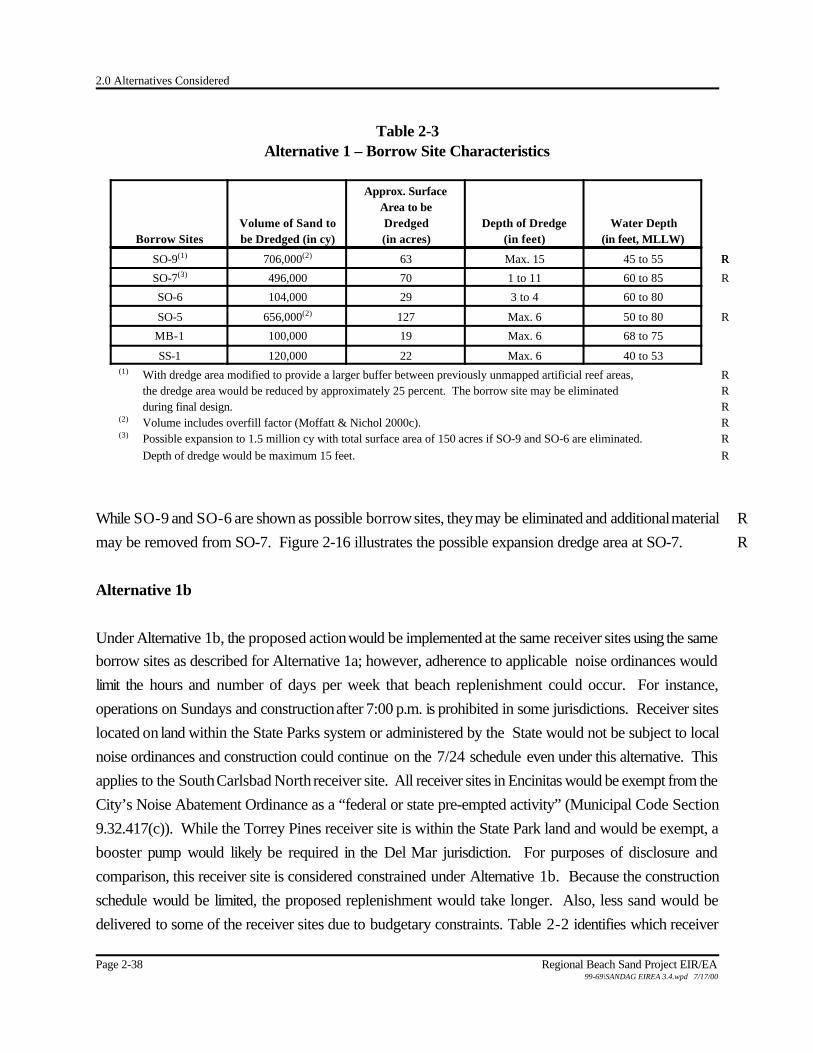
2.0 Alternatives Considered
Page 2-38 Regional Beach Sand Project EIR/EA99-69\SANDAG EIREA 3.4.wpd 7/17/00
Table 2-3Alternative 1 – Borrow Site Characteristics
Borrow SitesVolume of Sand tobe Dredged (in cy)
Approx. SurfaceArea to beDredged(in acres)
Depth of Dredge(in feet)
Water Depth(in feet, MLLW)
SO-9(1) R706,000(2) R63 Max. 15 45 to 55
SO-7(3) R496,000 70 1 to 11 60 to 85
SO-6 104,000 29 3 to 4 60 to 80
SO-5 656,000(2) R127 Max. 6 50 to 80
MB-1 100,000 19 Max. 6 68 to 75
SS-1 120,000 22 Max. 6 40 to 53(1) With dredge area modified to provide a larger buffer between previously unmapped artificial reef areas, R
the dredge area would be reduced by approximately 25 percent. The borrow site may be eliminated Rduring final design. R
(2) Volume includes overfill factor (Moffatt & Nichol 2000c). R(3) Possible expansion to 1.5 million cy with total surface area of 150 acres if SO-9 and SO-6 are eliminated. R
Depth of dredge would be maximum 15 feet. R
While SO-9 and SO-6 are shown as possible borrow sites, they may be eliminated and additional material R
may be removed from SO-7. Figure 2-16 illustrates the possible expansion dredge area at SO-7. R
Alternative 1b
Under Alternative 1b, the proposed action would be implemented at the same receiver sites using the same
borrow sites as described for Alternative 1a; however, adherence to applicable noise ordinances would
limit the hours and number of days per week that beach replenishment could occur. For instance,
operations on Sundays and construction after 7:00 p.m. is prohibited in some jurisdictions. Receiver sites
located on land within the State Parks system or administered by the State would not be subject to local
noise ordinances and construction could continue on the 7/24 schedule even under this alternative. This
applies to the South Carlsbad North receiver site. All receiver sites in Encinitas would be exempt from the
City’s Noise Abatement Ordinance as a “federal or state pre-empted activity” (Municipal Code Section
9.32.417(c)). While the Torrey Pines receiver site is within the State Park land and would be exempt, a
booster pump would likely be required in the Del Mar jurisdiction. For purposes of disclosure and
comparison, this receiver site is considered constrained under Alternative 1b. Because the construction
schedule would be limited, the proposed replenishment would take longer. Also, less sand would be
delivered to some of the receiver sites due to budgetary constraints. Table 2-2 identifies which receiver

2.0 Alternatives Considered
Regional Beach Sand Project EIR/EA Page 2-3999-69\SANDAG EIREA 3.4.wpd 7/17/00
sites would be subject to local noise ordinances and provides a comparison of the schedule and production
capability under either construction variation. As shown, the overall quantity of sand would be 1.3 million
cy under Alternative 1b versus 2 million cubic yards under Alternative 1a.
Construction Methods/Design Features to Avoid Impacts R
The information is provided to provide a clear understanding of how sand would be dredged, delivered to
the receiver site, and then manipulated to be suitable for public use. It also identifies the design R
features/specific methods to be incorporated into final design or the contractor’s specifications to avoid R
potential impacts. R
Construction would consist of:
1. Dredging the offshore borrow sites with either a cutterhead suction dredge or hopper dredge;
2. Pumping sand through floating/submerged discharge lines to the beach and through discharge lines
placed along the higher portions of the beach to the receiver sites (use of booster pumps as
necessary);
3. Discharging the sand at the appropriate receiving beach within training dikes; and
4. Redistributing the sand as needed with earthmoving equipment, such as scrapers, and grading the
beach fills to required dimensions with bulldozers.
Dredging Operations
Beach replenishment operations would include the use of dredge vessels which would dredge sediment
from the offshore borrow sites and transfer the sediment to the proposed receiver sites. The contractors
may use one of two types of dredge vessels, a hopper dredge or a cutterhead suction dredge and both are
described below. Regardless of the dredge type, the Coast Guard would post a Notice to mariners with
the coordinates of dredging activity so that ocean users can avoid the activity.

2.0 Alternatives Considered
Page 2-40 Regional Beach Sand Project EIR/EA99-69\SANDAG EIREA 3.4.wpd 7/17/00
Hopper Dredge
The hopper dredge is a self-contained vessel that loads sediment from an offshore borrow site then moves
to a receiver site for sand placement. The hopper dredge contains two large arms that have the ability to
drag along the ocean floor and collect sediment. The drag heads are about 10 feet square. The hopper R
dredge moves along the ocean surface with its arms extended, making passes back and forth until its hull
is fully loaded with sediment. The vessel can hold approximately 2,000 to 5,000 cy of sediment per load.
The hopper dredge can generally reach within approximately 0.5 mile of shore to offload, unless booster
pumps are placed along the beach that can increase its pumping distance. At this position, the hopper
dredge connects to a floating or submerged pump line from shore. The vessel then discharges a mixture
of sediment and sea water onto the receiver site. Submerged lines are encased by several large tractor tires
to prevent abrasion of the ocean floor or reefs.
The hopper dredge can also connect to a floating platform called a mono buoy, which is used to
interconnect the floating pump line with a steel sinker pipeline that would run the rest of the distance to the
beach. The mono buoy is generally anchored to the seabed at an appropriate depth and location to serve
the project needs, depending on locations of sensitive resources and engineering considerations. For this R
project the mano bouy would be anchored in at least 25 feet of water. The contractor would also be R
conditioned to avoid sensitive resources such as kelp, reefs, and structures such as outfalls. An anchor plan R
would be prepared for each mono buoy for submittal to the resource agencies prior to construction R
illustrating any or all sensitive resources and the relationship between anchors on the ocean floor. R
Cutterhead Suction Dredge
A cutterhead suction dredge is similar to a hopper dredge in that it uses a long arm that extends down to
the sea floor to dredge sediment. A rotating head about eight feet in diameter sweeps an area about 300 R
feet wide. However, a cutterhead dredge breaks up sediment material along the seafloor, then uses a R
vacuum mechanism to suck up sediment into an intake line and pump it directly to shore through a discharge
line. The cutterhead dredge anchors above a borrow site while its arm swings back and forth to dredge
up sediment, and pumps a mixture of sediment and sea water through a floating discharge line directly onto
the receiver site. The discharge line would either be assembled afloat and connected to the cutterhead
suction dredge to land by tugboats, or assembled on land and dragged offshore to the dredge by tugboat.
Unlike the hopper dredge, the cutterhead dredge remains at the dredge site for the entire operation while
pipelines carry the material.

2.0 Alternatives Considered
Regional Beach Sand Project EIR/EA Page 2-4199-69\SANDAG EIREA 3.4.wpd 7/17/00
For both dredge vessels, the floating portion of the dredge discharge line would be marked and lighted for
navigation safety and a Notice to Mariners would be issued through the U.S. Coast Guard. The discharge
line would be trucked or floated in segments to the appropriate placement locations and assembled using
cranes and other equipment. The line may be a combination of plastic (HDPE) and steel materials
depending on need and availability, and would be approximately 30 inches in diameter.
Booster pumps would be used approximately every 10,000 feet on longer reaches. One offshore booster
pump may be necessary for the offshore length from SO-9 to the Oceanside receiver site; however, it is
possible that the dredge itself could move the material the entire distance to shore. Booster pumps would
be necessary where onshore pipelines would convey material to the receivers site(s) and the total onshore
distance would be approximately 10,000 feet. An onshore booster pump would be necessary along the
length from the Oceanside to North Carlsbad receiver sites. Onshore booster pumps would also be
necessary to convey material to South Carlsbad North, Moonlight Beach, and Torrey Pines. The exact
locations of pumps are not known at this time.
For all pipeline delivery routes, the floating and submerged portions of the dredge discharge line would be
routed to avoid sensitive resources to the maximum extent feasible. For instance, the discharge line would
extend westward beyond kelp beds to prevent dredge vessels from traversing kelp beds. The contractor R
would also be conditioned to avoid traversing the CDFG artificial reefs near SO-9 (Figure 2-15), SO-7 R
(Figure 2-16) and MB-1 (Figure 2-19). That means no hopper dredge (empty or full) or discharge lines R
may traverse these three artificial reef locations. As shown in Figure 2-16, the possible northern dredge R
discharge pipeline path at SO-7 would be floating above CDFG artificial reefs 9 and 1. This floating pipe R
would not affect the submerged reefs, but it has been sited to make landfall in the nearshore location without R
reefs or surfgrass. The contractor would also be conditioned to avoid any discharge pipe placement within R
the Tijuana Slough National Wildlife Refuge, that means any discharge pipe would make landfall north of R
the terminus of Seacoast Boulevard in Imperial Beach. R
Discharge Line Management and Maintenance
Assuming use of a cutterhead suction dredge, the discharge line would require management and
maintenance activities during the construction period. After replenishment was complete, all pipelines
would be removed. The line would be placed along the back of the beach (i.e., eastward) to minimize its
exposure to wave forces. At locations with no existing shore protection or bluffs, the discharge line would
lie along the highest landward portion of the existing beach or cobble berm. These locations include North
Oceanside, Buccaneer Beach, Buena Vista Lagoon, South Carlsbad, Batiquitos, Leucadia, Moonlight
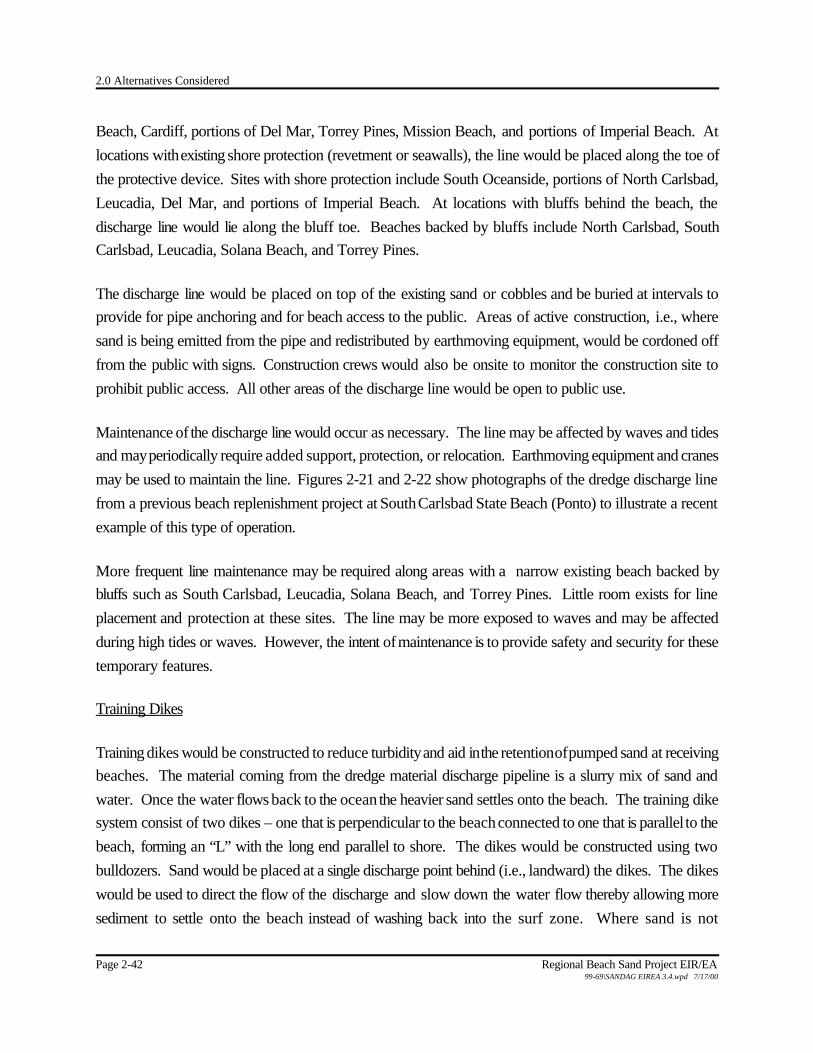
2.0 Alternatives Considered
Page 2-42 Regional Beach Sand Project EIR/EA99-69\SANDAG EIREA 3.4.wpd 7/17/00
Beach, Cardiff, portions of Del Mar, Torrey Pines, Mission Beach, and portions of Imperial Beach. At
locations with existing shore protection (revetment or seawalls), the line would be placed along the toe of
the protective device. Sites with shore protection include South Oceanside, portions of North Carlsbad,
Leucadia, Del Mar, and portions of Imperial Beach. At locations with bluffs behind the beach, the
discharge line would lie along the bluff toe. Beaches backed by bluffs include North Carlsbad, South
Carlsbad, Leucadia, Solana Beach, and Torrey Pines.
The discharge line would be placed on top of the existing sand or cobbles and be buried at intervals to
provide for pipe anchoring and for beach access to the public. Areas of active construction, i.e., where
sand is being emitted from the pipe and redistributed by earthmoving equipment, would be cordoned off
from the public with signs. Construction crews would also be onsite to monitor the construction site to
prohibit public access. All other areas of the discharge line would be open to public use.
Maintenance of the discharge line would occur as necessary. The line may be affected by waves and tides
and may periodically require added support, protection, or relocation. Earthmoving equipment and cranes
may be used to maintain the line. Figures 2-21 and 2-22 show photographs of the dredge discharge line
from a previous beach replenishment project at South Carlsbad State Beach (Ponto) to illustrate a recent
example of this type of operation.
More frequent line maintenance may be required along areas with a narrow existing beach backed by
bluffs such as South Carlsbad, Leucadia, Solana Beach, and Torrey Pines. Little room exists for line
placement and protection at these sites. The line may be more exposed to waves and may be affected
during high tides or waves. However, the intent of maintenance is to provide safety and security for these
temporary features.
Training Dikes
Training dikes would be constructed to reduce turbidity and aid in the retention of pumped sand at receiving
beaches. The material coming from the dredge material discharge pipeline is a slurry mix of sand and
water. Once the water flows back to the ocean the heavier sand settles onto the beach. The training dike
system consist of two dikes – one that is perpendicular to the beach connected to one that is parallel to the
beach, forming an “L” with the long end parallel to shore. The dikes would be constructed using two
bulldozers. Sand would be placed at a single discharge point behind (i.e., landward) the dikes. The dikes
would be used to direct the flow of the discharge and slow down the water flow thereby allowing more
sediment to settle onto the beach instead of washing back into the surf zone. Where sand is not

Source: Modified Nardin, et al, 1981
Regional Beach Sand Project EIR/EA9969 Beach Replenishment\Figures\Fig 12-21Building Operations 8/23/99
Page 2-43
Figure 2-21Beach Building Operations
X.X Section Name
Dredge Discharge Lines
Photo A- Dredge discharge line placement on the beach berm at the South Carlsbad Northreceiver site in December of 1995.
Photo B- The end of the discharge line is shown in the foreground. Sand is dischargedinto a diked-off area to minimize turbidity and control sand deposition.
Sand Training Dike
Containment Area
Dredge Discharge Line
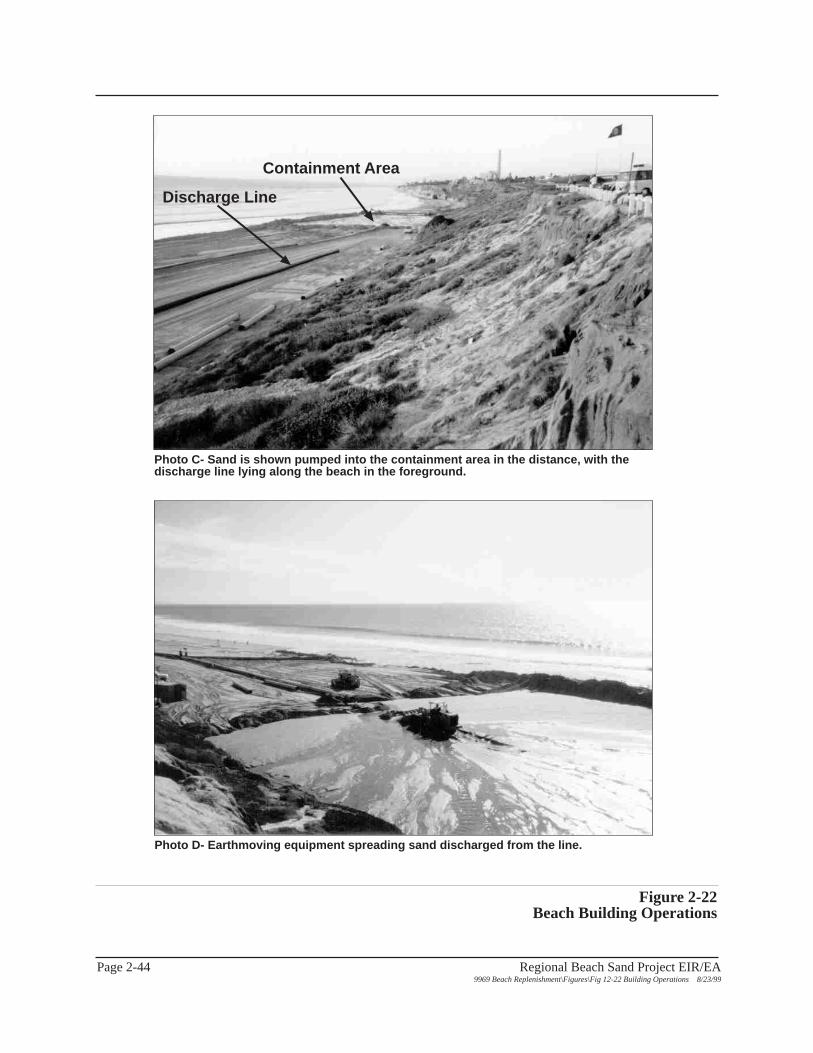
Source: Modified Nardin, et al, 1981
Regional Beach Sand Project EIR/EA9969 Beach Replenishment\Figures\Fig 12-22 Building Operations 8/23/99
Page 2-44
Figure 2-22Beach Building Operations
X.X Section Name
Dredge Discharge Lines
Photo D- Earthmoving equipment spreading sand discharged from the line.
Photo C- Sand is shown pumped into the containment area in the distance, with thedischarge line lying along the beach in the foreground.
Containment Area
Discharge Line
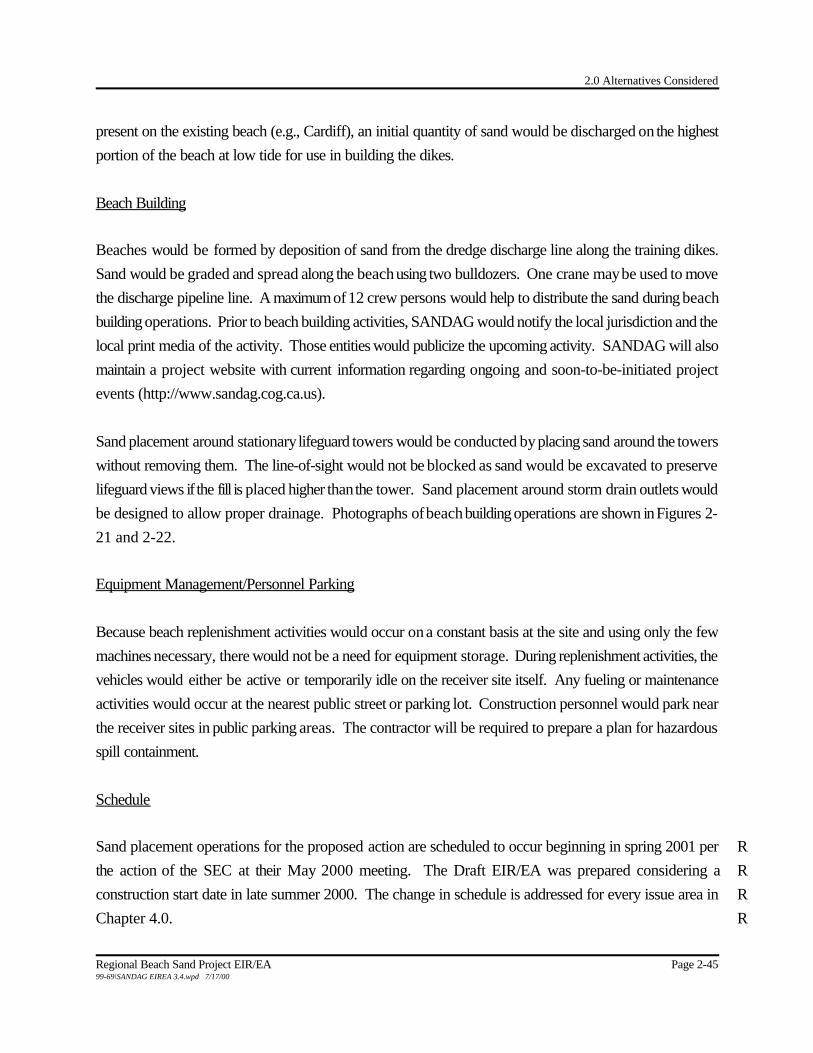
2.0 Alternatives Considered
Regional Beach Sand Project EIR/EA Page 2-4599-69\SANDAG EIREA 3.4.wpd 7/17/00
present on the existing beach (e.g., Cardiff), an initial quantity of sand would be discharged on the highest
portion of the beach at low tide for use in building the dikes.
Beach Building
Beaches would be formed by deposition of sand from the dredge discharge line along the training dikes.
Sand would be graded and spread along the beach using two bulldozers. One crane may be used to move
the discharge pipeline line. A maximum of 12 crew persons would help to distribute the sand during beach
building operations. Prior to beach building activities, SANDAG would notify the local jurisdiction and the
local print media of the activity. Those entities would publicize the upcoming activity. SANDAG will also
maintain a project website with current information regarding ongoing and soon-to-be-initiated project
events (http://www.sandag.cog.ca.us).
Sand placement around stationary lifeguard towers would be conducted by placing sand around the towers
without removing them. The line-of-sight would not be blocked as sand would be excavated to preserve
lifeguard views if the fill is placed higher than the tower. Sand placement around storm drain outlets would
be designed to allow proper drainage. Photographs of beach building operations are shown in Figures 2-
21 and 2-22.
Equipment Management/Personnel Parking
Because beach replenishment activities would occur on a constant basis at the site and using only the few
machines necessary, there would not be a need for equipment storage. During replenishment activities, the
vehicles would either be active or temporarily idle on the receiver site itself. Any fueling or maintenance
activities would occur at the nearest public street or parking lot. Construction personnel would park near
the receiver sites in public parking areas. The contractor will be required to prepare a plan for hazardous
spill containment.
Schedule
Sand placement operations for the proposed action are scheduled to occur beginning in spring 2001 per R
the action of the SEC at their May 2000 meeting. The Draft EIR/EA was prepared considering a R
construction start date in late summer 2000. The change in schedule is addressed for every issue area in R
Chapter 4.0. R

2.0 Alternatives Considered
Page 2-46 Regional Beach Sand Project EIR/EA99-69\SANDAG EIREA 3.4.wpd 7/17/00
The exact timing for particular receiver sites would depend on the contractor selected to implement the
dredging and disposal activities, the alternative selected for implementation, and coordination with the R
resource agencies regarding nesting season. However, scheduling would be coordinated to the maximum R
extent possible to avoid conflicts with national holidays and scheduled major beach events. R
Public Safety/Beach Closures
Due to construction activities associated with beach replenishment operations (e.g., pumping sand onto the
beach, grading, line moving and maintenance), portions of the identified receiver sites would be temporarily
closed to public access. Table 2-4 shows the approximate length of each receiver site that would be closed
to the public per day, depending on the unique beach site characteristics (e.g., width of existing beach,
presence of bluffs, rip-rap) at each receiver site. Closure would be maintained on a 24-hour basis during
the scheduled project operation time.
Table 2-4Receiver Site Closures During Construction
Receiver SiteApproximate Length of Receiver
Site Closed per Day (feet)
South Oceanside 175
North Carlsbad(1) 250
South Carlsbad North 200
South Carlsbad South(2) 200
Batiquitos(1) 175
Leucadia(1) 325
Moonlight Beach(1) 150
Cardiff 125
Solana Beach 200
Del Mar 250
Torrey Pines 100
Mission Beach 250
Imperial Beach 300(1) Receiver site under Alternative 1 only.(2) Receiver site under Alternative 2 only.
2.0 Alternatives Considered
Regional Beach Sand Project EIR/EA Page 2-4799-69\SANDAG EIREA 3.4.wpd 7/17/00
During beach replenishment activities, a 100-foot buffer zone would be maintained between the operational
area and open public beaches. The contractor selected to perform the beach building operations would
provide and maintain safety measures in the vicinity of the receiver sites including fencing, barricades, and
flag personnel as necessary.
Offshore Closures/Coordination with Commercial Fishermen
In addition to onshore restricted access, an offshore area would be restricted to allow proper anchoring
of the dredge and pumping operations and protect public safety. Each of the dredge locations would be
publicized via a U.S. Coast Guard Notice to Mariners. Within that larger area, the Notice to Mariners
would identify that a 500 foot buffer must be maintained around the active dredge equipment. That 500
foot buffer would vary throughout the day as the active dredge location shifted within the overall dredge
area. A 500 foot restricted buffer would also be provided around the mono buoy where the hopper dredge
(if used) would connect to the discharge line. The Notice to Mariners would also identify the radio
frequency used by the dredge operator to allow other boat operators to coordinate directly with the
operator. This would be particularly useful around the mono buoy where the buffer may only be necessary
for the few hours in a day where it would be utilized. When not in use, the buffer would not be necessary
and boating activity could occur nearby.
A pro-active effort would be made to coordinate with the commercial fishermen in advance of dredging
and during dredge operations to avoid conflicts and fishing gear loss. Transit corridors for the dredge
would be defined in consultation with a representative of the commercial fishermen and this transit corridor
would also be noticed. Transit corridors would be defined from the harbor to the dredge location and from
the dredge area to the mono buoy (if used). The noticing process for the transit corridor and dredge
location would involve Notice to Mariners, written notices to local fishing representatives, posted notices
in local harbors, and incorporation of these notices into a project website. The website would include a
current overall project schedule with on-going and soon-to-be-initiated project events. This website would
serve the general public as well.
At the initiation of dredge activities, an observer would be aboard the dredge to document any fishing gear
in the noticed transit or dredge areas. Gear within these areas, if damaged or destroyed, would not require
compensation. If gear outside of the noticed dredge areas or transit corridors is damaged or destroyed,
compensation would be the responsibility of the contractor.

2.0 Alternatives Considered
Page 2-48 Regional Beach Sand Project EIR/EA99-69\SANDAG EIREA 3.4.wpd 7/17/00
The lobster season generally runs from mid-October through mid-March. At the close of the season, all R
legal lobster traps would be removed and there would be no need for continued monitoring for lobster R
traps. There is still some trapping effort associated with the crab fishery, which has no seasonal restriction, R
but the number of crab traps would be many times less than lobster. Accordingly, the coordination effort R
during non-lobster season could be reduced. R
Coordination With Resource Agencies R
Based on comments received on the Draft EIR/EA from the resource agencies, and the SEC R
recommendation to schedule project construction in Spring 2001, SANDAG has initiated Section 7 R
consultation under the Endangered Species Act. Consultation will continue after certification of the EIR R
and selection of an alternative, to negotiate specific details for project construction that results in “no may R
effect” to the California least tern and the western snowy plover, two bird species federally-listed as R
endangered and threatened, respectively. Possible design elements consist of scheduling sensitive receiver R
sites prior to, or early in, the nesting season, identifying construction processes to reduce turbidity, and R
instituting predator control. SANDAG is committed to continued coordination with the U.S. Fish and R
Wildlife Service (USFWS) to identify and institute appropriate measures to avoid significant impacts to R
either bird species. R
2.4.2 Alternative 2
Alternative 2 would involve sand replenishment at nine receiver sites, all but one of which would be
associated with Alternative 1. The same six borrow sites would provide the material for replenishment and
the dredging and discharge plan would be the same, except where some receiver sites would be eliminated.
The receiver sites and borrow sites are described below for Alternative 2a followed by the description of
Alternative 2b.
Alternative 2a
Receiver Sites
Alternative 2 would have eight receiver sites common to Alternative 1 and one new site (South Carlsbad
South) for a total of nine. In three of the sites, the quantity and location of replenishment would be identical
to Alternative 1, and they would be built to the same specifications (e.g., height, slope). Five of the sites
2.0 Alternatives Considered
Regional Beach Sand Project EIR/EA Page 2-4999-69\SANDAG EIREA 3.4.wpd 7/17/00
would be similar in location as under Alternative 1, although the sand quantity would increase. Accordingly,
the length of the footprint would increase. Below is a description of the boundaries of each receiver site.
Plan views of the beach fill at applicable receiver sites were presented in the description of Alternative 1.
Those graphics clearly indicate where beach fill plans would vary under each alternative. A beach fill plan
is provided in this section for the South Carlsbad South receiver site that is not proposed under Alternative
1.
Under this alternative, beach replenishment at South Oceanside would involve onshore placement of sand
from Seagate Drive to Vista Way, a distance of approximately two miles. Refer to Figure 2-3. The final
configuration of this site may be shortened during the permitting process. This document evaluates the
maximum footprint to disclose worst-case impacts (refer to Section 2.5).
Beach replenishment at the South Carlsbad North site would consist of the placement of dredged sediment
near the Palomar Airport Road intersection with Carlsbad Boulevard, stretching to the south for 2,800 feet
(0.5 mile) near the Encinitas Creek outlet. Refer to Figure 2-4.
The South Carlsbad South receiver site (Figure 2-23) begins just south of the South Carlsbad North
receiver site and the Encinas Creek outlet. The site is approximately 1,830 feet (0.3 mile) in length. A berm
would be constructed to an elevation of approximately 12 feet above MLLW. The berm would be flat
with a width of approximately 170 feet. The berm would then slope seaward approximately 100 feet at
a slope of 10:1.
Beach replenishment at the Cardiff, Solana Beach, and Del Mar receiver sites would be identical to that
proposed under Alternative 1a. They are illustrated in Figures 2-9, 2-10, and 2-11, respectively.
The Torrey Pines receiver site would stretch approximately 2,470 feet (0.5 mile) and is located on Torrey
Pines State Beach. The northern boundary of the fill site would be identical to Alternative 1. The footprints
of both alternatives are shown in Figure 2-12.
The Mission Beach receiver site would stretching from Ostend Court to Santa Barbara Place, a distance
of approximately 2,380 feet (0.5 mile). Figure 2-13 illustrates both footprints.
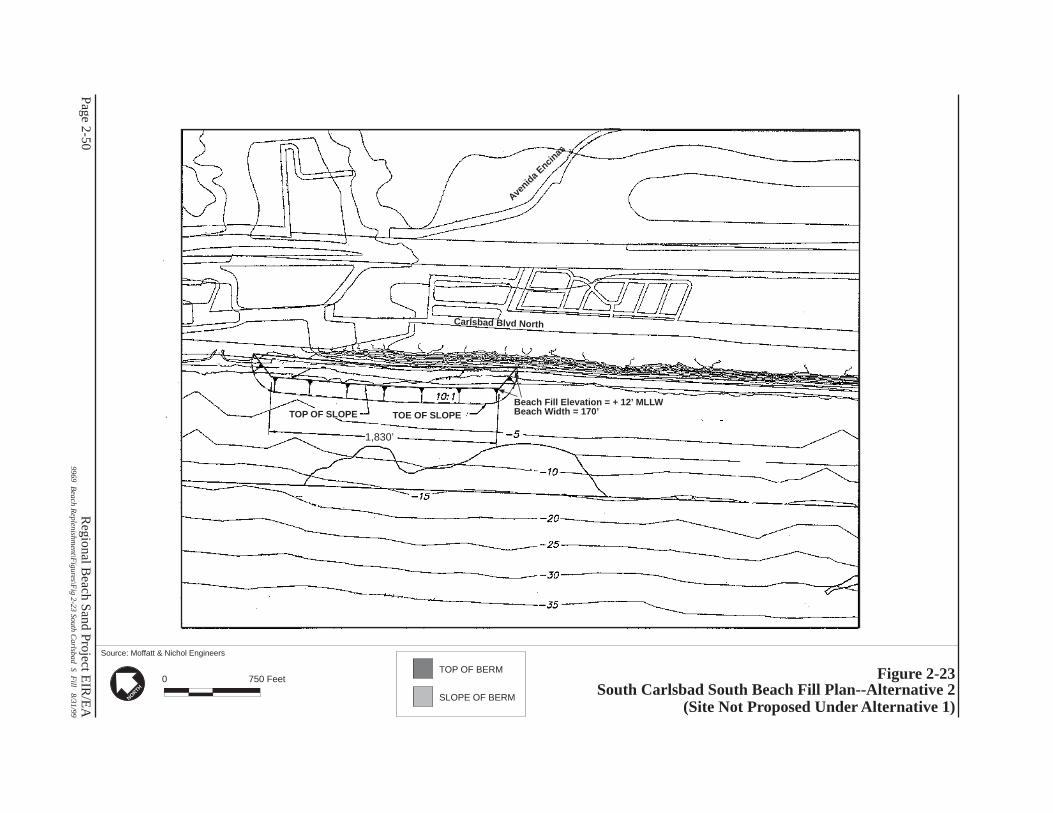
TOE OF SLOPE
1,830’
X.X
Section Nam
e
Page 2-50
Source: Moffatt & Nichol Engineers
Regional B
each Sand Project EIR
/EA
9969 Beach R
eplenishment\F
igures\Fig 2-23 South C
arlsbad S Fill 8/31/99
Figure 2-23South Carlsbad South Beach Fill Plan--Alternative 2
(Site Not Proposed Under Alternative 1) N
ORTH
TOP OF SLOPE
Avenid
a Encin
as
Carlsbad Blvd North
TOP OF BERM
SLOPE OF BERM
Beach Fill Elevation = + 12’ MLLWBeach Width = 170’
750 Feet0

2.0 Alternatives Considered
Regional Beach Sand Project EIR/EA Page 2-5199-69\SANDAG EIREA 3.4.wpd 7/17/00
In Imperial Beach, the beach replenishment berm would be built along approximately 3,470 feet (0.7 mile)
of beach, from Imperial Beach Boulevard to approximately 1,000 feet south of Encanto Avenue. This
receiver site footprint would be longer than proposed under Alternative 1 (Figure 2-14).
Borrow Sites
Under this alternative, the borrow site locations would remain as under Alternative 1, but the sand quantity
would change and the number of receiver sites would decrease. Figures 2-15 through 2-20 also illustrate
the dredge location and discharge plans as they apply to this alternative. As under Alternative 1, temporary
pipelines would carry replenishment material to the shoreline and then up and down the coast to the various
receiver sites. Also, borrow sites SO-9 and SO-6 may be eliminated and additional material removed from R
SO-7 instead. Table 2-5 summarizes pertinent characteristics of the borrow sites under this alternative. R
Table 2-5Alternative 2 – Borrow Site Characteristics
Borrow SitesVolume of Sand to be
Dredged (in cy)
Approx. Surface Areato be Dredged
(in acres)Depth of Dredge
(in feet)Water Depth
(in feet, MLLW)
SO-9(1) 627,000(2) 63 Max. 15 45 to 55
SO-7(3) 360,000 70 1 to 11 60 to 85
SO-6 104,000 29 3 to 4 60 to 80
SO-5 788,000(2) 127 Max. 6 50 to 80
MB-1 150,000 19 Max. 10 68 to 75
SS-1 180,000 22 Max. 7 40 to 53(1) With dredge area modified to provide a larger buffer between previously unmapped artificial reef areas, R
the dredge area would be reduced by approximately 25 percent. The borrow site may be eliminated during Rfinal design. R
(2) Volume includes overfill factor (Moffatt & Nichol 2000c).(3) Possible expansion to 1.5 million cy with total surface area of 150 acres if SO-9 and SO-6 are eliminated. R
Depth of dredge would be maximum 15 feet. R
Alternative 2b
This alternative would be implemented at the same receiver sites and using the same borrow sites as
described for Alternative 2a; however, adherence to applicable, local noise ordinances would limit the
hours and number of days per week that beach replenishment could occur. The construction schedules
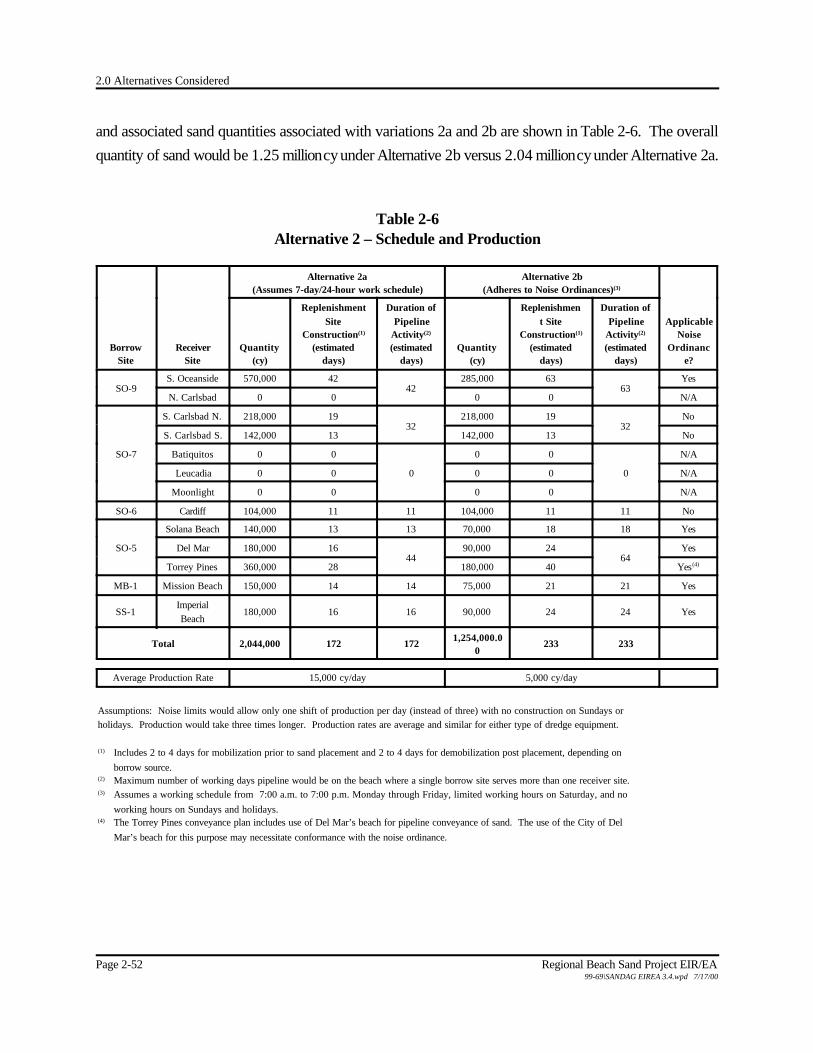
2.0 Alternatives Considered
Page 2-52 Regional Beach Sand Project EIR/EA99-69\SANDAG EIREA 3.4.wpd 7/17/00
and associated sand quantities associated with variations 2a and 2b are shown in Table 2-6. The overall
quantity of sand would be 1.25 million cy under Alternative 2b versus 2.04 million cy under Alternative 2a.
Table 2-6Alternative 2 – Schedule and Production
BorrowSite
ReceiverSite
Alternative 2a(Assumes 7-day/24-hour work schedule)
Alternative 2b(Adheres to Noise Ordinances)(3)
ApplicableNoise
Ordinance?
Quantity(cy)
ReplenishmentSite
Construction(1)
(estimateddays)
Duration ofPipeline
Activity(2)
(estimateddays)
Quantity(cy)
Replenishment Site
Construction(1)
(estimateddays)
Duration ofPipeline
Activity(2)
(estimateddays)
SO-9S. Oceanside 570,000 42
42285,000 63
63Yes
N. Carlsbad 0 0 0 0 N/A
SO-7
S. Carlsbad N. 218,000 1932
218,000 1932
No
S. Carlsbad S. 142,000 13 142,000 13 No
Batiquitos 0 0
0
0 0
0
N/A
Leucadia 0 0 0 0 N/A
Moonlight 0 0 0 0 N/A
SO-6 Cardiff 104,000 11 11 104,000 11 11 No
SO-5
Solana Beach 140,000 13 13 70,000 18 18 Yes
Del Mar 180,000 1644
90,000 2464
Yes
Torrey Pines 360,000 28 180,000 40 Yes(4)
MB-1 Mission Beach 150,000 14 14 75,000 21 21 Yes
SS-1ImperialBeach
180,000 16 16 90,000 24 24 Yes
Total 2,044,000 172 172 1,254,000.00
233 233
Average Production Rate 15,000 cy/day 5,000 cy/day
Assumptions: Noise limits would allow only one shift of production per day (instead of three) with no construction on Sundays orholidays. Production would take three times longer. Production rates are average and similar for either type of dredge equipment.
(1) Includes 2 to 4 days for mobilization prior to sand placement and 2 to 4 days for demobilization post placement, depending on
borrow source.(2) Maximum number of working days pipeline would be on the beach where a single borrow site serves more than one receiver site.(3) Assumes a working schedule from 7:00 a.m. to 7:00 p.m. Monday through Friday, limited working hours on Saturday, and no
working hours on Sundays and holidays.(4) The Torrey Pines conveyance plan includes use of Del Mar’s beach for pipeline conveyance of sand. The use of the City of Del
Mar’s beach for this purpose may necessitate conformance with the noise ordinance.

2.0 Alternatives Considered
Regional Beach Sand Project EIR/EA Page 2-5399-69\SANDAG EIREA 3.4.wpd 7/17/00
Construction Methods/Features
Under Alternative 2, the dredge operations, discharge line maintenance/maintenance, training dikes, beach
building, staging areas, and scheduling would be identical in process to Alternative 1. However, there
would be a difference in the need for booster pumps. At SO-9, there would likely be one onshore booster
pump only to convey material to the southern extent of the footprint. Onshore booster pumps would also
be required to move material to the South Carlsbad North and Torrey Pines sites. Beach closures to
protect public safety would be the same in length per day under this alternative as under Alternative 1,
although there would be no closure at North Carlsbad, Batiquitos, Leucadia or Moonlight Beach receiver
sites (Table 2-4).
2.4.3 No Action Alternative
Under the No Action Alternative, no dredging or beach replenishment activities would occur, and erosion
at the region’s beaches would continue without intervention. This would result in failure to achieve property
protection, enhance recreational opportunities, or enhance tourism value at specific receiver sites. It would
also preclude the addition of sand in the three littoral cells which could thereby indirectly enhance other
beach locations. Finally, it would not provide the opportunity to monitor the post-project condition for
purposes of increasing knowledge regarding the state-of-the-art modeling process. While all these failures
would be specific to the proposed specific receiver sites, there is a region-wide benefit that would also
remain unaddressed.
To assist in effective and appropriate decision-making regarding the utilization of the coastline, the State
of the Coast Report, San Diego Region (USACOE 1991) evaluated the natural and man-made coastal
processes. This document stated that during the next 50 years, the San Diego region “is on a collision
course. With sandy beaches backed by sea cliffs, beach erosion and failure of the sea cliffs must be
anticipated. Extensive damage and loss of property will occur.” While the amount of erosion is dependent
upon sea level change, as well as the wave climate, particularly severe storm events, the report concludes
that...
all the beaches of the San Diego region are threatened with erosion. The apparent stability
of the beaches is belied by rigorous examination of the historical beach profiles and
summation of previous beach nourishment. Without the earlier massive input of beachfill,
the shoreline of the San Diego Region would exhibit nearly continuous erosion from Dana
2.0 Alternatives Considered
Page 2-54 Regional Beach Sand Project EIR/EA99-69\SANDAG EIREA 3.4.wpd 7/17/00
Point to the international border. New sources of beach-quality sand need to be readied
for beach nourishment following severe storm events and for long-term protection from
rising sea level (page 9-27).
To assist in understanding the potential economic outcomes of various shoreline management techniques,
an analysis was provided in Appendix I of the Shoreline Preservation Strategy for the San Diego
Region (SANDAG 1993). That document quantified the economic costs and benefits of three basic
shoreline management alternatives in terms of loss to property and loss of recreational opportunities. These
included: 1) Do Nothing, 2) Armor the coast to protect property, using sea walls and revetments, and 3)
Beach Replenishment. Under the Do Nothing Alternative, which corresponds in part to the No Action
Alternative, there would be “significant costs to the region in lost property and recreational benefits due to
shoreline retreat.” Annual costs (losses) were estimated for the total San Diego region as $52 million by
2010 and over $226 million by 2040.
The No Action Alternative would have specific ramifications to the potential receiver sites, and some
indirect relationships to the littoral cells, but would also not satisfy the regional goals of beach replenishment
promulgated by the SEC and USACOE.
2.5 MONITORING AND MITIGATION FRAMEWORK
Although sand replenishment has occurred along the San Diego region coastline for well over 50 years
(USACOE 1991), the effects of sand transport have not been effectively monitored to date. While there
are coastal engineering models to predict sand transport from beach replenishment, there is little local data
available to verify how the actual conditions compare to the predicted.
As part of the permits issued to the Navy for their beach replenishment project, a Coastal Monitoring Plan
was approved by the U.S. Army Corps of Engineers in 1997. That plan described a monitoring program
to be implemented subsequent to sand placement and for a four-year period following the action. The
intent of the monitoring was to verify that there were no long-term, significant impacts to sensitive biological
resources. If impacts were identified, then mitigation would be required. The data from monitoring would
also be useful in understanding how actual sand transport compared to the predicted path.
While sand placement was halted prior to completion, the required monitoring continued by the Navy as
required by the permit until 2001. Since the projects are substantially the same, except with respect to sand

2.0 Alternatives Considered
Regional Beach Sand Project EIR/EA Page 2-5599-69\SANDAG EIREA 3.4.wpd 7/17/00
source and reduced sand volume, a similar monitoring program would be implemented for the Regional
Beach Sand Project. A mitigation commitment would also be necessary in case long-term, significant
impacts are identified during monitoring. This section describes the framework for monitoring and
mitigation for the Regional Beach Sand Project. The final details are most appropriately determined upon
selection of an alternative and negotiation of permit conditions with the resource agencies. Items such as
exact monitoring locations would depend on the alternative to be implemented.
Monitoring can be considered in terms of “during construction” and “post-construction.” Monitoring during
construction would be required to verify that specified site-specific, resources are not adversely impacted
(e.g., grunion). Post-construction monitoring will be required to understand the long-term ramifications of
project implementation, which is especially pertinent because of the highly dynamic ocean system.
2.5.1 Monitoring During Construction
The three issues likely to require construction monitoring are turbidity, grunion, and underwater cultural
resources. In this phase, monitoring is used to identify problems and solutions in the immediate time frame,
mitigation would not be necessary once adjustments are made to correct the problem. Additionally, R
SANDAG is committed to coordinating with commercial fishermen to avoid gear loss in the transit and R
dredge areas. As described in Section 2.4.1, an observer would be aboard the dredge to document any R
fishing gear in these areas and determine compensation responsibility if gear is lost. Other specifics of the R
noticing procedure prior to and during construction are in that section. R
Turbidity
Construction monitoring of water quality (i.e., potential turbidity impacts) will occur as directed by the
RWQCB 401 Certification of Waste Discharge Requirements and to support the predicted impact of
localized turbidity influence. The 401 permit will likely establish parameters for water quality at specified
distances from activity at the receiver sites and the borrow sites, and it will be necessary to perform
verification that water quality is within those parameters. The 401 Certification requirement will establish R
the frequency and duration of monitoring. R

2.0 Alternatives Considered
Page 2-56 Regional Beach Sand Project EIR/EA99-69\SANDAG EIREA 3.4.wpd 7/17/00
Spawning Grunion
Replenishment of beaches could potentially bury grunion eggs or change the beach profile such that juvenile
grunion are unable to return to the ocean. Monitoring would occur during discharge operations at those
receiver sites with suitable grunion habitat. Monitoring by a qualified biologist would only occur during the R
spawning season (March through August) and during the dates specified by the CDFG in their annual R
pamphlet Expected Grunion Runs. If grunion were observed spawning, disposal of sand would cease R
in the vicinity and a buffer zone established. The buffer zone would extend 65 feet shoreward of the high
water mark at the spawning area and 100 feet upcoast and downcoast (total 200 feet). A sand dike would
be constructed to ensure that discharge water would not enter the spawning area. A schematic drawing R
of any diked buffer area would be submitted to the resource and regulatory agencies. The buffer zone R
would be in place a minimum of 14 days to allow the eggs to hatch, and surveys show no subsequent R
spawning has occurred in the same area. R
Underwater Cultural Resources
Underwater cultural resources consist of potential archaeological resources and historic elements remaining
at ancient river bed locations. The dredge areas at each borrow site have varying potential to effect such
resources. Although the dredge areas have been designed, to the maximum extent possible, to avoid
locations of high probability for underwater archaeological resources there is the potential for such
resources to be uncovered during dredging. Design considerations to avoid high probability areas are
constrained by ocean outfalls, artificial reefs, and kelp beds as well as the location of beach quality sand.
Identified side scan sonar targets in SO-9 and MB-1 would be investigated by diver or remotely operated
vehicle (ROV) prior to dredge to determine what they are. Interpretation of sonar targets is difficult and
targets within the dredge area may be gravel, sand dollar beds or historic features. If the targets are historic
features, then a buffer would be established around the target and the resource would be recorded at the
appropriate clearinghouse. Interpretation of targets will be also be appropriate to avoid any features that
may hinder or damage the dredge machine. Finally, complete side scan sonar will be obtained and
interpreted at SO-9 and SS-1 prior to dredge activity to verify no historic targets and to ensure no
damaging features for the dredge.
To avoid significant archaeology impacts, monitoring will be required as material is dredged from each
borrow site. A qualified marine archeologist would be present while material is being placed on receiver

2.0 Alternatives Considered
Regional Beach Sand Project EIR/EA Page 2-5799-69\SANDAG EIREA 3.4.wpd 7/17/00
sites to observe the discharged material. Appropriate communication equipment (two-way radios or
cellular telephones) would allow for communication with dredge personnel. Daily ship logs shall also be
maintained regarding the dredge position, time and sediment depth of dredge activities. If the monitor
observes cultural material suggesting that dredging has entered an archaeological site, then the dredging
operation would be permanently relocated away from that site and a 250-foot-wide buffer would be
established around the site. The location of the site would be recorded for the appropriate clearinghouse.
The monitoring program would be guided by the probability for occurrence of archaeological resources.
Where there is a high probability of occurrence, the monitor would be present during dredging of the
borrow sites (cutterhead dredge) or when material is being pumped to the receiver site (hopper dredge),
on a daily basis. This applies to SO-9 at depths below nine feet, SO-6, MB-1 at depths below 12 feet
and SS-1. Where the probability is moderate, the monitor would be present as above on alternate days.
This applies to SO-9 at depths higher than 9 feet, SO-7, SO-5, and MB-1 at depths greater than 12 feet.
2.5.2 Post-Construction Monitoring
There will be monitoring, and may be mitigation, for potential indirect impacts to sensitive marine resources
due to sedimentation and indirect impacts to lagoons from increased sand inflow. Each is discussed
individually below.
Potential Sedimentation Impacts to Marine Resources
Sensitive marine resources are defined consistent with the Navy’s documentation (1997a, 1997b) as rocky
intertidal reefs; subtidal vegetated reefs including feather boa kelp, surfgrass, sea fans, and sea palm; and
nearshore kelp. These resources exist in an environment of constantly moving sediment. The fluctuation
is daily and seasonal. Most have adapted to periodic exposure to sand, while some experience total
covering. Seasonal fluctuation of up to three feet has been documented (Appendix D). Therefore, the most
difficult challenge in designing a sediment monitoring program is distinguishing project-related sediment from
natural seasonal sand flux. Toward that end, the monitoring program includes pre-discharge baseline
studies and post-discharge monitoring as well as monitoring of control sites that are not influenced by the
project, but are comparable in terms of other ocean influences. The existing data collected by Navy will
serve as one component of the pre-discharge baseline data and as a guide for the monitoring program
overall. All monitoring data from the on-going Navy monitoring are publicly available as would be the
results of the proposed monitoring program.

2.0 Alternatives Considered
Page 2-58 Regional Beach Sand Project EIR/EA99-69\SANDAG EIREA 3.4.wpd 7/17/00
The Navy plan involves various test and control sites for the three habitat types. For rocky intertidal
monitoring there is one test site (Cardiff) and two control sites (Scripps/La Jolla and off Point Loma). For
subtidal reefs there are two monitoring sites (North Carlsbad and Encinitas) and one control site (Cardiff).
For kelp monitoring there are four test sites (Imperial Beach, North Carlsbad, Leucadia, and Solana
Beach/Cardiff) and two control sites (Swami’s Reef and Point Loma kelp beds). The intent of the R
monitoring program is two-fold: (1) to verify that after project implementation there would be no long-term, R
significant impacts to sensitive biological resources from sediment transport, and (2) to gain a better R
understanding of the regional on-shore and off-shore seasonal movement of sand over time and under R
various weather conditions. The RBSP monitoring program will continue as many of the existing Navy sites R
as practicable while meeting the two purposes. R
RWhile the exact monitoring locations will be finalized in concert with the resource and regulatory agencies, R
tentative locations include Point Loma (control) and Cardiff (test) for rocky intertidal habitat; Cardiff, North R
Carlsbad and Leucadia (test) and one new site north of Table Tops or Swami’s (control) for subtidal R
habitat; and a new location off North Carlsbad, Solana Beach/Cardiff, Batiquitos, Moonlight R
Beach/Boneyards (test) and Point Loma, possibly Swami’s (control) for kelp habitat. A new perpendicular R
transect would be added at the North Carlsbad site to monitor surfgrass to verify no project-specific R
impacts. Current baseline data is available for existing Navy monitoring sites, but where new test and R
control sites would be selected, baseline monitoring would be completed prior to project initiation. Possible R
new sites include the perpendicular transect at North Carlsbad for subtidal habitat, the selected control site R
for subtidal habitat (surfgrass), and Batiquitos, Moonlight Beach/Boneyards and North Carlsbad sites for R
kelp habitat. R
The monitoring program for rocky intertidal habitat would involve periodic checks of fixed plots and fixed R
transects to observe identified target species of vegetation, barnacles, and sea stars. Species abundance
would be estimated based on counts and measurements within those fixed sample locations. Timed
searches and reconnaissance surveys would also be conducted, including video-recording. Surveys would
occur twice a year (spring and fall) for four years. Sample reports would be provided after each survey
and a yearly report would be required after each full year of monitoring. A final report would be prepared
at the completion of the four-year monitoring effort.
The subtidal monitoring would involve establishment of fixed transects inside a fixed quadrant within which R
the substrate would be characterized in terms of percentage of sand, rock, rock type, vertical relief and
depth of sand cover. Within that quadrant, the biologist would census abundance of key indicator species.
Habitat type and species abundance along each transect would be mapped and digitized into a GIS

2.0 Alternatives Considered
Regional Beach Sand Project EIR/EA Page 2-5999-69\SANDAG EIREA 3.4.wpd 7/17/00
database. Persistence or change in habitat over time would be documented. Sediment markers would be
established and monitored as well. It will be important in the monitoring plan to design a standard method
for accurately recording changes in sand depth. Surveys would occur twice annually in spring and fall.
Annual reports would be provided, as well as a final report at the end of four years.
Kelp monitoring would be performed using divers at the study reefs to sample the kelp and reef biota within R
established areas. Transects would be established and substrate mapped to characterize the percentage
of sand, rock, rock type, vertical relief and depth of sand cover. Key indicator species (plants and
invertebrates) would be inventoried for type and abundance. Photographs and video would be used for
recordation. Sediment markers and buoys would be established. For the first two years, monitoring would
occur periodically and thereafter annually. Sampling reports would be required as surveyed, annual reports
every year, and then a final report at the conclusion of monitoring (after four years).
Potential Impacts to Lagoons R
The Navy committed to a four-year lagoon monitoring program at Agua Hedionda Lagoon, Batiquitos R
Lagoon, San Elijo Lagoon, San Dieguito Lagoon, and Los Peñasquitos Lagoon to evaluate lagoon mouth
closures and/or increased sand accumulation rates. SANDAG is currently participating in an annual lagoon
monitoring program as part of that program which has been ongoing since 1996. Under this program, R
beach profile data has been measured in spring and fall at 32 transects perpendicular to the coast. The R
transects were originally established by the USACOE so there is historic data from the early 1980s R
available. The five lagoon mouth entrances are also surveyed in the spring and fall seasons by aerial R
overflight. Measurement of two cross-channel transects plus bathymetric soundings are provided at Agua R
Hedionda and Batiquitos lagoons, which are jetty-stabilized. R
All of these lagoons have been heavily modified and are subject to human intervention in terms of periodic R
maintenance dredging and mouth openings. Table 2-7 outlines the current permitted levels of dredging at
each lagoon and the party responsible for dredging activities.
The intent of lagoon monitoring would be to determine to what extent sand deposition and lagoon mouth R
closures are related to the Regional Beach Sand Project versus other sand sources and coastal processes.
The determination would be made by the USACOE in consultation with the resource agencies. Project
monitoring would rely on a comparison of surveyed beach transects which bracket each lagoon mouth
between current year changes and historical data, comparison of triangulated irregular network (TIN) maps
and transects to recent lagoon monitoring, aerial overflights, as well as an evaluation of non-project inputs
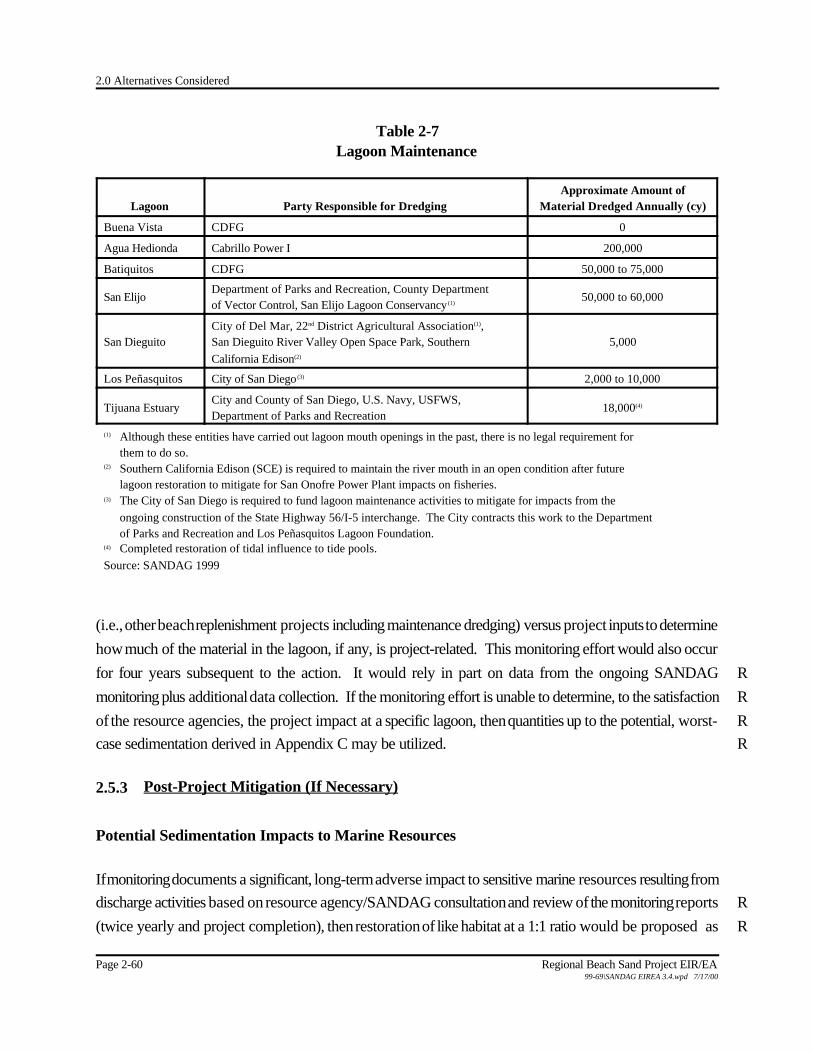
2.0 Alternatives Considered
Page 2-60 Regional Beach Sand Project EIR/EA99-69\SANDAG EIREA 3.4.wpd 7/17/00
Table 2-7Lagoon Maintenance
Lagoon Party Responsible for DredgingApproximate Amount of
Material Dredged Annually (cy)
Buena Vista CDFG 0
Agua Hedionda Cabrillo Power I 200,000
Batiquitos CDFG 50,000 to 75,000
San ElijoDepartment of Parks and Recreation, County Departmentof Vector Control, San Elijo Lagoon Conservancy (1)
50,000 to 60,000
San DieguitoCity of Del Mar, 22nd District Agricultural Association(1),San Dieguito River Valley Open Space Park, SouthernCalifornia Edison(2)
5,000
Los Peñasquitos City of San Diego (3) 2,000 to 10,000
Tijuana EstuaryCity and County of San Diego, U.S. Navy, USFWS,Department of Parks and Recreation
18,000(4)
(1) Although these entities have carried out lagoon mouth openings in the past, there is no legal requirement forthem to do so.
(2) Southern California Edison (SCE) is required to maintain the river mouth in an open condition after futurelagoon restoration to mitigate for San Onofre Power Plant impacts on fisheries.
(3) The City of San Diego is required to fund lagoon maintenance activities to mitigate for impacts from theongoing construction of the State Highway 56/I-5 interchange. The City contracts this work to the Departmentof Parks and Recreation and Los Peñasquitos Lagoon Foundation.
(4) Completed restoration of tidal influence to tide pools.Source: SANDAG 1999
(i.e., other beach replenishment projects including maintenance dredging) versus project inputs to determine
how much of the material in the lagoon, if any, is project-related. This monitoring effort would also occur
for four years subsequent to the action. It would rely in part on data from the ongoing SANDAG R
monitoring plus additional data collection. If the monitoring effort is unable to determine, to the satisfaction R
of the resource agencies, the project impact at a specific lagoon, then quantities up to the potential, worst- R
case sedimentation derived in Appendix C may be utilized. R
2.5.3 Post-Project Mitigation (If Necessary)
Potential Sedimentation Impacts to Marine Resources
If monitoring documents a significant, long-term adverse impact to sensitive marine resources resulting from
discharge activities based on resource agency/SANDAG consultation and review of the monitoring reports R
(twice yearly and project completion), then restoration of like habitat at a 1:1 ratio would be proposed as R
2.0 Alternatives Considered
Regional Beach Sand Project EIR/EA Page 2-6199-69\SANDAG EIREA 3.4.wpd 7/17/00
a first priority. Consideration would be given to the construction of artificial reefs as mitigation to offset
project impacts at a 1:1 ratio if like habitat restoration efforts were not feasible as determined by the
USACOE, in consultation with the resource agencies. Like the Navy, SANDAG would negotiate a “not-
to-exceed” cap on mitigation costs as a key part of the permit conditions related to mitigation. The R
potential worst-case acreage for 1:1 enhancement/replacement is similar in size to the prior Navy project R
and a similar mitigation fund ($1.1 million) would likely be negotiated. R
Potential Impacts to Lagoons
If the lagoons experience sand input above typical conditions, which are related to the Regional Beach
Sand Project, funding would be provided to allow for sediment removal or an additional mouth opening
in concert with other on-going maintenance efforts at each lagoon. This determination would be made in R
consultation with SANDAG/resource agencies based on review of the monitoring reports (twice yearly and R
project completion). Funding will be identified for potential mitigation and a not-to-exceed cap will be R
negotiated as a key part of permit conditions. R
R2.5.4 Summary of Project Elements to Avoid Significant Impacts/ R
Possible Mitigation Measures R
RSection 2.4.1 identifies numerous project design features and conditions that will be placed on the R
contractor to avoid significant impacts. Section 2.5 contains a monitoring framework, based on the Navy’s R
approved monitoring program for a larger beach replenishment project, for monitoring and mitigation, if R
necessary. The design features, monitoring component and fully funded mitigation commitments are R
considered in the determination of impact significance in Chapter 4. Table 2-8 provides a summary table R
of these features and commitments, identifying the purpose, timing, and entity responsible for R
implementation. R
2.6 ALTERNATIVES COMPARISON
The intent of NEPA and CEQA is to ensure that the information about the scope of a project and the
potential action environmental effects are made available to public officials and citizens before decisions are
made and actions undertaken. Accordingly, this EIR/EA evaluates two potential alternatives for
implementation of the Regional Beach Sand Project and the No Action Alternative. CEQA requires an
EIR to include sufficient information about each alternative to allow meaningful evaluation, analysis and
comparison.

2.0 Alternatives Considered
Page 2-62 Regional Beach Sand Project EIR/EA99-69\SANDAG EIREA 3.4.wpd 7/17/00
Table 2-8 RSummary of Design Features/Monitoring Commitments R
and Mitigation Measures (If Necessary) R
Purpose Timing Implementation ResponsibilityDesign Features
Construct longitudinal dikes at all receiver sites Reduce nearshore turbidity During beach-building Construction contractor
Maintain project web site with current constructionschedule
Timely public notification At present and continuing throughconstruction
SANDAG
Issue Notice to Mariners and maintain 500-footbuffer around active dredge equipment
Warn boaters/fishermen of dredgingactivities to ensure avoidance
Before and during dredging activities Coast Guard (via constructioncontractor)
Restrict public access at receiver sites and maintain100-foot buffer around construction areas
Public safety during construction During beach-building activities Construction contractor, incoordination with local lifeguards
Relocation of temporary lifeguard towers Public safety during construction During beach-building activities Construction contractor, incoordination with local lifeguards
Sand placement to avoid blocking line-of-sight atpermanent lifeguard towers
Public safety during construction During beach-building activities Construction contractor, incoordination with local lifeguards
Contain fill material during sand placement nearstorm drain outlets
Continue proper drainage During beach-building activities Construction contractor, incoordination with City Engineer
Generate plan for hazardous spill containment Ensure minimal contamination fromfuel leak, if any
During beach building Construction contractor
Coordination with commercial fishermen;establishment of offshore transit corridors inconsultation with a commercial fishermenrepresentative; issue Notice to Mariners; incorporatenotices into SANDAG website
Avoid gear conflicts and provide forcompensation if loss occurs
Before and during dredging operations Coast Guard (via constructioncontractor) and SANDAG
Condition contractor to avoid traversing CDFGartificial reef areas near SO-9, SO-7, and MB-1 byhopper dredge or discharge pipeline
Avoid direct impacts to artificialreefs
Final engineering Construction contractor
Condition contractor to make landfall with dischargepipeline, or place mono buoy, north of SeacoastBoulevard in Imperial Beach.
Avoid direct impacts to TijuanaSlough National Wildlife Refuge
Final engineering Construction contractor
Design borrow sites to maintain adequate distancefrom artificial reefs, kelp, and other featuresSO-9: 350-foot buffer from experimental artificialreefs to the west and northSO-7: 350-foot buffer to CDFG artificial reefs tothe east and 500 feet from kelp to southeastSO-5: at least 3,000 feet from kelp to northeastMB-1: dives sites at least 1,000 feet to the southSS-1: kelp at least 3,000 feet to the north
Avoid direct impacts to artificialreefs and kelp
Final engineering and duringconstruction
Engineering contractor andconstruction contractor
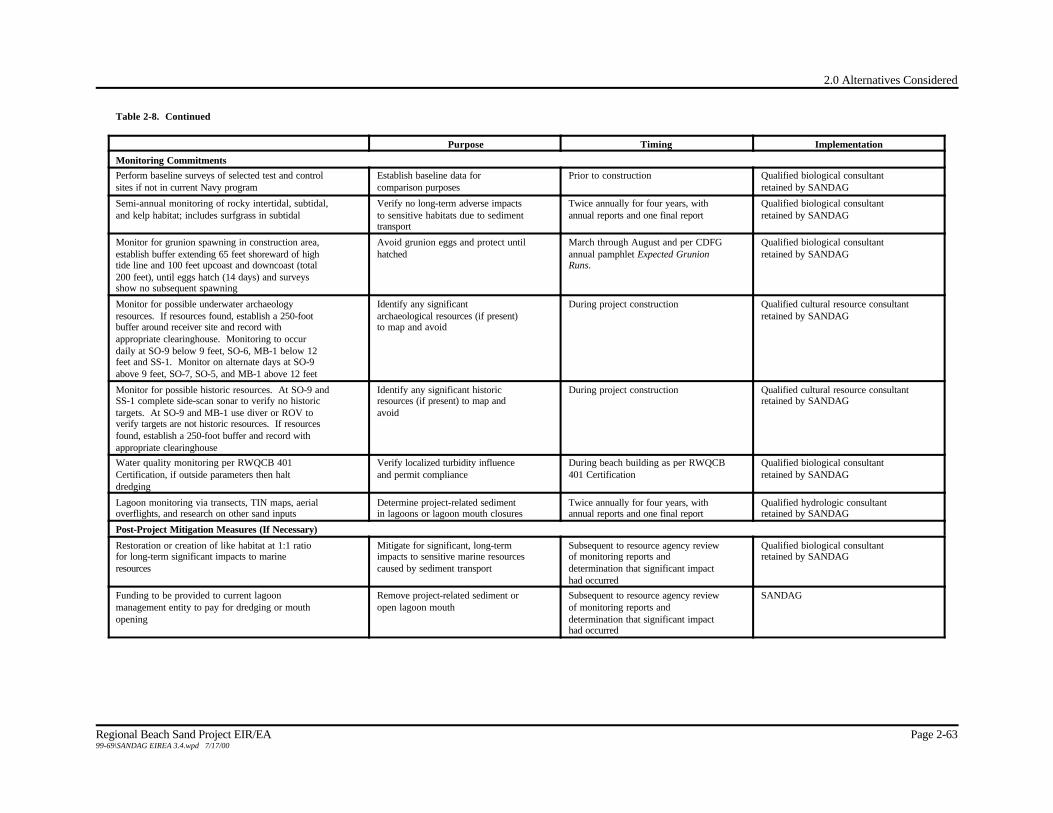
2.0 Alternatives Considered
Regional Beach Sand Project EIR/EA Page 2-6399-69\SANDAG EIREA 3.4.wpd 7/17/00
Table 2-8. Continued
Purpose Timing Implementation
Monitoring CommitmentsPerform baseline surveys of selected test and controlsites if not in current Navy program
Establish baseline data forcomparison purposes
Prior to construction Qualified biological consultantretained by SANDAG
Semi-annual monitoring of rocky intertidal, subtidal,and kelp habitat; includes surfgrass in subtidal
Verify no long-term adverse impactsto sensitive habitats due to sedimenttransport
Twice annually for four years, withannual reports and one final report
Qualified biological consultantretained by SANDAG
Monitor for grunion spawning in construction area,establish buffer extending 65 feet shoreward of hightide line and 100 feet upcoast and downcoast (total200 feet), until eggs hatch (14 days) and surveysshow no subsequent spawning
Avoid grunion eggs and protect untilhatched
March through August and per CDFGannual pamphlet Expected GrunionRuns.
Qualified biological consultantretained by SANDAG
Monitor for possible underwater archaeologyresources. If resources found, establish a 250-footbuffer around receiver site and record withappropriate clearinghouse. Monitoring to occurdaily at SO-9 below 9 feet, SO-6, MB-1 below 12feet and SS-1. Monitor on alternate days at SO-9above 9 feet, SO-7, SO-5, and MB-1 above 12 feet
Identify any significantarchaeological resources (if present)to map and avoid
During project construction Qualified cultural resource consultantretained by SANDAG
Monitor for possible historic resources. At SO-9 andSS-1 complete side-scan sonar to verify no historictargets. At SO-9 and MB-1 use diver or ROV toverify targets are not historic resources. If resourcesfound, establish a 250-foot buffer and record withappropriate clearinghouse
Identify any significant historicresources (if present) to map andavoid
During project construction Qualified cultural resource consultantretained by SANDAG
Water quality monitoring per RWQCB 401Certification, if outside parameters then haltdredging
Verify localized turbidity influenceand permit compliance
During beach building as per RWQCB401 Certification
Qualified biological consultantretained by SANDAG
Lagoon monitoring via transects, TIN maps, aerialoverflights, and research on other sand inputs
Determine project-related sedimentin lagoons or lagoon mouth closures
Twice annually for four years, withannual reports and one final report
Qualified hydrologic consultantretained by SANDAG
Post-Project Mitigation Measures (If Necessary)
Restoration or creation of like habitat at 1:1 ratiofor long-term significant impacts to marineresources
Mitigate for significant, long-termimpacts to sensitive marine resourcescaused by sediment transport
Subsequent to resource agency reviewof monitoring reports anddetermination that significant impacthad occurred
Qualified biological consultantretained by SANDAG
Funding to be provided to current lagoonmanagement entity to pay for dredging or mouthopening
Remove project-related sediment oropen lagoon mouth
Subsequent to resource agency reviewof monitoring reports anddetermination that significant impacthad occurred
SANDAG

2.0 Alternatives Considered
Page 2-64 Regional Beach Sand Project EIR/EA99-69\SANDAG EIREA 3.4.wpd 7/17/00
A comparison of the two action alternatives reveals no issue areas where one alternative would have a
significant impact that another alternative would lessen or avoid. In fact, given project design features and
the monitoring and implementation commitments described in Sections 2.4 and 2.5, neither action
alternative would result in significant impacts. There would be only minor differences in terms of potentially
adverse impacts. For the issue areas of geology and soils, coastal wetlands, water resources, land and
water use, aesthetics, socioeconomics, structures and utilities, traffic, air quality and noise the relative
difference would be very minor. For the issue areas of biological resources, cultural resources and public
health and safety there would be incrementally variable impacts.
For the issue area of biology, the incremental difference would be related to indirect sedimentation impacts.
Under Alternative 1, model-predicted, worst-case potential impacts would occur with partial sedimentation
on up to 3.2 acres of reef near three receiver sites, which support giant kelp, 0.3 acre at one reef which
has feather boa, and 0.24 acre at a single reef which has some surfgrass. Long-term impacts would not be
significant because surfgrass leaves would extend well above the predicted sediment layer and allow for
recovery, and the kelp areas are either sparse, subject only to short-term sediment coverage, and/or not
within the historic areas of kelp persistence. Given Alternative 2, which has a different distribution of
receiver sites, worst-case potential impacts due to sedimentation may occur on less than 1.78 acres of reef,
at two locations, which support some giant kelp and less than 0.24 acre of reef with surfgrass. These
impacts would also not be significant. Values for Alternative 2 are based, in part, on conservative, and
probably unlikely, sediment deposition near North Carlsbad from sand placed at the South Oceanside site.
The impact evaluation is based on prior analyses (Department of Navy 1997a) and interpretation of model
predictions for a configuration with greater combined sand volume at Oceanside and North Carlsbad. In
order to disclose potential worst-case impacts, the most conservative interpretation is provided and impacts
are likely overstated. While the relative difference in worst-case impacts is over 1.5 acres, and probably
slight more; since both estimates are based on predictions of an inherently dynamic system (with variable
weather and wave conditions) the level of uncertainty would suggest these different values may not be great
enough to discriminate between the two alternatives.
For the issues of cultural resources and public health and safety the relative difference is also minor, but
appropriate for disclosure. Under both alternatives borrow site dredging has the potential to disturb areas
of moderate to high probability for archaeological resources. Under Alternative 2, the depth of dredging
would be greater by one to three feet at borrow sites SS-1 and MB-1, respectively. Therefore, there
would be a slightly greater opportunity for intrusion into areas that may contain underwater archaeological
resources under Alternative 2. Given the monitoring program to be implemented as described in Section
2.5, the significance conclusion would be identical for both alternatives. For the issue of public health and

2.0 Alternatives Considered
Regional Beach Sand Project EIR/EA Page 2-6599-69\SANDAG EIREA 3.4.wpd 7/17/00
safety, both alternatives would result in placement of sand at the base of eroded bluffs, thereby providing
a temporary buffer between wave action and these elements, but only under Alternative 1 would sand be
placed along bluffs in Encinitas that have recently experienced failure. Under either alternative, sand
placement would be a temporary feature and this project alone would not prevent future bluff failures.
Based on the above analysis, there may be less indirect sedimentation impacts with Alternative 2 (although
likely not enough to effectively discriminate), there may be greater potential for impacts to underwater
archaeology resources under Alternative 2, and a greater potential for the (temporary) protection of fragile
bluffs in Encinitas under Alternative 1.
Another method of comparing the two action alternatives is their effectiveness at satisfying the project
purpose and need. Following the guidance provided in the Guidelines for the Implementation of CEQA
(Cal. Code Regs. Title 14 § 15126.6(D)) Table 2-9 has been developed to compare the alternatives in this
function. (The No Action Alternative fails to meet the purpose and need and is not analyzed.) As shown,
both alternatives would replenish beaches in accordance with Shoreline Preservation Strategy; however,
Alternative 1 would replenish more receiver sites, create more total beach area (post-construction), and
provide a buffer between wave action and structures at a greater number of locations adjacent to bluffs,
including those along Encinitas.
CEQA requires disclosure of the environmentally superior alternative, and if the No Project alternative is R
environmentally superior it requires identification of a superior alternative among the other alternatives R
(§15126.6(e)(2)). As described above, neither Alternative 1 nor Alternative 2 would result in long-term R
significant impacts to any issue area. For the issue areas of biological, cultural resources and public health R
and safety there would be incrementally variable impacts and Alternative 1 would have slightly less impact R
for two of the three topics. Also, Alternative 1 would better meet the purpose and need of the project R
(Table 2-9). Therefore, Alternative 1 would be considered environmentally superior under CEQA. R
2.7 PERMITS REQUIRED
Various approvals and permits would be necessary for implementation of the proposed action. The project
as a whole would need federal and state permits and then individual receiver sites within the seven
jurisdictions would need appropriate local approvals. Table 2-10 lists the permits and approvals required
for each site, excluding the permits to be issued by individual jurisdictions that vary by receiver site. The

2.0 Alternatives Considered
Page 2-66 Regional Beach Sand Project EIR/EA99-69\SANDAG EIREA 3.4.wpd 7/17/00
Table 2-9Effectiveness of Alternatives at Satisfying the Purpose and Need
Project Purposeand Need Alternative 1 Alternative 2
Alternative Which BestMeets Purpose and Need
Replenish ErodedBeaches in Accordancewith SANDAG’s 1993Shoreline PreservationStrategy for the SanDiego Region
Satisfies Need Satisfies Need Both alternatives meetneed of replenishingeroded beaches butAlternative 1 replenishesthree additional erodedbeaches.
Replenish Littoral Cellsand Receiver Sites
Replenishes 3 LittoralCells and 12 ReceiverSites
Replenishes 3 LittoralCells and 9 Receiver Sites
Alternative 1 hasmaximum number ofreceiver sites
Enhance RecreationalOpportunities andAccess
New recreational beacharea would be created atmore sites along thecoastline to create a post-construction total beacharea of 378 acres; accesscorrespondinglyimproved
New recreational beacharea would be created atfewer sites to create apost-construction totalbeach area of 345 acres;access correspondinglyimproved
Alternative 1 has greatestamount of post-construction total beacharea and improved access
Enhance TourismPotential
Tourism potential directlyrelated to area ofrecreational beach created
Tourism potential directlyrelated to area ofrecreational beach created
Alternative 1 has greatestacreage of recreationalbeach added
Protect Property andInfrastructure
Total of 12 receiver siteswhere additional sandwould temporarilyincrease the bufferbetween wave activityand structures. Six of the12 receiver sites arelocated entirely orpartially in front of bluffs
Total of nine receiversites where additionalsand would temporarilyincrease the bufferbetween wave activityand structures. Four ofthe nine receiver sites arelocated entirely orpartially in front of bluffs
Alternative 1 with greaternumber of sites overall infront of bluffs
site-specific approvals are listed in Table 2-11. The agencies that may issue the permits or approvals may
use the information presented in this EIR/EA to assist in the decision-making process.
As shown in Tables 2-10 and 2-11, the types of permits can vary widely by jurisdiction and by the type
of applicant. One key variation is the permitting/approval process in the coastal zone. Some background
is useful to understand this process.
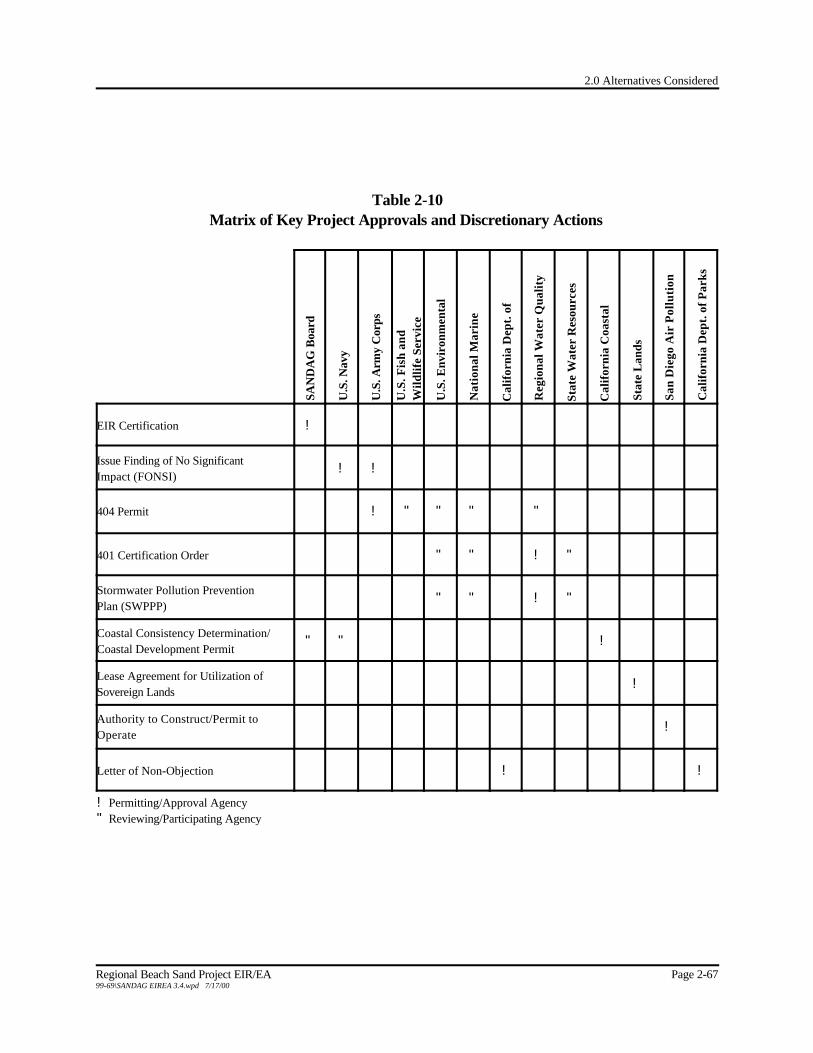
2.0 Alternatives Considered
Regional Beach Sand Project EIR/EA Page 2-6799-69\SANDAG EIREA 3.4.wpd 7/17/00
Table 2-10Matrix of Key Project Approvals and Discretionary Actions
SAN
DA
G B
oard
U.S
. Nav
y
U.S
. Arm
y C
orps
U.S
. Fis
h an
dW
ildlif
e Se
rvic
e
U.S
. Env
iron
men
tal
Nat
iona
l Mar
ine
Cal
ifor
nia
Dep
t. o
f
Reg
iona
l Wat
er Q
ualit
y
Stat
e W
ater
Res
ourc
es
Cal
ifor
nia
Coa
stal
Stat
e L
ands
San
Die
go A
ir P
ollu
tion
Cal
ifor
nia
Dep
t. of
Par
ks
EIR Certification !
Issue Finding of No SignificantImpact (FONSI)
! !
404 Permit ! " " " "
401 Certification Order " " ! "
Stormwater Pollution PreventionPlan (SWPPP)
" " ! "
Coastal Consistency Determination/Coastal Development Permit
" " !
Lease Agreement for Utilization ofSovereign Lands
!
Authority to Construct/Permit toOperate
!
Letter of Non-Objection ! !
! Permitting/Approval Agency" Reviewing/Participating Agency
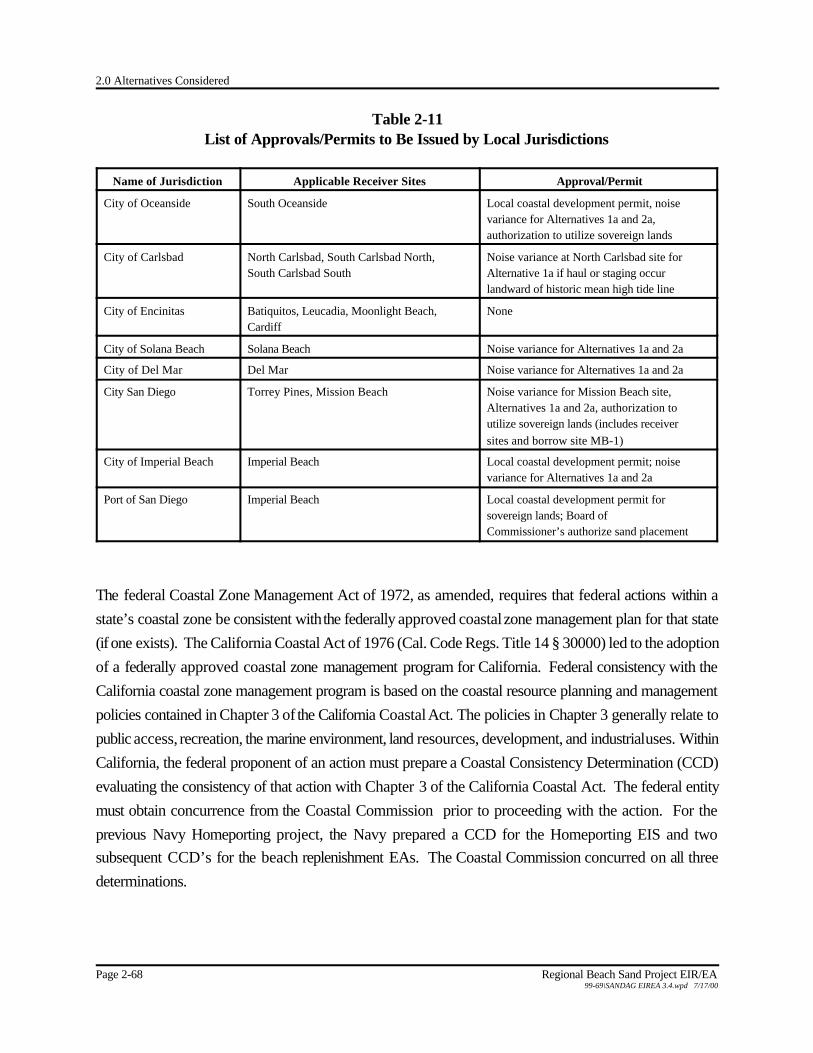
2.0 Alternatives Considered
Page 2-68 Regional Beach Sand Project EIR/EA99-69\SANDAG EIREA 3.4.wpd 7/17/00
Table 2-11List of Approvals/Permits to Be Issued by Local Jurisdictions
Name of Jurisdiction Applicable Receiver Sites Approval/Permit
City of Oceanside South Oceanside Local coastal development permit, noisevariance for Alternatives 1a and 2a,authorization to utilize sovereign lands
City of Carlsbad North Carlsbad, South Carlsbad North,South Carlsbad South
Noise variance at North Carlsbad site forAlternative 1a if haul or staging occurlandward of historic mean high tide line
City of Encinitas Batiquitos, Leucadia, Moonlight Beach,Cardiff
None
City of Solana Beach Solana Beach Noise variance for Alternatives 1a and 2a
City of Del Mar Del Mar Noise variance for Alternatives 1a and 2a
City San Diego Torrey Pines, Mission Beach Noise variance for Mission Beach site,Alternatives 1a and 2a, authorization toutilize sovereign lands (includes receiversites and borrow site MB-1)
City of Imperial Beach Imperial Beach Local coastal development permit; noisevariance for Alternatives 1a and 2a
Port of San Diego Imperial Beach Local coastal development permit forsovereign lands; Board ofCommissioner’s authorize sand placement
The federal Coastal Zone Management Act of 1972, as amended, requires that federal actions within a
state’s coastal zone be consistent with the federally approved coastal zone management plan for that state
(if one exists). The California Coastal Act of 1976 (Cal. Code Regs. Title 14 § 30000) led to the adoption
of a federally approved coastal zone management program for California. Federal consistency with the
California coastal zone management program is based on the coastal resource planning and management
policies contained in Chapter 3 of the California Coastal Act. The policies in Chapter 3 generally relate to
public access, recreation, the marine environment, land resources, development, and industrial uses. Within
California, the federal proponent of an action must prepare a Coastal Consistency Determination (CCD)
evaluating the consistency of that action with Chapter 3 of the California Coastal Act. The federal entity
must obtain concurrence from the Coastal Commission prior to proceeding with the action. For the
previous Navy Homeporting project, the Navy prepared a CCD for the Homeporting EIS and two
subsequent CCD’s for the beach replenishment EAs. The Coastal Commission concurred on all three
determinations.
2.0 Alternatives Considered
Regional Beach Sand Project EIR/EA Page 2-6999-69\SANDAG EIREA 3.4.wpd 7/17/00
At the state level, the Coastal Act requires each local jurisdiction along the coast to prepare and submit for
state certification a Local Coastal Program (LCP) for that portion of its area located within a specified
Coastal Zone. The LCP consists of two parts. The first is a Land Use Plan with goals and regulatory
policies, and the second is a set of Implementing Ordinances. Once the Coastal Commission certifies both
elements then the local jurisdiction is granted permitting authority. However, the State Coastal Commission
retains permitting authority over “sovereign lands” which are not within the purview of the LCP and for
submerged lands which are seaward of the mean high tide line. Therefore, the responsibility for issuing
coastal development permits for an action proposed by a non-federal entity is project-specific with regards
to sovereign lands and the mean high tide line. The location of the mean high tide line varies substantially
by season and due to prior beach replenishment actions. Generally, the history of harbor dredging and
beach replenishment at Oceanside and nearby beaches to the south, has resulted in a change in the historic
mean high tide line. Mapping from 1960 and 1972 identify a more landward mean high tide line in many
locations, typically located at the base of small bluffs or locations of shoreline protection such as rip-rap.
The California State Lands Commission will provide direction to the Coastal Commission and local
jurisdictions regarding this boundary for purposes of this project.
Because the intent of both the federal CCD and the state/local coastal development permit process is to R
ensure consistency with the California Coastal Act, where a project is jointly proposed by a federal and R
local entity, one concurrence by the Coastal Commission may satisfy both requirements. For purposes of R
this project, the state and local coastal development permits would be obtained for individual receiver sites R
depending on the status of the local permitting authority, and these would serve to satisfy the federal CCD R
requirement. R
In the case of Oceanside, which has been granted authority to issue local coastal development permits, the
proposed project is both seaward and landward of the mean high tide line so permits would be necessary
from both the local jurisdiction and the State Coastal Commission. Carlsbad also has been granted
authority to issue local coastal development permits landward of the mean high tide line. Subsequent to
issuance of the Draft EIR/EA, the historic mean high tide line was clarified by the State Lands Commission
at North Carlsbad. The North Carlsbad receiver site will be reconfigured as part of final design to extend
landward to the existing rip-rap. Because the entire project would be designed seaward of the historic R
mean high tide line, there would be no local permit authority. During final design, the configuration of the
North Carlsbad receiver site will be widened landward. This document evaluates the worst-case footprint
for purposes of full disclosure of visual impacts.

2.0 Alternatives Considered
Page 2-70 Regional Beach Sand Project EIR/EA99-69\SANDAG EIREA 3.4.wpd 7/17/00
The cities of Solana Beach and Del Mar do not have permitting authority granted by the Coastal
Commission. The cities of Encinitas and San Diego do have permitting authority for portions of their cities,
but not for the areas encompassed by the project. Therefore, the Coastal Commission would issue the
coastal development permit for the entire action within each receiver site in these four jurisdictions.
In the City of Imperial Beach, the project could be both seaward and landward of the mean high tide line.
The City has an approved LCP and would issue the local permit, but the Coastal Commission has granted
sovereign lands to the Port of San Diego in this location so the Port would issue a permit for that area
seaward of the mean high tide line (as necessary).
In some cases, Table 2-11 also indicates the need for issuance of noise variances. A variance would be
required, where the local noise ordinance is applicable, to operate seven days a week within a 24-hour
period. Such nighttime operations would be outside the limitations of the pertinent noise ordinance. More
discussion of this topic is provided in Section 2.4 (Detailed Description of Alternatives) and Sections 3.13
and 4.13 (Noise).
Table 2-11 also identifies two cities that have been granted sovereign land by the California State Lands
Commission (San Diego and Oceanside) who may issue authorization for utilization of those lands. This
is similar to the lease agreement issued by the California State Lands Commission for receiver sites in other
cities.

3.0 Affected Environment
Regional Beach Sand Project EIR/EA Page 3.1-199-69\SANDAG EIREA 3.4.wpd 7/17/00
CHAPTER 3.0
AFFECTED ENVIRONMENT
Chapter 3 sets forth the Affected Environment of the proposed action. The Affected Environment
describes the present conditions within the area of the proposed action. The project area is defined as the
coastal San Diego region, and is the area in which resources may be affected directly or indirectly by the
proposed action.
The receiver site footprints vary by alternative for the proposed action. For existing conditions, the
alternative whose receiver site boundaries are the longest is described. In Chapter 4, the impact analysis
addresses the receiver sites at a greater level of detail, where necessary, to fully address potential
environmental effects of an alternative.
This section of the EIR/EA describes the baseline conditions for each environmental resource against which
the potential impacts of the proposed action will be compared. Generally, the baseline utilized for the
analysis of environmental impacts under CEQA or NEPA reflects the conditions present at or about the
time the EIR/EA is initiated. For purposes of this EIR/EA, except where noted otherwise, the baseline year
is 1999. This is the year that the NOP was issued and the year that much of the offshore surveying and
modeling of sand deposits was performed. Some additional offshore surveying was completed in January,
February, and March 2000.
3.1 Geology and Soils
Page 3.1-2 Regional Beach Sand Project EIR/EA99-69\SANDAG EIREA 3.4.wpd 7/17/00
3.1 GEOLOGY AND SOILS
This section of the EIR/EA provides general information and a regional perspective on coastal geology,
beaches and shoreline configuration, tides and sea level changes, wave processes, littoral processes.
Existing geologic conditions were based on several reports and documents, including the San Diego
Regional Beach Sand Project Offshore Sand Investigations (Sea Surveyor 1999); Shoreline
Morphology Study, San Diego Regional Beach Sand Project (Moffatt & Nichol 2000a) which is
Appendix C; the two Environmental Assessments for beach replenishment (Department of the Navy 1997a,
1997b); and Beach Sand Transport and Sedimentation Report prepared by Frederic R. Harris, Inc.
(FRH 1997).
For purposes of this report, geology and soils include coastal geology and littoral processes of the receiver
sites, and the composition of the offshore borrow sites. Coastal geology and beach configuration are
determined primarily by wave forces acting on the geologic framework. These factors account for the
area’s rugged undersea and land topography, including the narrow continental shelf, the rocky substrate
under most beach areas, the thin layer of sediment, as well as coastal marine terraces, sea cliffs, and
lagoons.
The following subsections focus on the existing geologic conditions and littoral processes that make up the
individual receiver sites, and the composition of the proposed borrow sites. More information regarding
turbidity issues can be found in Sections 3.3 and 4.3 (Water Resources), while more detailed lagoon
information is found in Sections 3.2 and 4.2 (Coastal Wetlands).
3.1.1 Littoral Processes of the Three Littoral Cells
Oceanside Littoral Cell
The Oceanside Littoral Cell extends from Dana Point, in Orange County, south to the Scripps-La Jolla
Submarine Canyon system at La Jolla Shores, near the foot of Mount Soledad (refer to Figure 1-2). The
Oceanside Harbor complex is located approximately in the middle of this littoral cell. The harbor jetties
interrupt the natural flow of sand and to a large extent divide the cell into sub-cells north and south of
Oceanside Harbor. Receiver sites are located along the southern half of the Oceanside Littoral Cell.
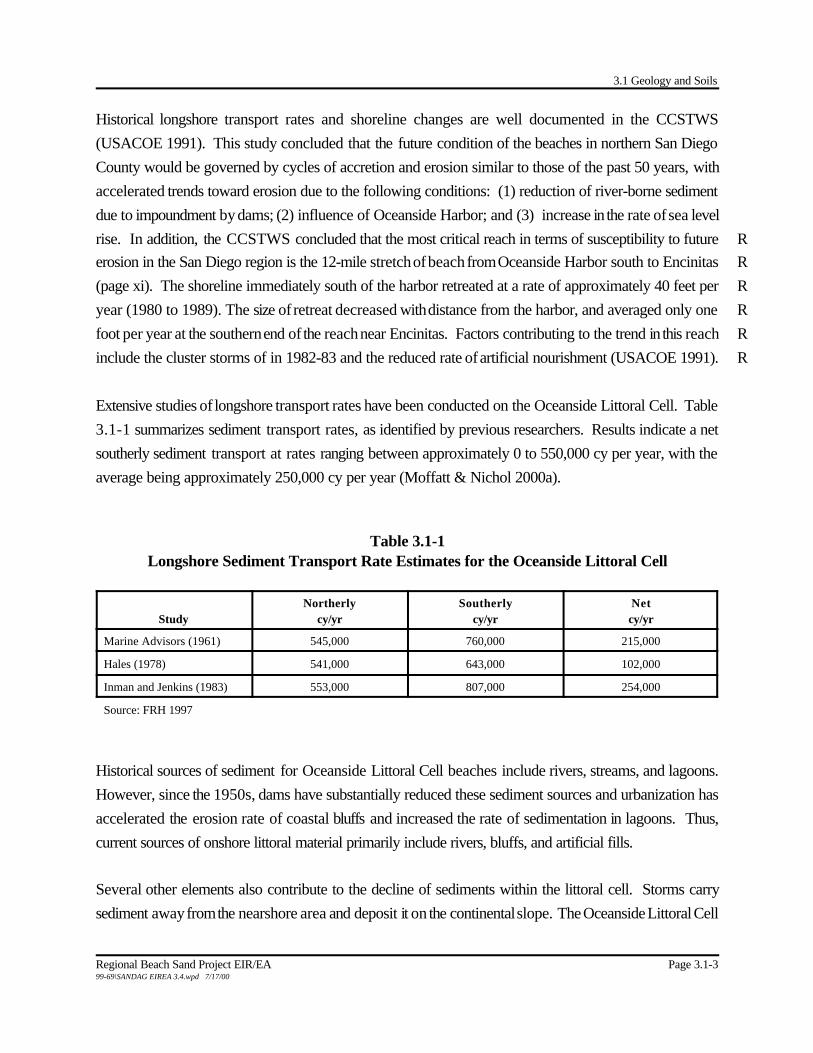
3.1 Geology and Soils
Regional Beach Sand Project EIR/EA Page 3.1-399-69\SANDAG EIREA 3.4.wpd 7/17/00
Historical longshore transport rates and shoreline changes are well documented in the CCSTWS
(USACOE 1991). This study concluded that the future condition of the beaches in northern San Diego
County would be governed by cycles of accretion and erosion similar to those of the past 50 years, with
accelerated trends toward erosion due to the following conditions: (1) reduction of river-borne sediment
due to impoundment by dams; (2) influence of Oceanside Harbor; and (3) increase in the rate of sea level
rise. In addition, the CCSTWS concluded that the most critical reach in terms of susceptibility to future R
erosion in the San Diego region is the 12-mile stretch of beach from Oceanside Harbor south to Encinitas R
(page xi). The shoreline immediately south of the harbor retreated at a rate of approximately 40 feet per R
year (1980 to 1989). The size of retreat decreased with distance from the harbor, and averaged only one R
foot per year at the southern end of the reach near Encinitas. Factors contributing to the trend in this reach R
include the cluster storms of in 1982-83 and the reduced rate of artificial nourishment (USACOE 1991). R
Extensive studies of longshore transport rates have been conducted on the Oceanside Littoral Cell. Table
3.1-1 summarizes sediment transport rates, as identified by previous researchers. Results indicate a net
southerly sediment transport at rates ranging between approximately 0 to 550,000 cy per year, with the
average being approximately 250,000 cy per year (Moffatt & Nichol 2000a).
Table 3.1-1Longshore Sediment Transport Rate Estimates for the Oceanside Littoral Cell
StudyNortherly
cy/yrSoutherly
cy/yrNetcy/yr
Marine Advisors (1961) 545,000 760,000 215,000
Hales (1978) 541,000 643,000 102,000
Inman and Jenkins (1983) 553,000 807,000 254,000
Source: FRH 1997
Historical sources of sediment for Oceanside Littoral Cell beaches include rivers, streams, and lagoons.
However, since the 1950s, dams have substantially reduced these sediment sources and urbanization has
accelerated the erosion rate of coastal bluffs and increased the rate of sedimentation in lagoons. Thus,
current sources of onshore littoral material primarily include rivers, bluffs, and artificial fills.
Several other elements also contribute to the decline of sediments within the littoral cell. Storms carry
sediment away from the nearshore area and deposit it on the continental slope. The Oceanside Littoral Cell

3.1 Geology and Soils
Page 3.1-4 Regional Beach Sand Project EIR/EA99-69\SANDAG EIREA 3.4.wpd 7/17/00
slope is steep; therefore, littoral material can be permanently lost from the littoral zone. Additionally, littoral
transport between Oceanside and La Jolla is affected by two submarine canyons located at Carlsbad and
La Jolla. La Jolla acts as a significant sediment sink for littoral material. As a result of a reduction in littoral
material sources, coupled with the loss of material from storms and a submarine canyon, a net reduction
in available natural sources of beach replenishment is occurring.
Mission Bay Littoral Cell
The Mission Bay Littoral Cell is a 16.5 mile-long coastal segment bounded on the north by Point La Jolla
and on the south by Point Loma, at the entrance to San Diego Bay (refer to Figure 1-2). The north and
south portions of this littoral cell are composed of high rocky bluffs containing pocket beaches of small areal
extent. The central four-mile-long part of this cell contains sandy beaches including Ocean Beach, Mission
Beach, and Pacific Beach. The coast between Mission Beach and Ocean Beach is divided by the jettied
entrance to Mission Bay and the San Diego River outlet.
Within the Mission Bay Littoral Cell, longshore shifts in sediment volume occur frequently in response to
changing wave conditions. Typically, northerly shifts of sediment are experienced during the winter, while
this pattern reverses in the summer. One study suggested that an annual net northerly sediment transport
rate of 20,000 cy exists along the Mission Bay Littoral Cell (Hales 1979); the USACOE estimates a net
longshore sediment transport between 20,000 to 90,000 cy per year to the south (USACOE 1991).
Silver Strand Littoral Cell
The Silver Strand Littoral Cell extends over a 17-mile long coastal reach from the headland at the south
end of the Playas de Tijuana, Mexico, to Zuniga Jetty located immediately east of the entrance to San
Diego Bay (refer to Figure 1-2). The primary physical features of this littoral cell include the coastal bluffs
of the Playa de Tijuana, the Tijuana River delta, and the broad sandy beaches of the Silver Strand. An
effective sediment sink in this littoral cell is a shoal located adjacent to Zuniga Jetty, where beach sand
transported to the north along the Silver Strand beaches becomes impounded in the lee of Point Loma.
Historical beach recession has occurred south of Coronado and at Imperial Beach.
Sand transport along the beach in this littoral cell is generally in a net northward direction. Net longshore
sediment transport is to the north from between 120,000 to 200,000 cy per year (Moffatt & Nichol
2000a).

3.1 Geology and Soils
Regional Beach Sand Project EIR/EA Page 3.1-599-69\SANDAG EIREA 3.4.wpd 7/17/00
3.1.2 Receiver Sites
Offshore of all receiver sites, a naturally-forming nearshore bar exists that typically receives sediment from
the exposed beach during the winter season. The length and width of the nearshore bar varies by season,
from effects of longshore current and sand transport, and by geography. Impacts to the nearshore bars as
a result of sand replenishment activities are discussed in Section 4.1.
For all receiver sites, seismic activity associated with the Rose Canyon fault and other nearby faults may
lead to liquefaction, ground failure, sand volcanoes, and seaward slumping of beach material. The Rose
Canyon fault is an active fault that roughly parallels the San Diego region coastline form north to south,
crisscrossing from the ocean to land near La Jolla.
South Oceanside
The South Oceanside receiver site was formed from sand and rocks that originated from upland erosion.
The receiver site consists of a relatively thin sand and cobble layer varying in width on a shallow, rock
platform. Unusually large waves can expose the rock layer by moving the sand offshore or down coast.
The receiver site is relatively wide although beach widths decrease south of Wisconsin Street as the wave
sheltering effect from Oceanside Harbor no longer plays a role. Beach widths south of Oceanside Harbor,
however, are presently narrower than they were historically due to the net decrease of river sand inputs and
the effect of the harbor which prevents transport of sand from north to south. The Oceanside receiver site
is located within the 12-mile stretch of beach defined in the CCSTWS as the most critical reach for future
erosion.
North Carlsbad
The North Carlsbad receiver site was formed from the same process as South Oceanside and has the same
geology with a thin layer of sand and cobble atop bedrock. South of Buena Vista Lagoon, the existing
receiver site is relatively narrow with an abundance of cobbles. The receiver site is backed by marine
terraces that reach a height of approximately 30 feet. Beach widths from Oceanside Harbor to La Jolla
are narrower than they were historically as a combined consequence of a net decrease of river sand inputs
and the trapping effect of the Oceanside Harbor on the littoral transport of sand from the north. This site
also lies within the 12-mile length of beach area with critical erosion problems per the CCSTWS.

3.1 Geology and Soils
Page 3.1-6 Regional Beach Sand Project EIR/EA99-69\SANDAG EIREA 3.4.wpd 7/17/00
South Carlsbad (North and South)
The South Carlsbad receiver sites are located on a low tide terrace, which lies in front of coastal cliffs
between Agua Hedionda and Batiquitos Lagoon. The steep coastal cliffs in this area have been continually
forming from wave action cutting against the marine terrace. This process has occurred since the last
relative still-stand of sea level, approximately 6,000 years ago (FRH 1997). The existing receiver site
comprises the flat, rocky, shallow part of the shoreline and is part of the critical erosion area defined by
CCSTWS.
Batiquitos
The Batiquitos receiver site is located on a low terrace, which lies in front of coastal cliffs south of
Batiquitos Lagoon. The steep coastal cliffs in this area have been continually forming due to wave action
cutting against the marine terrace. The existing receiver site comprises the flat, mixed sand and rock
shallow part of the shoreline visible during periods of low tide.
Batiquitos Lagoon was formed in the geologic past when the sea level was at a lower level, the shoreline
was located farther to the west, and existing streams quickly eroded the exposed marine terraces. This led
to the formation of steep canyons and as the sea level rose (approximately 18,000 years ago), sediments
quickly filled the lower reaches of the channels that created the lagoon. Batiquitos Lagoon is currently a
tidal lagoon due to an enhancement project completed in early 1997 that opened the inlet channel to tidal
flows.
The Batiquitos receiver site is located within the Oceanside Littoral Cell and is subject to similar transport
processes as those described for the South Oceanside receiver site. The receiver site is located within a
critical erosional area (USACOE 1991).
Leucadia
Similar to the Batiquitos receiver site, the Leucadia receiver site is located on a low terrace, which lies in
front of coastal cliffs that characterize Leucadia’s beaches. The steep coastal cliffs in this area have been
continually forming due to wave action cutting against the marine terrace. The existing receiver site
comprises the flat, rocky, shallow part of the shoreline visible during periods of low tide.
3.1 Geology and Soils
Regional Beach Sand Project EIR/EA Page 3.1-799-69\SANDAG EIREA 3.4.wpd 7/17/00
The Leucadia receiver site is located within the Oceanside Littoral Cell and is subject to similar transport
processes as those described for the South Oceanside receiver site. The Leucadia receiver site is located
within a critical erosional area (USACOE 1991).
Moonlight Beach
The Moonlight receiver site was formed from sand and rocks that originated from upland erosion. The
receiver site consists of a relatively thin sand layer, which varies in width and lies on a shallow rock
platform. The receiver site is relatively wide although beach widths decrease to the north and south, where
coastal bluffs line the coast.
The Moonlight receiver site is located within the Oceanside Littoral Cell and is subject to similar transport
processes as those described for the South Oceanside receiver site. The Moonlight receiver site is located
within a critical erosional area (USACOE 1991).
Cardiff
The Cardiff receiver site consists of a rocky (cobble) beach that lies on a shallow, wave cut platform. The
beach area has been stripped of most of its sand from large waves which typically occur during the winter
months.
The receiver site is located directly seaward of San Elijo Lagoon and south of the lagoon mouth. The
lagoon was formed during lower stands of sea level, when the shoreline was farther to the west and existing
streams quickly eroded the exposed marine terraces. This formed steep canyons, and as the sea level rose
(approximately 18,000 years ago), sediments quickly filled the lower reaches of the channels and created
the lagoon (FRH 1997). San Elijo is still currently a tidal lagoon because the channels are not completely
full of sediments.
The Cardiff receiver site is within the Oceanside Littoral Cell and is subject to similar transport processes
as described for South Oceanside. However, the Cardiff receiver site is not located within the critical
erosional area south of Oceanside Harbor (as identified by the CCSTWS).
3.1 Geology and Soils
Page 3.1-8 Regional Beach Sand Project EIR/EA99-69\SANDAG EIREA 3.4.wpd 7/17/00
Solana Beach
The Solana Beach receiver site consists of a low tide terrace, which lies in front of coastal cliffs south of
San Elijo Lagoon. The steep coastal cliffs in this area have been continually forming from wave action
cutting against the marine terrace. This process has occurred since the last relative still-stand of sea level,
approximately 6,000 years ago (FRH 1997). The existing receiver site comprises the flat, rocky, shallow
part of the shoreline visible during low tide.
The Solana Beach receiver site is within the Oceanside Littoral Cell and is subject to similar transport
processes as described for South Oceanside. However, this receiver site is not located within the critical
erosional area south of Oceanside Harbor (as identified by the CCSTWS).
Del Mar
The Del Mar receiver site is located within the Oceanside Littoral Cell and is subject to similar transport
processes as those described for the South Oceanside receiver site. The Del Mar receiver site was formed
from sand and rocks that originated from upland erosion. The receiver site consists of a relatively thin sand
layer, which varies in width and lies on rock platform. The receiver site is relatively wide compared to
other receiver sites.
Similar to Batiquitos Lagoon, the San Dieguito Lagoon was formed in the geologic past when the sea level
was lower, the shoreline was farther to the west, and existing streams quickly eroded the exposed marine
terraces. San Dieguito Lagoon is a functioning tidal lagoon.
Torrey Pines
The Torrey Pines receiver site is located on a low tide terrace, which lies in front of coastal cliffs to the
north and south of Los Peñasquitos Lagoon. The steep coastal cliffs in this area have been continually
forming from wave action cutting against the marine terrace. The existing receiver site comprises the flat,
rocky, shallow part of the shoreline visible during low tide.
Similar to other lagoons in the region, Los Peñasquitos Lagoon was formed in the geologic past when the
sea level was lower, the shoreline was farther to the west, and existing streams quickly eroded the exposed
3.1 Geology and Soils
Regional Beach Sand Project EIR/EA Page 3.1-999-69\SANDAG EIREA 3.4.wpd 7/17/00
marine terraces. Los Peñasquitos Lagoon is an intermittent tidal lagoon due to occasional lagoon closures
from sediment accretion at the channel inlet.
The Torrey Pines receiver site is situated within the Oceanside Littoral Cell and is subject to similar
transport processes as described for South Oceanside. According to the CCSTWS, the Torrey Pines
receiver site is not located within a critical erosional area.
Mission Beach
The Mission Beach receiver site is located on a low tide terrace. The existing receiver site comprises the
flat, shallow part of the shoreline visible during high and low tides. The receiver site was once a
depositional area of the ancestral San Diego River. The Mission Beach receiver site is situated within the
Mission Beach Littoral Cell.
Imperial Beach
The Imperial Beach receiver site is located on a low tide terrace. The existing receiver site comprises the
flat, shallow part of the shoreline visible during high and low tides. The receiver site is a depositional area
of sediment from the Tijuana River. The Imperial Beach receiver site is located within the Silver Strand
Littoral Cell.
3.1.2 Borrow Sites
Marine geophysical surveys and vibracore investigations were conducted along the San Diego coastline
to map the horizontal and vertical extent, and compute the volume, of beach-quality sand at numerous
possible borrow sites. The marine geophysical surveys included the use of side-scan sonar to produce
maps that show the type and extent of the surface (e.g., silt, sand, gravel, cobble) and natural (e.g., bedrock
exposures) or cultural features (e.g., boats, pipelines) on the seafloor. Sediment layers were mapped at 10
feet and 30 feet below the seabed. The borrow sites were defined originally in large rectangles for
purposes of investigation. Over time, dredge areas have been defined within the original rectangle. The
description below pertains to the original site so the dredge area shown in Figures 2-15 through 2-20
represent a smaller subset of the described area.

3.1 Geology and Soils
Page 3.1-10 Regional Beach Sand Project EIR/EA99-69\SANDAG EIREA 3.4.wpd 7/17/00
Sediment core samples were taken at 125 locations in January 1999. Subsamples from the sediment cores
were later studied in a laboratory to determine grain-size and chemical make-up for evaluating compatibility
between borrow site material and sand at the receiver sites.
Tables 2-3 and 2-5 shows various construction characteristics of the borrow sites. The discussion below
includes additional information about the dredge sites regarding geology and soils, including the volume and
thickness of silt overburden and the thickness of the sand layer.
SO-9
Site SO-9 is located north of Oceanside Harbor and offshore of the Santa Margarita River. The original
area of investigation was over 340 acres, and the project dredge area had a surface area of 63 acres in 45
to 50 feet of water. This dredge area has been reduced in the Final EIR/EA by approximately 25 percent R
to provide a greater buffer from previously unmapped artificial reefs. CDFG review of the side-scan sonar R
imaging at SO-9 revealed that some targets of unknown origin were remnants of an artificial reef experiment R
that had been mismapped after placement. The artificial reef had not been included in published sources R
because it had not been re-located. R
At the SO-9 borrow site, three layers of sediments were found. The top (surficial) layer consists of sandy
silt. The grain-size analyses showed this surficial layer to be approximately 0 to 2 feet deep over the dredge
site, and unsuitable for beach nourishment material. Beneath the surficial silt is a layer of fine- to medium-
grained sand that is suitable for beach replenishment. This sand layer is 2 to 13 feet thick, and is exposed
on the seafloor surface along the central region of the site. A third layer, consisting of fine-grained silty
sand, was found under the sand layer. The grain-size analyses showed this layer to be unsuitable for beach
nourishment material.
SO-7
Site SO-7 is located offshore of Batiquitos Lagoon. The area of investigation covered an area of
approximately 280 acres but the project dredge area would be approximately 70 acres in 60 to 85 feet of
water. If SO-7 is expanded and SO-9 and/or SO-6 are eliminated, then the dredge area would increase R
up to 150 acres with 1.5 million cy of material removed. Most of the site is predominantly well-sorted R
medium- to coarse-grained sand with occasional pebbles and shell fragments. This material is ideal for
3.1 Geology and Soils
Regional Beach Sand Project EIR/EA Page 3.1-1199-69\SANDAG EIREA 3.4.wpd 7/17/00
beach nourishment, and the layer is thick enough (1 to 11 feet) for efficient and economical dredging.
There is no silt overburden at this borrow site.
SO-6
Site SO-6 is located offshore of San Elijo Lagoon. The project dredge area covers approximately 29
acres in 60 to 80 feet of water of the approximately 225 acres investigated. The results of the grain-size
analysis indicate that most, if not all, of the sediment within SO-6 is acceptable for beach replenishment
purposes. A single, wedge-shaped layer of fine-grained sand with a low content of silt overlies shale
bedrock within the site. This wedge of material measures less than 5 feet thick along the nearshore
boundary and uniformly increases toward the offshore boundary to a maximum of 14 feet in thickness.
There is no silt overburden at this borrow site.
SO-5
Site SO-5 is located offshore of San Dieguito Lagoon. The area investigated was about 225 acres and the
proposed project dredge area has a surface area of approximately 127 acres. The dredge area would be
located between 50 and 80 feet of water. A majority of the site contains suitable sand for beach
nourishment. The thickness of the sand layer is 1 to 22 feet. The predominant sediment within Site SO-5
is gray to olive-gray fine-grained sand with 3 percent silt content. The site contains a single, homogenous,
wedge-shaped layer of fine-grained sand. There is no silt overburden at this borrow site.
MB-1
Site MB-1 is located offshore of Mission Beach and north of the San Diego River. The area investigated
was over 500 acres, but the proposed project dredge area covers approximately 19 acres at 65 to 75 feet
of water. The majority of the site contains fine- to coarse-grained that is suitable for beach replenishment.
The site contains a very thick layer of medium- to coarse-grained sand covering the entire area and varying
in thickness from 15 to 45 feet. There is no silt overburden at this borrow site. Of all the proposed borrow
sites, this site contains the largest overall volume of suitable sand for beach replenishment.

3.1 Geology and Soils
Page 3.1-12 Regional Beach Sand Project EIR/EA99-69\SANDAG EIREA 3.4.wpd 7/17/00
SS-1
This proposed dredge area is located offshore of Imperial Beach near the Mexican border in 40 to 50 feet
of water, and covers approximately 22 acres. The site originally investigated was over 650 acres in size.
This site is located within the Silver Strand Littoral Cell. Sand was found that is medium- to coarse-grained
and brownish-gray to light-gray in color, and is suitable for beach nourishment.

3.2 Coastal Wetlands
Regional Beach Sand Project EIR/EA Page 3.2-199-69\SANDAG EIREA 3.4.wpd 7/17/00
3.2 COASTAL WETLANDS
Coastal wetlands discussed in this section include creeks, rivers, or lagoons that discharge into the ocean
near the proposed receiver sites. Coastal wetland areas identified in the vicinity of the proposed receiver
sites include San Luis Rey River, Loma Alta Creek, Buena Vista Lagoon, Agua Hedionda Lagoon,
Batiquitos Lagoon, San Elijo Lagoon, San Dieguito Lagoon, Los Peñasquitos Lagoon, Mission Bay, and
Tijuana Estuary. The characteristics below are summarized from the biological resources technical report,
Appendix D.
San Luis Rey River
The San Luis Rey River has a watershed area of 560 square miles and is located below Henshaw Dam.
It has been estimated that construction of the dam has reduced the average sediment yield of the river by
approximately 32 percent. The San Luis Rey River has historically received discharges of treated
wastewater. The ocean inlet at this location is open intermittently due to the presence of a sand barrier and
low fresh water flows. Currently the entire wetland excluding the river corridor covers 294 acres. Riparian
habitat is the dominant habitat type followed by estuarine open water. Endangered California brown
pelicans and California least terns feed and roost along the river. Riparian areas upstream support the
endangered least Bell’s vireo.
Loma Alta Creek
The Loma Alta Creek is a seasonal freshwater creek that discharges into the ocean near Buccaneer Beach
Park. The creek flows under Pacific Street through a cement culvert, and the creek is industrialized inland.
There is no lagoon associated with the creek. The outlet area crosses a small steep sand beach that is
defined by rip-rap on both sides. A small freshwater marsh is located east of the outlet area. During the
dry season, the creek outlet to the ocean is closed by a sand berm.
Buena Vista Lagoon
Buena Vista Lagoon is a State Ecological Reserve managed by the CDFG. Historically, it was a tidal
lagoon; however, since 1940 the inlet has been closed by a man-made weir (a dam used to raise the
lagoon’s water level and control flow at the mouth). The entire lagoon consists of 246 acres with the
primary habitats being fresh/brackish water and marsh, although there is a small remnant coastal saltmarsh.

3.2 Coastal Wetlands
Page 3.2-2 Regional Beach Sand Project EIR/EA99-69\SANDAG EIREA 3.4.wpd 7/17/00
The lagoon has historically received discharges of secondary treated wastewater and presently continues
to experience sewage spills. The accumulated sludge, plant detritus, excess nutrients, and contained basin
combine to cause eutrophic conditions. Nonetheless, a diverse assemblage of sensitive bird species forage
or nest in the vicinity of this lagoon. The lagoon is a migratory bird stopover point and general habitat for
herons, egrets, dabbling and diving ducks. The lagoon supports endangered species such as the light-
footed clapper rail, California brown pelican, California least tern, and occasionally Belding’s savannah
sparrows. Cattail marsh habitat along the lagoon has been utilized for nesting by light-footed clapper rails R
(Rallus longirostris levipes). It has been proposed by the USFWS as critical habitat for the tidewater R
goby (Eucyclogobius newberryi), a small fish. R
Agua Hedionda Lagoon
The ocean inlet to Agua Hedionda Lagoon is located south of the proposed North Carlsbad receiver site
and north of the proposed South Carlsbad (north and south) receiver sites. Aqua Hedionda has been a
tidal lagoon since 1954 when San Diego Gas and Electric completed a large-scale dredging project to
provide a deep water basin and cooling water for the Encina Power Plant. As a result, the lagoon exhibits
a diverse community of benthic invertebrates and fish. The lagoon serves as a nursery area for marine fish R
and has also been proposed as critical habitat for the tidewater goby. The outer lagoon supports R
commercial shellfishing aquaculture, recreational boating and skiing, a marina, and a marine fish hatchery.
Two pair of jetties maintain tidal flow and power plant circulation; the northern jetties serve as an ocean
inlet to the lagoon and the southern jetties serve as the warm water discharge from the power plant.
The lagoon is approximately 400 acres in size and consists primarily of open water habitat. A coastal
saltmarsh occurs at the eastern end of the inner lagoon and supports endangered Belding’s savannah
sparrow. Endangered California brown pelican feed and roost at the lagoon, and California least tern
forage there as well. Cattail marsh habitat has been utilized by light-footed clapper rails for nesting. R
Eelgrass occurs along the shoreline throughout the lagoon. The entrance to the lagoon undergoes R
maintenance dredging annually or biannually and dredge materials are used to replenish beaches north,
between, and south of the inlet and discharge jetties.
Batiquitos Lagoon
Batiquitos Lagoon inlet is located north of the proposed Batiquitos receiver site. The lagoon is managed
as a State Ecological Reserve by the CDFG. A major wetlands enhancement project that involved

3.2 Coastal Wetlands
Regional Beach Sand Project EIR/EA Page 3.2-399-69\SANDAG EIREA 3.4.wpd 7/17/00
dredging the entire lagoon was completed in January 1997, which allowed sustained tidal flushing of the
lagoon. Prior to the enhancement project, the lagoon consisted of 550 acres of shallow wetland, which
included estuarine open water, southern coastal salt marsh, and tidal estuarine flats. The lagoon area
supported a number of nesting migratory birds, including the California least terns and western snowy
plovers. The lagoon had been subject to frequent inlet closures due to the buildup of a sand and cobble
berm. The lagoon closures led to a substantial accumulation of organics and fine anaerobic sediments,
persistent eutrophic conditions (i.e., enriched in dissolved nutrients that stimulate the growth of aquatic plant
life resulting in the depletion of dissolved oxygen), development of algal mats, and wide swings in salinity.
Since the completion of the enhancement project, habitat throughout the lagoon has been altered. The
primary habitat is estuarine open water followed by coastal salt marsh. Nesting islands support endangered R
California least terns and threatened western snowy plover. The lagoon also functions as habitat for marine R
and estuarine species of invertebrates and fish. R
The new ocean inlet to the lagoon is protected by two jetties that enable sustained tidal flushing. Due to
the dynamics of the lagoon, the west and central basins are expected to naturally accumulate beach sand
and will require routine maintenance dredging similar to that conducted at Aqua Hedionda Lagoon every
two years.
San Elijo Lagoon
The inlet to San Elijo Lagoon is located north of the proposed Cardiff receiver site. San Elijo Lagoon is
comprised of approximately 900 acres and includes the 590-acre San Elijo Ecological Reserve, which is
managed by the CDFG and the San Diego County Department of Parks and Recreation. It is rarely open
to tidal flushing due to its relatively small tidal prism and frequent blockage by a substantial volume of
cobbles. Experimental excavation of the inlet area and high stormwater runoff events have resulted in
periodic opening of the lagoon to tidal flushing for short durations spanning a couple to several months.
Most of the habitat consists of brackish/freshwater marsh, nontidal flats, and open water. San Elijo Lagoon
is one of the highest ranked waterfowl habitats among the coastal lagoons in San Diego County because
of its diverse habitat and shallow brackish water. Both the endangered Belding’s savannah sparrow and
California least tern nest at the lagoon. California brown pelicans use the open water to rest and feed.
3.2 Coastal Wetlands
Page 3.2-4 Regional Beach Sand Project EIR/EA99-69\SANDAG EIREA 3.4.wpd 7/17/00
San Dieguito Lagoon
The inlet to San Dieguito Lagoon is located north of the proposed Del Mar receiver site and south of the
Solana Beach receiver site. The lagoon includes a lengthy river channel, which serves as the main body
of the lagoon, along with a channel tributary. Historically, the lagoon was a 604-acre salt marsh. It was
filled in 1935 to create the Del Mar fairgrounds and racetrack. Today, San Dieguito Lagoon is primarily
a river channel with dominant seasonal fluvial flows. The lagoon is part of the San Dieguito River Park
System. The lagoon is the location of a restoration project being planned by Southern California Edison.
Presently, the lagoon inlet is intermittently open. The 22nd Agricultural District periodically uses a bulldozer
to open the inlet to tidal flushing. The lagoon spans 520 acres with about half that consisting of disturbed
and agricultural habitat. Wetland habitat comprises 267 acres. The lagoon provides foraging and nesting
habitat for endangered Belding’s savannah sparrows and western snowy plover, and California least tern
forage within the vicinity.
Los Peñasquitos Lagoon
The ocean inlet to Los Peñasquitos Lagoon is located north of the proposed Torrey Pines receiver site and
south of the proposed Del Mar receiver site. The Los Peñasquitos Lagoon Foundation has had success
with keeping the inlet open, although extensive cobble in the vicinity of the entrance complicates
maintenance and accelerates inlet closure processes. The primary habitat type is coastal salt marsh, which
at 271 acres, is one of the largest in San Diego County. The lagoon also has over 100 acres of riparian
habitat. The endangered Belding’s savannah sparrow use the salt marsh habitat for nesting and foraging.
Western snowy plover nest in the vicinity and California least tern forage within the lagoon.
Mission Bay
The 2,470-acre Mission Bay complex, which includes Kendall-Frost Preserve, Famosa Slough, and the
San Diego River Channel, is the second largest embayment in San Diego County. The ocean inlet is south
of the proposed Mission Beach receiver site. Marine open water is the dominant habitat (1,916 acres)
within the bay. Eelgrass beds and mudflats are found throughout the bay, and there are about 125 acres
of coastal salt marsh. Coastal brackish/freshwater marsh and riparian habitats occur along the San Diego
River. Endangered Belding’s savannah sparrow and light-footed clapper rail nest and forage in the
Kendall-Frost Preserve. California least terns nest on islands and forage throughout the bay.

3.2 Coastal Wetlands
Regional Beach Sand Project EIR/EA Page 3.2-599-69\SANDAG EIREA 3.4.wpd 7/17/00
Tijuana Estuary
The Tijuana Estuary is just southeast of the proposed Imperial Beach receiver site. The 2,119-acre Tijuana
Estuary includes open water, marsh, dune, coastal scrub and chaparral, riparian, tidal and nontidal estuarine
flats, and ruderal and disturbed habitats. It has one of the few remaining dune habitats in San Diego
County. The dune habitat occurs just south of the proposed receiver site and separates the coastal
shoreline from the wetland habitat. Normally the estuary is open to tidal flushing. Tijuana Estuary is unique
in that it is entirely in California, but three-fourths of its watershed are in Mexico. The estuary is part of the
Pacific Flyway, and supports the most diverse assemblage of birds found within this region. The
endangered Belding’s savannah sparrow, California least tern, light-footed clapper rail, and western snowy
plover nest and forage within the wetland.
3.3 Water Resources
Regional Beach Sand Project EIR/EA Page 3.3-199-69\SANDAG EIREA 3.4.wpd 7/17/00
3.3 WATER RESOURCES
Water resources analyzed in this study include physical processes and chemical properties. Physical
processes include tides and water levels, currents, wave exposure, and littoral processes. Chemical
properties are characterized by temperature, salinity, dissolved oxygen, and water visibility (turbidity).
The following is a discussion of the factors that contribute to the quality of existing water resources at the
proposed borrow sites and receiver beaches. Data is summarized from the previous Navy documentation
(1997a, 1997b) and the biological resources technical report which is provided as Appendix D (refer to R
Section 3.1.5 and Table 5 of that Appendix). The survey methods and literature/data review for water R
quality are described in Section 3.4.1. R
3.3.1 Physical Processes
The general oceanic circulation off the coast of California is dominated by the long-term mean southward
flow associated with the California Current. In southern California, the current divides into a southward
extension and a recirculating flow toward the coast. The recirculation forms a counterclockwise eddy that
is present most of the year. An inshore countercurrent (Davidson Current) moves north from Baja
California and is detected along the southern California coastline from October to April.
Currents move large amounts of water with varying levels of temperature, salinity, dissolved oxygen, and
nutrients in and out of the study area. These water masses vary in strength and are influenced by weather
patterns and seasonal variations. In addition, nearshore currents vary along the coast in response to
coastline orientation, bottom topography, and tides. Kelp forests may slow ocean currents to one-third of
the normal rate.
Waves (swell) also exert a significant influence upon the water column and nearshore bottom habitats. In
shallow water, the circular motion within the water column can induce the resuspension and transport of
bottom sediments. Wave height and high-velocity swell tend to be most prominent during winter and spring
due to storms from the North Pacific.
All of southern California has a mixed semidiurnal (daily) tide with two high tides and two low tides, each
of different magnitude, every 24 hours and 50 minutes. The range between mean high and low water is
approximately 3.7 feet and the diurnal range is approximately 5.4 feet.

3.3 Water Resources
Page 3.3-2 Regional Beach Sand Project EIR/EA99-69\SANDAG EIREA 3.4.wpd 7/17/00
Local currents in nearshore waters are complex and include longshore currents, which flow parallel to the
shore, and cross-shore and rip currents, which move in an onshore-offshore direction. The combination
of these currents makes up the littoral transport process. Longshore currents in the coastal zone and driven
primarily by waves striking the shoreline at oblique angles. Overall, longshore currents produce drift and
sediment transport (turbidity) from north to south. Wave exposure affects the receiver beaches from the
south and west. For further discussion of littoral transport processes affecting the proposed receiver sites,
refer to Section 3.1.
Seasonal fluctuations in wave patterns and currents also cause substantial changes in water quality,
especially turbidity. Warming by the sun is the primary factor that affects surface water temperatures in
southern California from June to October.
Seasonal upwelling and downwelling also affect water quality within the area. Upwelling occurs when
northern winds displace surface waters offshore, resulting in replacement by colder, deeper waters. These
colder waters have lower dissolved oxygen, but they have higher salinity and, most importantly, are richer
in nutrients. Upwelling is generally present from late March though July in the San Diego County area.
Downwelling occurs when southern winds push offshore waters towards the shore, thus, pushing nearshore
surface waters down and causing warmer waters and lower salinity than is typical for deeper waters.
3.3.2 Chemical Properties
The similarities and differences in chemical properties expected at the borrow sites and offshore the
receiver sites are described below. The initial focus is factors associated with the water, specifically
temperature, salinity, dissolved oxygen and pH. This is followed by sediment characteristics.
Temperature
In areas near the borrow sites, seasonal thermoclines stratify the water column. Waters typically are
stratified during the summer and early fall, unstratified during the winter, and transitional (e.g., stratification
weakening or increasing) in late fall and spring. Thermoclines represent barriers to mixing between surface
and bottom waters. Surface water temperatures generally are highest from June through September and
lowest from November through February. Temperatures near the bottom generally are higher from
October through January and lower from April through June. Historical temperatures in the study area
range from 52 to 74º F near the surface and from 49 to 61º F near the bottom.
3.3 Water Resources
Regional Beach Sand Project EIR/EA Page 3.3-399-69\SANDAG EIREA 3.4.wpd 7/17/00
Water temperatures near the receiver sites tend to be more uniform throughout the water column due to
turbulent mixing and shallower depths. Nearshore locations are shallower and have slightly higher
temperatures in the range of 57 to 75 °F.
Salinity
Historical salinity levels are fairly uniform ranging from approximately 32 to 34 parts per thousand (ppt)
throughout the study area. Salinity levels tend to be homogenous throughout the water column with
differences typically less than 1 ppt from surface (near receiver sites) to bottom waters (borrow sites). The
exception is during winter storms when freshwater runoff reduces surface water salinity, especially at
nearshore locations. Salinity levels in both surface and bottom waters may be slightly higher from April to
August due to upwelling of more dense bottom waters.
Dissolved Oxygen
Historical dissolved oxygen values range from 5.0 to 11.6 mg/L throughout the study area. Surface water
dissolved oxygen at proposed borrow sites SO-5 and SO-7 were 8.3 mg/L and 7.8 mg/L, respectively,
during the June 1999 survey. Bottom water dissolved oxygen at both sites was 8.6 mg/L. Surface and
nearshore waters generally have higher concentrations of dissolved oxygen due to continuous wave action
and atmospheric mixing. A dissolved oxygen level equal to or greater than 5 milligrams per liter (mg/l) has
been recommended as a generalized standard of acceptable water quality for aquatic life. Dissolved
oxygen concentrations are routinely measured off the coast of Encinitas. Average recorded dissolved
oxygen levels at that location are 6 to 10 mg/l.
pH
Historical pH values range from 7.7 to 8.4 throughout the study area. Slightly higher pH values occur
during May through September when water temperatures are warmer. Little variance occurs from surface
to bottom waters.
3.3.3 Turbidity
Turbidity is a result of particles suspended in the water column. Turbidity may result from natural causes,
e.g., plankton concentrations, as well as from sediment particles suspended by waves, river discharge
3.3 Water Resources
Page 3.3-4 Regional Beach Sand Project EIR/EA99-69\SANDAG EIREA 3.4.wpd 7/17/00
and/or dredging activities. Increases in turbidity can affect light levels in the water which can reduce
photosynthesis and plant growth. Additional effects of turbidity may result in impaired feeding and
respiration of fish and invertebrates.
Suspended silt particles in the water column will increase turbidity; however, larger sand particles (greater
than 63 microns [µm]) will settle out rapidly and do not cause a significant increase in turbidity. Sampling
of the water near the receiver beaches indicates that nearshore water visibility typically ranges between 5
and 20 feet; however, visibility is significantly reduced in the surf zone due to sediment disturbance from
wave action and rip currents. Sediment testing has shown that the average percentage of fines in the
Oceanside Littoral Cell native sediments is approximately three percent above mean sea level (MSL) and
12 percent below MSL. The higher percentage of fines below MSL is attributed to the fact that finer
grained materials reside at equilibrium below the shorebase. Generally, intertidal waters of the receiver
beaches are characteristically turbid due to the high energy activity in the nearshore environment.
Water clarity for light (transmissivity) tends to increase with distance from shore. Transmissivity levels
typically range from 40 to 90 percent at depths of the borrow sites in the study area. In the June 1999
survey of proposed borrow sites SO-5 and SO-7, surface water transmissivity ranged from 83.9 percent
to 84.3 percent and bottom water transmissivity ranged from 64 percent to 69.6 percent.
Turbidity concentrations may be substantially elevated in coastal lagoons due to shallow depths, river
discharges, storm runoff, and/or algal blooms. Suspended particle concentrations of 100 mg/l were
recorded just inside Batiquitos Lagoon at the same time concentrations of 20 mg/l were recorded in the
adjacent nearshore during a non-storm period.
Sediment Characteristics
Trace metal and organic contaminants discharged into coastal waters can settle to the bottom. Finer
sediments (silts and clays) generally have higher contaminant concentrations than coarser sediments (sands).
Contaminants may be remobilized through strong currents, storms, or mechanical disturbance such as
dredging. Thus, grain size characteristics and sediment contaminant concentrations at the borrow sites are
important to the evaluation of the potential for contaminant release and turbidity during dredging.
Most borrow sites are located miles from wastewater outfall point source discharges and several thousand
feet from non-point source river discharges, which represent the major sources of contaminate input to the
3.3 Water Resources
Regional Beach Sand Project EIR/EA Page 3.3-599-69\SANDAG EIREA 3.4.wpd 7/17/00
study area. Borrow site SO-6 is the closest to an outfall point and is approximately 350 feet north of the
San Elijo Wastewater outfall pipeline and greater than 4,000 feet from the outfall discharge area. The
entrance to San Elijo Lagoon is approximately 4,500 feet from the dredge area. Proposed borrow sites
SO-9 and MB-1 are located over three miles upcoast and inshore of wastewater outfalls and a mile or
more from rivers or bays. Proposed borrow sites SO-7 and SO-5 are located more than two miles
downcoast and inshore of wastewater outfalls, and 3,000 and 4,500 feet offshore lagoons, respectively.
Borrow site SS-1 is located approximately 2,250 feet north of the City of San Diego outfall.
As stated in Section 3.1, sampling has been performed to determine grain-size compatibility between the
borrow sites and receiver sites. All material proposed to be placed would be compatible in terms of grain-
size. A detailed comparison of the chemical characteristics of the borrow sites and receiver sites is
provided in Table 3.3-1.
Borrow Sites
Proposed borrow site sediments range from very fine- to coarse-grained sand. Contaminant concentrations
of metals (arsenic, cadmium, chromium, copper, lead, mercury, nickel, selenium, silver, and zinc),
pesticides, polychlorinated biphenyls (PCBs), polycyclic aromatic hydrocarbons (PAHs), and phenols were
non-detectable to low at all borrow sites. Percent solids ranged from 79.2 to 86.6 percent, total sulfides
were 0.2 to 1.1 mg/kg, and total organic carbon concentrations ranged from 0.02 to 0.22 percent.
While no regulatory criteria exist for the protection of aquatic life from exposure to potentially contaminated
sediments, the National Oceanographic and Atmospheric Administration (NOAA) publishes effects-based
sediment quality values for evaluating the potential for constituents in sediment to cause adverse biological
effects. These values are referred to as Effects Range-Low (ER-L) and Effects Range-Median (ER-M).
The ER-L concentrations indicate the low end of the range of concentrations at which adverse biological
effects are observed or predicted. The ER-M values are concentrations at which effects were observed
or predicted in 50 percent of the test organisms evaluated. The ER-L and ER-M concentrations are not
accepted standards or criteria, but provide effects based guidelines. Contaminant concentrations in the
sediment at each borrow site were compared to ER-L and ER-M values for metals and organics. None
of the sediment materials exceeded the NOAA values.
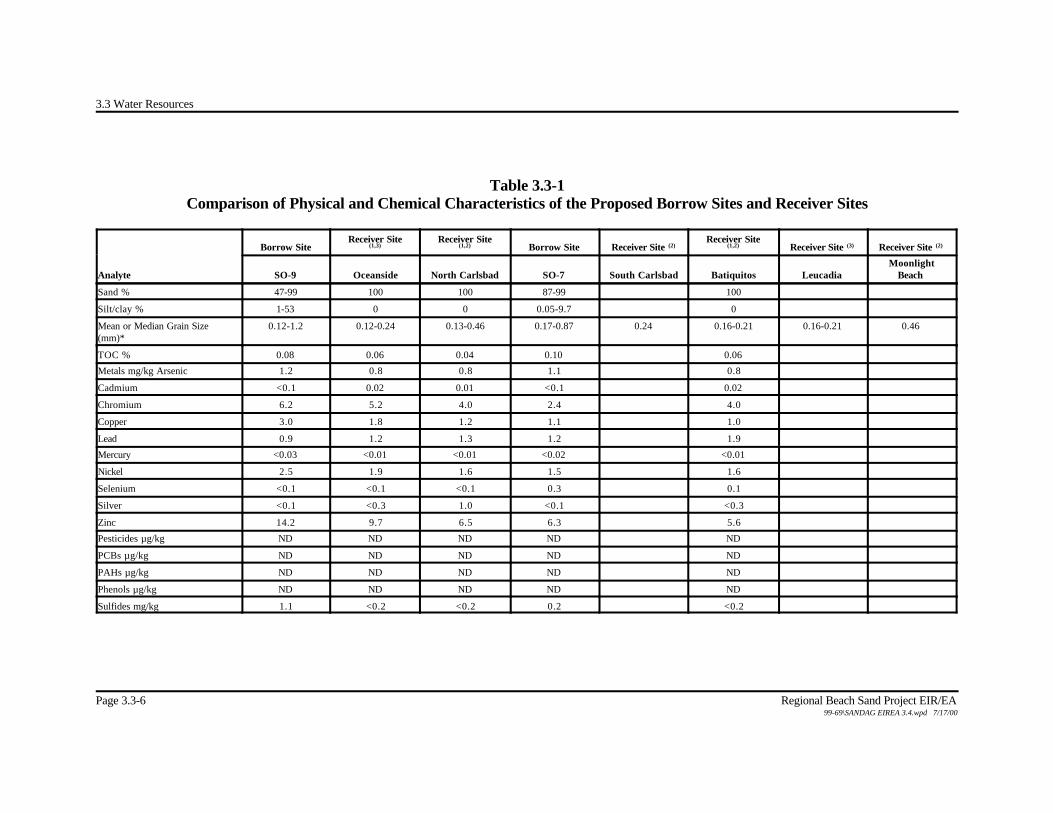
3.3 Water Resources
Page 3.3-6 Regional Beach Sand Project EIR/EA99-69\SANDAG EIREA 3.4.wpd 7/17/00
Table 3.3-1Comparison of Physical and Chemical Characteristics of the Proposed Borrow Sites and Receiver Sites
Analyte
Borrow SiteReceiver Site
(1,3)Receiver Site
(1,2) Borrow Site Receiver Site (2)Receiver Site
(1,2) Receiver Site (3) Receiver Site (2)
SO-9 Oceanside North Carlsbad SO-7 South Carlsbad Batiquitos LeucadiaMoonlight
Beach
Sand % 47-99 100 100 87-99 100
Silt/clay % 1-53 0 0 0.05-9.7 0
Mean or Median Grain Size(mm)*
0.12-1.2 0.12-0.24 0.13-0.46 0.17-0.87 0.24 0.16-0.21 0.16-0.21 0.46
TOC % 0.08 0.06 0.04 0.10 0.06
Metals mg/kg Arsenic 1.2 0.8 0.8 1.1 0.8
Cadmium <0.1 0.02 0.01 <0.1 0.02
Chromium 6.2 5.2 4.0 2.4 4.0
Copper 3.0 1.8 1.2 1.1 1.0
Lead 0.9 1.2 1.3 1.2 1.9
Mercury <0.03 <0.01 <0.01 <0.02 <0.01
Nickel 2.5 1.9 1.6 1.5 1.6
Selenium <0.1 <0.1 <0.1 0.3 0.1
Silver <0.1 <0.3 1.0 <0.1 <0.3
Zinc 14.2 9.7 6.5 6.3 5.6
Pesticides µg/kg ND ND ND ND ND
PCBs µg/kg ND ND ND ND ND
PAHs µg/kg ND ND ND ND ND
Phenols µg/kg ND ND ND ND ND
Sulfides mg/kg 1.1 <0.2 <0.2 0.2 <0.2

3.3 Water Resources
Regional Beach Sand Project EIR/EA Page 3.3-799-69\SANDAG EIREA 3.4.wpd 7/17/00
Table 3.3-1. Continued
Analyte
BorrowSite
ReceiverSite (2)
BorrowSite
ReceiverSite (2)
ReceiverSite (1,3)
ReceiverSite (1,3)
BorrowSite
ReceiverSite (1,2)
BorrowSite
ReceiverSite (1,3)
SO-6 Cardiff SO-5SolanaBeach Del Mar Torrey Pines MB-1
MissionBeach SS-1
ImperialBeach
Sand % 91-97 86-99 100 100 98-99 99 99 100
Silt/clay % 1-3 1.3-13.8 0 0 0.1-0.4 1 0.57 0
Mean or Median GrainSize (mm)*
0.12-0.66 0.22 0.12-0.16 0.15 0.15-0.21 0.12-0.17 0.44-0.63 0.27 0.28 0.16-0.64
TOC % 0.07 0.04 0.05 0.05 0.02 0.06 0.22 0.19
Metals mg/kg Arsenic 1.6 1.1 0.7 0.8 0.8 0.9 0.7 1.5
Cadmium <0.1 <0.1 <0.1 <0.01 <0.1 <0.01 <0.1 <0.1
Chromium 4.0 3.5 2.5 2.5 1.4 2.3 5.7 6.8
Copper 1.7 1.2 0.5 0.7 0.4 0.3 3.6 1.6
Lead 1.0 1.0 1.8 1.5 0.3 0.6 1.3 1.7
Mercury <0.02 <0.02 <0.01 <0.01 <0.02 <0.01 <0.02 <0.1
Nickel 1.5 1.3 1.0 1.2 0.4 0.3 2.3 1.8
Selenium 0.2 <0.1 <0.1 0.2 <0.1 <0.1 <0.1 <0.1
Silver <0.1 <0.1 <0.3 <0.3 <0.1 <0.2 <0.1 <0.1
Zinc 8.2 6.9 4.8 5.1 2.2 4.8 17.5 11.1
Pesticides µg/kg ND ND ND ND ND ND ND ND
PCBs µg/kg ND ND ND ND ND ND ND ND
PAHs µg/kg ND ND ND ND ND ND ND ND
Phenols µg/kg ND ND ND ND ND ND ND ND
Sulfides mg/kg 0.2 0.6 <0.2 <0.2 0.7 <0.2 0.2 <0.2
*Mean grain size diameter reported for borrow site and median grain size reported for receiver siteND = not detected(1) Receiver site grain size and chemistry (Department of the Navy 1995)(2) Receiver site grain size diameter (3) Receiver site grain size diameter (USACOE 1984)Note: Grain size diameter as reported from Moffatt & Nichol (2000a)Source: Sea Surveyor 1999
3.4 Biological Resources
Regional Beach Sand Project EIR/EA Page 3.4-199-69\SANDAG EIREA 3.4.wpd 7/17/00
3.4 BIOLOGICAL RESOURCES
This section presents a summary of the biological technical report which is included in Appendix D. First,
the methods are described (Section 3.4.1). This is followed by a regional review of biological resources,
both marine and terrestrial (Section 3.4.2). The biological resources of each receiver site are described
in Section 3.4.3, and the borrow site resources are described in Section 3.4.4. One issue raised during
the NOP period was potential impacts to commercial fisheries. Both the socioeconomic and biological
issues associated with this topic are addressed in Sections 3.8 and 4.8.
3.4.1 Data Collection Methods
The technical approach included coordination with regulatory and resource agency personnel; offshore
surveys at selected borrow sites; surveys of the beach receiver sites; consultation with technical experts,
representatives from local fishing organizations, and local divers and fishermen; and literature and data
review. Coordination efforts are summarized in Chapter 7.0 of this EIR/EA as well as Appendix D. An
overview of the survey method is provided below for receiver and borrow sites.
Receiver Site Surveys
Intertidal surveys were conducted at each of the alternative receiver sites to map and describe habitat
characteristics. Of particular interest was the occurrence of hard substrate, the relative quality of habitats,
and occurrence of sensitive resources. The intertidal zone is defined as the area between the highest high
tide and the lowest low tide and can be divided into three areas (upper, middle, and lower) based on the
frequency and duration of inundation by seawater. The intertidal zone is also characterized by breaking
surf. Shallow subtidal zone is defined as the area between the lower intertidal and the inner shelf zone. The
inner shelf zone is defined as the subtidal zone between -30 feet and -80 feet MLLW.
Receiver sites were visited during spring lower low tides so that the intertidal zone was well exposed. All
sites were surveyed early morning between May 17 and May 20, 1999. Brief visits were made June 15
through 17, 1999 at selected sites to augment the description of those sites. At the time of the June 1999
visits, it was noted that there had been build up of sand on the beaches, and that some of the hard substrate
areas noted in May 1999 were buried by sand. Sites where hard substrate had been noted in June were
re-surveyed July 13 through 15, 1999. The re-surveyed locations included the South Carlsbad South,
Solana Beach, and Torrey Pines receiver sites. The Leucadia receiver site was first surveyed in July 1999.
3.4 Biological Resources
Page 3.4-2 Regional Beach Sand Project EIR/EA99-69\SANDAG EIREA 3.4.wpd 7/17/00
During the beach surveys, the distribution of sand versus hard substrate habitat within the intertidal zone
was mapped. Survey teams measured the length and width of all hard substrate areas relative to distance
from the northern site boundary. Photographs of representative views of the beach habitats were taken.
The depth of sand, up to a depth of four feet, was measured within upper, mid, and low intertidal zones at
several locations along the beach using a one-quarter inch diameter calibrated rod. At selected locations
the rod was pushed into the sand up to four feet deep or to the point of refusal (until it hit something that
prevented further penetration like a rock or reef) whichever occurred first. There were at least nine sample R
locations at each receiver site. The focus of the sand depth measurements was to identify occurrence of R
habitat for various organisms and egg laying by California grunion. Since those habitat functions typically
occur within sand depths ranging up to two to three feet, depths greater than four feet were not measured.
The sand substrate was further characterized by examination of organisms living within upper, mid, and low
intertidal zones. Shovel samples (up to 24 inches deep or refusal) were collected from the three intertidal
zones at three locations corresponding to near the northern boundary, near the middle, and near the
southern boundary of each site. The sides and interior of the holes were examined for marine organisms
(e.g., grunion eggs, sand crabs, worms, clams, etc.). Sand removed from the holes was sieved through a
1 mm screen to assist the evaluation of the presence of marine organisms. The wave wash area was
examined for sign of sand crabs (i.e., v-shaped antennae extended), clams, and sand dollars.
The hard substrate areas were described according to type (e.g., cobble, boulders, rock bench) and relief
height. Relief was defined in a manner consistent with previous Navy documentation. Pursuant to the
previous Navy documentation, low relief was defined as being less than three feet in height and high relief
was defined as being greater than three feet in height (Department of the Navy 1997a, 1997b). Animals
and plants living on hard substrate areas were identified consistent with the previous Navy studies, and their
relative abundance was noted.
Intertidal and Subtidal Surveys
Inshore surfgrass beds located between Oceanside and Torrey Pines were surveyed during extreme minus
tides (-1.8 to -2.1 MLLW) on January 21 and 22, 2000. Differential Global Positioning System (DGPS)
coordinates were taken at the onshore-offshore and upcoast-downcoast edges of exposed surfgrass beds.
Beds were delineated by biologists and plotted using DGPS.
3.4 Biological Resources
Regional Beach Sand Project EIR/EA Page 3.4-399-69\SANDAG EIREA 3.4.wpd 7/17/00
Surveys for nearshore reefs were conducted in areas where the model indicated the potential for more
persistent sand deposition and where resources had not been mapped or where mapping identified hard
substrate, but that substrate was unquantified or uncharacterized. Surveys also validated data from various
sources including prior mapping performed by the Navy and information from commercial fisherman (at
selected locations). These surveys were conducted January 18 through 25, 2000. The purpose of these
surveys was to quantify the hard substrate, determine relief heights of the hard substrate, and determine the
presence or absence of reef indicator species. The indicator species were selected in consultation with the
resource and regulatory agencies to be consistent with the U.S. Navy’s previous resource mapping for the
project. The indicator species included surfgrass (Phyllospadix spp.), giant kelp (Macrocystis pyrifera),
feather boa kelp (Egregia menziesii), sea palms (Eisenia arborea), and sea fans (Muricea spp.). All of
these species are perennial, although feather boa kelp occur in locations where scour and other ocean
process result in high (yearly or less) morbidity. Feather boa are extremely quick to recolonize.
Additionally, the occurrence of non-vegetated hard substrate or substrate vegetated only with opportunistic
coralline algal turf was noted. The relative abundance of indicator species was noted as abundant,
common, or sparse similar to that for the receiver site surveys.
Hard substrate on nearshore reefs in intertidal and shallow, inshore areas were assessed by walking the
beach during extreme minus tides (-1.4 to -2.1 MLLW) between January 18 and 20, 2000. Next, subtidal
hard substrates were mapped according to location and relief height using side-scan sonar from January
22 to 25, 2000. Following the side-scan sonar work, biologists using S.C.U.B.A. dove on the sonar-
identified hard substrates and noted reef heights and presence of indicator species and/or coralline algal turf.
Divers swam transects to complete map coverage between side-scan sonar and minus tide survey limits.
They also swam transects to map an area off Solana Beach where kelp canopy cover had interferred with
operation of the side-scan sonar. Divers deployed buoys to mark reef edges and dramatic changes in
resource development (e.g., surfgrass versus non-surfgrass areas), and DGPS readings of the buoy
locations were recorded. The dives were conducted from January to March 2000. Maps were prepared
of the surveyed areas that included the extent of all hard substrate within the survey area, relief heights, and
the recorded biological notes. The dimensions of the hard substrate areas were measured to provide
acreage according to biological resource categories.
Borrow Site Surveys
Offshore surveys were conducted at proposed borrow sites S0-7 and SO-5 to obtain representative
information on the offshore habitats. To assist in the evaluation of potential borrow site impacts, a survey
3.4 Biological Resources
Page 3.4-4 Regional Beach Sand Project EIR/EA99-69\SANDAG EIREA 3.4.wpd 7/17/00
effort was also undertaken at the Surfside/Sunset Beach borrow sites in Orange County that have been
continually used for beach replenishment since the late 1970s. Three existing borrow sites that were used
in 1979, 1990, and 1997 were surveyed so that comparisons could be made between dredge areas that
differed in time from disturbance. Additionally, an unaffected “control” area was sampled in the vicinity.
The surveys were conducted between June 23 through 25, 1999. The proposed borrow sites in San Diego
County (SO-7 and SO-5) and the existing borrow sites in Orange County were surveyed with identical
methods.
Continuous water quality (pH, dissolved oxygen, temperature, salinity, transmissivity) measurements were
made from the surface to the bottom at the borrow site locations using a Seabird water quality analyzer.
Fish and benthic macroinvertebrates were collected using a 25-foot headrope otter trawl. Two trawl
samples (10 minute tows) were collected at each study station. Two SCUBA diving biologists swam
transects at each of the stations and recorded observations of fish and benthic macroinvertebrates. Divers
collected samples for infaunal and sediment analysis. Grain size distribution and total organic carbon were
analyzed in the laboratory using standard methods. Infaunal samples were processed according to standard
protocols for collecting and identifying the small organisms that reside in the sediment.
Literature and Data Review
Several sources of information were used to augment description of existing conditions and to evaluate
potential impacts from the project. Primary data sources for existing conditions included water quality
monitoring data from NPDES wastewater ocean monitoring programs conducted in San Diego County;
physical and chemical characterization of borrow site sediments (Sea Surveyor, Inc. 1999); habitat maps
prepared by the Department of the Navy (1997a, 1997b); input on resource maps by representatives of
commercial fishing organizations (Guth 1999); field surveys conducted by MEC for this project; fishing
catch records obtained from the CDFG; sensitive bird species monitoring data from the USFWS; and
monitoring studies currently being conducted in the project area for the Navy in rocky intertidal, subtidal
reef, and kelp bed habitats.
3.4.2 Regional Overview
The project area is within the larger zoogeographic zone known as the warm temperate or Southern
California Bight, whose boundaries span from Point Conception, California to Punta Eugenia, Baja
California. The distributions of species within the Bight are related to the complex hydrography and

3.4 Biological Resources
Regional Beach Sand Project EIR/EA Page 3.4-599-69\SANDAG EIREA 3.4.wpd 7/17/00
geology of the region. The mainland shelf, which extends from shore to approximately -650 feet MLLW,
comprises six percent of the 40,000-square mile Bight. There are no sensitive or endangered infauna
species in the Bight. There are also smaller Sub-bights and the project is within the Sub-bights of
Oceanside, Mission Beach, and Imperial Beach (also littoral cells).
The primary habitat of the offshore borrow sites is marine open water. Sandy substrates characterize the
bottom in the vicinity of the borrow sites; however, hard substrate may support sensitive indicator species
such as sea fans, feather boa kelp, and/or giant kelp. Sand and hard substrate bottoms characterize
nearshore and intertidal habitats within, and adjacent to, the receiver sites.
The following text provides an overview of the soft bottom and hard bottom communities which generally
occur in or adjacent to proposed borrow or receiver sites. This is followed by an overview of the mammals
(marine and terrestrial), and bird species which occur throughout the project area. A detailed description
of each individual receiver site and borrow site, in terms of both resources within the footprint and nearby,
is provided in Section 3.4.3.
Soft Bottom Communities
The benthos is a general term referring to those organisms that live in (infauna), on (epibenthic), or near
(demersal) the seafloor. Benthic habitats along the mainland shelf of the Bight can be divided into soft and
hard bottom substrates. Each harbors a distinct and characteristic community, which varies with many
environmental variables but especially water depth and substrate type. The descriptions are organized
generally from the intertidal zone seaward.
Benthic Invertebrates
The soft-bottom substrates of the mainland shelf include over 5,000 species of invertebrates. Biological
diversity is generally related to the complexity of habitats, water depth, sediment grain size, nutrients,
contaminants, shelf width, and distance from shoreline. Benthic communities can be affected by seasonal
change and episodic winter storms (waves and rain) which physically disrupt bottom communities.
Soft bottom infaunal communities have similar characteristics for a given water depth, sediment type, and
wave energy. Thus, sandy infaunal communities off of Oceanside are similar to those found at similar
depths and bottom type off of Imperial Beach. The infaunal zone is classified into general regions, including

3.4 Biological Resources
Page 3.4-6 Regional Beach Sand Project EIR/EA99-69\SANDAG EIREA 3.4.wpd 7/17/00
shallow subtidal to a depth of about -30 feet MLLW, an inner shelf zone from about -30 to -80 feet
MLLW, middle shelf from about -80 to -300 feet MLLW, and outer shelf zone from about -300 to -600
feet MLLW.
Sandy beaches represent unstable habitats with seasonal cycles of sand deposition and erosion. Common
invertebrates observed on San Diego County sandy beaches include beach hoppers (Orchestodea spp.),
sand crabs (Emerita analoga), bean clams (e.g., Donax gouldii), olive snails (Olivella biplicata), and
polychaete worms (e.g., Euzonus spp., Lumbrineris spp., Nephtys californiensis, Scololepis spp.,
Scoloplos spp.).
Bottom-dwelling species in the shallow subtidal zone are well adapted to shifting sediments and turbidity,
with suspension feeders being the dominant group. Species common in sandy-bottom, nearshore areas
off Oceanside include the polychaete (Apoprionospio pygmaea), bean clam (Donax gouldii), amphipod
(Mandibulophoxus uncirostratus), and nemerteans. Similar species would be expected in nearshore
sandy substrates offshore all receiver sites.
The proposed borrow sites fall within the inner shelf zone which is routinely disrupted by wave activity and
oceanic swell. The number of species and abundances of bottom dwelling macroinvertebrates is quite low
in the inner shelf compared to the middle and outer shelf depth zones. Polychaete worms and/or small,
mobile crustaceans dominate the inner to middle shelf infaunal community.
Fish
Speckled sanddabs (Citharichthys stigmaeus) are the most abundant fish species of the inner shelf with
only a few individuals found in the middle shelf zone. Fish commonly found on the bottom in sandy subtidal
habitat (less than 30 feet) off San Diego County beaches include: halibut (Paralichthys californicus),
speckled sanddab, bat ray (Myliobatus californica), and shovelnose guitarfish (Rhinobatos productus).
Northern anchovy (Engraulis mordax), jack mackerel (Trachurus symmetricus), and Pacific bonito
(Sarda chiliensis) are commonly encountered in the water column just beyond the surfzone.
The California grunion (Leuresthes tenuis) is common south of Point Conception, California, to Magdalena
Bay, Baja California, in nearshore waters from the surf to a depth of 60 feet. Grunion travel from their
habitat in nearshore waters to specific sandy beaches just after certain full and new moons in conjunction
with their spawning. Grunion on San Diego beaches are typically found on the long, gently sloping beaches
3.4 Biological Resources
Regional Beach Sand Project EIR/EA Page 3.4-799-69\SANDAG EIREA 3.4.wpd 7/17/00
with moderately fine grain size. Grunion are managed as a game species by the California Department of
Fish and Game. Their spawning season occurs from March to August.
Hard Bottom Communities
Rocky habitats often are very productive ecosystems that support a variety of plants and animals. Hard
bottom habitats include rocky intertidal shores and hard bottom subtidal reef. (The intertidal zone is the
area between the highest high tide and the lowest low tide. Areas that are permanently inundated are
defined as subtidal.) Approximately 14 percent of the coastline in San Diego County is estimated to be
rocky, but the distribution of subtidal reefs is less well known than the rocky intertidal because large-scale
mapping studies have not been undertaken. The proportion of hard substrate habitat at any given time
relates to the amount of sand in the littoral cell and relief height. An increase in the proportion of hard-
bottom habitat may be occurring in conjunction with sand loss and degradation of beaches by erosion.
Several physical factors influence the types and diversity of marine life associated with rocky habitats.
Important substrate qualities include relief height (low, high), texture (smooth, pitted, cracked), size, and
composition (sandstone, mudstone, basalt, granite). Substrates that are of higher relief, greater texture, and
size generally have the richest assemblages of marine species. Cobbles, which roll and move about within
the wash zone, are dangerous to small organisms and empty of life. Rocks and reefs of low height are
subjected to seasonal burial and uncovering associated with the onshore and offshore migration of sand.
Such low lying substrate tends to be devoid of organisms and is dominated by opportunistic annuals or sand
tolerant species. The hardness of the substrate also is important; organisms growing on soft rock substrates
(e.g., mudstones, sandstones) may be dislodged when water movement fractures or erodes the rock.
In addition to relationship with substrate characteristics, marine life also differs with water level. The upper
intertidal or splash zone is characterized by simple green algae (Chaetomorpha, Enteromorpha, Ulva),
barnacles (Cthamalus), limpets (Collisella, Lottia), and periwinkles (Littorina). Coralline algae
(Corallina spp.) is a dominant algae on low relief rocky substrate in the mid-to-low intertidal zone.
Intertidal substrates less influenced by sand burial and abrasion often support California mussel (Mytilus
californus), gooseneck barnacle (Pollicipes polymerus), aggregating sea anemones (Anthopleura
elegantissima), hermit crabs (e.g., Pagurus), a variety of snails (e.g., Lithopoma, Kelletia, Tegula),
chitons (e.g., Mopalia), and annual species of algae.
Along the northern coast of San Diego County, the most common algae on exposed rocky substrate are
coralline algal turf and seasonal species that can develop rapidly whenever a surface is free from sand, but

3.4 Biological Resources
Page 3.4-8 Regional Beach Sand Project EIR/EA99-69\SANDAG EIREA 3.4.wpd 7/17/00
many do not persist. Opportunistic species such as the feather boa kelp (Egregia menziesii), which more
commonly occurs as a subtidal canopy, actively recruits to intertidal habitats on exposed rock, but rarely
lives more than a year due to sand scouring, sun burn, density-dependent self-thinning, and competitive
exclusion.
Persistent substrates in the low tidal zone and minus tide zone are characterized by a greater diversity of
plants and animals including coralline algae, other red algae, brown algae, surfgrass (Phyllospadix), green
sea anemones (Anthopleura xanthogrammica), purple sea urchins (Strongylocentrotus purpuratus),
California sea hares (Aplysia californica), snails, sponges, and starfish (Asterina miniata, Pisaster spp.).
Wooly sculpin (Clinocottus analis) is one of the more commonly encountered fish in tidepools.
Subtidal reefs in the shallow nearshore also exhibit considerable variation in resource development
associated with the seasonal onshore and offshore migration of sand, and similar to intertidal reefs, substrate
factors such as relief height, texture, composition, and size largely determine resource development on
nearshore reefs. Higher relief reefs typically support more diverse communities that include perennial
species such as sea fans (Muricea), sea palms (Eisenia arborea), sponges, nudibranchs, and sea stars,
and harbor and attract a variety of fish such as garibaldi (Hypsypops rubicunda), blacksmith (Chromis
punctipinnis), and black perch (Embiotoca jacksoni). In striking contrast, very low relief areas exhibit
reduced species diversity consisting mainly of opportunistic and annual turf vegetation.
Surfgrass is a key species of an important vegetated community that ranges from intertidal to -20 feet
MLLW. In southern California, surfgrass serves as a nursery for the California spiny lobster. Surfgrass,
which is a long-lived perennial species, persists in rocky areas with shifting sand by having an extensive root
system that binds with sand and having leaves that are tolerant of sand abrasion. However, while surfgrass
may tolerate wet sand cover for many months, the duration and depth of burial that would result in
morbidity has not been studied. Incremental sand burial has been reported to affect blade growth.
Surfgrass recovery rates are slow (three to five years) when recovering from removal of the root mat, but
may be quicker when the rhizomes remain intact. Surveys undertaken in January and February 2000
identified and mapped approximately 42 acres of surfgrass in the intertidal from Oceanside to Torrey Pines
(Appendix D). While the acreage in the nearshore was not surveyed by this method and is not field
verified, hard substrate patterns suggest at least that same amount, and probably more, are present in the
nearshore. This total surfgrass acreage off the North County San Diego shoreline is estimated at 80 to 100
acres.

3.4 Biological Resources
Regional Beach Sand Project EIR/EA Page 3.4-999-69\SANDAG EIREA 3.4.wpd 7/17/00
As one moves further offshore to depths where seasonal sand movement is less, hard substrates do not
need to have as high a relief to support perennial species. Kelp beds are an important habitat associated
with offshore reefs. The kelp community, dominated by giant kelp (Macrocystis pyrifera), ranges from
water depths of about -20 feet to -120 feet MLLW. It is a unique habitat that provides food, shelter,
substrate, and nursery areas for many species of fish and invertebrates. Invertebrates found in kelp beds
include lobster, sea stars, sea urchins, and mollusks. Brown, green, and red (fleshy and coralline) algae
occur in kelp beds. Surfperch, rockfish (Sebastes spp.), and wrasses (senorita, rock wrasse and
sheephead) are usually the dominate fish type.
Kelp beds also provide a large food supply for marine birds and mammals. Cormorants are the birds most
closely associated with California kelp beds; however, gulls commonly scavenge on the surface canopy,
and pelicans and terns exploit schooling fish along the canopy's edge. Mammals such as sea lions, seals,
and whales use kelp beds as transitory foraging areas. The giant kelp is commercially harvested for use
in a variety of food products, pharmaceuticals, adhesives, paper products, paints and finishes, rubbers, and
textiles.
Giant kelp is adversely affected by sedimentation and turbidity. Large amounts of shifting sediment can
scour the bottom, bury small plants, and prevent settling of microscopic spores, all of which can reduce the
cover in the number of adult plants. Giant kelp is one of the first species to be eliminated in physically
stressed habitats (wave or sand scour). The density and abundance of kelp canopy varies by location,
season, and year. Kelp beds in southern California commonly deteriorate to some degree during summer
and fall when temperatures are higher and nutrient concentrations are lower. El Niño conditions, which
result in higher than average temperatures and low nutrients have been linked to periodic and widespread
reductions in kelp canopy. Kelp beds in northern San Diego County are in the process of recovering from
the recent 1997/1998 El Niño.
Mammals
Both marine and terrestrial mammals occur in the project area.
Marine
Several species of mammals occur in nearshore waters adjacent to the receiver sites and in offshore waters
near the borrow sites. California sea lions (Zalophus californicanus) and harbor seals (Phoca vitulina)

3.4 Biological Resources
Page 3.4-10 Regional Beach Sand Project EIR/EA99-69\SANDAG EIREA 3.4.wpd 7/17/00
are found in these waters and may, occasionally, use the beach (Department of the Navy 1997a, 1997b).
Common dolphins (Delphinus delphis) and bottlenose dolphins (Tursiops truncatus) occur in the surfzone
and in offshore waters. Pacific white-sided dolphins (Lagenorhynchus obliquidens) and Risso’s dolphins
(Grampus griseus) also are known to occur seasonally in southern waters of the Bight.
California gray whales (Eschrichtius robustus) migrate through the study area. The southbound migration
through the Bight begins in December and lasts through February; the northbound migration is February
through May. Gray whales migrate up to 125 miles offshore along three pathways through the Bight. The
project area lies within the nearshore migration path, which extends from the shoreline to approximately
12 miles offshore.
Terrestrial
Several of the receiver sites are located near urban development and/or have bluffs. Common mammal
species with the potential to occur in the vicinity of receiver sites in the project area include gophers
(Thomomys bottae sanctidiegi), mice (e.g., Mus musculus), black rats (Rattus rattus), Norway rats
(Rattus norvegicus), opossum (Didelphis virginiana), rabbits (Sylvilagus spp.), California ground
squirrel (Spermophilus beecheyi nudipes), raccoon (Procyon lotor psora), and striped skunks (Mephitis
mephitis holzneri). None of these species are listed as threatened or endangered by the federal or state
government.
Birds
The southern California coastline is a diverse habitat for migrant and resident birds. The proposed beach
sites and nearshore waters provide a variety of areas for seabirds to roost and forage. Sandy/cobblestone
upper tidal beaches are utilized by gulls and shorebirds as roosts (resting-places). However, cobblestone
areas in the intertidal are not typical feeding areas for shorebirds. Probing shorebirds will forage upon
invertebrates in the damp, sandy middle and lower tidal zones. Kelp and surfgrass that have washed ashore
are good foraging areas for gulls, shorebirds, and even some passerines, as they harbor and are fed upon
by invertebrates. Other areas of rocky/reef substrates provide tide pools filled with marine animals for
foraging gulls and shorebirds. The nearshore ocean accommodates birds such as gulls, pelicans, terns, and
cormorants, which prey upon the schooling fish and other marine organisms below.
3.4 Biological Resources
Regional Beach Sand Project EIR/EA Page 3.4-1199-69\SANDAG EIREA 3.4.wpd 7/17/00
Also within the project area are inlets for several lagoons, estuaries, and bays. These coastal ecosystems
are havens for a huge diversity of birds due to their varied habitat. The shallow water and shoreline provide
roosting, foraging, and nesting areas for such birds as ducks, terns, shorebirds, pelicans, cormorants, gulls,
herons, raptors (such as ospreys and northern harriers), and various passerines in the surrounding
vegetation. Some of these wetlands also provide rest stops for migrating birds along the Pacific Flyway.
Over 70 species of birds are known or expected to occur in the project area (Appendix D). Because of
the proximity of some receiver sites to coastal inlets, species associated with wetlands have the potential
for occurrence at some beach receiver sites. Threatened and endangered bird species with known or
expected occurrence in the project area include California brown pelican, California least tern, western
snowy plover, and American peregrine falcon (described below). The locations of California least tern and
western snowy plover nesting sites are shown in Figure 3.4-1.
California Brown Pelican
The California brown pelican is a protected species in California and is listed as endangered by both the
federal and state government. They are found in the open ocean and other coastal salt waters along the
southern California coast throughout the year. This species is tolerant of human activity near its daytime
roosts and readily utilizes various man-made structures (e.g., piers, breakwaters, buoys) as roosting sites.
Known breeding locations include offshore islands such as Anacapa and Santa Barbara Islands in southern
California and islands off the coast of northwestern Baja California, Mexico.
California Least Tern
The California least tern (Sterna antillarum browni) has been listed as endangered federally and by the
state since 1972. This small tern nests in colonies along the southern California coast on sandy beaches
with sparse vegetation. It forages in shallow ocean water, generally less than 60 feet deep and within one
mile of shore, and in wetlands nearby these nesting habitats. Wetland destruction and human developments
along the coastline have impacted least tern’s nesting habitats, as well as their foraging resources.
The San Diego nesting sites are located as far north as Marine Corps Base (MCB) Camp Pendleton and
extend southward to the United States/Mexico border. Nest locations are on the beaches of MCB Camp
Pendleton near the Santa Margarita River mouth, around Mission Bay, and the greatest number of sites are
found around San Diego Bay. Other nests were found in Batiquitos and San Elijo Lagoons. The least tern
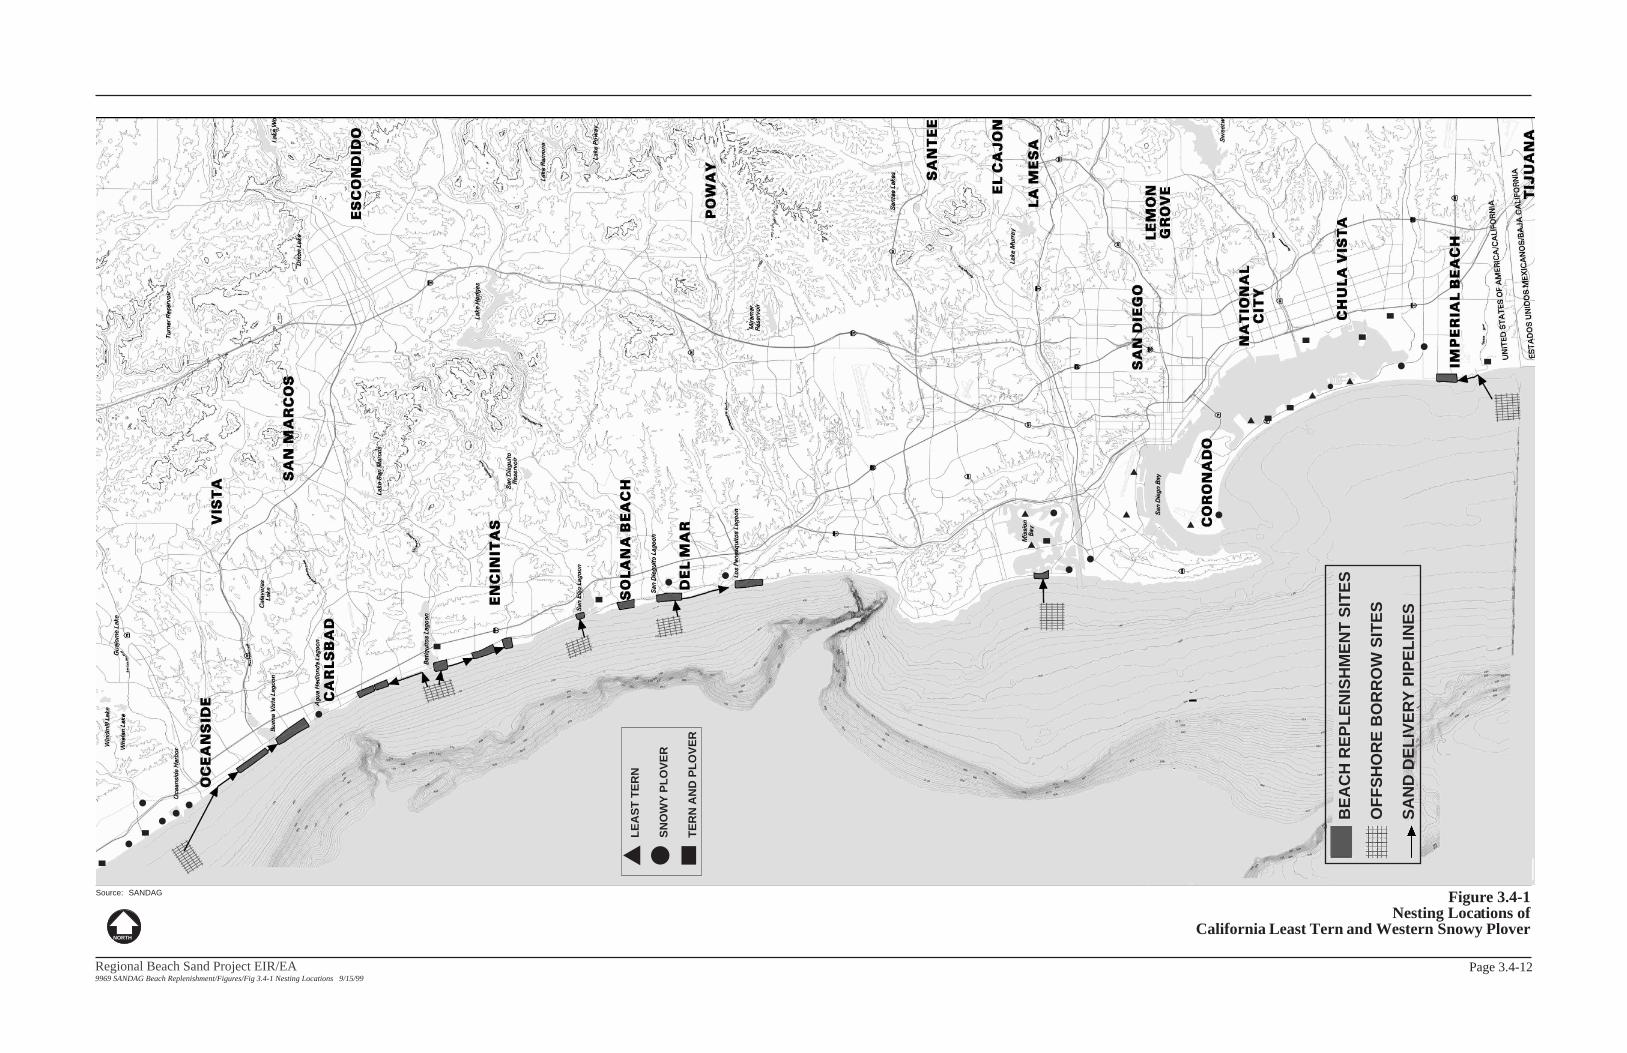
4.0 Environmental Consequences
Source: SANDAG
Page 3.4-12
NORTH
Figure 3.4-1Nesting Locations of
California Least Tern and Western Snowy Plover
BE
AC
H R
EP
LE
NIS
HM
EN
T S
ITE
S
OF
FS
HO
RE
BO
RR
OW
SIT
ES
SA
ND
DE
LIV
ER
Y P
IPE
LIN
ES
LE
AS
T T
ER
N
SN
OW
Y P
LO
VE
R
TE
RN
AN
D P
LO
VE
R
Regional Beach Sand Project EIR/EA9969 SANDAG Beach Replenishment/Figures/Fig 3.4-1 Nesting Locations 9/15/99
3.4 Biological Resources
Regional Beach Sand Project EIR/EA Page 3.4-1399-69\SANDAG EIREA 3.4.wpd 7/17/00
nesting season is April 1 to September 15. Least tern’s usually feed in waters within a two-mile radius of
their nesting site, but observations suggest the tern’s opportunistic foraging can take it as far as five miles
away.
Western Snowy Plover
The western snowy plover (Charadrius alexandrinus nivosus) was listed as threatened in 1997. Their
decline is a result of loss of nesting habitat due to coastal development and recreational activities. Along
the southern California coast, snowy plovers nest on bay fill and beaches around bays and lagoons, spits R
and alkali flats at river mouths, and on salt evaporators. Plovers typically forage in areas with little or no R
human activity and avoid areas of high human use. They prefer to forage on sandy beaches with kelp R
washed ashore. The San Diego region supports 26 percent of the estimated breeding pairs on the R
California coast.
A cluster of nest sites are located around the mouth of the Santa Margarita River on MCB Camp Pendleton
and around the San Diego Bay. The other nests are spread out in between those two sites on Carlsbad
State Beach/Agua Hedionda Lagoon; around Batiquitos, San Elijo, San Dieguito, and Los Peñasquitos
Lagoons; and along Mission Beach and Bay. Snowy plovers forage close to their nests probing in the sand
for invertebrates or running along the sand snatching up insects in the air. The nesting season extends from
March 1 to September 15.
American Peregrine Falcon
The American peregrine falcon (Falco peregrinus anatum) was listed by the federal and state
governments as an endangered species in 1970. On August 25, 1999, the USFWS removed the American
peregrine falcon from the Endangered Species List, although it currently remains on the state endangered
species list. Current nesting locations include the San Diego metropolitan area and Point Loma. Preferring
to hunt along larger waterways and coastal areas, particularly where large numbers of shorebirds and
waterfowl congregate, peregrine falcons likely utilize the project area on an occasional basis.
3.4 Biological Resources
Page 3.4-14 Regional Beach Sand Project EIR/EA99-69\SANDAG EIREA 3.4.wpd 7/17/00
3.4.3 Receiver Sites
Intertidal habitats at proposed receiver sites were mapped between May and July 1999 and January
through March 2000. Extensive habitat mapping was conducted by the U.S. Navy in 1997 and focused
subtidal surveys were conducted in January and March 2000. Rocky substrate areas mapped in
1999/2000 corresponded well to 1997 map information.
The proximity of the receiver sites to reefs and/or kelp beds located further offshore was considered for
each site because the project has the potential to result in impacts associated with increased turbidity and
sediment transport. Historical maps of nearshore resources, additional map information provided by
commercial fishermen, and representative photographs of the receiver sites are provided in Appendix D.
The receiver sites are characterized by varying combinations of sand and cobble. Receiver sites at South
Oceanside, Del Mar, and Mission Beach are almost entirely sand habitats. Sand habitat is inhabited by
worms, sand crabs, crustaceans, and bean clams. Other sites have hard substrate in the form of cobbles,
rock revetment, rock, or sandstone bench with various resource development. The Cardiff, Torrey Pines,
and Imperial Beach receiver sites are predominantly cobble. Sites in Carlsbad, elsewhere in Encinitas, and
Solana Beach have sand plus cobble bands of varying widths and density. Each of the 13 receiver sites
is described below in terms of species and habitat identified within the receiver sites boundaries (i.e.,
footprint) and nearby sensitive resources. Sensitive resources are defined at the habitat level to include
vegetated nearshore reefs and kelp beds, and at the species level to include protected, and/or threatened
and endangered species. The types of habitats observed and expected at the receiver sites and nearshore
in the vicinity are summarized in Table 3.4-1. This table reflects data from past Navy analyses (1995,
1997a, 1997b), field work in 1999 and 2000, and input from local commercial fisherman.
Nearshore habitats adjacent to the beach replenishment sites support invertebrates, fish, algae, surfgrass,
kelp, mammals, and foraging birds. Communities of invertebrates and fish that inhabit the nearshore areas
are determined by the type of bottom substrate (sandy or hard-substrate) and the presence of kelp or
surfgrass. Nearshore habitats adjacent to the receiver sites are sandy bottom, with varying amounts of hard
substrate at several of the sites. Hard substrate with surfgrass or kelp occur offshore several of the sites.
Vegetated areas are functional habitats, supporting associated fishes and invertebrates.

3.4 Biological Resources
Regional Beach Sand Project EIR/EA Page 3.4-1599-69\SANDAG EIREA 3.4.wpd 7/17/00
Table 3.4-1Summary of Habitats at the Proposed and
Alternative Receiver Sites and in the Nearshore Vicinity
ReceiverSite Intertidal Subtidal to -10 ft MLLW -11 to -20 ft MLLW -20 to -30 ft MLLW
Proposed Sites
Oceanside Sand, localized 100% cobble,one high relief rock (about 6ft wide), rip-rap revetmentat back beach
Sand Sand localized scatteredrocks
Sand, localized scattered rock;nearest kelp bed > 8,000 ftsouthwest, nearest historicalkelp 1150 ft southwest
North
Carlsbad
Sand, 30 to 100% cobble
bands 14 to 65 ft seaward, 5to 25% cobble bands seawardof denser cobble
Sand and low relief reef,
small high relief reef, patchysurfgrass
Sand and low relief reef,
small high relief reef, patchysurfgrass
Sand and reef; nearest kelp bed
2,250 ft southwest, historicalkelp offshore
SouthCarlsbadNorth
Sand, 30 to 100% cobblebands 19 to 100 ft seaward,5 to 25% cobble bandsseaward of denser cobble,localized rip-rap revetment
at back beach
Sand and localized high reliefreef, historical surfgrass
Sand and localized high reliefreef, historical surfgrass
Nearest kelp bed 1,600 ftnorthwest, historical kelpoffshore
SouthCarlsbadSouth
Sand, 30 to 100% cobblebands 25 to 50 ft seaward, 5to 25% cobble bands from25 to 105 ft seaward,localized low relief reef 230ft seaward
Sand and low relief reef,patchy surfgrass
Sand and low relief reef,localized high relief reefsouthwest, patchy surfgrass
Nearest kelp bed >3,000 ftsouthwest, historical kelpoffshore
Batiquitos Sand, 30 to 100% cobblebands up to 80 ft seaward, 5to 25% cobble bands about25 ft seaward of densercobble
Sand and localized low reliefreef, patchy surfgrass
Sand and localized low reliefreef, localized high reliefreef, patchy surfgrass
Sand and reef; nearest kelp bed1,500 ft offshore, historicalkelp offshore
Leucadia Sand, localized 50 to 100%cobble bands 50 ft seaward, 3to 20% cobble up to 80 ftseaward, scattered low reliefrock without marine life
Sand, low relief reef,localized high relief reef,patchy surfgrass
Sand, low relief reef,localized high relief reef,patchy surfgrass
1997 and historical kelp bed925 ft offshore
MoonlightBeach
Sand, 30 to 100% cobblebands 30 to 80 ft seaward,localized rip-rap revetment
at back beach
Sand, localized low reliefreef northwest, with patchysurfgrass
Sand, localized low reliefreef northwest with patchysurfgrass
Localized kelp bed 850 ftoffshore and 1,125 ftnorthwest of site, scattered
rock
Cardiff 80 to 100% cobble band 75ft seaward, sand with sparseto moderate cobble low tidezone, localized rip-raprevetment
Sand directly offshore, lowrelief reef northwest, highrelief reef, historical patchysurfgrass
Sand, low relief reefnorthwest, historical patchysurfgrass
Nearest kelp beds 1,075 ftnorthwest and 1,550 ftsouthwest, historical kelpoffshore
Solana Beach Sand, localized 30 to 100%cobble bands, patchy lowrelief reef starting 210 ftseaward
Sand, low relief reef,localized surfgrass, highrelief reef north
Sand, low relief reef,localized surfgrass, highrelief reef north, scatteredrocks
Kelp beds 1,000 to 1,500 ftoffshore
Del Mar Sand, localized boulders and
sandstone
Sand at –10 ft isobath,
patchy surfgrass
Sand at –20 ft isobath,
scattered rocks
Sand at –30 ft isobath; nearest
kelp bed 3,750 ft northwest,historical kelp offshore

3.4 Biological Resources
Page 3.4-16 Regional Beach Sand Project EIR/EA99-69\SANDAG EIREA 3.4.wpd 7/17/00
Table 3.4-1. Continued
ReceiverSite Intertidal Subtidal to -10 ft MLLW -11 to -20 ft MLLW -20 to -30 ft MLLW
Torrey Pines Sand, 30 to 100% cobblebands 3 to 100 ft seaward
Sand, historical surfgrass,high relief reef to south
Sand and localized low reliefreef, patchy surfgrass
Sand and reef at –30 ftisobath, small kelp 3,000 ftsouthwest, historical kelp1800 ft northwest
Mission
Beach
Sand Sand at –10 ft isobath Sand at –20 ft isobath Sand at –30 ft isobath; small
and localized kelp beds 800 to1,200 ft offshore
ImperialBeach
Sand, 95 to 100% cobbleband up to 110 ft seaward, 5to 30% cobble in localizedareas, rip-rap revetment atback beach
Sand at –10 ft isobath Sand at –20 ft isobath Sand at –30 ft isobath; kelpbeds 1,900 ft offshore
All of the receiver sites tested negative for grunion eggs during surveys in May and July 1999, even when
beach and tide conditions were favorable. Testing for grunion eggs was performed with sand shovel
samples as described in Section 3.4.1. Specific factors which may attract or detract grunion at individual
receiver sites are noted in the text. Generally, those receiver sites with gentle sloping sand beaches would
be suitable, while cobble beaches would not be utilized.
South Oceanside
Within Receiver Site Boundaries
The intertidal habitat is predominantly sand. Sand depths measured in May 1999 ranged from 12 to greater
than 48 inches with an average depth of 18 inches in the upper and mid tidal zones and 26 inches in the low
intertidal zone. Beach width under spring low tide conditions ranged from 245 feet at Marron Street to 160
feet at Cassidy Street. Organisms observed in the sand habitat included sand crabs, bean clams, and
polychaete worms.
Dense cobble was limited to a few localized areas primarily at the south end of the site. One high relief
rock, about six feet wide, occurred approximately 250 feet offshore between Crosswaithe and Witherby
Streets, which are located north of Buccaneer beach. No surfgrass was observed on the rock during the
May 1999 beach survey. Rip-rap revetment occurred along the back beach of the entire site. The green
alga, acorn barnacle, limpets, and gray littorine snails occurred in localized areas where the revetment was
in the high tide splash zone. Shorebirds were abundant and foraging in the intertidal and gulls were
observed resting in the upper intertidal during the May 1999 survey.

3.4 Biological Resources
Regional Beach Sand Project EIR/EA Page 3.4-1799-69\SANDAG EIREA 3.4.wpd 7/17/00
California grunion eggs were not observed in shovel samples collected during the May survey, which was
during a period of predicted grunion runs. Sand depths were sufficient and cobble cover was not extensive
at the north to middle portions of the site. However, beach width was narrow and cobble cover was
extensive in the upper intertidal towards the south end of the site. Grunion are known to occasionally use
the beach at Oceanside near Oceanside Harbor and MCB Camp Pendleton; therefore, there is the
potential for their occurrence. The potential is considered low towards the south end of the site where sand
habitat is limited and cobble is more dense.
Nearby Sensitive Resources
Primary California least tern and western snowy plover nesting locations are located about two to five miles R
north of the site at MCB Camp Pendleton. The W-2 tern and plover nesting colony at Batiquitos Lagoon R
is approximately 500 feet from this receiver site. R
Nearshore waters off the South Oceanside receiver site are predominantly sand with localized occurrence
of scattered rocks. Scattered rock habitat offshore the receiver site was surveyed in January 2000. It
consists of low relief (zero to three feet) substrate vegetated with opportunistic coralline algal turf.
Localized and sparse occurrence of sea fans occur on higher relief rocks. The south boundary of the
receiver site is at least 2,000 feet from the nearest vegetated nearshore reef (Table 3.4-2). No kelp bed
had surface canopy in the vicinity in 1999, and the closest kelp bed in 1997 was nearly two miles south.
The nearest surfgrass bed is over 1.5 miles to the south.
North Carlsbad
Within Receiver Site Boundaries
The proposed receiver site is predominantly sand. Sand depths ranged between 13 to 32 inches during
the May 1999 survey and had an overall average depth of 18 inches. Sand crabs and polychaete worms
occupied the sand habitat.
Cobble was sparse (5 to 10 percent) in occurrence along most of the site, although localized areas near
the north and south boundaries had dense bands (100 percent cover) next to the back beach. Bands of
25 to 75 percent cobble extended seaward of the dense band at the south end of the site. No marine life
was observed on the cobble. California grunion eggs were not observed in shovel samples collected during
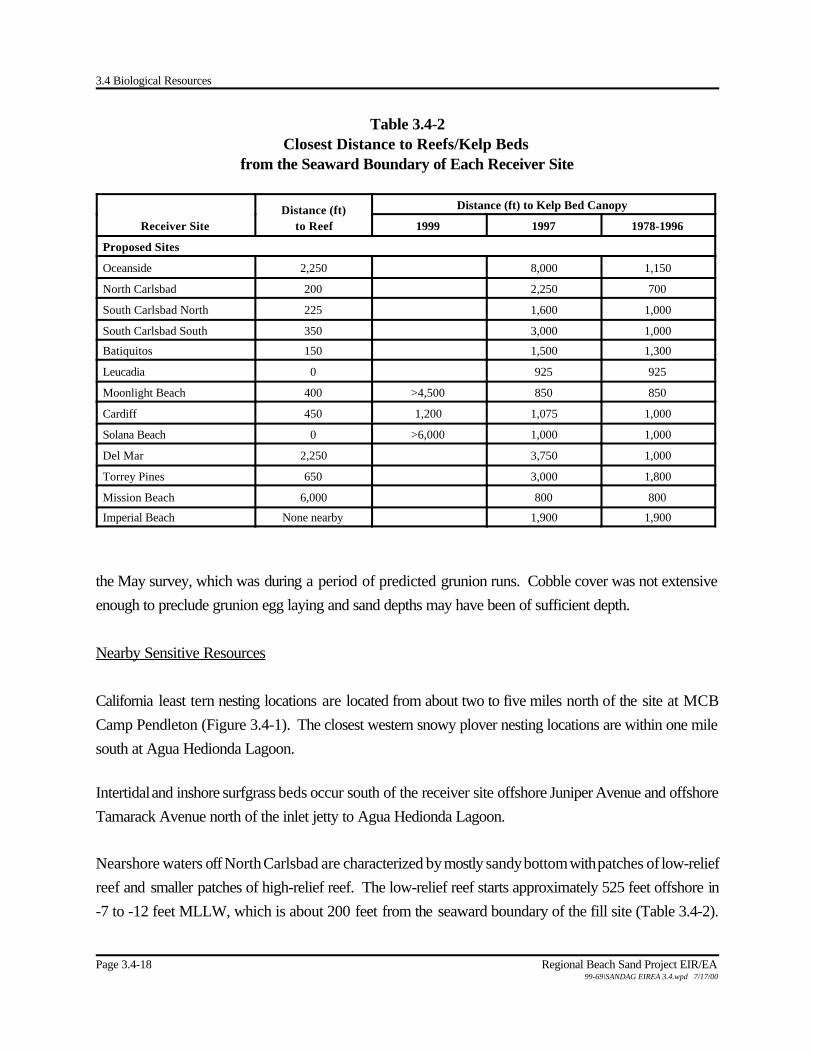
3.4 Biological Resources
Page 3.4-18 Regional Beach Sand Project EIR/EA99-69\SANDAG EIREA 3.4.wpd 7/17/00
Table 3.4-2Closest Distance to Reefs/Kelp Beds
from the Seaward Boundary of Each Receiver Site
Receiver SiteDistance (ft)
to Reef
Distance (ft) to Kelp Bed Canopy
1999 1997 1978-1996
Proposed Sites
Oceanside 2,250 8,000 1,150
North Carlsbad 200 2,250 700
South Carlsbad North 225 1,600 1,000
South Carlsbad South 350 3,000 1,000
Batiquitos 150 1,500 1,300
Leucadia 0 925 925
Moonlight Beach 400 >4,500 850 850
Cardiff 450 1,200 1,075 1,000
Solana Beach 0 >6,000 1,000 1,000
Del Mar 2,250 3,750 1,000
Torrey Pines 650 3,000 1,800
Mission Beach 6,000 800 800
Imperial Beach None nearby 1,900 1,900
the May survey, which was during a period of predicted grunion runs. Cobble cover was not extensive
enough to preclude grunion egg laying and sand depths may have been of sufficient depth.
Nearby Sensitive Resources
California least tern nesting locations are located from about two to five miles north of the site at MCB
Camp Pendleton (Figure 3.4-1). The closest western snowy plover nesting locations are within one mile
south at Agua Hedionda Lagoon.
Intertidal and inshore surfgrass beds occur south of the receiver site offshore Juniper Avenue and offshore
Tamarack Avenue north of the inlet jetty to Agua Hedionda Lagoon.
Nearshore waters off North Carlsbad are characterized by mostly sandy bottom with patches of low-relief
reef and smaller patches of high-relief reef. The low-relief reef starts approximately 525 feet offshore in
-7 to -12 feet MLLW, which is about 200 feet from the seaward boundary of the fill site (Table 3.4-2).

3.4 Biological Resources
Regional Beach Sand Project EIR/EA Page 3.4-1999-69\SANDAG EIREA 3.4.wpd 7/17/00
Surfgrass and feather boa kelp was associated with some of the low relief areas in 1997. Localized areas
of high-relief reef start at about -10 feet MLLW. Feather boa kelp and sea fans were noted on some of
the high relief areas.
Consistent results were noted during January 2000 surveys of reef areas located near Pine Avenue at the
south end of the site, further south offshore Tamarack Avenue but north of the inlet jetty of Agua Hedionda
Lagoon, and south of the discharge jetty of the lagoon. Nearshore reef areas ranged from 0 to 5 feet in
height. Surfgrass mainly occurred on relatively higher relief reefs (e.g., two to five feet) at depths less than
-15 feet MLLW, but also occurred on lower relief reefs at deeper depths out to -22 feet MLLW. Feather
boa kelp had scattered occurrence on a variety of reefs from -10 feet to -25 feet MLLW. Sea fans were
sparse in occurrence on relatively higher (greater than two feet) portions of some reefs. Several of the
reefs, particularly at depths less than -10 feet MLLW and/or with lower relief heights were vegetated only
with opportunistic coralline turf algae.
No kelp canopy was mapped in the vicinity of the site in 1999. In 1997, the nearest kelp bed was over
2,000 feet south of the site (Table 3.4-2). Historically, kelp has occurred offshore in depths greater than
-20 feet MLLW. Historical persistence of kelp has been moderate at locations north of Agua Hedionda
Lagoon.
South Carlsbad North
Within Receiver Site Boundaries
This site is predominantly sand with localized cobble bands extending from the upper intertidal from 10 to
100 feet seaward to the mid tide zone. Sand depths during the May 1999 survey averaged five to seven
inches in the upper and mid intertidal zones and 19 inches in the lower intertidal. With the exception of
juvenile sand crabs, few organisms were observed in the shovel samples collected in May.
California grunion eggs were not observed in shovel samples collected during the May survey. Sand depths
were not sufficient in the upper and mid intertidal zones to support grunion egg laying in May. Beach width
also may have been limiting since damp sand was observed at the back of the beach, which is abutted by
a cliff along the length of the site.

3.4 Biological Resources
Page 3.4-20 Regional Beach Sand Project EIR/EA99-69\SANDAG EIREA 3.4.wpd 7/17/00
Nearby Sensitive Resources
The closest California least tern and western snowy plover nesting sites are located at Batiquitos Lagoon,
which is within two miles of the receiver site (Figure 3.4-1).
Nearshore waters are characterized by mostly sandy bottom with a patch of high-relief reef in the
northern/central part of the receiver site. The high-relief reef begins 525 feet offshore in -6 feet MLLW
at a distance of about 225 feet from the seaward boundary of the fill site (Table 3.4-2). Feather boa kelp
and sea palms were noted on the reef in 1997. No surface canopy of kelp was mapped in the vicinity in
1999, and the closest kelp bed in 1997 was approximately one mile south. Historically, kelp has occurred
offshore at depths greater than 20 feet above MLLW.
South Carlsbad South
Within Receiver Site Boundaries
Sand is the predominant habitat at this proposed receiver site. Sand depths averaged three inches in the
upper, 10 inches in the mid, and 15 inches in the lower intertidal. The site was revisited in July and sand
depths had increased four to ten-fold at specific locations and averaged 31 inches overall. Sand crabs,
polychaete worms, and bean clams were noted in the sand habitat. Only a few gulls were observed
foraging and resting at the site during the May 1999 survey.
During the May 1999 survey, 30 to 100 percent cobble bands occurred along the back beach in the upper
intertidal and less dense cobble cover extended up to 105 feet seaward in localized areas. During the July
1999 survey, dense cobble bands were pushed higher up the beach and did not extend more than about
40 feet from the bluff. Mid and low intertidal areas had less than cobble cover. No marine life was
observed on the cobble.
A hard substrate area (approximately 183 feet long) occurred in the lower intertidal between 1,251 and
1,434 feet south of the site’s northern boundary and 230 feet seaward of the back beach. The area
consisted of scattered low relief rocks and bench. The low relief rocks supported few marine resources.
Filamentous red algae was common and coralline algae and hermit crabs were sparse in occurrence.
3.4 Biological Resources
Regional Beach Sand Project EIR/EA Page 3.4-2199-69\SANDAG EIREA 3.4.wpd 7/17/00
California grunion eggs were not observed in shovel samples collected during the May or July 1999
surveys. Cobble cover and inadequate sand depths may have limited the ability of this site to support
grunion egg laying during the May survey. While sand depths were sufficient in the lower part of the upper
and mid intertidal zones, cobble cover was still dense in part of the upper intertidal during the July survey.
Nearby Sensitive Resources
The closest California least tern and western snowy plover nesting sites are at Batiquitos Lagoon, which
is about 1.8 miles south of the receiver site (Figure 3.4-1). A small inshore surfgrass patch occurs over
one mile south of the receiver site.
A localized low relief hard substrate area was observed over 250 feet south of the site’s southern
boundary. No sensitive resources were found. Filamentous red, coralline, and crustose red algae were
the only marine life observed on the rocks.
Nearshore waters are characterized by mostly sandy bottom with low-relief, scattered reef offshore most
of the site. This low-relief reef area begins 600 feet offshore in -5 to -10 feet MLLW, which is about 350
feet from the seaward boundary of the site (Table 3.4-2). Patchy surfgrass and feather boa kelp were
observed on the reef in 1997. Patches of high-relief reef occur south of the site, beginning 775 feet offshore
in -7 to -15 feet MLLW. Surfgrass and feather boa kelp were on those reef areas in 1997.
No kelp canopy was present in the vicinity of the site in 1999. The closest kelp bed in 1997 was about
one mile south (Table 3.4-2). Historically, kelp has occurred offshore the site at depths greater than 20
feet above MLLW.
Batiquitos
Within Receiver Site Boundaries
While much of the proposed receiver site is sand, during the May 1999 survey, a continuous band of 100
percent cobble was observed in the upper intertidal and extended up to 60 feet seaward of the back beach.
Bands of five to 70 percent cobble extended further seaward from the denser cobble band. Insufficient
sand occurred in the upper intertidal to record sand depth measurements. Sand depths ranged from four
3.4 Biological Resources
Page 3.4-22 Regional Beach Sand Project EIR/EA99-69\SANDAG EIREA 3.4.wpd 7/17/00
to 24 inches in the mid intertidal, 12 to 25 inches in the lower intertidal, and averaged 14 inches overall.
No marine life was observed on the cobble. Sand crabs and polychaetes occupied the sand habitat.
California grunion eggs were not observed in the shovel samples collected during the May 1999 survey.
Very shallow sand depths and extensive cobble cover in the upper intertidal may have been limiting to
grunion egg laying.
Nearby Sensitive Resources
Primary California least tern and western snowy plover nesting sites are located at Batiquitos Lagoon, R
which is about one-quarter mile inland from the receiver site. The W-2 plover nesting colony at Batiquitos R
Lagoon is approximately 500 feet from this receiver site, on the other side of the 101 Coast highway and R
jetty structure. R
Nearshore waters are characterized by mostly sandy bottom, with an area of low-relief, scattered reef and
a smaller patch of high-relief reef at the southern end of the site. The low-relief, scattered reef begins
approximately 625 feet offshore in -8 feet MLLW, which is about 150 feet seaward of the site boundary.
A small high-relief reef starts approximately 750 feet offshore in -10 feet MLLW. The low relief reef was
covered with scattered surfgrass and feather boa kelp in 1997.
No kelp canopy was mapped in 1999. In 1997, kelp canopy was mapped offshore. The inshore edge
was 1,875 feet offshore in -35 feet MLLW, which is about 1,500 feet from the seaward boundary of the
site (Table 3.4-2). The approximate size of this bed was 0.2 square miles. Historical maps indicate a
relatively high persistence of kelp in the vicinity of the site. During the January 2000 survey, giant kelp was
observed on reefs at depths greater than -30 feet MLLW.
Leucadia
Within Receiver Site Boundaries
The proposed receiver site is predominantly sand habitat. The site was first surveyed in July 1999. Sand
depths ranged from 6 to 41 inches, and averaged 19 inches in the upper and mid intertidal zones and 27
inches in the low intertidal zone. Sand crabs, bean clams, and polychaete worms were found in the sand
habitat.
3.4 Biological Resources
Regional Beach Sand Project EIR/EA Page 3.4-2399-69\SANDAG EIREA 3.4.wpd 7/17/00
With the exception of a small localized area that had a 40-foot wide band of dense cobble (100 percent
cover), cobble cover on the beach was sparse (less than 20 percent). Very localized occurrence of hard
substrate included a few rocks in the upper intertidal 2,900 feet south of the northern site boundary. No
marine life was found on the cobble or rock. One very small area (3.5 feet long by 6 inches wide) of
exposed sandstone was observed 350 feet seaward of the back beach (i.e., outside but adjacent to the
site’s seaward boundary) approximately 1,900 feet south of the northern site boundary. The sandstone
had a relief height of two inches and no marine life was observed.
California grunion eggs were not observed in shovel samples collected during the July survey. Sand depths
were sufficient and cobble cover was not extensive enough to have limited grunion egg laying during the
survey period.
Nearby Sensitive Resources
The closest California least tern and western snowy plover nesting sites are at Batiquitos Lagoon, which
is about one-half mile from the receiver site (Figure 3.4-1).
Inshore and intertidal surfgrass beds occur immediately north of the receiver site near Grandview Street,
and at several locations south of the site offshore Jason Street, offshore Diana Street, offshore Leucadia
Street, and offshore El Porto Street.
The nearshore habitats off Leucadia are mostly low-relief, scattered reef with patches of high-relief reef.
Low-relief reef begins just beyond the seaward boundary of the site and extends in the nearshore area
along the entire site (Table 3.4-2). The scattered, low-relief reef off the Leucadia site was covered with
scattered surfgrass, feather boa kelp, and giant kelp in 1997. An area of high-relief reef starts
approximately 700 feet offshore in -8 feet MLLW. An area of high-relief reef also occurs immediately to
the north of the site, approximately 725 feet offshore in -9 feet MLLW. The high relief patches were
vegetated with giant kelp, feather boa kelp, surfgrass, and sea palms.
No kelp canopy was mapped in the vicinity of the site in 1999. In 1997, kelp was found offshore at depths
greater than -20 feet MLLW, which is about 925 feet seaward of the site boundary (Table 3.4-2).
Historically, there has been a high persistence of kelp in the vicinity of the site.

3.4 Biological Resources
Page 3.4-24 Regional Beach Sand Project EIR/EA99-69\SANDAG EIREA 3.4.wpd 7/17/00
Moonlight Beach
Within Receiver Site Boundaries
While some of the site is sand habitat, during the May 1999 survey, 30 to 100 percent cobble bands
extended 30 to 80 feet seaward of the back beach. No marine life occurred on the cobble. Sand depths
averaged 3 inches in upper, 11 inches in the mid, and 21 inches in the lower intertidal zones. The mid and
lower intertidal sand habitat was occupied by sand crabs and polychaete worms.
California grunion eggs were not observed in shovel samples collected during the May 1999 survey.
Shallow sand depths and some cobble cover in the upper intertidal may have been limiting to grunion egg
laying during the survey period.
Nearby Sensitive Resources
The closest California least tern and western snowy plover nesting sites are at Batiquitos Lagoon, which
is about 2.5 miles from the receiver site (Figure 3.4-1).
The nearshore waters off Moonlight Beach are characterized by mostly sandy bottom, with a low-relief reef
starting 500 feet offshore in -6 feet MLLW, just north of the site at a distance of about 400 feet from the
seaward boundary of the site (Table 3.4-2). Scattered giant kelp, surfgrass, and feather boa kelp were R
found on the low-relief reef in 1997. The Encinitas City Marine Life Refuge lies immediately south of the R
site. Refer to Section 3.6. R
The nearshore area offshore the receiver site and extending further south nearly to I Street was surveyed
in January 2000 by side-scan sonar and by divers. One small reef (0.04 acre) had very sparse occurrence
of surfgrass (1 turion per 10 ft2 (4 m2)). Feather boa kelp was fairly ubiquitous but ranged from sparse to
common abundance on several reefs. Several reefs and scattered rock areas were only vegetated with
opportunistic coralline algal turf. They mainly occurred in water depths ranging between -10 and-20 feet
MLLW. Giant kelp, sea fans, and/or sea palms occurred on reefs at depths ranging from -20 to -35 feet
MLLW. Sea fans were on relative higher relief substrate (greater than two feet). Giant kelp occurrence
was sparse, but localized areas with juvenile plants indicate some recovery from the 1997 El Niño event.

3.4 Biological Resources
Regional Beach Sand Project EIR/EA Page 3.4-2599-69\SANDAG EIREA 3.4.wpd 7/17/00
No kelp canopy was mapped in the vicinity of the site in 1999. In 1997, giant kelp beds were found
offshore of the north end and to the south, off Santa Fe Drive. These beds were approximately 1,200 feet
offshore at depths greater than -20 feet MLLW. A small patch occurred approximately 1,200 feet directly
offshore at depths of -20 to -25 feet MLLW, and was about 850 feet seaward of the site boundary (Table
3.4-2). Historically, there has been a relatively high persistence of kelp in the vicinity of the site.
Cardiff
Within Receiver Site Boundaries
During spring lower low tides in May and July 1999, only about 150 feet of beach width at the receiver
site was exposed. With the exception of the rip-rap revetment that occurs at the north end of the site in
front of Restaurant Row, the site consisted of 80 to 100 percent cobble cover in the mid and upper
intertidal zones. The lower intertidal zone consisted of sand with moderate cobble cover. Sand depths in
the lower intertidal ranged from 14 to 28 inches with an overall average of 23 inches. No organisms were
found in samples from the mid and lower intertidal zones.
Common splash zone organisms such as acorn barnacle were found on the revetment. Juvenile sized
feather boa kelp (less than 24 inches) and goose-neck barnacles, which are species associated with
frequent inundation, were noted in localized areas on the revetment.
California grunion eggs were not observed in shovel samples collected during the May 1999 survey.
Extensive cobble cover in the upper intertidal did not provide habitat to support grunion egg laying.
Nearby Sensitive Resources
The closest California least tern and western snowy plover nesting sites are located at San Elijo Lagoon,
which is located just inland from the receiver site (Figure 3.4-1).
Inshore and intertidal surfgrass beds occur north of the receiver site on Cardiff reef located north of Dublin
Drive and further north offshore San Elijo State Beach.
3.4 Biological Resources
Page 3.4-26 Regional Beach Sand Project EIR/EA99-69\SANDAG EIREA 3.4.wpd 7/17/00
The subtidal area immediately adjacent to the site is sandy bottom. Reef occurs about 450 feet north of
the site at depths ranging from -5 to -20 feet MLLW. No surfgrass was observed at this location in 1995;
however, sea palms, coralline algae, and sea fans were common to abundant.
Low relief reef also occurs in the nearshore about 2,000 feet south of the site. The reef starts out as patch
reef and at about 2,500 feet south the reef is more extensively developed. Dense surfgrass was observed
in 1995 on more developed areas of the reef between -8 and -18 feet MLLW.
Giant kelp was noted during the January 2000 survey in deeper water (greater than 25 feet above MLLW)
on reefs and the San Elijo outfall pipe. A small canopy of kelp was mapped offshore and north of the
receiver site in 1999 (Table 3.4-2). Kelp beds were found to the north off Cardiff and to the south off the
southern portion of San Elijo Lagoon historically and in 1997. In 1997, the bed to the north began 1,200
feet offshore in -20 feet MLLW and extended into deeper waters. This bed was more than 0.25 square
mile in size. The bed to the south began 1,550 feet offshore in -25 to -35 feet MLLW. Some kelp was
also found along the San Elijo outfall pipe. Historically, there has been a high persistence of kelp just north
of the lagoon and a much more transitory persistence in the vicinity of the pipeline.
Solana Beach
Within Receiver Site Boundaries
The beach habitat is predominantly sand with some cobble. Sand depths ranged between two and 40
inches with an overall average of 14 in during the May 1999 survey. Depths measured at several of the
same locations in July 1999 indicated a build up of the beach over the two months following the survey.
The average sand depth in July 1999 was 21 inches in the upper, 25 inches in the mid, and 37 inches in the
low intertidal zones. Sand crabs, polychaete worms, and amphipod crustaceans occupied the sand habitat.
Cobble varied from being more dense in the northern half of the site to fairly sparse in the southern half.
Cobble cover exceeded 60 percent at Fletcher Cover during the May and July 1999 surveys and occurred
in dense bands along the cliff and extending out to 40 feet seaward further north. No marine life was
associated with the cobble.
Two reef areas were observed south of Fletcher Cove within the site boundaries during the minus tide
surveys and one was observed just south of the boundary. The beach site was surveyed in May and July
3.4 Biological Resources
Regional Beach Sand Project EIR/EA Page 3.4-2799-69\SANDAG EIREA 3.4.wpd 7/17/00
and a brief visit was made in June 1999. The amount of the exposed reef habitats differed between
surveys. The few marine resources observed on all three reefs indicated that the sites experience frequent
sand disturbance.
A 350-foot long area with patchy, low relief reef occurred in May 1999 between Fletcher Cove and South
Helix Street. The reef started 200 feet seaward of the cliff and extended offshore through the site’s
offshore boundary. Filamentous red algae was common on the rock and juvenile feather boa kelp was
sparse in occurrence. In July, sand had covered 200 feet of the reef and filamentous red algae was the only
resource observed on the 150-foot long patchy reef area.
A 250-foot long by 185-foot wide patchy, low relief reef area was observed between offshore South Helix
Street starting 60 feet seaward of the back beach both in May and July. With the exception of filamentous
and coralline red algae, which were common in occurrence, there were few biological resources. Very
sparse in occurrence were juvenile feather boa kelp (average size 22 inches), Ulva green algae, small leafy
brown and red algae, aggregated sea anemones (average size 21 inches), and chitons.
Just south of the southern end of the site, a small (80-foot long) patchy low relief area began about 200 feet
seaward of the back beach and extended offshore. Feather boa kelp (juvenile to adult size; average size
88 inches) was common in occurrence as was filamentous red algae. Other algae such as coralline and
small leafy red algae were sparsely distributed. The only invertebrates were hermit crabs, which were
sparse in occurrence.
California grunion eggs were not observed in shovel samples collected during the May and July 1999
surveys. Sand depths generally were insufficient in the upper intertidal during the May survey, but there
was sufficient sand in July. The narrow beach width probably would have been limiting to grunion laying
because waves were breaking at the base of the cliff on the incoming portion of the tide during both
surveys.
Nearby Sensitive Resources
The closest California least tern and western snowy plover nesting sites are located at San Elijo Lagoon,
which is located within one mile from the receiver site (Figure 3.4-1).
3.4 Biological Resources
Page 3.4-28 Regional Beach Sand Project EIR/EA99-69\SANDAG EIREA 3.4.wpd 7/17/00
Inshore intertidal surfgrass occurs at three sites north of the receiver site; one at the surf spot known as Pill
Box, another north of Tide Park, and a third further north at Table Tops reef.
Several intertidal reef areas outside the site boundaries were noted both north and south of the site. The
closest reef area to the north is a surfing location known as Pill Box. This consisted of a 145-foot long, high
relief reef area (starting 152 feet seaward of the cliff) and a low relief reef that extended further north (from
approximately 400 to 1,000 feet north of the northern site boundary) in May 1999. In July 1999, sand
build up had reduced the above ground height of most of that reef to 27 to 29 inches except at a distance
of approximately 270 feet seaward of the cliff. At that location, the reef height ranged up to 38 inches.
Resources on the high relief area were similar between the May and July surveys and included juvenile
feather boa kelp (average size 24 inches), Ulva green algae, small leafy brown and red algae, and sea
anemones (average size 29 inches). A 145-foot by 8-foot area of surfgrass occurred on the high relief reef
just seaward (268 feet from the cliff) of the site’s offshore boundary.
The low relief area supported filamentous and coralline red algae, Ulva green algae, small leafy brown
algae (e.g., Colpomenia, Dictyota/Pachydictyon sp.) feather boa kelp, and hermit crabs, which were
sparse to common in abundance. In July, a portion of the area was covered with sand, and in other areas
the low relief rock and reef ranged in height from zero (i.e., flush with sand) to eight inches. Filamentous
red algae, small leafy brown algae, and hermit crabs were common in abundance, and feather boa kelp was
very sparse in occurrence on the reef in July.
North of that location were two small patch reefs with little resource development in May 1999 that were
completely covered with sand in July 1999. Offshore Tide Park, more reef area was exposed in May than
in June and July. During the May 1999 survey, surfgrass, feather boa kelp, a variety of algae, several types
of snails (Lithopoma undosa, Kelletia kelletia, Ocenebra sp., Tegula sp.), sea hares, aggregated sea
anemones, and hermit crabs were observed. During a visit in June 1999 and the July 1999 survey, most
of the reef area was covered with sand. Surfgrass with patchy, feather boa kelp was lying on the sand
surface, algae (except filamentous red) was sparse in occurrence on any of the exposed rock, and hermit
crabs were the only visible invertebrates.
During the June 1999 site visit, it was noted that extensive mounds of turf algae and kelp were on the beach
at Tide Park. A City Parks Department bulldozer was clearing the beach of the accumulated material by
pushing it into the surfzone. During the July 1999 survey, this material was observed washed up on the
3.4 Biological Resources
Regional Beach Sand Project EIR/EA Page 3.4-2999-69\SANDAG EIREA 3.4.wpd 7/17/00
beach at the northern end of Tide Park and extended along the beach further north. It is suspected that
sand and/or cobble scour associated with the sand build-up had stripped the reef area of the algae.
Even further north is the extensively developed reef known as Table Tops. That reef had extensive
development of biological resources including a variety of algae and invertebrates, and substantial surfgrass
beds. Juvenile to adult sized California mussels, relatively large sea anemones, large colonies of sand castle
worm (Phragmatopoma californica), and a diverse range of resources at the site indicate that this is a
persistent reef area. Substantial sand build up also occurred at this site between June and July 1999 and
included partial burial of some surfgrass. Navy monitoring at this site records about three feet of sand build
up between the spring and fall of 1999. This location is one of the sites currently being monitored by the
Navy as part of the permit conditions associated with the previous Homeporting project (refer also to
Section 2.5). Monitoring will continue here until 2001.
The closest reef to the south was located approximately 600 feet south of the southern site boundary. It
consisted of a 459-foot-long area with patchy reef. With the exception of four rocks (each about 6 feet
wide) that were 27 inches in height, exposed sandstone benches were either flush with the sand or only a
few inches in height. Common in occurrence were feather boa kelp (average size 71 inches), a variety of
turf algae, aggregated sea anemones, and hermit crabs. Although this site was only visited in July 1999,
the occurrence of feather boa kelp on the surface of the sand in several places indicates that sand build up
had also occurred at this site since May 1999.
The next closest reef area to the south was located over 1,600 feet south of the southern site boundary.
Both low and high relief benches and rocks were present in the upper intertidal through minus tide zones.
Feather boa kelp (juvenile to adult sizes, average size 28 inches), a variety of red turf algae, Ulva green
algae, small leafy brown algae, sea anemones, California mussel, Acanthina snails, limpets, hermit crabs,
and striped shore crabs were present. There was fairly high public use of the rocky intertidal area during
the July 1999 survey.
A side-scan sonar survey was conducted offshore between Tide Park and Pill Box reef in January 2000,
however, surface kelp canopy interfered with acquisition of side-scan sonar maps for part of the site.
Storm conditions with large swell and surf have limited dives at this site later in January and February 2000.
The side-scan sonar maps indicate predominantly low relief reef, although high relief associated with the
Pill Box reef to the south and high relief to the north was mapped within the extent of survey boundary.
Limited diver surveys have verified some reef heights under the kelp canopy, and assessed resources on
3.4 Biological Resources
Page 3.4-30 Regional Beach Sand Project EIR/EA99-69\SANDAG EIREA 3.4.wpd 7/17/00
some reefs mapped outside the kelp canopy. In some locations, the kelp that was present in January 2000
had been eliminated by storms in February 2000.
No kelp canopy was mapped within one mile of the site in 1999. In 1997, kelp beds were mapped
offshore the site. The shallowest portions of these large beds were in -15 to -30 feet MLLW, about 1,075
to 2,000 feet offshore (Table 3.4-2). The large bed in the northern portion of the site was approximately
0.2 square mile, and the large bed in the southern portion was 0.1 square mile in size. Historically, there
has been a relatively high persistence of kelp in the vicinity of the site.
Del Mar
Within Site Boundaries
The proposed site is predominantly sand habitat. Sand depths ranged between seven and 25 inches with
an overall average of 14 inches in May. Sand crabs and polychaete worms occupied the sand habitat.
Boulders occurred in localized areas along the back beach and a small sandstone bench was exposed in
the upper intertidal at the south end of the site. A more extensive sandstone bench occurred in the upper
intertidal immediately south of the site. Cobble was very localized to sparse on the beach. No marine life
was observed on any of these hard substrate areas.
California grunion eggs were not observed in shovel samples collected during the May survey. While sand
depths may have been sufficient to support grunion, and cobble cover was not extensive enough to have
limited grunion egg laying, beach width may have been a limiting factor. The upper intertidal had damp sand
to the back of the beach, which had a narrow, steep slope, bluff, or revetment along its length.
Nearby Sensitive Resources
The closest California least tern and western snowy plover nesting sites are located at San Dieguito
Lagoon, which is located less than one mile from the receiver site (Figure 3.4-1).
Inshore intertidal surfgrass occurs in extensive patches south of the receiver site from near 15th Street to
4th Street.

3.4 Biological Resources
Regional Beach Sand Project EIR/EA Page 3.4-3199-69\SANDAG EIREA 3.4.wpd 7/17/00
Commercial fishermen provided information that reef and scattered rock occurs offshore and south of the
Del Mar site. Surveys by the Navy in 1994 documented sand at the -10, -20, and -30 feet depth contours
offshore the site. No kelp canopy was mapped in the vicinity of the site in 1999. In 1997, the nearest kelp
bed was over 3,000 feet to the north. Historical mapping indicates that kelp has occurred offshore from
the south end of the site and up to about 6,000 feet further south. While conflicting reports of the
occurrence of hard substrate offshore Del Mar exist, the locations of intertidal surfgrass and historic kelp
beds indicate that the more sensitive hard substrate habitats occur south of the receiver site.
Commercial fishermen also reported occurrence of scattered rock and reef habitat north of the site and San
Dieguito Lagoon. The side-scan sonar survey in January 2000 included the closest scattered rock area
to the north. Scattered rock and reef were noted at depths between -10 and -20 feet MLLW. Dives in
February and March 2000 to assess resources on hard substrate in this area found that all the substrate was
vegetated with opportunistic coralline turf.
Torrey Pines
Within Site Boundaries
The proposed site consists of sand habitat with cobble. During the May 1999 survey, sand occurred
mainly in the mid and low intertidal zones. Cobble occurred in a dense band (100 percent cover) three to
100 feet wide from the back beach, and a band with about 30 percent cobble cover occurred seaward of
that for most of the site. In July, cobble cover was restricted to a narrow band (20 feet wide) in the upper
intertidal from the mid to south end of the site.
Sand depths were very shallow in the upper intertidal (average of 5 inches), moderate in the mid (average
of 18 inches), and deeper in the low intertidal (average of 42 inches) during the May 1999 survey. By July
1999, there had been substantial build up of sand with average sand depths of 34 inches in the upper
intertidal, 36 inches in the mid, and 46 inches in the low intertidal zones. Sand habitat was occupied by
sand crabs, polychaete worms, and bean clams. One dead sand dollar was noted in the low intertidal
during the May beach survey and four dead sand dollars were noted in July 1999. This indicates the
presence of offshore sand dollar beds in the vicinity of the site.
California grunion eggs were not observed in shovel samples collected during the May and July surveys.
Sand depths were insufficient and cobble cover was dense in the upper intertidal in May. In July sand
3.4 Biological Resources
Page 3.4-32 Regional Beach Sand Project EIR/EA99-69\SANDAG EIREA 3.4.wpd 7/17/00
depths were sufficient and dense cobble was more restricted in occurrence and thus not limiting to grunion
egg laying. However, beach may not have been wide enough. The upper intertidal had damp sand to the
back of the beach, which had bluff or revetment along its length.
Nearby Sensitive Resources
The closest California least tern and western snowy plover nesting sites are located at Los Peñasquitos
Lagoon within less than one mile from the receiver site (Figure 3.4-1).
Nearshore habitats are mostly sandy bottom with a small amount of low-relief, scattered reef at the
southern end of the site. This reef begins approximately 825 feet offshore between -10 and -15 feet
MLLW, which is about 650 feet seaward of the site boundary and extends into deeper waters (Table 3.4-
2). A large, wide area of low-relief, scattered reef, extending from the intertidal to the subtidal, is found
immediately south of the Torrey Pines site. Inshore intertidal surfgrass beds also occur south of the site.
No kelp canopy was mapped offshore in 1999. In 1997, giant kelp was found in only one small, offshore
patch south of the site. This patch was 2,000 feet offshore in -35 feet MLLW and was located about
3,000 feet from the site (Table 3.4-2). Historically, there has been a relatively high persistence of kelp
about 4,500 feet north of the site.
Mission Beach
Within Site Boundaries
The proposed site consists entirely of sand habitat. Sand crabs, bean clams, and polychaete worms
occupied the sand habitat. A dead sand dollar was observed on the beach, which suggests the presence
of offshore sand dollar beds in the vicinity of the site. Sand depths ranged from 15 to greater than 48
inches and averaged 40 inches in the upper, 19 inches in the mid, and 29 inches in the low intertidal.
California grunion eggs were not observed in shovel samples collected during the May survey. Sand depths
were sufficient to support grunion egg laying and the site was sampled four days after a new moon. The
upper intertidal showed evidence of recent beach grooming and it is not known to what extent (if any) that
had on the lack of observed eggs.
3.4 Biological Resources
Regional Beach Sand Project EIR/EA Page 3.4-3399-69\SANDAG EIREA 3.4.wpd 7/17/00
Nearby Sensitive Resources
Western snowy plover sites are located at the south end of Mission Beach and at Mission Bay where
California least tern nests also occur (Figure 3.4-1). All sites are located less than one mile away, and the
Mission Beach snowy plover nest sites are within one-half mile.
Nearshore habitat is sand. Artificial reefs and numerous sunken vessels are known to occur offshore. The
nearest hard bottom feature is the NOSC Tower at -60 feet MLLW located approximately 4,500 feet from
the receiver site (refer also to Section 3.6). No kelp canopy was mapped in 1999 in the vicinity of the site.
In 1997, small patches of kelp were found offshore of the northern half of the site and to the north of the
site. These patches were 1,150 feet offshore between -15 and -25 feet MLLW, which was about 800 feet
seaward of the site boundary (Table 3.4-2). Historically, kelp does not occur with any regularity or
persistence off Mission Beach.
Imperial Beach
Within Site Boundaries
Sand is the predominant intertidal habitat; however, an extensive band of 80 to 100 percent cobble
extended up to 110 feet from the back beach throughout most of the site. During the May 1999 survey,
the beach width was wider at the north end of the site and about 100 feet narrower towards the south end.
Rip-rap revetment occurred the length of the site at the back beach. Sand depths were highly variable in
the upper and mid intertidal zones (4 to greater than 48 inches), and generally deeper in the low intertidal
(28 to greater than 48 inches). Sand depths averaged 18 inches in the upper, 15 inches in the mid, and 34
inches in the low intertidal.
Sand crabs, bean clams, and polychaete worms were found in the sand habitat. No marine life was
observed on the cobble. Common splash zone organisms such as Enteromorpha, acorn barnacle, and
limpets were noted on the revetment in areas where it was closer to the water.
California grunion eggs were not observed in shovel samples collected during the May survey. Sand depths
were sufficient to support grunion egg laying and the site was sampled four days after a new moon. Dense
cobble cover over most of the upper intertidal and/or narrow beach width probably limited potential habitat
for grunion along most of the site.
3.4 Biological Resources
Page 3.4-34 Regional Beach Sand Project EIR/EA99-69\SANDAG EIREA 3.4.wpd 7/17/00
Nearby Sensitive Resources
The closest western snowy plover and California least tern nesting locations are located within
approximately one mile of the receiver site at Tijuana Estuary (Figure 3.4-1). Nearshore habitat is sand
and no sensitive hard bottom resources are known to occur immediately offshore.
No kelp canopy was mapped in the vicinity of the site in 1999. In 1997, giant kelp was found beginning
at 2,250 feet offshore of Imperial Beach at a depth of -20 feet MLLW and extending to a depth of -35 feet
MLLW. The inshore edge of the kelp was about 1,900 feet seaward of the site boundary (Table 3.4-2).
This kelp bed was approximately 0.5 square mile in size. Historically, kelp persistence has been relatively
low to moderate in the vicinity of the site.
3.4.4 Borrow Sites
Site specific information at and/or near the borrow sites includes data from NPDES wastewater monitoring
studies for San Elijo Joint Powers (Encinitas/Solana Beach) and Encina Wastewater Facility (Carlsbad),
regional monitoring studies coordinated by SCCWRP, City of San Diego Monitoring Studies for their
ocean outfalls, and sampling at borrow sites SO-5 and SO-7. Representative monitoring stations were
considered with locations at or near the proposed borrow sites.
Because the proposed borrow sites would be located at similar depths and have relatively similar sediment
type, they have many species in common (Table 3.4-3). The fish and epibenthic macroinvertebrate
communities in each borrow site are also well known and inhabited by species common throughout the
Bight. Table 3.4-4 summarizes the fish species encountered at various representative locations near or at
the borrow sites.
Species within all the borrow sites are typical for their water depth and tend to be common throughout the
Bight. There are no threatened, endangered, or sensitive species within any of the borrow sites. Detailed
descriptions of the sampling results at SO-7 and SO-5 undertaken for this project are provided in
Appendix D.
The focus on this text below is to disclose the proximity of specific borrow sites, pipeline routes or mono
buoy locations to areas of hard-bottom substrate.
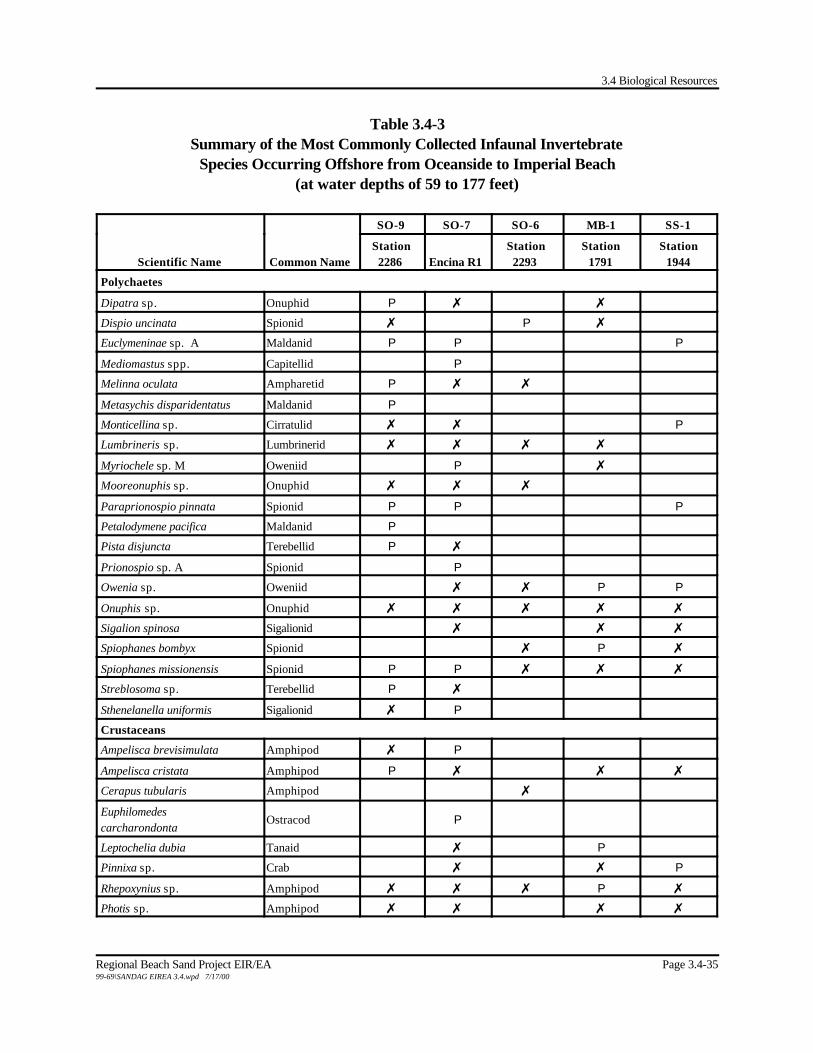
3.4 Biological Resources
Regional Beach Sand Project EIR/EA Page 3.4-3599-69\SANDAG EIREA 3.4.wpd 7/17/00
Table 3.4-3Summary of the Most Commonly Collected Infaunal Invertebrate
Species Occurring Offshore from Oceanside to Imperial Beach(at water depths of 59 to 177 feet)
Scientific Name Common Name
SO-9 SO-7 SO-6 MB-1 SS-1
Station2286 Encina R1
Station2293
Station1791
Station1944
Polychaetes
Dipatra sp. Onuphid P X X
Dispio uncinata Spionid X P X
Euclymeninae sp. A Maldanid P P P
Mediomastus spp. Capitellid P
Melinna oculata Ampharetid P X X
Metasychis disparidentatus Maldanid P
Monticellina sp. Cirratulid X X P
Lumbrineris sp. Lumbrinerid X X X X
Myriochele sp. M Oweniid P X
Mooreonuphis sp. Onuphid X X X
Paraprionospio pinnata Spionid P P P
Petalodymene pacifica Maldanid P
Pista disjuncta Terebellid P X
Prionospio sp. A Spionid P
Owenia sp. Oweniid X X P P
Onuphis sp. Onuphid X X X X X
Sigalion spinosa Sigalionid X X X
Spiophanes bombyx Spionid X P X
Spiophanes missionensis Spionid P P X X X
Streblosoma sp. Terebellid P X
Sthenelanella uniformis Sigalionid X P
Crustaceans
Ampelisca brevisimulata Amphipod X P
Ampelisca cristata Amphipod P X X X
Cerapus tubularis Amphipod X
Euphilomedescarcharondonta
Ostracod P
Leptochelia dubia Tanaid X P
Pinnixa sp. Crab X X P
Rhepoxynius sp. Amphipod X X X P X
Photis sp. Amphipod X X X X
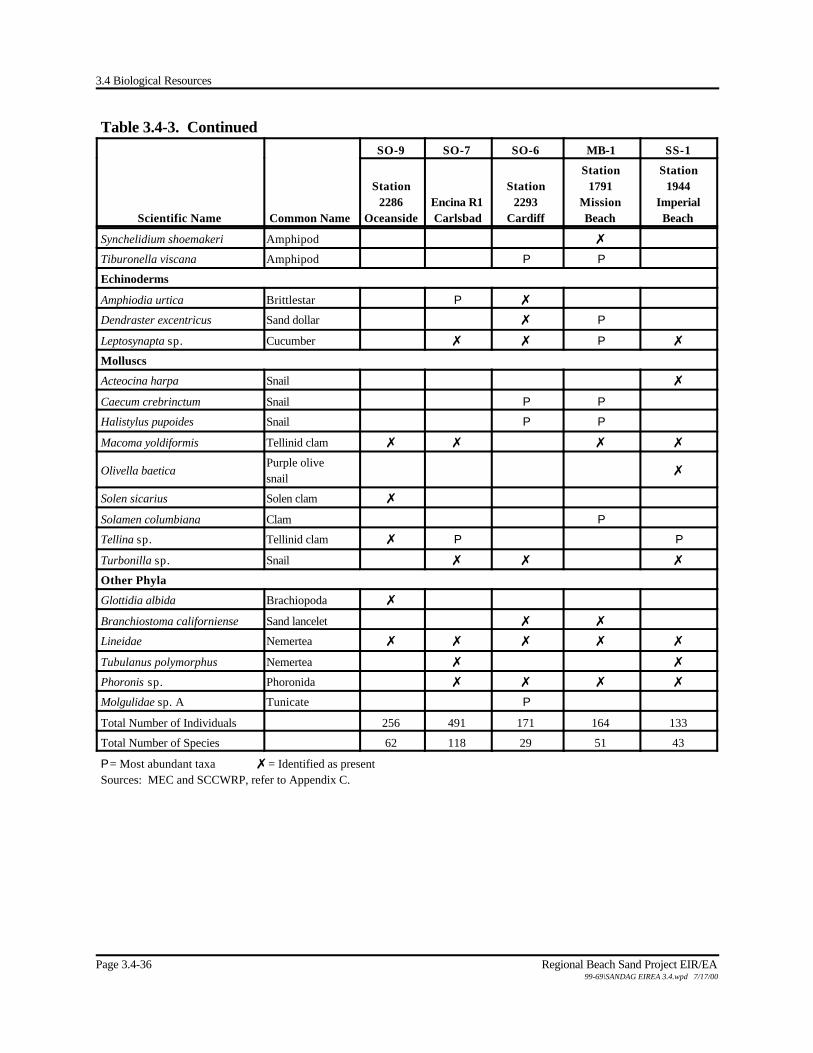
3.4 Biological Resources
Page 3.4-36 Regional Beach Sand Project EIR/EA99-69\SANDAG EIREA 3.4.wpd 7/17/00
Table 3.4-3. Continued
Scientific Name Common Name
SO-9 SO-7 SO-6 MB-1 SS-1
Station2286
OceansideEncina R1Carlsbad
Station2293
Cardiff
Station1791
MissionBeach
Station1944
ImperialBeach
Synchelidium shoemakeri Amphipod X
Tiburonella viscana Amphipod P P
Echinoderms
Amphiodia urtica Brittlestar P X
Dendraster excentricus Sand dollar X P
Leptosynapta sp. Cucumber X X P X
Molluscs
Acteocina harpa Snail X
Caecum crebrinctum Snail P P
Halistylus pupoides Snail P P
Macoma yoldiformis Tellinid clam X X X X
Olivella baeticaPurple olivesnail
X
Solen sicarius Solen clam X
Solamen columbiana Clam P
Tellina sp. Tellinid clam X P P
Turbonilla sp. Snail X X X
Other Phyla
Glottidia albida Brachiopoda X
Branchiostoma californiense Sand lancelet X X
Lineidae Nemertea X X X X X
Tubulanus polymorphus Nemertea X X
Phoronis sp. Phoronida X X X X
Molgulidae sp. A Tunicate P
Total Number of Individuals 256 491 171 164 133
Total Number of Species 62 118 29 51 43
P = Most abundant taxa X = Identified as presentSources: MEC and SCCWRP, refer to Appendix C.

3.4 Biological Resources
Regional Beach Sand Project EIR/EA Page 3.4-3799-69\SANDAG EIREA 3.4.wpd 7/17/00
Table 3.4-4Summary of Fish Collected By Otter Trawls Offshore from Oceanside to Imperial Beach
(at water depths of 55 to 100 feet)
Scientific Name Common Name
SO-9 SO-7 SO-6 SO-5 MB-1 SS-1Stations
1650,2286,2288
ProjectSpecific(1)
Station2293
ProjectSpecific(1)
Station1766,1780
Stations1944,2335
Anisotremus davidsoni Sargo X XChitonotus pugetensis Roughback sculpin X
Citharichthys stigmaeus Speckled sanddab X P P P P P
Citharichthys xanthostigma Longfin sanddab P P X X X
Cymatogaster aggregata Shiner perch XGenyonemus lineathus White croaker P P
Halichoeres semicinctus Rock wrasse X XHippoglossina stomata Bigmouth sole P X
Hypsopsetta guttulata Diamond turbot XLepidogobius lepidus Bay goby X
Menticirrhus undulatus California corbina XMyliobatis californica Bay ray X
Paralabrax nebulifer Barred sand bass P P X X X XParalichthys californicus California halibut P P P P P
Peprilus simillimus Pacific butterfish XPhanerodon furcatus White surfperch XPlatyrhinoidis triseriata Thornback X X X
Pleuronectes vetulus English sole X X P X P
Pleuronichthys ritteri Spotted turbot X X X
Pleuronichthys verticalis Hornyhead turbot P X P
Porichthys myriaster Specklefin midshipman X X
Rhacochilus toxotes Rubberlip surfperch XScorpaena guttata California scorpionfish X P P
Seriphus politus Queenfish P
Symphurus atricauda California tongue fish XSynodus lucioceps California lizardfish P P P P P P
Xystreurys liolepis Fantail sole P X P X P
P = Most abundant in trawl X = Identified as present(1) Otter trawls at these locations undertaken for this projectSources: MEC and SCCWRP, refer to Appendix C.

3.4 Biological Resources
Page 3.4-38 Regional Beach Sand Project EIR/EA99-69\SANDAG EIREA 3.4.wpd 7/17/00
SO-9
The species found at this borrow site are typical for this water depth and are common throughout the
project area. As shown in Table 3.4-5, other than 12 small artificial CDFG reefs, borrow site SO-9 is R
generally distant from known sensitive resources and habitats. The dredge area has been designed to R
provide a minimum 500-foot buffer zone to the nearest artificial CDFG reef. A previously unmapped R
experimental reef was identified during public review of side-scan sonar data. SO-9 has been modified R
to provide a 350-foot buffer from that small complex of scattered rock. It should be noted that during final R
design, this borrow site may be eliminated, but impacts are addressed for purposes of full disclosure. R
Proposed pipeline routes for onshore transport of sand appear to be clear of sensitive resources although
there may be some scattered rock near the proposed pipeline route.
SO-7
The SO-7 borrow site is complex and constrained by artificial reefs along the eastern edge and inshore
hard bottom and potential kelp habitat to the north and south. However, sampling at this location in June
of 1999 did not observe kelp near this site. The dredge area has been designed to provide a minimum
350-foot buffer zone to the nearest artificial reef and potential kelp habitat areas. The nearest nearshore
reef area appears to be approximately 2,000 feet from the borrow site and there are no artificial reefs in
the dredge area (Table 3.4-5). There may be scattered rock and low relief reef near proposed pipeline
and mono buoy locations. The borrow site maybe expanded north and west if SO-9 and/or SO-6 are not R
utilized, to be determined in final design. R
SO-6
While most of the species observed during monitoring near this borrow site are species common throughout
the Bight, some are more representative of coarse sand sediments. These tend to be less common than
those species associated with sand and silt/sand sediments.
Borrow site SO-6 is located near sensitive resources and habitats including nearshore reefs located about
500 feet from borrow site footprint and adjacent areas that historically have supported kelp at different
times. To the south is the San Elijo outfall pipe and a 350-foot buffer zone from the outfall pipe has been
incorporated into location of the dredge area. As shown in Table 3.4-5, hard bottom reef areas may exist
along pipeline and mono buoy locations.

3.4 Biological Resources
Regional Beach Sand Project EIR/EA Page 3.4-3999-69\SANDAG EIREA 3.4.wpd 7/17/00
SO-5
The soft bottom habitat within SO-5 contains a mixture of coarse sand and sand/silt sediments. Fish,
infaunal and macroinvertebrates, are common and similar to other locations in the Bight and the project
itself. As shown in Table 3.4-5, the SO-5 borrow site has few constraints and the dredge area is located
over 500 feet from reefs and over 600 feet from historical kelp areas. Proposed pipeline and mono buoy
locations may be near potential reef and kelp habitat.
MB-1
The sand sediments within this borrow site tend to be coarser sands than found at other borrow sites. As
shown in Table 3.4-3, the species list from the monitoring station near this borrow site contains many of
the common infaunal species found throughout the Bight for the inner shelf community but also contains
some species indicative of coarser sandy sediments (e.g., sand dollars, the amphipod Tiburonella viscana,
and the presence of the sand lancelet).
There are several artificial reefs and sunken wrecks which support sensitive resources located near the
MB-1 borrow site, so the dredge area has been located to maximize the buffer zone to all resources (Table
3.4-5). The nearest artificial reef is the Mission Bay Bridge Wreckage Site No. 1 located approximately
1,000 feet to the south. Other sunken structures are the NOSC Tower and the Ruby E, which are 1,500
and 2,000 feet distant, respectively (refer also to Section 3.6). There are no resources near proposed
pipeline locations and mono buoy locations.
SS-1
Table 3.4-3 presents the species list and abundance for Monitoring Station 1944, located upcoast from
this borrow site. While species present at this location are typical species found throughout the Bight, this
location tends to have fewer organisms than borrow sites further to the north.
As shown in Table 3.4-5, there are no sensitive resources or habitats in close proximity to the proposed
borrow site. No kelp canopy was mapped in the vicinity in 1999. In 1997 kelp was mapped about 3,000
feet north of the site. Kelp bed persistence off Imperial Beach is low to moderate.

3.4 Biological Resources
Page 3.4-40 Regional Beach Sand Project EIR/EA99-69\SANDAG EIREA 3.4.wpd 7/17/00
Table 3.4-5Closest Distance to Sensitive Resources from the Dredge Area Boundaries
Borrow Site
Distance(ft)
Offshore
Distance(ft)
Offshore to –30 to –40
MLLW
SensitiveResources at
PotentialMono Buoy
Location
SensitiveResources
along SinkerPipelineRoute
Approximate Distance (ft) to Sensitive Habitats From Closest Dredge Area Boundary
Nearshore Reef
ArtificialReef
1999 KelpCanopy
1997 KelpCanopy
1976-1996 KelpCanopy
SunkenVessel orDebris Pipeline
SO-9 6,000 2,625-4,500 Potentiallyscattered rocks
No 2,000 500(2) 30,000 30,000 30,000 No 18,000 fromOceanside
SO-7 3,000 1,500-1,875 Potentiallyscattered rocksand/or reef
Potentiallyand/or reef
500 350 18,000 500 500 No No
SO-6 4,125 1,680-2,438 Potentially reef,kelp
Potentially reef 500 2,250 3,000 500 500 250 350 fromSan Elijo
SO-5 4,125 1,875-2,625 Potentially reef Potentially reef 500 None invicinity
15,000 3,300 600 No No
MB-1 4,690 1,875-3,000 No No None invicinity
1,000 None invicinity
2,300 2,300(1) MB Bridge1,000' south,NOSC Tower1,500' east
No
SS-1 4,300 2,400-4,875 No No None invicinity
None invicinity
None invicinity
3,000 3,000(1) No 2,250-fromCity of SanDiegoOutfall
Note: Distance offshore to –30 to –40 MLLW provides indication of anchorage depth of mono buoy(1) Assumed approximately the same historical kelp cover as in 1997.(2) At SO-9, 500 feet minimum between mapped CDFG artificial reefs but 350 feet from previously unmapped experimental rock scatter. R
3.5 Cultural Resources
Regional Beach Sand Project EIR/EA Page 3.5-199-69\SANDAG EIREA 3.5 to 3.12.wpd 7/17/00
3.5 CULTURAL RESOURCES
Cultural resources are prehistoric and historic period sites structures, objects, districts, or other places with
evidence of human activity that are considered significant to a community, culture, or ethnic group.
Significant cultural resources are referred to as historic properties under federal law and meet one or more
criteria for eligibility for nomination to the National Register of Historic Places (NRHP). Under CEQA,
important or significant resources are those that meet one or more of the evaluation criteria for the
California Register of Historic Places.
Cultural resource investigations for the Regional Beach Sand Project were directed at assessing the effects
of the proposed undertaking on significant cultural resources, as mandated under the National Historic
Preservation Act (NHPA) and CEQA, and their implementing regulations and guidelines. The area of
potential effect (APE) for cultural resources encompasses the proposed offshore borrow sites and
associated anchor zones, along with the sand transport corridor, and receiver sites. This section provides
a summary of the cultural resources potential of the various project features based on a review of archival
literature (including shipwreck data bases, government baseline studies, and historic charts), informant
interviews, as well as study of geophysical survey and sediment core data. It also provides a brief overview
of the prehistoric and historic cultural setting, particularly underwater resources. The complete technical
report is provided as Appendix E (bound separately).
Background
Near Surface Geology
During the past 20,000 years the earth has experienced a glacial retreat, with an accompanying rise in sea
level. At 10,000 before present (B.P.) the global sea level averaged about 100 feet below the present
shoreline. The gradual rate of sea level rise from 10,000-5,000 B.P. may have produced many estuaries
and coastal lagoons. Present-day sea level was attained by about 3,000 B.P., allowing sedimentation to
nearly completely fill the previous coastal bays and lagoons.
Prehistoric Cultural Setting
Most archaeologists generally agree that manifestations of three major prehistoric cultural traditions exist
in San Diego: the San Dieguito Complex (a Paleo-Indian tradition); the La Jolla Complex (a regional
expression of the Milling Stone Horizon); and the Late Prehistoric Complex, designated as Yuman
3.5 Cultural Resources
Page 3.5-2 Regional Beach Sand Project EIR/EA99-69\SANDAG EIREA 3.5 to 3.12.wpd 7/17/00
(Kumeyaay-Ipai) or Shoshonean (Luiseño). These traditions/complexes cover a broad time span with the
San Dieguito Complex dating from 10,000 or before to 7,500 B.P., the La Jolla 7,500 to 3,000 B.P., and
the Late Prehistoric 3,000 to 2,000 B.P.
At the time of contact with Europeans, the local Native American peoples were utilizing numerous coastal
resources including shellfish, seaweed, shore birds, and fish. Archaeological evidence indicates that lagoon
and other coastal areas have attracted human activity throughout much of prehistory.
The San Diego region has cultural resources that are documented to be more than 9,000 years old. Recent
dating of cultural materials on the southern California Channel Islands suggests that materials as old as
11,000 years may be expected in the San Diego region. What is known of prehistoric settlement locations
in the San Diego region suggests that the coastal zone was highly desirable. Since the shoreline held
significant subsistence resources for prehistoric peoples, it is expected that many cultural resources dating
from the 10,000-year or younger period are located in the offshore zone. Given the concentration of sites
along the modern shoreline, it is reasonable to expect that submerged sites would also exist along
paleoshore lines dating from the 10,000 - 3,000 B.P. time period. Archaeological evidence for these sites
may still exist despite their being subjected to a rising sea level, leading to their submergence. Indeed, the
rising sea level might have created favorable ecological setting in certain areas, such as embayments and
estuaries, and these now submerged features may have concentrated local populations and settlement
patterns.
Numerous prehistoric artifacts have been reported by divers in the nearshore zone of the San Diego region.
Three main theories have been suggested to explain why those resources would be offshore. They may
be artifacts carried offshore by the erosion of onshore coastal sites. They may be objects which fell from
prehistoric sea-going craft. They may be artifacts that represent the remains of offshore prehistoric sites,
dating from periods when that location was not submerged, but which are presently exposed on the sea
floor.
Table 3.5-1 lists prehistoric artifact localities reported offshore from San Diego County. At least 37
offshore artifact localities have been reported between San Elijo Lagoon south to the Mexican border. All
of these sites, with the exception of the La Jolla Beach and Tennis Club site (Site Number 11) and the
Solana Beach (Site Number 36) site, report relatively small numbers of artifacts. The best documented
submerged archaeological site in San Diego County is offshore from the La Jolla Beach and Tennis Club
where more than 2,000 stone mortars have been recovered at water depths of up to 90 feet. In addition,
this site has yielded stone pestles, metate fragments, manos, and grooved stones that may have been used
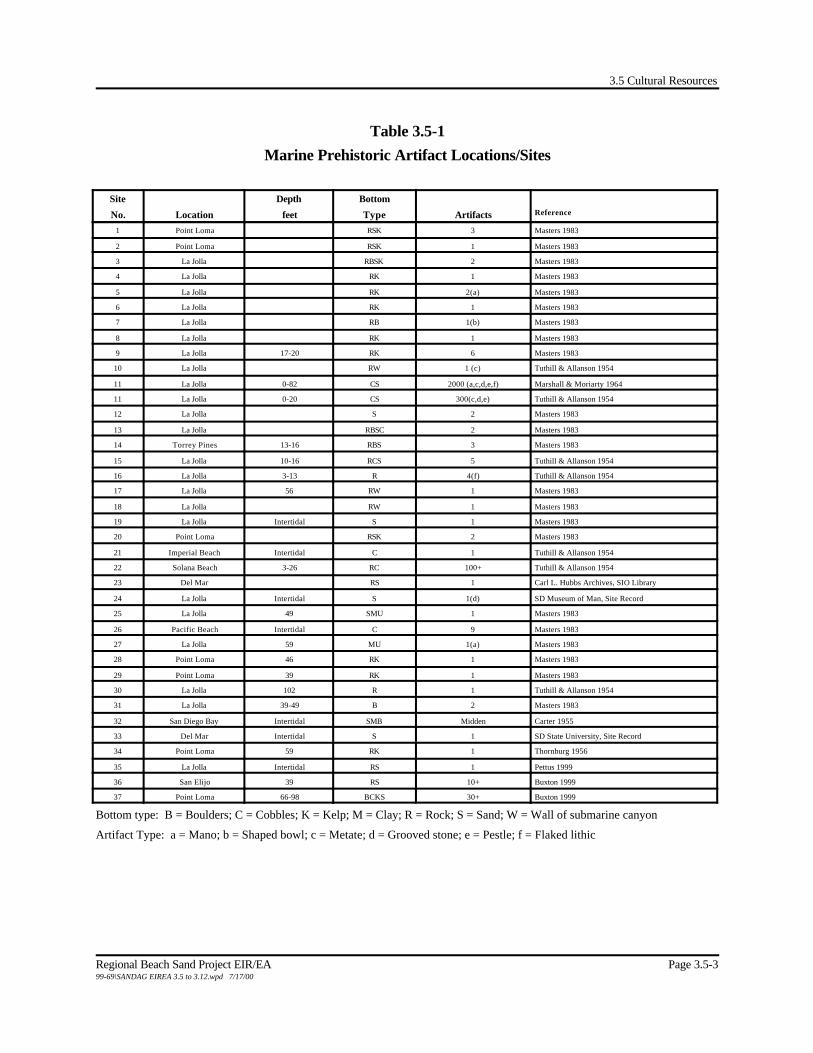
3.5 Cultural Resources
Regional Beach Sand Project EIR/EA Page 3.5-399-69\SANDAG EIREA 3.5 to 3.12.wpd 7/17/00
Table 3.5-1Marine Prehistoric Artifact Locations/Sites
Site
No. Location
Depth
feet
Bottom
Type Artifacts Reference
1 Point Loma RSK 3 Masters 1983
2 Point Loma RSK 1 Masters 1983
3 La Jolla RBSK 2 Masters 1983
4 La Jolla RK 1 Masters 1983
5 La Jolla RK 2(a) Masters 1983
6 La Jolla RK 1 Masters 1983
7 La Jolla RB 1(b) Masters 1983
8 La Jolla RK 1 Masters 1983
9 La Jolla 17-20 RK 6 Masters 1983
10 La Jolla RW 1 (c) Tuthill & Allanson 1954
11 La Jolla 0-82 CS 2000 (a,c,d,e,f) Marshall & Moriarty 1964
11 La Jolla 0-20 CS 300(c,d,e) Tuthill & Allanson 1954
12 La Jolla S 2 Masters 1983
13 La Jolla RBSC 2 Masters 1983
14 Torrey Pines 13-16 RBS 3 Masters 1983
15 La Jolla 10-16 RCS 5 Tuthill & Allanson 1954
16 La Jolla 3-13 R 4(f) Tuthill & Allanson 1954
17 La Jolla 56 RW 1 Masters 1983
18 La Jolla RW 1 Masters 1983
19 La Jolla Intertidal S 1 Masters 1983
20 Point Loma RSK 2 Masters 1983
21 Imperial Beach Intertidal C 1 Tuthill & Allanson 1954
22 Solana Beach 3-26 RC 100+ Tuthill & Allanson 1954
23 Del Mar RS 1 Carl L. Hubbs Archives, SIO Library
24 La Jolla Intertidal S 1(d) SD Museum of Man, Site Record
25 La Jolla 49 SMU 1 Masters 1983
26 Pacific Beach Intertidal C 9 Masters 1983
27 La Jolla 59 MU 1(a) Masters 1983
28 Point Loma 46 RK 1 Masters 1983
29 Point Loma 39 RK 1 Masters 1983
30 La Jolla 102 R 1 Tuthill & Allanson 1954
31 La Jolla 39-49 B 2 Masters 1983
32 San Diego Bay Intertidal SMB Midden Carter 1955
33 Del Mar Intertidal S 1 SD State University, Site Record
34 Point Loma 59 RK 1 Thornburg 1956
35 La Jolla Intertidal RS 1 Pettus 1999
36 San Elijo 39 RS 10+ Buxton 1999
37 Point Loma 66-98 BCKS 30+ Buxton 1999
Bottom type: B = Boulders; C = Cobbles; K = Kelp; M = Clay; R = Rock; S = Sand; W = Wall of submarine canyon
Artifact Type: a = Mano; b = Shaped bowl; c = Metate; d = Grooved stone; e = Pestle; f = Flaked lithic
3.5 Cultural Resources
Page 3.5-4 Regional Beach Sand Project EIR/EA99-69\SANDAG EIREA 3.5 to 3.12.wpd 7/17/00
as net weights as well as flaked lithics. The 14 localities reported in kelp beds (Table 3.5-1) may be the
result of loss from prehistoric sea-faring craft. It has been speculated that kelp rafting may also be
responsible for transporting artifacts along the shelf. The distribution of reported sites may be
predominately dependent upon the location of sport diving, and for this reason shallow sites are more likely
to be reported. Artifacts at depths below 66 feet may be rare because of the difficulty and limited dive
times at these depths. Another factor in allowing site discovery may be sediment cover. In the La Jolla
and Point Loma areas there is limited sediment cover to obscure the presence of artifacts. Commercial
urchin divers report numerous stone mortar localities in these areas.
Historic Cultural Setting
The following paragraphs provide a very brief history of maritime activities along the San Diego region’s
coast and adjacent waters. The history of the area can generally be divided into three sections. The
Spanish period begins in 1542, followed by the Mexican period beginning around 1800. The American
period came with the discovery of gold and the Treaty of Guadalupe-Hildago in 1849. A more lengthy
history is provided in Appendix E.
Juan Rodriguez Cabrillo was the leader of the first expedition to enter the project vicinity in September of
1542. Some historians believe that the next recorded European entry into the project vicinity was by a
Portuguese navigator named Sebastian Cermenho. The next reported visit to the project area was the
expedition of Sebastian Vizcaino who arrived in San Diego Bay in November 1602. Over 160 years
passed until the Spanish visited the area again. In 1769, four ships left La Paz, Mexico bound for San
Diego. Only two ships successfully completed the transit. The leader of the expedition, Captain Vicente
Vila, erected a crude fort at the site of the San Diego Presidio.
The Mexican era of California history saw the arrival of hide trading ships which sailed through the project
area. San Diego Bay was utilized as a hide processing station so frequent transit of the San Diego area
occurred as the hide ships plied their trade along the California coast.
The discovery of gold in 1849 and the signing of the treaty of Guadelupe-Hidalgo acted to dramatically
increase maritime traffic along the San Diego region coast. Gold seekers traveling to the mines from the
east crossed the isthmus at Panama to wait for ship passage north. This era of maritime history also saw
the arrival of the first steam ship to San Diego.

3.5 Cultural Resources
Regional Beach Sand Project EIR/EA Page 3.5-599-69\SANDAG EIREA 3.5 to 3.12.wpd 7/17/00
Most vessels carrying passengers first arrived at San Francisco, then sailed to San Diego aboard a regular
coastwise service vessel. Several ships offered passage from San Francisco to San Diego. As immigrants
poured in to California from the east, maritime activity in the San Diego coastal region increased steadily.
The great land boom of the late 1880s combined with increased development of port facilities in San Diego
encouraged maritime commerce. Additionally, technology in ship building and marine propulsion systems
further fueled maritime activity in the San Diego area.
The Mexican land grants were eventually sold to real estate developers who subdivided the Ranchos for
sale to the public. Del Mar was one of several towns that swiftly sprang up on old Rancho land. A large
natatorium was constructed in the surf zone near the foot of 10th street. Remnants of this ocean swimming
pool were still visible in 1974. A pier was also constructed near the foot of 10th street. The pier fell into
the sea twice during construction, knocking a large steam crane into the sea. Another victim of building the
pier was a barge that swamped and sank. Remnants of this vessel washed ashore in 1955. The pier fell
into disrepair and was demolished by the Navy in 1958.
Commercial fishing activities began during the last half of the 19th century. Several Chinese junks using nets
operated from San Diego Bay providing fish for local residents. Also, a whaling station began operation
on Ballast Point.
By 1900, the Navy began to realize the strategic importance of San Diego. The Great White Fleet arrived
in San Diego in 1908. While the entrance to San Diego Bay was too shallow to permit these large ships
to enter the harbor, small draft naval vessels did navigate into the bay.
During the 1930s prohibition smugglers used the north county beaches. Illegal shipments of bootleg liquor
were landed along the remote stretch of beaches and hidden in brush to await transportation by truck. On
July 13, 1939, a fishing barge which was anchored off Carlsbad broke her moorings and foundered on
shore. Named the Glenn Mayne, she was a 431-ton converted brig built in 1918. A large piece of the
hull washed ashore in the same general area in 1991. A severe storm caused the loss of another vessel off
Cardiff Beach in the late 1930s. The Jeannette R developed engine trouble and sank one mile offshore.
Remnants of what is believed to be this ship washed ashore in 1958.
The development of Oceanside Harbor as a small craft facility allowed recreational use of nearby fishing
grounds by a rapidly growing fleet of boats and small ships.

3.5 Cultural Resources
Page 3.5-6 Regional Beach Sand Project EIR/EA99-69\SANDAG EIREA 3.5 to 3.12.wpd 7/17/00
The outbreak of World War II brought increased Naval activities throughout San Diego waters and
adjacent shore. From 1941 to 1971 military activities were conducted at Imperial Beach. Gunnery
practice, artillery observation, and aviation operations took place. To the north, amphibious landings were
practiced near Oceanside.
San Diego Bay continued to develop as a port. Constant dredging since 1911 allowed larger ships to enter
into the bay. The completion of the Tenth Avenue Marine Terminal provided off-loading facilities for large
cargo ships.
Receiver Sites
The 13 receiver sites are beaches located between south Oceanside and Imperial Beach. When the Navy
evaluated 10 of the receiver sites proposed under the previously permitted project, impacts to
archaeological sites from the placement of sand were determined to be beneficial (Department of the Navy
1995, 1997a, 1997b). Therefore, detailed cultural resource analysis of other receiver sites proposed under
the project was not undertaken.
Borrow Sites
It is possible that submerged (and buried) cultural resources would be preserved in certain offshore subtidal
environments. Based on the model used in the current study, the high probability for prehistoric site
preservation is predicted to be at the contact of marsh sediments with streams or rivers. These would be
the oldest associations. Older sites would be most likely to occur within marsh habitats and the most recent
sites within lagoon habitat. Probability assessments are made based on the likelihood of occurrence,
detection, preservation, and recoverability of both prehistoric and historic cultural resources. This
approach is based on the Mineral Management Service (MMS) method utilized to assess submerged (and
often buried) areas for cultural resource sensitivity. The following provides a discussion of the affected
environment for the six borrow sites.
As in the Geology and Soils description (Section 3.1), this text provides an overview of the larger borrow
site rectangle which was originally investigated for sand suitability (Sea Surveyor 1999 and Appendix C).
The “grid” is larger than the dredge area by a factor of two to 25. For example, the grid at SS-1 is over
650 acres, but the dredge area would be under 25 acres.

3.5 Cultural Resources
Regional Beach Sand Project EIR/EA Page 3.5-799-69\SANDAG EIREA 3.5 to 3.12.wpd 7/17/00
SO-9
The dredge area footprint covers a complex but elongate-shaped region, oriented with its long axis in a
beach-parallel direction (4,000 feet) and with its short axis beach-perpendicular and of varying width
(1,000 to 1,500 feet). The water depth varies from 45 feet along the northeast edge to 58 feet along the
southwest edge. A maximum dredging depth of 10 feet below the sea floor is proposed. The geophysical
survey data collected at this site cover approximately 90 percent of the dredge site footprint. Geophysical
data were collected on two occasions. In January 1999 a survey grid with both side-scan sonar and sub-
bottom profiling was collected, consisting of four survey lines perpendicular to the beach direction, and
eleven survey lines parallel to the beach direction. A total of 12 vibracores were also collected, primarily
in the northeast portion of the borrow site, and five of these vibracores fall within the proposed dredge area.
The deepest core penetration was 17 feet, occurring in the northern portion of the grid. During a previous
beach replenishment study conducted by the Army Corps of Engineers (1993) three additional cores were
collected in the presently proposed sand dredging site. In January 2000, additional side-scan sonar data
were collected in a rectangular region overlapping and slightly shoreward of the previous survey grid.
Geoarchaeological Results
According to recent search results conducted for the proposed project, no prehistoric offshore
archeological sites have yet been recorded in or near this borrow site. Based on available data, the SO-9
area is located along the southern margin of the offshore paleochannel of the Santa Margarita River, near
its junction with the offshore paleochannel of the San Luis Rey River. The side scan sonar data collected
for the present study (Sea Surveyor 1999) reveal a smooth featureless bottom texture at SO-9, suggesting
that silt rather than sand is the dominate surface sediment. The sub-bottom profiles reveal a complex
stratigraphy, with a prominent paleochannel oriented perpendicular to the current shoreline. At the bottom
of the profile are pre-transgression fluvial sediments at depths of 10 to 17 feet. Overlying are intertidal,
lagoonal and offshore sediments to the west and only intertidal and offshore sediments to the east.
Evidence for the fluvial sediments is the presence of gravel and other coarse sand near the bottom of
several cores. Likewise, evidence for the intertidal, lagoonal, and offshore environments comes from the
presence of diagnostic shells.
The potential for occurrence of archaeological sites within SO-9 grid appears to be high. The location is
ideal for prehistoric settlement: at the junction of two river channels near the shore. Site preservation may
be problematic, however, since cultural materials would be present within fluvial sediments, the uppermost

3.5 Cultural Resources
Page 3.5-8 Regional Beach Sand Project EIR/EA99-69\SANDAG EIREA 3.5 to 3.12.wpd 7/17/00
portion of which may have been eroded and/or reworked into intertidal sediments during transgression.
Within the region designated for sand dredging, the eastern portion would have the highest probability for
prehistoric site occurrence. Within this high probability zone, it is most likely that prehistoric sites would
be encountered at depths of about nine feet or below, although the depth may be less for portions of the
dredge site moving inshore.
Historical Results
Portions of this proposed borrow site are near generalized shipping zones assessed by an MMS baseline
study as a medium to high probability area for the occurrence of historical shipwrecks.
Within the portion of the dredge area covered by side-scan sonar, several unidentified sonar targets were
detected. They are now known to be scattered rocks deposited by Dr. Jack Patton as part of a reef R
development experiment. Because they were not re-located they were not monitored or mapped on state R
sources. Artificial reefs materials have been deposited within the coverage of the geophysical survey grid R
and adjacent to the dredge site, seen as discrete piles of material in the side-scan sonar image. No side-
scan sonar data area available for the southeast portion of the dredge area (approximately 10 percent).
SO-7
Within SO-7, the water depth varies from 50 feet along the eastern edge of the grid to 80 feet along the
western portion of the grid. At this site, six seismic survey lines were conducted approximately
perpendicular to the beach direction, and ten survey lines were conducted parallel to the beach direction.
A total of 20 vibracores were collected, primarily in the western portion of the grid. The deepest core
penetration was 14.9 feet, in the east-central portion of the grid.
Geoarchaeological Results
Although no offshore archaeological sites are recorded for this area, sites are present both north and south
of the Batiquitos Lagoon entrance along the modern shoreline.
The dredge area at SO-7 can be divided into an eastern inboard and a western outboard portion. When
viewed in a beach perpendicular profile, a distinct change in bottom and sub-bottom reflector slope is
observed midway through the grid. This change in slope may be related to a previous stable sea level
3.5 Cultural Resources
Regional Beach Sand Project EIR/EA Page 3.5-999-69\SANDAG EIREA 3.5 to 3.12.wpd 7/17/00
stand, at about the 80-90 foot depth contour below current sea level, consistent with the sea level
fluctuations which occurred during the 12,000 - 10,000 B.P. time period. A stable sea level would have
created shorefront erosion and the resulting steeper profile. This interpretation is supported by the presence
of boring clam clasts at 1 to 3 foot depth, suggestive of a rocky intertidal environment.
The eastern portion of SO-7 presents a contrasting geologic structure. The side scan sonar image reveals
a rippled, sand covered, bedform for much of this region, with an exposure of rough bedrock in the
southeast portion of the grid. The sub-bottom profiler data suggest that a preserved paleolandform, a
channel meander feature, is present along the eastern edge of the grid. Using the vibracore as a guide, a
geological cross-section of the SO-7 site indicates bedrock outcrops near the sea floor at the north and
south ends of the grid, with the preserved paleochannel in the central portion. The channels is filled
primarily by intertidal sediments, with a pre-transgression fluvial deposit at the bottom, and offshore marine
sediments at the top of the section. Intertidal species are represented in two of the cores by Donax gouldii
(1 to 10 feet).
The onshore area is environmentally very rich today and numerous prehistoric sites are recorded in the
vicinity of Batiquitos Lagoon. The potential for occurrence of archaeological materials within SO-7
appears to be moderate. Much of the sand deposit at this site is intertidal material, with low probability for
direct prehistoric habitation. Since this is a sand bar at a lagoonal entrance, the probability for occurrence
of a prehistoric archaeological site may be increased. In the southern portion of the site, there is a
preserved basal contact between fluvial (pre-transgression) and intertidal (transgression) sediments. The
preservation of sites at this location may be problematic, since erosion and mixing would likely accompany
the intertidal deposition.
Historical Results
Although the project area lies within a zone assessed as high sensitivity for the presence of historic
shipwrecks, no shipwreck sites are recorded within this proposed borrow site. No side scan sonar targets
suggesting the presence of cultural material were recorded during the survey phase.
SO-6
The water depth varies from 58 feet along the eastern edge of the grid to 120 feet along the western portion
of the grid. A small rectangle within the eastern portion of SO-6 has been designated as a source site for

3.5 Cultural Resources
Page 3.5-10 Regional Beach Sand Project EIR/EA99-69\SANDAG EIREA 3.5 to 3.12.wpd 7/17/00
sand dredging. At this site, five seismic survey lines were conducted approximately perpendicular to the
beach direction, and six survey lines were conducted parallel to the beach direction. A total of five
vibracores were collected, primarily in the eastern portion of the grid. The deepest core penetration was
10.6 feet, in the south-central portion of the grid.
Geoarchaeological Results
Two offshore archaeological sites are recorded near SO-6, along the margins of San Elijo Lagoon (Table
3.5-1, Sites 22 and 36). More than 100 artifacts have been recovered from these sites. Site 22 is located
in 3- to 26-foot deep water south of the lagoon entrance, and Site 36 is located in 39-foot deep water
north of the lagoon entrance.
The dredge area for SO-6 spans the northern edge of the offshore paleochannel of San Elijo Lagoon. The
side scan sonar data reveal an extensive rippled bedform, particularly in the south and eastern portion of
the grid, suggesting a surface sand cover in these regions. The sub-bottom profile data also suggest a
defined boundary between these two regions. Using the vibracore and sub-bottom data as a guide, a
geologic cross-section of SO-6 indicates a division between a shallow (5-foot) bedrock interface, with
overlying offshore sediments in the northern portion of the grid, and a paleochannel filled with a sequence
of sedimentary facies in the southern portion of the grid.
The potential for occurrence of archaeological sites at SO-6 varies with location within the grid. The
northern portion of the grid has a low probability for site occurrence since in that region offshore sediments
rest directly on bedrock. The southern portion of the grid has a higher probability for site occurrence since
in that region an intertidal-to-fluvial (pre-transgression to transgression) contact is present. The designated
sand source region within SO-6 is a high probability prehistoric site zone, since it is within the paleochannel,
along its northern margin and since it is close to a known offshore prehistoric artifact locality (Table 3.5-1,
Site 36).
Historical Results
One unidentified sonar target was detected just west of the proposed dredge area, but analysis of sonar
imaging suggests it is a sunken vessel. Two historic ships have been documented or reported to exist within
this area. Precise locations of shipwrecks are often notoriously inaccurate but, actual historic vessel
3.5 Cultural Resources
Regional Beach Sand Project EIR/EA Page 3.5-1199-69\SANDAG EIREA 3.5 to 3.12.wpd 7/17/00
wreckage washed ashore at Cardiff State Beach in 1991. Another probable wreck site was reported in
the August 1955 San Diego Union.
SO-5
The water depth varies from 50 feet along the eastern edge of the grid to 100 feet along the western portion
of the grid. At SO-5, five seismic survey lines were conducted approximately perpendicular to the beach
direction, and seven survey lines were conducted parallel to the beach direction. A total of ten vibracores
were collected, primarily in the central portion of the grid. The deepest core penetration was 12 feet, on
the eastern portion of the grid.
Geoarchaeological Results
Two offshore archaeological artifact sites are recorded near SO-5, along the southern margin of the San
Dieguito River valley, in the intertidal zone and at 10 feet water depth (Masters 1983, Sites 23 and 33).
At each of these sites a single artifact has been recovered.
Borrow site SO-5 spans the offshore paleochannel of the San Dieguito River. The side scan sonar data
suggest a featureless seafloor, except for a small region of rippled bedforms in the southeast and in the
northeast corner of the grid. The sub-bottom profiles revealed a clear bedrock layer beneath sedimentary
sequences that thicken seaward. In the beach parallel profiles, the outline of a paleochannel is preserved,
with its axis directed east-west. Based on the survey and core data, a geological cross-section was
developed for SO-5. The interpretation shows the paleochannel at depth beneath SO-5, filled with a
succession of sediments. It should be noted that at the intertidal/fluvial interface in one of the cores, a
fractured piece of quartzite (a stone material known to be used for tool manufacture) was observed. While
possibly suggestive of humanly produced flaked stone material, it was not definitive.
The potential for occurrence and preservation of archaeological sites within SO-5 is moderate to high. This
is due to the presence of a paleochannel which might have been an attractive feature for prehistoric
habitation, and also the presence of a contact between fluvial (pre-transgression) and intertidal
(transgression) deposits. Also, there are two already recorded offshore artifact sites along the southern
margin of this paleochannel. The highest potential to encounter buried archaeological sites within SO-5 may
be along the margins of the paleochannel, although an object suggestive of flaked lithic materials was found
within a core in the interior of the paleochannel.
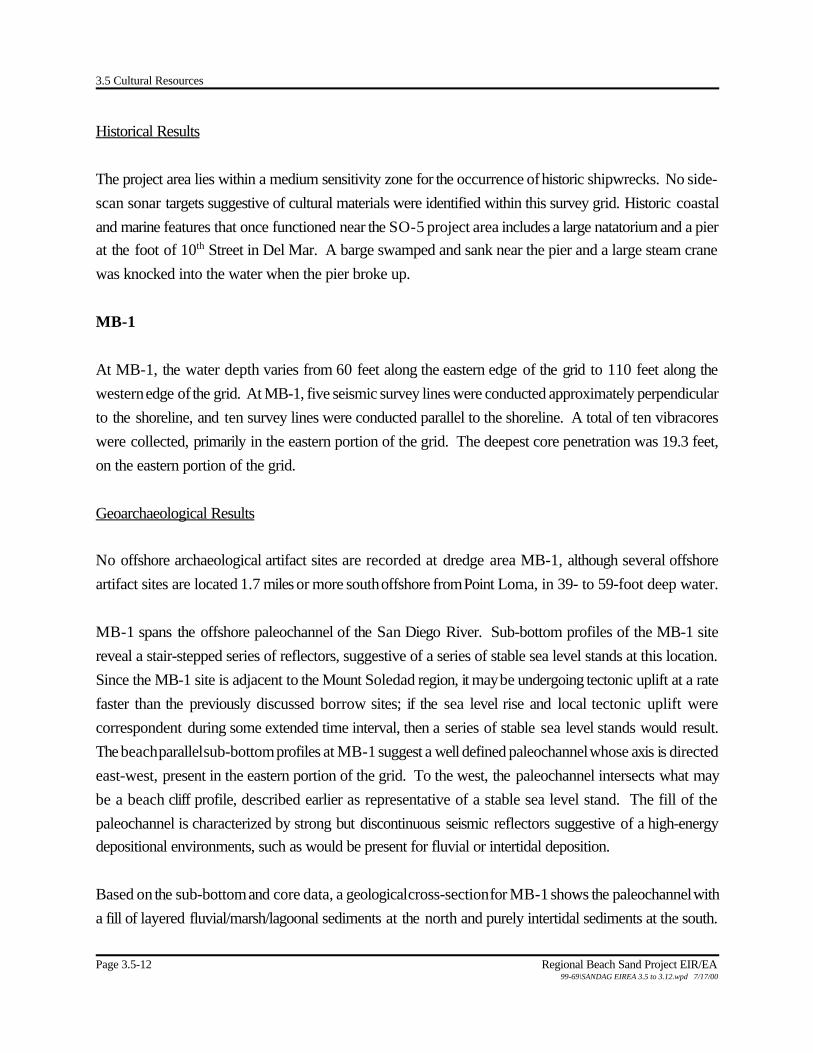
3.5 Cultural Resources
Page 3.5-12 Regional Beach Sand Project EIR/EA99-69\SANDAG EIREA 3.5 to 3.12.wpd 7/17/00
Historical Results
The project area lies within a medium sensitivity zone for the occurrence of historic shipwrecks. No side-
scan sonar targets suggestive of cultural materials were identified within this survey grid. Historic coastal
and marine features that once functioned near the SO-5 project area includes a large natatorium and a pier
at the foot of 10th Street in Del Mar. A barge swamped and sank near the pier and a large steam crane
was knocked into the water when the pier broke up.
MB-1
At MB-1, the water depth varies from 60 feet along the eastern edge of the grid to 110 feet along the
western edge of the grid. At MB-1, five seismic survey lines were conducted approximately perpendicular
to the shoreline, and ten survey lines were conducted parallel to the shoreline. A total of ten vibracores
were collected, primarily in the eastern portion of the grid. The deepest core penetration was 19.3 feet,
on the eastern portion of the grid.
Geoarchaeological Results
No offshore archaeological artifact sites are recorded at dredge area MB-1, although several offshore
artifact sites are located 1.7 miles or more south offshore from Point Loma, in 39- to 59-foot deep water.
MB-1 spans the offshore paleochannel of the San Diego River. Sub-bottom profiles of the MB-1 site
reveal a stair-stepped series of reflectors, suggestive of a series of stable sea level stands at this location.
Since the MB-1 site is adjacent to the Mount Soledad region, it may be undergoing tectonic uplift at a rate
faster than the previously discussed borrow sites; if the sea level rise and local tectonic uplift were
correspondent during some extended time interval, then a series of stable sea level stands would result.
The beach parallel sub-bottom profiles at MB-1 suggest a well defined paleochannel whose axis is directed
east-west, present in the eastern portion of the grid. To the west, the paleochannel intersects what may
be a beach cliff profile, described earlier as representative of a stable sea level stand. The fill of the
paleochannel is characterized by strong but discontinuous seismic reflectors suggestive of a high-energy
depositional environments, such as would be present for fluvial or intertidal deposition.
Based on the sub-bottom and core data, a geological cross-section for MB-1 shows the paleochannel with
a fill of layered fluvial/marsh/lagoonal sediments at the north and purely intertidal sediments at the south.

3.5 Cultural Resources
Regional Beach Sand Project EIR/EA Page 3.5-1399-69\SANDAG EIREA 3.5 to 3.12.wpd 7/17/00
On the north, the paleochannel may have experienced a low energy transition from fluvial to marsh
sediments. In the central and southern portions of the grid core data suggest that much of the sediment was
deposited in a high-energy intertidal environment.
The potential for occurrence and preservation of prehistoric archaeological sites within MB-1 is moderate.
This site spans a well documented paleochannel of the San Diego River. In the northern portion of MB-1
there is a low energy transition between fluvial and marsh sediments that would help to preserve prehistoric
materials contained in the fluvial sediments. In the southern portion of the grid, however, the potential for
site presence and preservation is reduced, given that most of the material in this region is intertidal, perhaps
a lagoonal entrance sand bar.
Historical Results
This proposed borrow site is situated near many historical features. In addition to the intentionally sunken
vessels located in Wreck Alley, at least three other types of subsea cultural features exist within the
immediate vicinity of MB-1. Artificial reef materials are positioned in several locations proximate to or
directly within MB-1. To date, this area holds 13,000 tons of concrete rubble or quarry rock. Plans call
for an additional 12,000 tons of material to be deposited on this site. Several side scan sonar targets
detected in this dredge area may be related to the artificial reef materials. The NOSC tower collapsed onto
the sea floor in 1986, and lies to the east near the proposed dredge area. In addition, the City of San
Diego and the San Diego Oceans Foundation are creating a new underwater park near the MB-1 site. The
Canadian destroyer Yukon will be the first dive site/ artificial reef within the proposed park. Older sunken
historic wreck sites reportedly exist down coast from the NOSC tower location.
There are three unidentified side scan sonar targets in the dredge area. They may be related to the material
deposited over time or they may be historic resources.
SS-1
At SS-1, the water depth varies from 40 feet along the eastern edge of the grid to 53 feet along the western
portion of the grid. A region within the northeast quadrant of area SS-1 has been designated as a source
site for sand dredging. At this site neither side scan sonar, nor seismic sub-bottom profiler lines were
collected for this study, however, side scan sonar and sub-bottom profiler data covering the SS-1 site were

3.5 Cultural Resources
Page 3.5-14 Regional Beach Sand Project EIR/EA99-69\SANDAG EIREA 3.5 to 3.12.wpd 7/17/00
previously collected as part of the South Bay Tunnel Outfall Project, and the interpretation of these data
were made available (Pettus 1995).
Geoarchaeological Results
An offshore archaeological artifact site is recorded near SS-1, along the northern margin of the Tijuana
River channel, at intertidal depths (Table 3.5-1, Site 21). No survey has been recorded in the area, but
at least one stone mortar has been recovered from this site. A bathymetric high exists offshore of the
present day slough mouth. Several recorded prehistoric sites are located along the Pleistocene terrace
which defines the southern margin of the Tijuana River estuary.
The dredge area for SS-1 spans the offshore paleochannel of the Tijuana River, where the paleochannel
makes a bend from an east-west direction toward a more southerly direction. None of the vibracores
reached bedrock; all have abundant sand, and some have a shallow buried clay layer. The deepest levels
within the cores suggest fluvial sediments with poorly sorted and sandy sediments. The aforementioned clay
layer represent a transition to the presence of finer grained marsh sediments above the fluvial layer. Cores
throughout the site reveal a sequence of sedimentary environments from top to bottom as follows: offshore,
lagoonal, marsh, and fluvial. A geological cross-section based on these data reveals a gently south-dipping
contact between fluvial sediments on the bottom, and marsh above. The upper two sedimentary layers are
flat-lying lagoonal and offshore facies.
The potential for occurrence and preservation of archaeological sites within the dredge area for SS-1 is
high, given the presence of a paleochannel, and a low energy interface between fluvial and marsh deposits.
The most likely region to encounter buried cultural materials may be in the northern portion of the grid,
along the margins of the paleochannel.
Historic Results
No seismic or magnetometry data were acquired at this location. However, other remote sensing surveys
have been conducted in the area (Pettus 1995). Results from these offshore surveys were reviewed for
this project. A recorded historic site (the destroyer USS Hogan (DD178)) is located offshore of the
project area. A military aircraft (S2F Tracker) and a sunken sailboat were recorded in 97 feet of water
during studies related to the South Bay Tunnel Outfall (Pettus 1995). The project area lies within a high
potential zone for historic (and modern) shipwrecks and aircraft losses.
3.6 Land and Water Use
Regional Beach Sand Project EIR/EA Page 3.6-199-69\SANDAG EIREA 3.5 to 3.12.wpd 7/17/00
3.6 LAND AND WATER USE
This section describes existing land uses in the project areas and in the surrounding communities, and
identifies pertinent general plan designations for the cities of Oceanside, Carlsbad, Encinitas, Solana Beach,
Del Mar, San Diego, and Imperial Beach.
Proposed land uses are described in Chapter 5.0 (Cumulative Impacts). In general, proposed land uses
in vicinity of the receiver sites include beach replenishment projects and road improvements.
This section also describes existing and designated recreational uses within the project areas. The Pacific
Ocean and its shores are the focus of recreational activity which also define land uses in the project areas.
Recreation and other beneficial uses are protected by the California Ocean Plan which establishes
standards to preserve the quality of ocean waters for use and enjoyment by the people of the State
(SWRCB 1997). At all proposed receiver beaches, most of the same recreational activities occur and are
therefore not discussed separately. Unique recreational activities are noted under the discussion of that
particular receiver beach. Most recreational pursuits occur during the warmer spring and summer months,
but are also popular during the fall and winter months due to the San Diego region’s mild climate.
Additional information regarding the value of recreational fishing and diving is provided in Section 3.8.
Each jurisdiction is responsible for maintaining a quality environment for its citizens and users through
adoption of long-range planning documents. These documents contain goals, policies, implementation
procedures, and regulatory controls, including permitting requirements, to guide and enforce conformance.
State and federal agencies rely on executive orders, various laws, codes, mandates, management plans,
and master plans to govern land use decisions within their jurisdiction. The most common guide used by
local jurisdictions to define land use patterns is the general plan, which is, in turn, consistent with local
ordinances. Land use elements of general plan documents typically contain those policies and maps
governing land use compatibility within the jurisdiction. LCPs are also key planning documents guiding land
use within the Coastal Zone, as defined by the California Coastal Act (Cal. Code Regs. Title 14, § 30000).
Coastal Plans and Policies
Under the federal Coastal Zone Management Act of 1972 (16 C.F.R. § 1451 (1997)), long range planning
and management of California’s coastal zone was conferred to the state with implementation of the
California Coastal Act in 1977. The California Coastal Act (Cal. Code Regs. Title 14 § 30000) created
3.6 Land and Water Use
Page 3.6-2 Regional Beach Sand Project EIR/EA99-69\SANDAG EIREA 3.5 to 3.12.wpd 7/17/00
the CCC who assist local governments in implementing local coastal planning and regulatory powers.
Under that Act, local governments are encouraged to adopt LCPs. The LCP consist of a Land Use Plan
(LUP) with goals and regulatory policies as well as a set of Implementing Ordinances. Of the seven local
jurisdictions for this project, six have approved LCPs acceptable to the CCC (Solana Beach is currently
drafting its LCP).
Several sections of the California Coastal Act focus on shoreline construction, specifically Sections 30235,
30233, and 30706. All of these sections contain an element pertaining to the protection of existing
structures and the protection of public beaches in danger of erosion. Under these sections, construction
will be allowed through revetments, breakwaters, groins, or other means that alters natural shoreline
processes; dredging of open coastal waters, lakes, wetlands, and other areas will be permitted only where
less feasible environmentally damaging alternatives are not available. In particular, in Section 30233,
dredging and spoils disposal, planned to avoid significant disruption to marine and wildlife habitats and
water circulation, is allowed for restoration purposes. Section 30233 states further that dredge spoils
suitable for beach replenishment should be transported to appropriate beaches or into suitable longshore
current systems. The Coastal Act also requires that new construction (Section 30253[2]) shall not require
the construction of protective devices for erosion control.
California State Lands Commission
The California State Lands Commission (CSLC) has exclusive jurisdiction over all of California’s tide and
submerged lands and the beds of naturally navigable rivers and lakes, which lands are sovereign lands, and
swamp and overflow lands and State School Lands (proprietary lands).
Authority of the CSLC originates and is exercised from the state’s position as a landowner. The CSLC
has statutory authority (Division 6 of the California Resources Code) to approve appropriate uses of state
lands under its jurisdiction and is the administrator of the Public Trust Doctrine over sovereign lands. The
Public Trust is a sovereign public property right held by the State or its delegated trustee for the benefit of
the people. This right limits the uses of these lands to waterborne commerce, navigation, fisheries, open
space, recreation, or other recognized Public Trust purposes. Sovereign lands may only be used for
purposes consistent with this public trust, which uses include commerce, navigation, fisheries, open space,
wetlands and other related trust uses. The CSLC has an oversight responsibility for tide and submerged
lands legislatively granted in trust to local jurisdictions (Public Resources Code § 6301).

3.6 Land and Water Use
Regional Beach Sand Project EIR/EA Page 3.6-399-69\SANDAG EIREA 3.5 to 3.12.wpd 7/17/00
Management responsibilities of the CSLC extend to activities within submerged lands and those within three
nautical miles offshore. These activities include oil and gas developments; harbor development and
management oversight; construction and operation of any offshore pipelines or other facilities; dredging;
reclamation; use of filled sovereign lands; topographical and geological studies; and other activities which
occur on these lands. The CSLC also surveys and maintains title records of all state sovereign lands as well
as settling issues of title and jurisdiction.
3.6.1 Receiver Sites
For each of the 13 possible receiver sites, on-site and adjacent land uses (including recreation) are
described, followed by a discussion of land use policies applicable to the proposed action. The proposed
offshore borrow sites are described separately.
Recreational activities at all proposed receiver sites include a variety of onshore and offshore activities,
including walking/jogging, swimming, surfing, windsurfing, sunbathing, beach combing, fishing (both
commercial and sportfishing), SCUBA and skin diving, hiking, picnicking, boating, sailing, and bicycling.
Surfing sites in the project areas are shown in Figures 3.6-1 and 3.6-2. Fishing includes commercial fishing,
sport fishing, lobster fishing, and gillnetting. Some of the species most commonly caught in the region
include white seabass, rockfish, shark, halibut, lobster, sea urchins, and abalone. Fishing can occur
throughout the offshore area, although most of the activity concentrates around offshore kelp beds. For
more information on the commercial fishing industry, refer to Sections 3.8 and 4.8 (Socioeconomics). The
large majority of human activity occurs closer to shore that at the outer edge of the kelp beds. Near the
proposed offshore borrow sites, whale watching is a popular recreational activity.
South Oceanside
On-site and Adjacent Land Use
Under the maximum length alternative, the proposed South Oceanside receiver site stretches for
approximately two miles from Seagaze Drive to Vista Way. Buccaneer Beach is a small pocket beach
situated in the center of the proposed receiver site. The receiver site is used for recreational activities,
especially in the southern portion. The area immediately adjacent to the South Oceanside receiver site is
mostly comprised of a mix of new and older residential uses. Rip-rap (large boulders) exists to protect
beach front residences and structures. Scattered commercial and retail activities, mostly associated
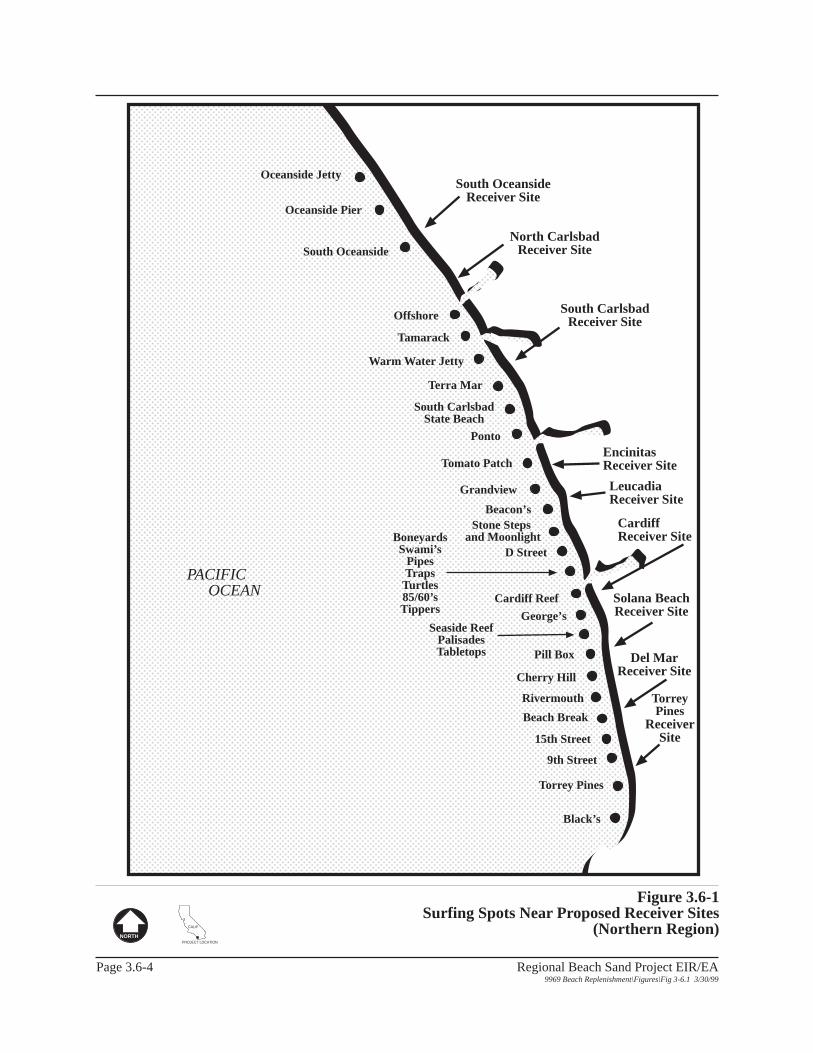
South OceansideReceiver Site
Solana BeachReceiver Site
Del MarReceiver Site
TorreyPines
ReceiverSite
North CarlsbadReceiver Site
South CarlsbadReceiver Site
CALIF
PROJECT LOCATION
Oceanside Jetty
Oceanside Pier
South Oceanside
Offshore
Tamarack
Warm Water Jetty
Terra Mar
South CarlsbadState Beach
EncinitasReceiver Site
LeucadiaReceiver Site
CardiffReceiver Site
Ponto
Tomato Patch
Grandview
Beacon’sStone Steps
and MoonlightD Street
BoneyardsSwami’s
PipesTraps
Turtles85/60’sTippers
Cardiff Reef
George’s
Pill Box
Cherry Hill
Rivermouth
Beach Break
Seaside ReefPalisadesTabletops
15th Street
9th Street
Torrey Pines
Black’s
PACIFIC OCEAN
X.X Section Name
Source: DoN 1993
Regional Beach Sand Project EIR/EA9969 Beach Replenishment\Figures\Fig 3-6.1 3/30/99
Page 3.6-4
NORTH
Figure 3.6-1Surfing Spots Near Proposed Receiver Sites
(Northern Region)
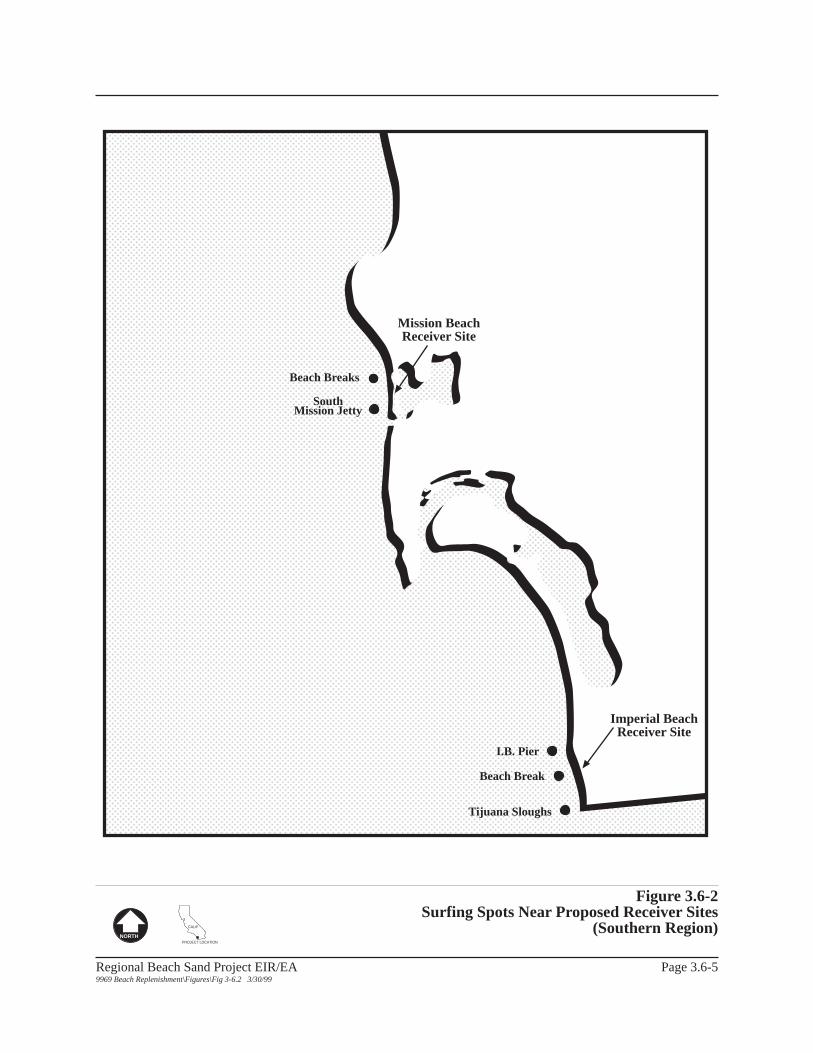
Imperial BeachReceiver Site
CALIF
PROJECT LOCATION
Beach Break
Mission BeachReceiver Site
Tijuana Sloughs
I.B. Pier
SouthMission Jetty
Beach Breaks
X.X Section Name
Source: DoN 1993
Regional Beach Sand Project EIR/EA9969 Beach Replenishment\Figures\Fig 3-6.2 3/30/99
Page 3.6-5
NORTH
Figure 3.6-2Surfing Spots Near Proposed Receiver Sites
(Southern Region)

3.6 Land and Water Use
Page 3.6-6 Regional Beach Sand Project EIR/EA99-69\SANDAG EIREA 3.5 to 3.12.wpd 7/17/00
with the tourism industry, also exist along adjacent roadways. The Strand, a beach front road that extends
from Seagaze Drive to Wisconsin Avenue, abuts the northern end of the proposed receiver site. The Loma
Alta Creek mouth is also adjacent to the replenishment footprint at Buccaneer Beach.
Most recreational watersports occur adjacent to the Oceanside Pier, although there are scattered sand drift
surf breaks near the proposed receiver site. Surfing conditions in this area are primarily dependent upon
shifting formations of nearshore sandbars; surfing conditions tend to be good all year round. Popular surf
spots near the receiver site are shown on Figure 3.6-1.
The South Oceanside receiver beach involves CSLC sovereign land granted to the City of Oceanside
pursuant to Chapter 848, Statutes of 1979. As such, any permits necessary for the proposed action would
be granted by the City, as trustee of these lands.
Land Use Policies
The proposed receiver site is located within the Coastal Zone as designated in the City of Oceanside Land
Use Element of the General Plan (1989). The objective of the coastal zone is to provide for the
conservation of the City’s coastal resources and fulfill the requirements of the California Coastal Act of
1976.
In compliance with the California Coastal Act of 1976, the City adopted a LCP in 1985. The coastal zone
boundary runs parallel to Coast Highway and west to the ocean. The north shore of the Buena Vista
lagoon and an area north of Mission Avenue and east of I-5 are also included in the boundary area. In
general, the LCP requires that development not interfere with the public access to and along the shoreline.
As stated in Policy A of Section 1.32 of the Land Use Element,
The City shall utilize the certified Local Coastal Plan and supporting documentation
for review of all proposed projects within the Coastal Zone. Specifically, the goals
and policies of the Local Coastal Program Land Use Plan shall be the guiding policy
review document.
3.6 Land and Water Use
Regional Beach Sand Project EIR/EA Page 3.6-799-69\SANDAG EIREA 3.5 to 3.12.wpd 7/17/00
In the Land Use Element, Section 3.17 Coastal Preservation, are the following policies:
A. The City shall attempt to preserve shoreline beach area as a valuable
recreational asset and visitor inducement.
B. The City shall continue with periodic replenishment of beach sand by the
Federal government until permanent beach sand management systems are
decided on and implemented.
Within the LCP, two of the major coastal access findings state:
I.B.3. Lateral access along the beach is presently restricted because of the severely
eroded condition of the beach from the southerly end of the Strand to the
Buena Vista Lagoon. Restoration of the beach will greatly improve lateral
access, as well as enlarging the usable beach area.
I.B.4. Existing rock seawalls may, in some instances, inhibit lateral access,
especially at high tide. However, the presence of the seawalls bears a direct
relationship to the beach erosion problem which both necessitates shoreline
protection and inhibits lateral access. Restoration of the beach may diminish
this problem.
In the City’s LCP, the following recreation-related findings are presented:
II.B.1. There has been a periodic decline in beach usage in Oceanside which
corresponds to the seriousness of the beach erosion problem.
II.B.6. Future growth in beach usage in Oceanside will depend upon:
a. Restoration of the beach.
II.C.5. The City shall continue to take the initiative to resolve the problem of beach
erosion.
3.6 Land and Water Use
Page 3.6-8 Regional Beach Sand Project EIR/EA99-69\SANDAG EIREA 3.5 to 3.12.wpd 7/17/00
As evidenced in the City’s General Plan and LCP, beach replenishment is an important goal of coastal
planning for the City of Oceanside.
North Carlsbad
On-site and Adjacent Land Use
The North Carlsbad receiver site, located within the jurisdiction of the City of Carlsbad, stretches for
approximately 4,000 feet (0.8 mile) from just south of the Buena Vista Lagoon to Carlsbad Village Drive
(Elm Avenue). Carlsbad State Beach is located immediately south of the receiver site. The receiver site
is moderately utilized for beach activities due to its confined location between Buena Vista Lagoon and
Carlsbad State Beach and proximity to local residences. The Parks and Recreation Department reported
651,622 visitors to Carlsbad State Beach in fiscal-year 1997-1998 (California Department of Parks and
Recreation 1999). Access to the site is via public accessways from Ocean Street and Carlsbad Boulevard.
Several lifeguard towers exist, and there is also occasional rip-rap to protect beach front properties. The
area located adjacent to the proposed receiver beach site is comprised of new and older residential uses
and a military (Army/Navy) preparatory school. Beach surf breaks (e.g., Offshore and Tamarack) are
scattered along the shore near the proposed receiver site; however, no nearshore reefs supporting surf
breaks are located in the vicinity. Surfing conditions in this area are primarily dependent upon shifting
formations of nearshore sandbars.
The site is located within the Coastal Zone as designated in the City of Carlsbad General Plan (1994). The
objective of the Coastal Zone is to identify areas subject to the requirements of the California Coastal Act
of 1976. Any project within the Coastal Zone is subject to review by the City of Carlsbad and the CCC.
In compliance with the California Coastal Act of 1976, the City certified an LCP in 1980. Subsequent
amendments to the LCP in 1982, 1985, 1988, and 1996 have produced a substantive LCP, comprised
of five segments. The proposed receiver site is located within the Mello II Segment (City of Carlsbad
1996). In general, the LCP requires that development not impact biological or cultural resources, interfere
with the public access to and along the shoreline, or impact visual or natural resources in the Coastal Zone.
The North Carlsbad receiver site involves ungranted sovereign land under the CSLC’s jurisdiction;
authorization from the CSLC would be required for implementation of the proposed action. The owner
3.6 Land and Water Use
Regional Beach Sand Project EIR/EA Page 3.6-999-69\SANDAG EIREA 3.5 to 3.12.wpd 7/17/00
of the Encina Power Plant, Cabrillo Power, has an existing CSLC lease (PRC 932) for deposition of
sediment from the dredging of Agua Hedionda Lagoon immediately south of this receiver site.
Land Use Policies
The following policies identified in the City of Carlsbad Land Use Element of the General Plan, Chapter
III: Environmental, Section C, are relevant to the proposed action:
C.9. Implement to the greatest extent feasible the natural resource protection
policies of the Local Coastal Program.
C.11. Participate in programs that restore and enhance the City’s degraded
natural resources.
The following policy identified in the City of Carlsbad LCP, Chapter II-2, Policy 4-1: Coastal Erosion, is
also relevant to the proposed action:
b. Beach Sand Erosion. Pursue mitigation measures which address the causes of beach
sand erosion; sand dredging ... is one such method which had been suggested. The
City should continue to participate in the Regional Coastal Erosion Committee’s
studies of the causes and cures for shoreline erosion.
South Carlsbad (North and South)
On-site and Adjacent Land Use
There are two proposed South Carlsbad receiver sites, one to the north and one to the south. No sand
is proposed at the South Carlsbad South receiver site under Alternative 1. The South Carlsbad North and
South Carlsbad South proposed receiver sites are under the jurisdiction of the California State Department
of Parks and Recreation. An estimated 430,973 persons visited South Carlsbad State Beach in fiscal-year
1997-1998 (California Department of Parks and Recreation 1999). The South Carlsbad North receiver
site is located approximately two miles north of the Batiquitos Lagoon inlet, stretching for approximately
2,800 feet (0.5 mile) to the north near Palomar Airport Road, under the maximum length alternative. The
site is bordered by steep vegetated bluffs. The South Carlsbad South receiver site begins just south of the

3.6 Land and Water Use
Page 3.6-10 Regional Beach Sand Project EIR/EA99-69\SANDAG EIREA 3.5 to 3.12.wpd 7/17/00
South Carlsbad North receiver site, stretching for approximately 1,830 feet (0.3 mile) southward. Due to
their location on a State Beach adjacent to the South Carlsbad State Beach Campground, the receiver sites
are highly utilized for recreational purposes. The campground consists of 222 campsites, a lifeguard tower,
park ranger facilities, and maintenance facilities. Beach surf breaks are scattered along the shore in the
vicinity of the receiver site. No nearshore reefs supporting surf breaks are located within the immediate
vicinity of these receiver sites. Surfing conditions in this area are primarily dependent upon shifting
formations of nearshore sandbars (Figure 3.6-1). Adjacent land use includes several new residential and
mixed use development projects currently being constructed along Coast Highway 101.
At both receiver sites, the CSLC has jurisdiction over sovereign land. Authorization from the CSLC would
be required for implementation of the proposed action.
Land Use Policies
Both sites are located within the Coastal Zone as designated in the City of Carlsbad General Plan (1994).
For relevant plans and policies under the City’s Land Use Element and LCP, refer to the discussion above
under the North Carlsbad subheading.
The receiver sites are also subject to the plans and policies identified in the San Diego Coastal State Park
System General Plan, Volume 3: South Carlsbad State Beach (1984). This plan identifies proposed
improvements to South Carlsbad State Beach facilities and policies intended to protect natural resources
in the vicinity of the State Beach. The following policy is relevant to the proposed action:
Littoral sand loss is recognized as a major threat to existing facilities and
recreational resources. The department shall work with other agencies, including
the California Department of Boating and Waterways, the City of Carlsbad, the San
Diego Association of Governments, and the U.S. Army Corps of Engineers, to
develop regional solutions to the sand loss problem. Any major program of sand
replenishment or retention must consider the regional nature of the problem and the
regional impact of actions taken along a segment of the shoreline.
3.6 Land and Water Use
Regional Beach Sand Project EIR/EA Page 3.6-1199-69\SANDAG EIREA 3.5 to 3.12.wpd 7/17/00
Encinitas
On-site and Adjacent Land Use
Within the City of Encinitas, there are four proposed receiver sites: Batiquitos, Leucadia, Moonlight Beach,
and Cardiff. At all Encinitas receiver sites the CSLC has jurisdiction over sovereign land. Authorization
from the CSLC would be required for implementation of the proposed action.
Batiquitos
The Batiquitos site is located approximately 750 feet south of the Batiquitos Lagoon, stretching for
approximately 1,390 feet (0.3 mile) from the City of Carlsbad into the community of Leucadia and
Leucadia State Beach, which are within the City of Encinitas. The northern part of the site is known as
“Ponto.” This state beach is a unit of the state park system, but is operated by the City of Encinitas. The
state beach is subject to the San Diego Coastal State Park System General Plan. Leucadia State Beach
received 875,026 visitors in fiscal year 1997-1998 (California Department of Parks and Recreation 1999).
Adjacent land use is predominantly open space and residential, with some commercial uses along Coast
Highway 101.
Due to erosion at this site, it is only moderately used for recreational purposes. In addition, public access
to the southern segment of this beach is limited due to steep cliffs abutting the beach. There are also
lifeguard stands along the beach. Several popular surf breaks exist along the shore in the vicinity of the
receiver site, including Ponto, Tomato Patch, and Grandview (Figure 3.6-1). All surf breaks from Tomato
Patch south to D Street are beach breaks with waves produced by scattered rocky reefs.
Leucadia
The proposed receiver beach at this site extends approximately 2,700 feet (0.5 mile) from just south of the
Grandview access stairs to Glaucus Street. As described above, this state beach is a unit of the state park
system, but is operated by the City of Encinitas. The Leucadia site is similar to the southern end of the
Batiquitos site in that recreation is limited due to difficult access. Public stairways exist at Grandview Street
and Leucadia Boulevard (Beacon’s), and several private stairways serve existing residences atop the bluff.
The Leucadia receiver site is adjacent to the same surf breaks and reefs mentioned above for the Batiquitos

3.6 Land and Water Use
Page 3.6-12 Regional Beach Sand Project EIR/EA99-69\SANDAG EIREA 3.5 to 3.12.wpd 7/17/00
site (Figure 3.6-1). Adjacent land use is predominantly residential, with some commercial uses along Coast
Highway 101.
Moonlight Beach
The proposed Moonlight Beach receiver site is located at the foot of Encinitas Boulevard at Moonlight
State Beach. The proposed site is approximately 770 feet long (0.1 mile). Moonlight State Beach is a unit
of the state park system, but is operated by the City of Encinitas. The state beach is subject to the San
Diego Coastal State Park System General Plan. In the fiscal year 1997-1998, there were 857,735 visitors
to Moonlight State Beach (California Department of Parks and Recreation 1999). Facilities at Moonlight
State Beach include two lifeguard towers, volleyball and tennis courts, picnic facilities, recreational
equipment rentals and a snack bar. The southern part of the site abuts the Encinitas City Marine Life R
Refuge (California Fish and Game Code § 10913). Within Refuge boundaries, it is illegal to take R
invertebrates or marine life specimens except under a permit. Kelp harvesting, for recreational or R
commercial use, is prohibited except under a permit. R
Residential uses occur adjacent to the site, to the north and south. The beach area is relatively flat, but
quickly slopes up to the east, north, and south. Public access is found at Moonlight State Beach and south
at the D Street stairway. Popular surf breaks along this stretch are primarily a result of beach access points
(due to difficulty in access along the southern segment along the steep coastal cliffs). Moving south from
G Street, the surf breaks are more heavily influenced by reefs. Wave peaks are formed from reefs located
within the surf zone. Boneyards and Swami’s are examples of reef surf breaks south of the Moonlight
receiver site (Figure 3.6-1).
Cardiff
Beach replenishment at this site would occur southwest of San Elijo Lagoon and Cardiff Reef. The
proposed receiver site is approximately 780 feet long (0.1 mile) and comprises the northern end of Cardiff
State Beach. The proposed Cardiff site is characterized by cobble beaches and a steep, 10- to 15- foot
berm south of Restaurant Row. The site is located adjacent to Coast Highway 101. In its entirety, Cardiff
State Beach stretches from Cardiff Reef south to Seaside Reef and encompasses approximately 25 acres
and has 6,550 feet of ocean frontage. The facility includes two parking lots (at the north and south ends
of the beach), restrooms, and an emergency vehicle access ramp. The California Department of Parks and
Recreation recorded approximately 1,124,000 visitors at Cardiff State Beach during the 1995/1996 season

3.6 Land and Water Use
Regional Beach Sand Project EIR/EA Page 3.6-1399-69\SANDAG EIREA 3.5 to 3.12.wpd 7/17/00
(California Department of Parks and Recreation 1997). This estimate includes visitors to the south and
central sections of Cardiff State Beach (i.e., George’s and Seaside). A popular surf break in the vicinity
of the proposed receiver beach is Cardiff Reef. George’s was also formerly a popular surf break (located
south of Restaurant Row) but in recent years has lacked quality surf due to beach erosion and sandbar loss.
Restaurant Row, which includes restaurants, offices, and shops, exists approximately 500 feet south of the
San Elijo Lagoon inlet along the waterfront.
The north of the lagoon is San Elijo State Beach, which is a highly used recreational facility. This beach
includes approximately 42 acres with 7,190 feet of ocean frontage and is more developed than Cardiff
State Beach. Its facilities include a 171-unit campground with five comfort stations, an 86–space day use
parking lot, a unit office, an entrance station, a concessions building, a lifeguard tower, an informal
campground center, and six beach access stairways. In addition to activities commonly encountered at
Cardiff State Beach, San Elijo State Beach is also a popular camping spot. San Elijo State Beach had
approximately 471,651 visitors in fiscal year 1997-1998 (California Department of Parks and Recreation
1999).
The San Elijo Lagoon Ecological Reserve is adjacent to the site, just east of Coast Highway 101.
Recreation at the Reserve is primarily limited to passive uses such as hiking and bird watching.
Surfing is a popular water activity within the Cardiff area and generally occurs along the entire stretch of
Cardiff and San Elijo State Beaches, although it is most concentrated in a number of areas, including Cardiff
Reef, Seaside Reef, Palisades, and Tabletops (Figure 3.6-1).
The waters off of Cardiff State Beach also support nonrecreational uses, including commercial fishing, kelp
harvesting, and behavioral studies of the bottlenose dolphin (Tursiops truncates). Commercial fishing
generally occurs in the same locations as recreational fishing.
Land Use Policies
All four Encinitas sites are located within the Coastal Zone as designated in the City of Encinitas General
Plan (1989). Any project within the Coastal Zone is subject to review by the City of Encinitas and the
CCC. Public beaches in the City of Encinitas are designated as Ecological Resource/Open Space/Parks
in the City’s General Plan (1989). The Leucadia and Moonlight beach sites are also within the Coastal
Bluff Overlay zone.

3.6 Land and Water Use
Page 3.6-14 Regional Beach Sand Project EIR/EA99-69\SANDAG EIREA 3.5 to 3.12.wpd 7/17/00
The Encinitas General Plan identifies issues and opportunities relative to planning decisions within the City.
Regarding beaches, the plan states, “the beach areas are losing sand depth each year and sand
replenishment programs are needed to provide for their restoration.” Additionally, the Resource
Management Element of the General Plan identifies the following policies relevant to the proposed action:
8.6 The City will encourage measures which would replenish sandy beaches in
order to protect coastal bluffs from wave action and maintain beach
recreational resources. The City shall consider the needs of surf-related
recreational activities prior to implementation of such measures.
10.3 The City shall explore the prevention of beach sand erosion. Beaches shall be
artificially nourished with excavated sand whenever suitable material becomes
available through excavation or dredging, in conjunction with the development of
a consistent and approved project. The City shall obtain necessary permits to be
able to utilize available beach replenishment sands (as necessary, permits from the
Army Corps of Engineers, California Coastal Commission, Department of Fish and
Game, USEPA, etc.).
In compliance with the California Coastal Act of 1976, the City of Encinitas includes an LCP LUP in its
General Plan. The LUP identifies policies and provisions that serve to apply the Coastal Act in the City.
Leucadia, Moonlight, and Cardiff State Beaches, operated and maintained by the California State
Department of Parks and Recreation, are subject to guidelines set forth in the San Diego Coastal State
Park System General Plan (refer to the relevant land use policy described under South Carlsbad State
Beach).
Solana Beach
On-site and Adjacent Land Use
The proposed receiver site in the City of Solana Beach is located just south of Fletcher Cove Beach Park
(terminus of Plaza Drive) and extends approximately 1,800 feet (0.3 mile) south. Steep cliffs abut the
receiver site and the area consists of a gently sloping sand beach with scattered rocks and cobbles.
Fletcher Cove received 51,000 cy of sand from excavated fill in the spring of 1999 (Semple 1999). The
3.6 Land and Water Use
Regional Beach Sand Project EIR/EA Page 3.6-1599-69\SANDAG EIREA 3.5 to 3.12.wpd 7/17/00
fill was excavated in 1998 and 1999 as part of the nearby Lomas Santa Fe Drive railroad grade separation
project. Residential development and some commercial uses exist above the receiver site along the bluff.
The bluffs and beach are severely eroded, and numerous efforts to slow erosion, such as rip-rap, the filling
in of sea caves, sea walls, and other revetments occur along the bluffs and beach. There is also a lifeguard
station and public shower at Fletcher Cove.
A small subtidal reef exists north of Fletcher Cove, known as Pill Box. Surfing is a popular activity at this
reef. Surfing is also popular farther south at Cherry Hill and north at Tabletops, where other subtidal reefs
exist (Figure 3.6-1).
The proposed receiver beach is within the CCC’s jurisdiction. Any decisions regarding activities on the
beach would be subject to the Commission’s review and approval.
Land Use Policies
The City of Solana Beach currently has no approved LCP. The City anticipates preparation of an LCP
in 2000 (Mitchell 1999).
Del Mar
On-site and Adjacent Land Use
The proposed receiver site in the City of Del Mar extends from 27th Street to Powerhouse Park, a distance R
of approximately 3,110 feet (0.6 mile). The beach has recently increased in size compared to the winter R
of 1997-1998, when El Niño-driven storms destroyed two beach front homes and substantially reduced
the width and depth of the beach. The beach itself is designated Public Parkland in the City of Del Mar
Community Plan (1976) and is within the City’s Beach Overlay Zone (City of Del Mar 1993). Most of
the receiver site falls within the City’s North Beach District. The receiver site is lined with low and medium
density residential uses and sea walls for most of its length, the exception being the southern end of the
receiver site. At this southern end, Visitor Commercial and Beach Commercial uses exist including a motel,
a hotel, and restaurants. Also at the southern end is Powerhouse Park, which is a Public Parkland use
designated by the City. Powerhouse Park lies atop steep vegetated bluffs. Nearby surf spots are shown
on Figure 3.6-1.
3.6 Land and Water Use
Page 3.6-16 Regional Beach Sand Project EIR/EA99-69\SANDAG EIREA 3.5 to 3.12.wpd 7/17/00
The Del Mar receiver site involves ungranted sovereign land under the jurisdiction of the CSLC. As such,
authorization from the CSLC would be required for implementation of the proposed action.
Land Use Policies
The Environmental Management chapter of the City’s Community Plan (1976) identifies beach erosion and
sand loss as severe problems. Towards that end, the City’s Community Plan identifies the following
objective.
Goal 1J. Restore environmentally degraded areas to the high quality standards
implied in the objectives above.
This goal strives for consistency with standards provided elsewhere in the Environmental Management
chapter. In addition, the more recent LCP for the City (1993) indicates the critical need to implement sand
replenishment programs to protect property, structures, and coastal bluffs. For instance:
Goal III-5 Continue to study and implement shoreline management and
replenishment programs applicable to the Oceanside littoral cell
through participation in the activities of the regional organizations
and agencies...
The City of Del Mar passed an initiative in 1988 that created a Beach Overlay Zone (BOZ). According
to the City’s LCP Land Use Plan, the BOZ:
regulates the uses of the Del Mar beach area, a distinct and valuable natural
resource, for the benefit of present and future generations. The regulations...shall
be administered so as to protect public access to and along the shoreline, while
promoting public safety, health and welfare, and providing for the protection of
private property.
Beach Overlay Zone regulations restrict development in the BOZ so as to minimize erosion effects along
the City’s coastline. However, BOZ regulations for development projects do not apply to sand
replenishment projects as described below:
3.6 Land and Water Use
Regional Beach Sand Project EIR/EA Page 3.6-1799-69\SANDAG EIREA 3.5 to 3.12.wpd 7/17/00
Goal III-7, No. 15 Sand Replenishment Projects. A sand replenishment project
shall not be considered development within the meaning of
these Beach Overlay Zone regulations where each of the
following criteria are met:
1. No structure or material other than sand is permanently
placed on the beach;
2. The proposed replenishment program is approved in
advance by the City as to the quantities of sand to be placed
on the beach, the location of the replenishment, the quality of
the material to be used in the replenishment project, the time
in which the project is to occur, and any other relevant
aspects of the proposed project.
Torrey Pines
On-site and Adjacent Land Use
The proposed Torrey Pines receiver site is located within the jurisdiction of the City of San Diego and the
California Department of Parks and Recreation. Under the maximum length alternative, the site stretches
for approximately 2,470 feet (0.5 mile) and is located on Torrey Pines State Beach adjacent to North
Torrey Pines Road. Nearby land use includes the open space of Torrey Pines State Beach/Reserve and
the Los Peñasquitos Lagoon. Public access is via trails at Torrey Pines State Beach/Reserve and along
North Torrey Pines Road. The beach includes lifeguard stations and a 6- to 8-foot sand berm. Rip-rap
has been placed along North Torrey Pines Road to protect it from eroding further (El Niño-driven storms
of 1997-1998 eroded much of this road). Popular surf breaks in the vicinity are scattered beach breaks
along Torrey Pines State Beach (Figure 3.6-1). In fiscal year 1997-1998, there were 675,821 visitors
to Torrey Pines State Beach (California Department of Parks and Recreation 1999). In addition to the
popular recreational activities found on other San Diego beaches, paragliding and parasailing are popular
at this site.
3.6 Land and Water Use
Page 3.6-18 Regional Beach Sand Project EIR/EA99-69\SANDAG EIREA 3.5 to 3.12.wpd 7/17/00
The Torrey Pines receiver beach involves sovereign land granted to the City of San Diego pursuant to
Chapter 688, Statutes of 1933. As such, any permits necessary for the proposed action would be granted
by the City, as trustee of these lands.
Land Use Policies
The proposed receiver site at Torrey Pines is located within the Coastal Zone as designated by the City
of San Diego General Plan (1989). The City’s LCP guides development in sensitive coastal areas and
provides for the preservation of natural resources. The City’s LCP requires any project occurring within
the Coastal Zone to be reviewed by the City and the CCC.
The receiver site is also subject to the plans and policies identified in the San Diego Coastal State Park
System General Plan, Volume 8: Torrey Pines State Beach and State Reserve (1984). This plan identifies
improvements to facilities at Torrey Pines State Beach and policies intended to protect natural resources
in the vicinity of the State Beach. The following policy identified in Park System General Plan is relevant
to the proposed action:
Sand and similar sediment in active alluvial fans and other storage areas in the Los
Peñasquitos watershed is a valuable resource that shall be considered for
replenishment of littoral beach sand. Material excavated from sediment basins and
other depositional storage areas in the watershed, and which is of suitable quantity,
size, and chemical constituency to meet the management objectives of the state
beach and state reserve, shall be considered for disposal into the littoral zone just
below the Los Peñasquitos Lagoon opening. When beach replenishment is not
needed or appropriate at the time of necessary dredging, the sand should be
deposited for eventual use as beach replenishment, provided that suitable locations
for deposit are available and that steps are taken at them to protect significant
natural resources and their public use.
3.6 Land and Water Use
Regional Beach Sand Project EIR/EA Page 3.6-1999-69\SANDAG EIREA 3.5 to 3.12.wpd 7/17/00
Mission Beach
On-site and Adjacent Land Use
The proposed Mission Beach receiver site extends approximately 2,380 feet (0.5 mile) from Ostend Court
to Santa Barbara Place. Land uses in the vicinity include residential, commercial and open space functions.
The Boardwalk, which stretches from Pacific Beach Drive south to the terminus of Mission Beach Park,
exists along the receiver site. Public access is from the adjacent residential streets and the South Mission
parking lot. As of June 1999, the beach is approximately 25 to 30 feet wide at high tide. The Mission Bay
Boat Channel is approximately two miles south of the proposed receiver site. Nearby surf spots are shown
in Figure 3.6-2.
The Mission Beach receiver site involves sovereign land granted to the City of San Diego pursuant to
Chapter 688, Statutes of 1933 and state lands pursuant to Chapter 1054, Statutes of 1939, as amended
with minerals reserved to the State. As such, any permits necessary for the proposed action would be
granted by the City, as trustee of these lands.
Land Use Policies
The site is within the jurisdiction of the City of San Diego and whose future planning is accounted for in the
Mission Beach Precise Plan and Local Coastal Program Addendum (1974). In the Conservation Element
of the Precise Plan, Goal 3 states
Conservation of beaches and shoreline to maintain and enhance their benefits for
present and future San Diego residents and visitors.
The proposed receiver site at Mission Beach is located within the Coastal Zone (City of San Diego 1974).
The City’s LCP guides development in sensitive coastal areas and provides for the preservation of natural
resources. The City’s LCP requires any project occurring within the Coastal Zone to be reviewed by the
City and the California Coastal Commission. According to the Mission Beach Precise Plan LCP,
In view of the heavy use, both in recreation and in research, that both beach and
nonbeach shorelines receive, it is obviously decidable that additional shoreline be
acquired as opportunities present themselves.

3.6 Land and Water Use
Page 3.6-20 Regional Beach Sand Project EIR/EA99-69\SANDAG EIREA 3.5 to 3.12.wpd 7/17/00
The City of San Diego, in response to beach sand erosion and lateral drift concerns, produced a plan for
shoreline development named The Ocean Edge of San Diego (City of San Diego 1969). The Ocean
Edge of San Diego makes the following recommendations, which are still viable relative to sand
preservation and replenishment:
1. Sand replenishment is a regional problem, and any effective long-range management
program should be directed and implemented on the basis of regional studies and policies.
2. A sand replenishment program should be instituted for the San Diego shoreline and
particularly the Pacific Beach/Mission Beach/Mission Bay beaches...
3. Sand replenishment of beaches should be coordinated with future dredging projects and
should be narrow in scope. Selective dredging action should provide the proper mitigating
measures to protect environmentally sensitive habitat areas, i.e., eel grass, from impacts of
the dredging activity...
Imperial Beach
On-site and Adjacent Land Use
The proposed Imperial Beach receiver site (maximum length) extends for approximately 3,470 feet (0.7
mile) from Imperial Beach Boulevard to approximately 1,000 feet south of Encanto Avenue. Residential
uses are located along Seacoast Drive South. The Tijuana River Natural Estuarine Research Reserve,
which includes the Tijuana Slough National Wildlife Refuge, managed by the U.S. Fish and Wildlife Service
(USFWS) is located to the south and east. The Imperial Beach pier is located approximately 1,000 feet
to the north of the receiver site. Among other recreational activities common to other beaches in the region,
visitors to this beach enjoy nature interpretation due to its proximity to the Tijuana Slough National Wildlife
Refuge. The beach turns from gently sloping and sandy in the northern part of the receiver site to narrow,
steep and cobbly as one travels south. Rip-rap exists along the site to protect beach front property.
Popular surf spots are shown on Figure 3.6-2.
The Imperial Beach receiver site involves sovereign lands granted to the San Diego Unified Port District R
pursuant to Chapter 1796, Statutes of 1990. R
3.6 Land and Water Use
Regional Beach Sand Project EIR/EA Page 3.6-2199-69\SANDAG EIREA 3.5 to 3.12.wpd 7/17/00
Land Use Policies
The Conservation and Open Space Element of the City of Imperial Beach General Plan and Coastal Plan
(1994) contains the following policy regarding sand deposition:
CO-1 The Beach: Imperial Beach has few industries and must, therefore, rely on the
attraction of tourists for economic development. The beach area is most critical and
the City should:
4. Assure continued replenishment of sand.
Goal 11c. Immediate Ocean Shoreline. The ocean, beach and the immediately
abutting land are recognized as an irreplaceable natural resource to be enjoyed by
the entire City and region. This unique, narrow strip of land should receive careful
recognition and planning. The purpose of the beach is to make available to the
people, for their benefit and enjoyment forever, the scenic, natural, cultural, and
recreational resources of the ocean, beach and related lands.
Safety Element, Goal S-11:
The City should protect property by:
d) Working in coordination with SANDAG and other coastal cities in
developing a regional beach replenishment program and continuing to
implement the adopted “Shoreline Preservation Strategy for the San Diego
Region.”
3.6.2 Borrow Sites
The proposed offshore borrow sites are illustrated in Figures 2-15 through 2-20. The sites are located
from approximately 1,800 feet (0.3 mile) to 6,750 feet (1.3 miles) offshore. All of the dredge sites are
surrounded by ocean water and recreational activities include diving, sailing, and fishing. Adjacent uses of
submerged lands include sewer outfalls, artificial reefs, and underwater parks.

3.6 Land and Water Use
Page 3.6-22 Regional Beach Sand Project EIR/EA99-69\SANDAG EIREA 3.5 to 3.12.wpd 7/17/00
Adjacent water uses to the offshore borrow sites include kelp harvesting and whale watching. A San
Diego-based company, Kelco, harvests the kelp canopy at Point Loma, La Jolla, and from Del Mar to
Carlsbad. Kelp is gathered by a specially designed ship that cuts the kelp to a depth of approximately 4
feet below the surface.
Gray whales migrate through San Diego’s offshore waters twice a year on their way between summer
feeding grounds off Alaska and calving areas in the coastal lagoons of Baja California, Mexico. Private
and charter boats venture out to watch the migrating whales.
With the exception of MB-1, all offshore borrow sites are located in ungranted sovereign lands under the
jurisdiction of the CSLC. A lease is required from the CSLC for any portion of a project extending into
State-owned lands that are under its exclusive jurisdiction.
SO-9
SO-9 is located approximately 3.7 miles to the north of the Oceanside outfall and approximately 500 feet
to the east of the nearest of eight artificial reef habitats (Figure 2-15), comprised of quarry rock, which
occur on an otherwise featureless seafloor (Sea Surveyor 1999). The artificial reefs are created and
maintained by CDFG per a lease from the CSLC (PRC 3136).
SO-7
As shown on Figure 2-11, the Encina Wastewater Authority’s sewer line is located approximately 1.6 miles
north of the SO-7 borrow site. There is also an artificial reef implemented by the San Onofre Nuclear
Generating Station (SONGS), which is located approximately 750 feet north of SO-7. Twelve artificial
reefs are maintained by CDFG, four of which (C9, C10, C11, and C12) are approximately 500 feet from R
SO-7's proposed dredge area (Figure 2-6). Within that reef complex, the closest reef to the surface is C2 R
which sits 21 feet high at -37 feet MLLW, resulting in 16 feet between the top of the reef and the water R
surface. R
SO-6
The SO-6 proposed borrow site would be 350 feet north of the San Elijo ocean outfall. SO-6 is located
seaward of a lease to the Department of Parks and Recreation from the CSLC (PRC 7365) for an
3.6 Land and Water Use
Regional Beach Sand Project EIR/EA Page 3.6-2399-69\SANDAG EIREA 3.5 to 3.12.wpd 7/17/00
underwater recreational park. This lease area extends along the shore from Swami’s Point in Encinitas
south to Tabletops Reef in Solana Beach and it extends seaward approximately 3,500 feet. SO-6's closest
boundary is approximately 250 feet away (seaward) from the lease area. The closest artificial reef within
the underwater park is located approximately 2,250 feet from SO-6.
SO-5
The SO-5 borrow site is approximately two miles south of the San Diego-La Jolla Underwater Park, a
recreational area for divers. There are no artificial reefs in the vicinity.
MB-1
This borrow site is almost entirely encompassed by the Mission Bay Artificial Reef (MBAR) and is within
700 feet of the proposed San Diego Underwater Recreation Area (Figure 2-19). MBAR is utilized by
recreational fishermen and sport divers. MBAR was permitted by the CCC in 1986 and reauthorized in R
1996, and is administered by CDFG. The entire borrow site is within sovereign lands legislatively granted R
to the City of San Diego. Located approximately one mile northwest of the Mission Bay Boat Channel, R
MBAR is easily accessed by vessels launched from or moored in Mission Bay. The proposed San Diego
Underwater Recreation Area is located northwest of MBAR.
Mission Bay Bridge Wreckage reefs 1 and 2, along with Mission Bay Cement reef provide habitat for sport
fished species within MBAR, but the primary resources for sport divers are the sunken vessels of “Wreck
Alley,” which are also utilized by sport fishermen. Wreck Alley is a cooperative effort between the San
Diego Divers Council and the CDFG. The three primary vessels in Wreck Alley are the El Rey, Shooters’
Fantasy, and the Ruby E. The El Rey, a 100-foot long 32-foot beam kelp cutter built in 1946, and
Shooter’s Fantasy (originally the Betty Lou), a 65-foot steel hulled charter sport fisherman built in the
early 1950s, were placed in Wreck Alley in 1986. They rest in approximately 80 feet and 70 feet of water,
respectively. The most popular site in Wreck Alley is the Ruby E, a 160-foot long Coast Guard cutter that
was sunk in 1987 in approximately 80 feet of water. It rests intact and upright on the bottom, and is the
most complex of the wrecks in Wreck Alley. A number of local scuba shops use this wreck in their
advanced dive certification classes. Less visited wrecks in Wreck Alley include Barge #1 with a 65-foot
length and 22-foot beam sunk in 1986 in approximately 75 feet of water north of the El Rey, and the 36-
foot sailboat the Strider, sunk that same year.

3.6 Land and Water Use
Page 3.6-24 Regional Beach Sand Project EIR/EA99-69\SANDAG EIREA 3.5 to 3.12.wpd 7/17/00
Another important diving resource in Wreck Alley is the Naval Ocean Surveillance Center (NOSC)
Tower. Not intended to be part of the artificial reef program, the tower sunk in a storm in January 1988,
and it rises approximately 30 feet off of the approximately 60 feet bottom. This feature has several popular
names. Erected by NOSC in 1959 for oceanographic research and other studies, it functioned as a Naval
Experimental Lab (NEL), and in late 1987 jurisdiction was transferred to the Chief of Naval Research, and
Scripps Institute of Oceanography (SIO) operated it. Today it is variously referred to as the NOSC, NEL,
or SIO tower, and is a popular dive spot.
Another vessel, the HMCS Yukon, is slated to be sunk by the San Diego Oceans Foundation in the vicinity
of Wreck Alley within the proposed San Diego Underwater Recreation Area. The Yukon is 366-foot long
decommissioned Canadian navy Mackenzie class destroyer, launched in 1961. At 2,890 tons, 70 feet tall,
and with 6 decks, it will be by far the largest artificial reef vessel in the area. It is scheduled to be sunk in
May 2000 in approximately 120 feet of water.
SS-1
The City of San Diego outfall is located approximately 2,000 feet south of the proposed dredge area. The
City of San Diego has two ocean monitoring stations to monitor ocean water and sediment quality near the
end of the City’s outfall. The nearest would be approximately 1.1 miles from SS-1.
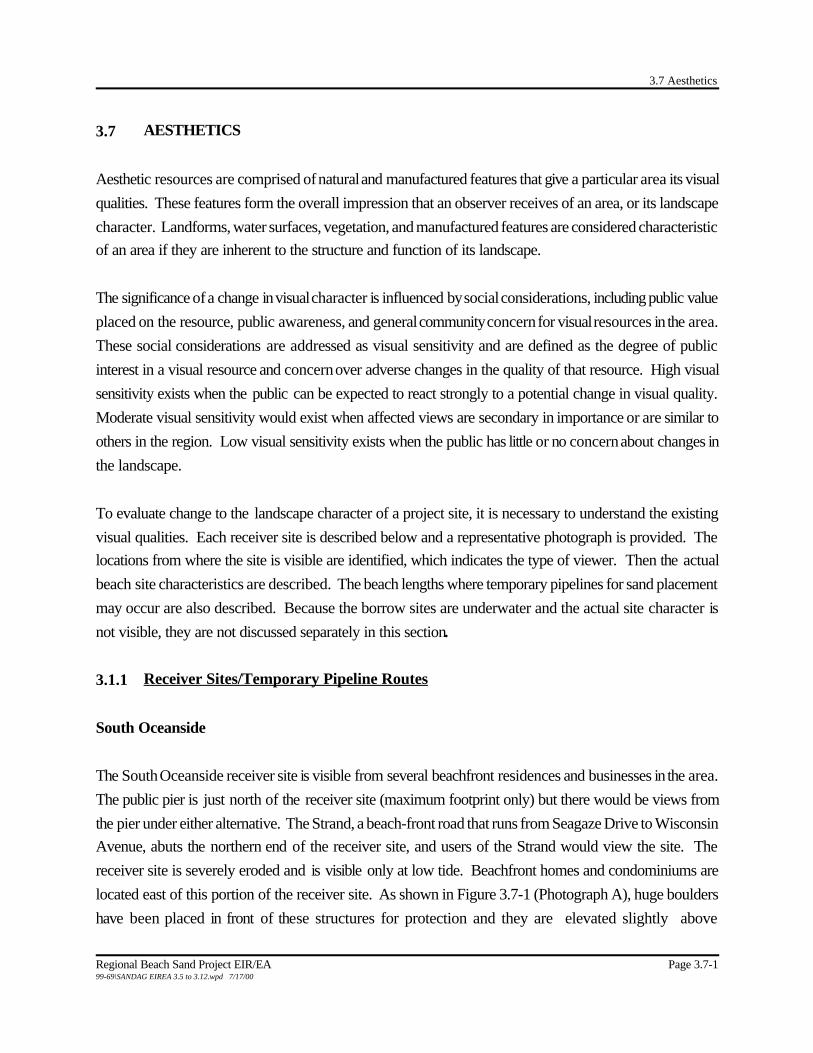
3.7 Aesthetics
Regional Beach Sand Project EIR/EA Page 3.7-199-69\SANDAG EIREA 3.5 to 3.12.wpd 7/17/00
3.7 AESTHETICS
Aesthetic resources are comprised of natural and manufactured features that give a particular area its visual
qualities. These features form the overall impression that an observer receives of an area, or its landscape
character. Landforms, water surfaces, vegetation, and manufactured features are considered characteristic
of an area if they are inherent to the structure and function of its landscape.
The significance of a change in visual character is influenced by social considerations, including public value
placed on the resource, public awareness, and general community concern for visual resources in the area.
These social considerations are addressed as visual sensitivity and are defined as the degree of public
interest in a visual resource and concern over adverse changes in the quality of that resource. High visual
sensitivity exists when the public can be expected to react strongly to a potential change in visual quality.
Moderate visual sensitivity would exist when affected views are secondary in importance or are similar to
others in the region. Low visual sensitivity exists when the public has little or no concern about changes in
the landscape.
To evaluate change to the landscape character of a project site, it is necessary to understand the existing
visual qualities. Each receiver site is described below and a representative photograph is provided. The
locations from where the site is visible are identified, which indicates the type of viewer. Then the actual
beach site characteristics are described. The beach lengths where temporary pipelines for sand placement
may occur are also described. Because the borrow sites are underwater and the actual site character is
not visible, they are not discussed separately in this section.
3.1.1 Receiver Sites/Temporary Pipeline Routes
South Oceanside
The South Oceanside receiver site is visible from several beachfront residences and businesses in the area.
The public pier is just north of the receiver site (maximum footprint only) but there would be views from
the pier under either alternative. The Strand, a beach-front road that runs from Seagaze Drive to Wisconsin
Avenue, abuts the northern end of the receiver site, and users of the Strand would view the site. The
receiver site is severely eroded and is visible only at low tide. Beachfront homes and condominiums are
located east of this portion of the receiver site. As shown in Figure 3.7-1 (Photograph A), huge boulders
have been placed in front of these structures for protection and they are elevated slightly above
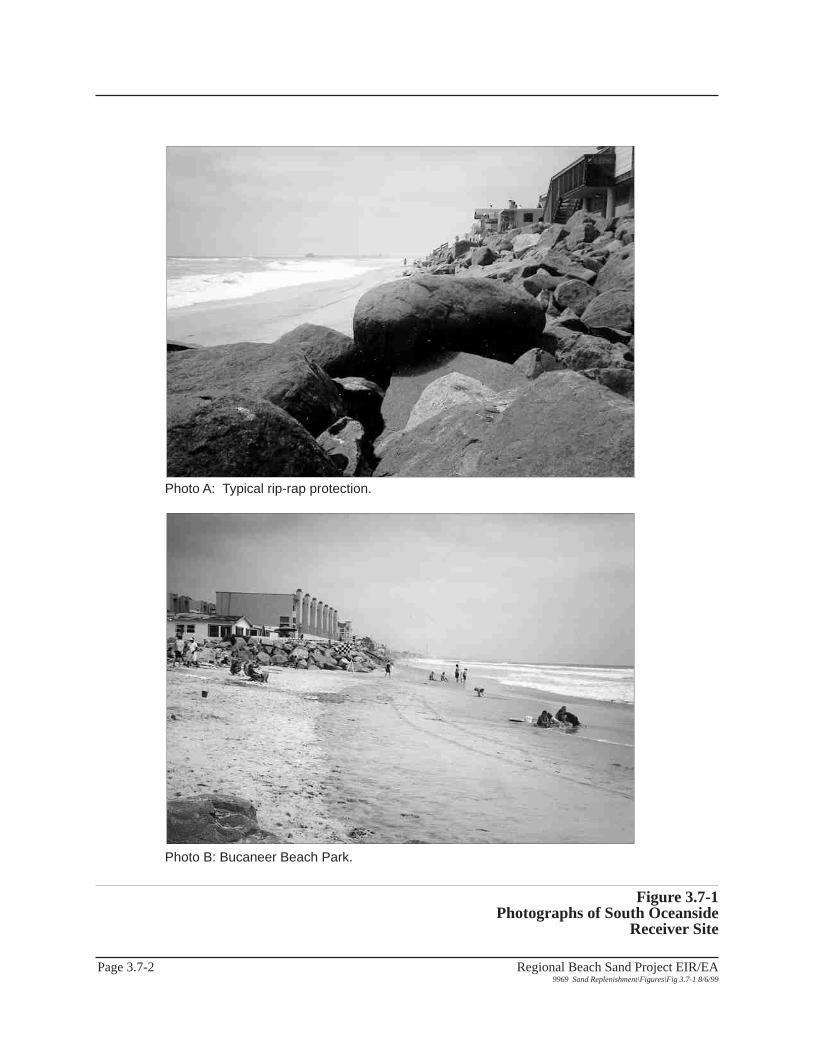
X.X Section Name
Regional Beach Sand Project EIR/EA9969 Sand Replenishment\Figures\Fig 3.7-1 8/6/99
Page 3.7-2
Figure 3.7-1Photographs of South Oceanside
Receiver Site
Photo A: Typical rip-rap protection.
Photo B: Bucaneer Beach Park.

3.7 Aesthetics
Regional Beach Sand Project EIR/EA Page 3.7-399-69\SANDAG EIREA 3.5 to 3.12.wpd 7/17/00
the beach. Buccaneer Beach Park is located within the receiver site. This park is situated where Loma
Alta Creek drains to the ocean. Because the immediate area has not been developed, there is a sandy
beach approximately 150 feet wide and 125 feet from the road to the line of rip-rap which protects homes
on either side of the park. Photograph B in Figure 3.7-1 is a photograph of the beach in front of Buccaneer
Beach Park and shows the relatively greater activity level at this location.
The delivery pipeline would make landfall south of 9th Avenue and continue south to the receiver site. It
would be generally parallel to the Strand on the west side of the sea wall. On the east side of the Strand
there are a mix of beach-front homes, condominiums, parks, shops, and restaurants. West of the road
there is a short wall which allows residents and users of the Strand to view the flat sandy beach. This beach
narrows as it approaches Wisconsin Avenue. Also visible are palm trees (parallel to the wall from 9th
Street to the Tyson Street Park), a traffic circle at 6th Street, a small parking lot just north of the pier at 3rd
Street, and various lifeguard towers.
North Carlsbad
Primary views of the proposed North Carlsbad receiver site are from beachfront residences, which front
the proposed site from the northern boundary near the mouth of the Buena Vista Lagoon to Pine Avenue
(Figure 3.7-2, Photograph A). From Pine Avenue to the southern terminus near Hemlock Street, residents
are located on the bluff tops east of Carlsbad Boulevard and a walkway is constructed near the base of
the bluffs with intermittent beach access points (Figure 3.7-2, Photograph B). The North Carlsbad receiver
site is also visible for recreationalists at Buena Vista Lagoon, drivers on Ocean Street where intermittent
beach access is available, and Carlsbad Boulevard. Visual resources at the North Carlsbad receiver site
consist of a flat sandy beach lying in front of rip-rap or vegetated slopes, and sea walls that support beach-
front structures. Slopes behind these protection structures rise to a height of approximately 30 feet.
Structures along this receiver site include single-family residences, apartments, condominiums, and a military
preparatory school. The sand beach along this site is typically under water during high tide.
The delivery pipeline would extend from the South Oceanside receiver site across the Buena Vista Lagoon
mouth. Generally, it would be placed as far landward on the beach as possible to reduce exposure to wave
action. From Hemlock Street south to the terminus of Tamarack Avenue, the pattern of adjacent residents
on bluff tops, east of a busy roadway, continues. However, continuing south across the lagoon mouth there
are no adjacent residents until approximately Cannon Road. Viewers would be limited to drivers along
X.X Section Name
Regional Beach Sand Project EIR/EA9969 Sand Replenishment\Figures\Fig 3.7-2 8/6/99
Page 3.7-4
Figure 3.7-2Photograph of North Carlsbad
Receiver Site
Photo A: Typical view looking north near Pine Street.
3.7 Aesthetics
Regional Beach Sand Project EIR/EA Page 3.7-599-69\SANDAG EIREA 3.5 to 3.12.wpd 7/17/00
Cannon Road. A small subdivision is located between Cannon Road and Palomar Airport Road so there
would be residential viewers along this length. From Palomar Airport Road to the south where the pipeline
would eventually serve the receiver site, the adjacent land is undeveloped.
South Carlsbad South and South Carlsbad North
Both of these receiver sites are visible from South Carlsbad State Beach Campground. Portions of the
northern site are visible from the parking areas north of the campground and Carlsbad Boulevard. The
southern site is obscured from drivers by the intervening campground. This receiver site is characterized
by a sand and cobble beach abutted by steep bluff slopes. The only development along this stretch of
beach is the State Beach Campground located on the bluff approximately 65 feet above the site. Several
stairways run from the campground down onto the beach (Figure 3.7-3).
The pipeline to serve these two sites would be extended from borrow site SO-7 which is offshore from
Batiquitos Lagoon to the south. It would come ashore north of the lagoon and traverse State Beach
recreation area to the receiver sites. The general goal is to place the pipeline at the base of the bluffs to
reduce exposure to wave action. In this area the bluff slopes vary from non-existent at the lagoon mouth
and 60 to 80 feet at the campground. There are no residents adjacent to the pipeline route.
Batiquitos
This proposed receiver site is just south of Batiquitos Lagoon with the northern portion adjacent to
Carlsbad Boulevard/Coast Highway 101. Continuing south the proposed receiver site is situated in front
of steep bluffs with houses constructed along the tops. Views are available from the roadway and
residences. Views of the beach along this site are dependent upon the tides and location. Near the lagoon
there is more sand (Figure 3.7-4, Photograph A). In front of the bluffs, the situation is different. At low
tide, a low profile sand and cobble beach is visible below the cliffs; however, at high tide the beach is not
visible as waves crash directly against the cliffs. The pipeline to serve this site would come from directly
offshore and be placed as close to the bluff face as possible.
Leucadia
This receiver site is located entirely at the base of the bluffs and residents line the bluff tops. The northern
limit is generally the public staircase at Grandview Avenue. Figure 3.7-4, Photograph B, shows the view

X.X Section Name
Regional Beach Sand Project EIR/EA9969 Sand Replenishment\Figures\Fig 3.7-3 8/6/99
Page 3.7-6
Figure 3.7-3Photographs of South Carlsbad
Receiver Sites
Photo A: Looking North at South Carlsbad North site.
Photo B: Looking South at South Carlsbad South site.
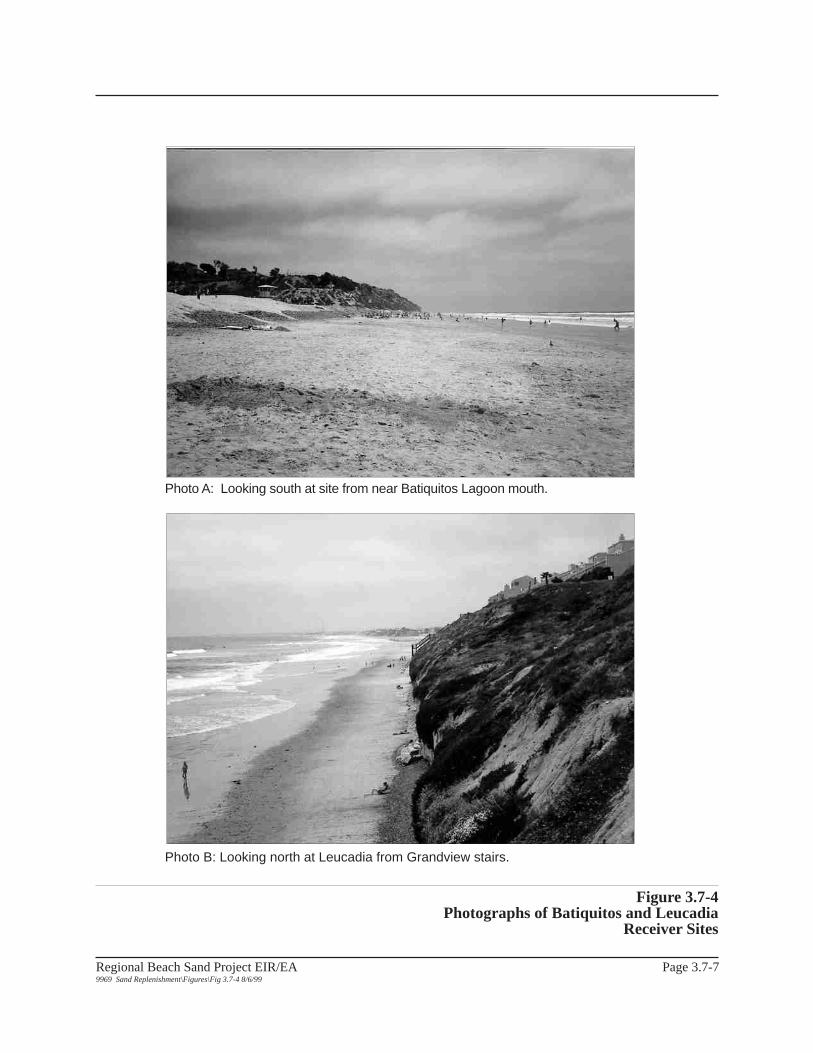
X.X Section Name
Regional Beach Sand Project EIR/EA9969 Sand Replenishment\Figures\Fig 3.7-4 8/6/99
Page 3.7-7
Figure 3.7-4Photographs of Batiquitos and Leucadia
Receiver Sites
Photo A: Looking south at site from near Batiquitos Lagoon mouth.
Photo B: Looking north at Leucadia from Grandview stairs.
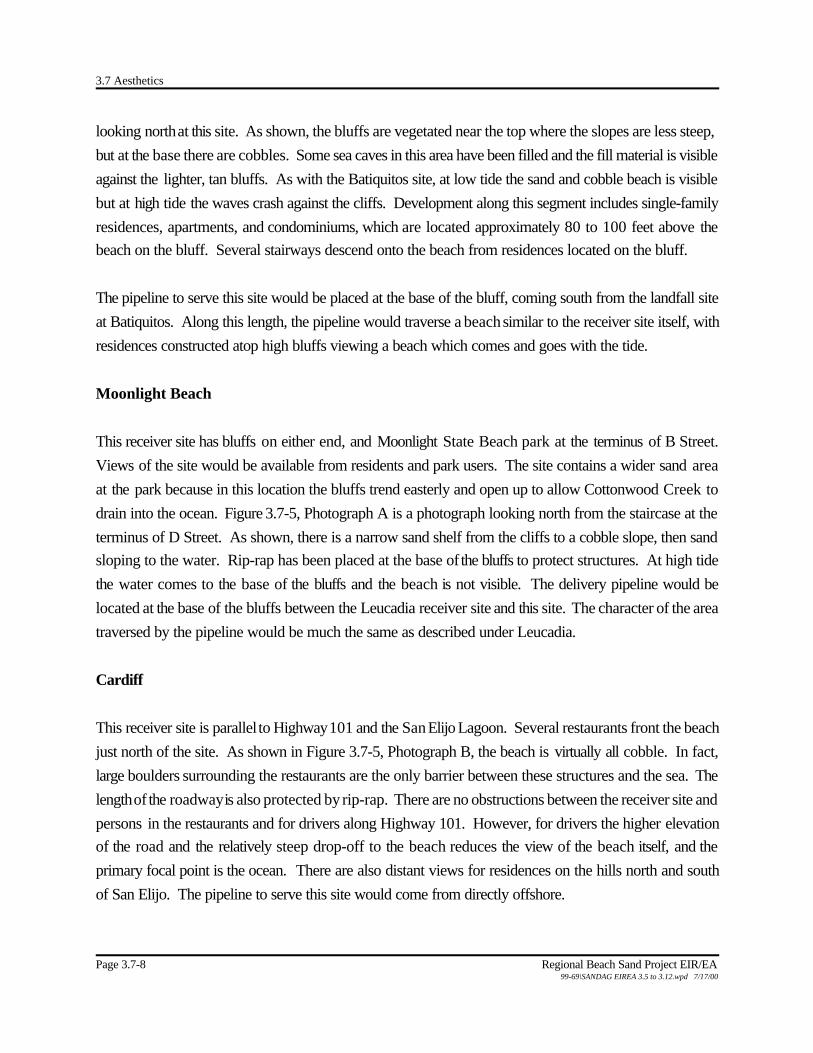
3.7 Aesthetics
Page 3.7-8 Regional Beach Sand Project EIR/EA99-69\SANDAG EIREA 3.5 to 3.12.wpd 7/17/00
looking north at this site. As shown, the bluffs are vegetated near the top where the slopes are less steep,
but at the base there are cobbles. Some sea caves in this area have been filled and the fill material is visible
against the lighter, tan bluffs. As with the Batiquitos site, at low tide the sand and cobble beach is visible
but at high tide the waves crash against the cliffs. Development along this segment includes single-family
residences, apartments, and condominiums, which are located approximately 80 to 100 feet above the
beach on the bluff. Several stairways descend onto the beach from residences located on the bluff.
The pipeline to serve this site would be placed at the base of the bluff, coming south from the landfall site
at Batiquitos. Along this length, the pipeline would traverse a beach similar to the receiver site itself, with
residences constructed atop high bluffs viewing a beach which comes and goes with the tide.
Moonlight Beach
This receiver site has bluffs on either end, and Moonlight State Beach park at the terminus of B Street.
Views of the site would be available from residents and park users. The site contains a wider sand area
at the park because in this location the bluffs trend easterly and open up to allow Cottonwood Creek to
drain into the ocean. Figure 3.7-5, Photograph A is a photograph looking north from the staircase at the
terminus of D Street. As shown, there is a narrow sand shelf from the cliffs to a cobble slope, then sand
sloping to the water. Rip-rap has been placed at the base of the bluffs to protect structures. At high tide
the water comes to the base of the bluffs and the beach is not visible. The delivery pipeline would be
located at the base of the bluffs between the Leucadia receiver site and this site. The character of the area
traversed by the pipeline would be much the same as described under Leucadia.
Cardiff
This receiver site is parallel to Highway 101 and the San Elijo Lagoon. Several restaurants front the beach
just north of the site. As shown in Figure 3.7-5, Photograph B, the beach is virtually all cobble. In fact,
large boulders surrounding the restaurants are the only barrier between these structures and the sea. The
length of the roadway is also protected by rip-rap. There are no obstructions between the receiver site and
persons in the restaurants and for drivers along Highway 101. However, for drivers the higher elevation
of the road and the relatively steep drop-off to the beach reduces the view of the beach itself, and the
primary focal point is the ocean. There are also distant views for residences on the hills north and south
of San Elijo. The pipeline to serve this site would come from directly offshore.
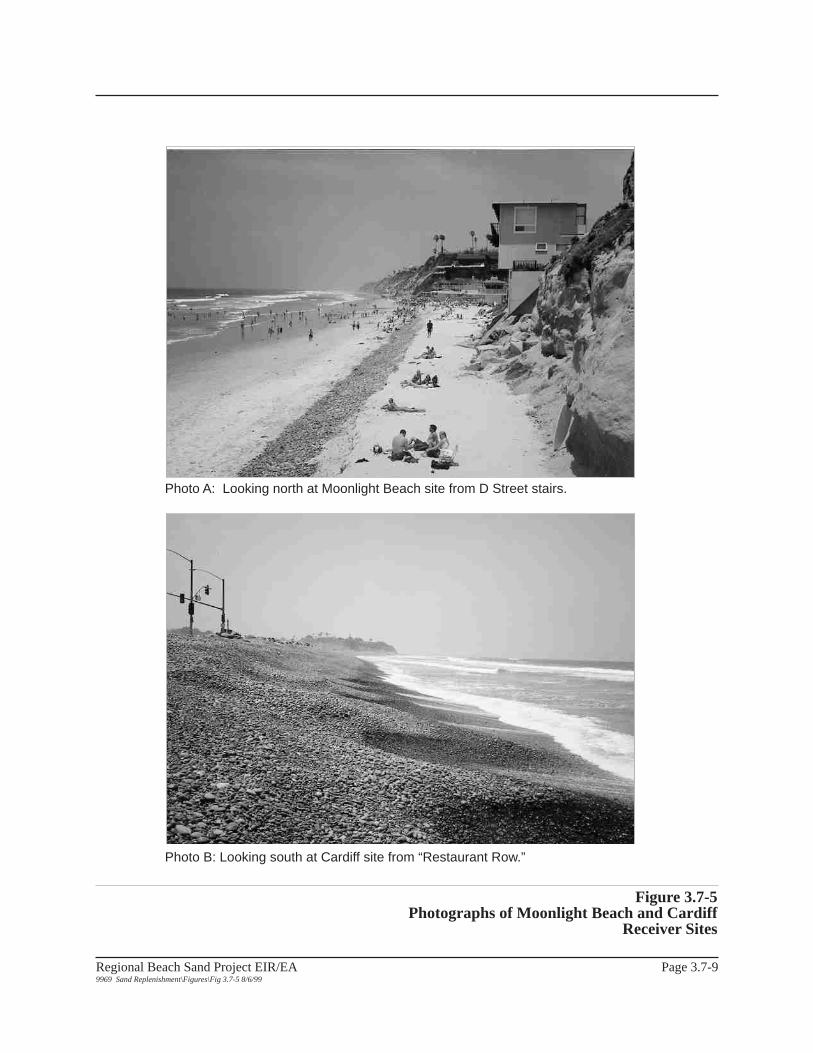
X.X Section Name
Regional Beach Sand Project EIR/EA9969 Sand Replenishment\Figures\Fig 3.7-5 8/6/99
Page 3.7-9
Figure 3.7-5Photographs of Moonlight Beach and Cardiff
Receiver Sites
Photo A: Looking north at Moonlight Beach site from D Street stairs.
Photo B: Looking south at Cardiff site from “Restaurant Row.”

3.7 Aesthetics
Page 3.7-10 Regional Beach Sand Project EIR/EA99-69\SANDAG EIREA 3.5 to 3.12.wpd 7/17/00
Solana Beach
This receiver site sits below steep cliffs and is visible from the stairs at Solana Vista Drive, Fletcher Cove,
and some residences along the bluff. It currently consists of little or no existing beach area. Views of the
beach along this stretch are dependent upon the tides. At high tide the beach is not visible along the
majority of the receiver site as waves crash directly against the cliffs. The only exception is the small sandy
beach at Fletcher Cove which sits above the high tide mark and is located just north of the receiver site.
At low tide a low profile sand and cobble beach is visible below the cliffs (Figure 3.7-6, Photograph A).
The pipeline to deliver sand would come from offshore and would landfall at the northern end of the
receiver site.
Del Mar
The vast majority of the receiver site is characterized by homes built on the beach, there are no bluffs along
the receiver site. All structures are protected by sea walls or rip-rap and there are access ramps or stairs
from most residences to the beach (Figure 3.7-6, Photograph B). This beach is relatively wide and even
at high tide water does not reach the sea walls (except during storm events). At the southern end of the
receiver site is Powerhouse Park. There would be clear views of the site from this park, from all
beachfront residences and from the local access points at roadway terminuses.
The pipeline to serve this site would come from directly offshore; however, it would also extend south to
serve the Torrey Pines receiver site. East of Camino del Mar, the hills have been constructed with
residences which, depending upon orientation, have elevated coastal views. These residents may have
views of the receiver site and the dredge location, but these elements would be part of a larger viewscape
of the ocean and a length of coastline.
Torrey Pines
The Torrey Pines receiver site is visible from North Torrey Pines Road, the parking area at Torrey Pines
State Reserve, and view points within the State Reserve. This segment consists of a thin sand and cobble
beach abutted by steep cliffs. Much of the southern part of the site is visible only during low tide, as waves
reach the base of the cliffs at high tide. Cliffs range in elevation from approximately 50 to 200 feet. The
beach trail from the State Reserve descends onto the beach, south of the receiver site. With the exception
of the parking area for the State Reserve, no development exists in the vicinity of this site (Figure 3.7-7,
Photograph A). There are residences constructed on the hills north of Peñasquitos Lagoon with distant
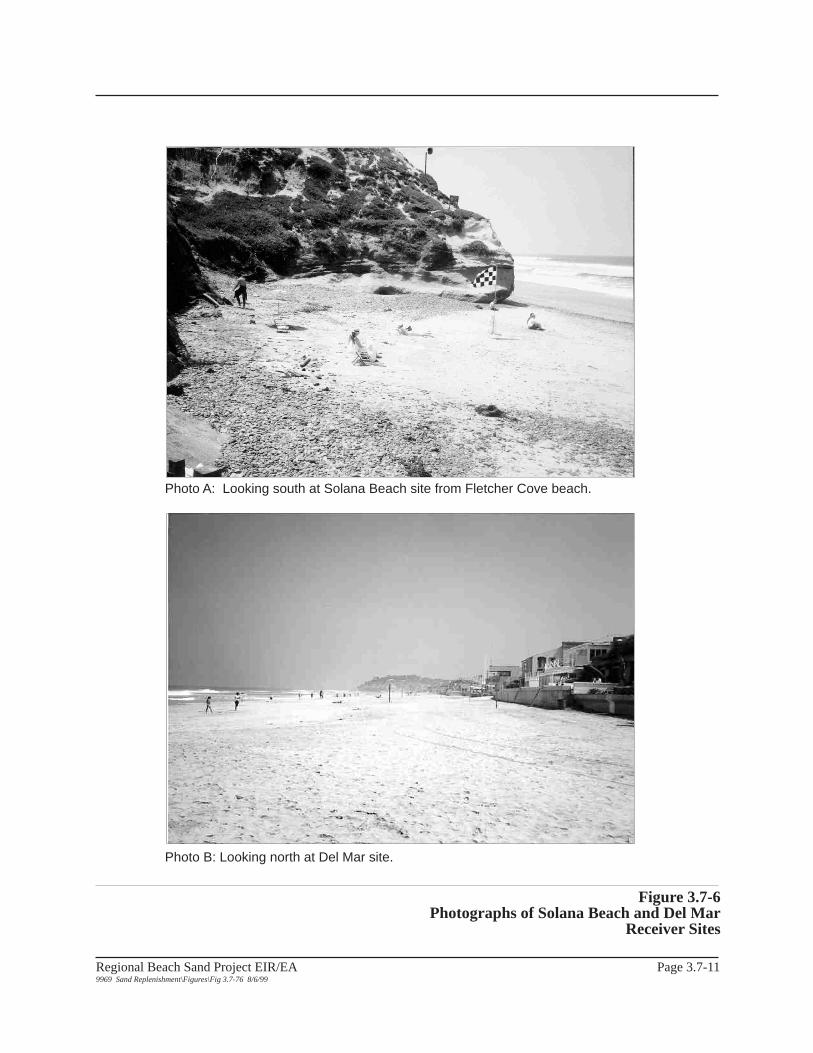
X.X Section Name
Regional Beach Sand Project EIR/EA9969 Sand Replenishment\Figures\Fig 3.7-76 8/6/99
Page 3.7-11
Figure 3.7-6Photographs of Solana Beach and Del Mar
Receiver Sites
Photo A: Looking south at Solana Beach site from Fletcher Cove beach.
Photo B: Looking north at Del Mar site.
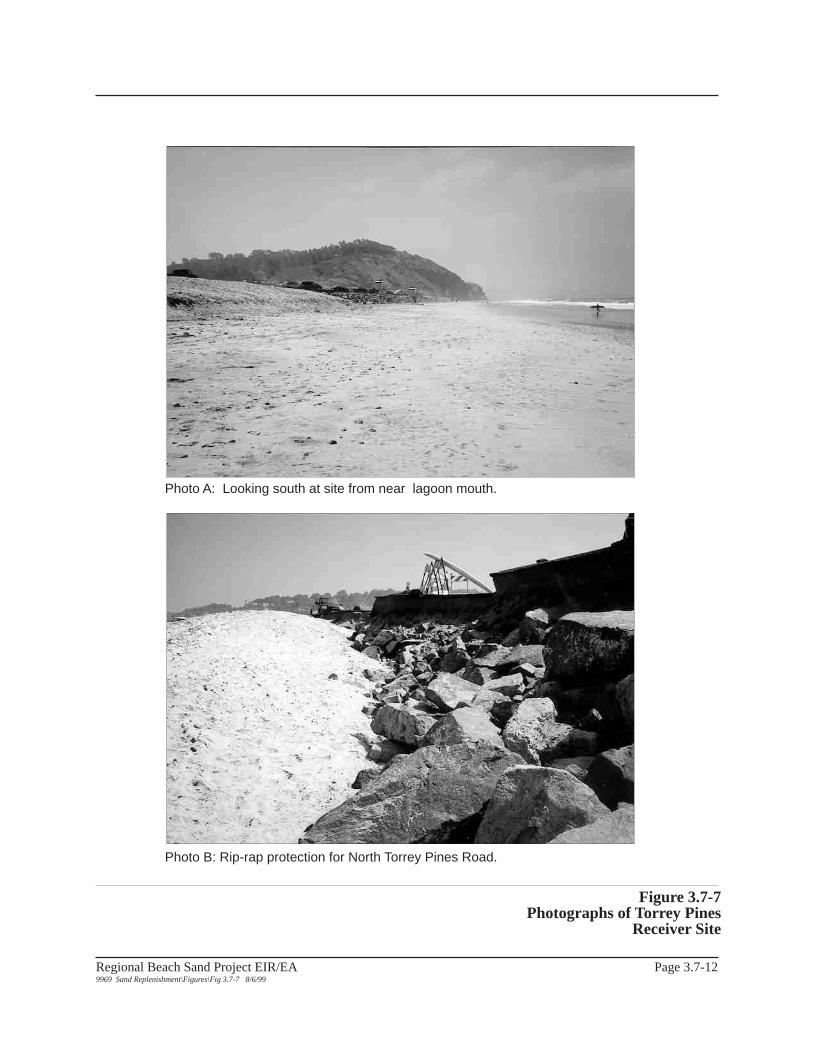
X.X Section Name
Regional Beach Sand Project EIR/EA9969 Sand Replenishment\Figures\Fig 3.7-7 8/6/99
Page 3.7-12
Figure 3.7-7Photographs of Torrey Pines
Receiver Site
Photo A: Looking south at site from near lagoon mouth.
Photo B: Rip-rap protection for North Torrey Pines Road.
3.7 Aesthetics
Regional Beach Sand Project EIR/EA Page 3.7-1399-69\SANDAG EIREA 3.5 to 3.12.wpd 7/17/00
views of the receiver site. As in the Del Mar receiver site, the Torrey Pines site would be one component
of the viewscape which includes the lagoon, beach, and steep hills of Torrey Pines State Park.
The lack of sand and protection for North Torrey Pines Road has resulted in severe erosion and failure at
the road’s western edges. Figure 3.7-7, Photograph B shows the rip-rap protection underneath this closed
portion of the roadway.
The delivery pipeline would extend south from the Del Mar receiver site. From Seagrove Park to the south
to just past 4th Street, it would traverse a fairly large, low profile sandy beach abutted by steep slopes. The
pipeline itself would likely be located at the base of the bluffs. The Amtrak/Coaster (ATS&F) railroad
tracks are located on the bluff approximately 40 feet directly above the beach. Several residences are
located 15 to 30 feet upslope of the railroad tracks. South of this location, the beach character changes.
The bluffs descend to beach level at the mouth of the Peñasquitos Lagoon. There are no houses adjacent
to the beach in this location. Here the beach is paralleled by South Camino Del Mar/North Torrey Pines
Road.
Mission Beach
This receiver site is similar to Del Mar in that residential structures (homes, condominiums and apartments)
are built at the beach level and a relatively low sea wall separates the beach from these homes. At Mission
Beach there is an approximately 12 foot-wide boardwalk between the wall and the residents. This popular
boardwalk is used for walking, running, bicycling, and roller blading. Views are available both for residents
and users of the boardwalk. As shown in Figure 3.7-8, Photograph A, the beach in this location is
characterized mostly by sand. During storm events waves can over top the sea wall and boardwalk, but
generally the high tide is well below this structure. The pipeline to serve this site would come from directly
offshore.
Imperial Beach
The Imperial Beach site is characterized entirely by homes, apartments and condominiums constructed on
the beach. Most are protected by rip-rap. The northen end of the site, from Imperial Beach Boulevard to
Beach Avenue, has some sand and cobble, but south of Beach Avenue the beach is entirely cobble (Figure
3.7-8, Photograph B). Views would be available from residents along the site and from the pier which is
over 700 feet north of the northern project terminus (maximum footprint length). The pipeline to serve this
site would come from directly off-shore.

X.X Section Name
Regional Beach Sand Project EIR/EA9969 Sand Replenishment\Figures\Fig 3.7-8 8/6/99
Page 3.7-14
Figure 3.7-8Photographs of Mission Beach and Imperial Beach
Receiver Sites
Photo A: Looking south at Mission Beach site.
Photo B: Looking south at Imperial Beach site, just south of Beach Avenue.
3.8 Socioeconomics
Regional Beach Sand Project EIR/EA Page 3.8-199-69\SANDAG EIREA 3.5 to 3.12.wpd 7/17/00
3.8 SOCIOECONOMICS
Under NEPA “economic” and “social” effects are environmental consequences to be examined (40 C.F.R.
§ 1502.16 and 40 C.F.R. § 1508.8). Under CEQA, the focus of an EIR is primarily on potential changes
to the “physical conditions” which includes land, air, water, flora, fauna, population, housing, noise, and
objects of historic or aesthetic significance (Cal. Pub. Res. Code § 21060.5; Cal. Code Regs. Title 14 §
15358(b) and § 15382). The proposed action would place sand on existing beaches where there are no
structures, except lifeguard towers, and there would be no physical changes to population or housing.
In addition to examining potential social and economic impacts to local and regional populations as a whole,
any NEPA document must consider the potential for disproportionate environmental impacts to minority
or low-income populations, as well as potential disproportionate environmental health and safety risks to
children, in order to comply with relevant federal Executive Orders. Those analyses are contained in
Sections 6.6 and 6.7 of this EIR/EA, but the supporting demographic information on population, ethnicity
and income is provided in this section.
The primary social and economic related focus of the proposed project, as stated in the Purpose and Need
of this EIR/EA (Section 1.2), is straightforward. The placement of sand at these public beaches is intended
to enhance a valuable public resource that serves local residents in a number of ways. These include
enhancing recreational opportunities at the receiver sites and bolstering the beaches as an important element
of San Diego’s attraction as a tourist destination, thereby providing benefits to the entire regional economy.
In addition to local and regional demographic and income information, this section presents information on
commercial fisheries, the local social and economic sector most likely to adversely impacted by the
proposed project. During the NOP process, the California Lobster and Trap Fishermen’s Association,
the Sea Urchin Harvesters’ Association, California, and the Urchin Procedures Marketing Association
raised several concerns regarding sand placement and potential impacts to these commercial fishing
resources. As part of this EIR/EA process, these groups were contacted for further input. Refer to
Chapter 7.0 for a summary of the coordination and consultation efforts with these groups.
This section contains census data regarding population and income in subsection 3.8.1. Commercial
fisheries and the relative economic value of various species are discussed in subsection 3.8.2. Kelp
harvesting value is addressed in subsection 3.8.3 followed by recreational fishing and diving value in
subsection 3.8.4.
3.8 Socioeconomics
Page 3.8-2 Regional Beach Sand Project EIR/EA99-69\SANDAG EIREA 3.5 to 3.12.wpd 7/17/00
3.8.1 Socioeconomic Characteristics
In terms of the broad economic contribution of beaches to the economy as a whole, while the total value
of the beaches to the local jurisdictions and the region is known to be substantial, the quantification of the
value of this resource is not straightforward. One way to approach the problem of valuation of is to
examine the estimated costs of continuing beach loss to the region. As noted in subsection 2.4.3 (No
Action Alternative), an earlier regional study (SANDAG 1993) places estimated annual costs (losses) of
lost property and recreational benefits to the region at $52 million by 2010 and over $226 million by 2040.
To provide a localized socioeconomic context for the proposed project, the remainder of this section
presents information on population and income in the project area. To meet the specific intent of Executive
Order 12898 on Environmental Justice (59 Fed. Reg. 7629 (1994)), it is necessary to consider the minority R
and economic status of the population surrounding receiver beaches. To allow for a subsequent assessment R
of potential disproportionate impacts to minority populations and low-income populations it is necessary
to compare the same type of demographic and income information for the local jurisdiction and larger
region. Therefore, these data provide information on population, ethnicity, and median income for each
of the receiver beaches compared to the local jurisdiction and the San Diego County region. (Housing and
employment data, often presented in socioeconomic sections of NEPA documents, are not provided in this
section as the proposed project is not considered likely to have any direct impact on either housing or
employment in the immediate area. Potential positive benefits to employment as a result of enhanced
recreational and tourism opportunities would likely be felt at a subregional or regional level.)
Census tracts are the standard localized units of analysis for these types of data. The receiver beaches are
contained within twelve census tracts. These census tracts, as well as the receiver beach sites they each
encompass, are listed in Table 3.8-1. Although some tracts contain all or portions of more than one
receiver beach, some sites straddle two census tracts. In addition, census tract boundaries do not follow
city boundaries. For example, census tract 173.03 includes portions of both Encinitas and Solana Beach.
The data presented in this section for local jurisdictions and the region as a whole are from SANDAG
Demographic and Economic Estimates Profiles which are derived from 1990 census data. Data for
individual census tracts are directly from the 1990 Census (STF 3A).
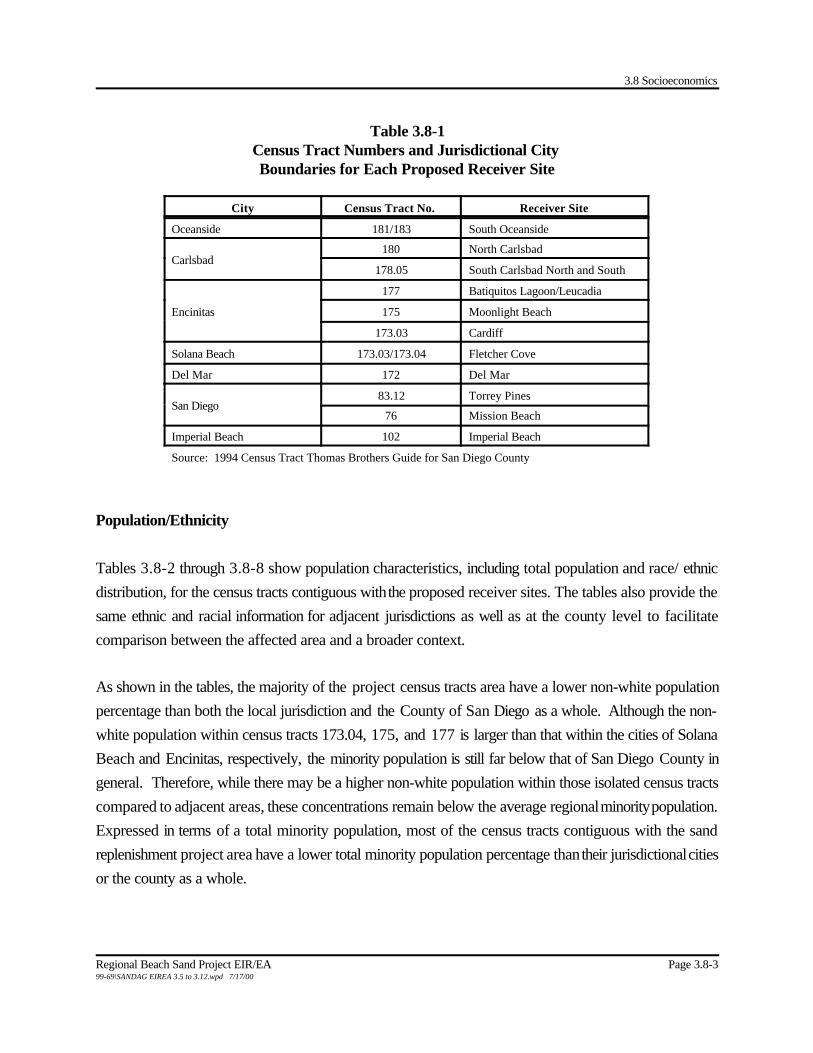
3.8 Socioeconomics
Regional Beach Sand Project EIR/EA Page 3.8-399-69\SANDAG EIREA 3.5 to 3.12.wpd 7/17/00
Table 3.8-1Census Tract Numbers and Jurisdictional City Boundaries for Each Proposed Receiver Site
City Census Tract No. Receiver Site
Oceanside 181/183 South Oceanside
Carlsbad180 North Carlsbad
178.05 South Carlsbad North and South
Encinitas
177 Batiquitos Lagoon/Leucadia
175 Moonlight Beach
173.03 Cardiff
Solana Beach 173.03/173.04 Fletcher Cove
Del Mar 172 Del Mar
San Diego83.12 Torrey Pines
76 Mission Beach
Imperial Beach 102 Imperial Beach
Source: 1994 Census Tract Thomas Brothers Guide for San Diego County
Population/Ethnicity
Tables 3.8-2 through 3.8-8 show population characteristics, including total population and race/ ethnic
distribution, for the census tracts contiguous with the proposed receiver sites. The tables also provide the
same ethnic and racial information for adjacent jurisdictions as well as at the county level to facilitate
comparison between the affected area and a broader context.
As shown in the tables, the majority of the project census tracts area have a lower non-white population
percentage than both the local jurisdiction and the County of San Diego as a whole. Although the non-
white population within census tracts 173.04, 175, and 177 is larger than that within the cities of Solana
Beach and Encinitas, respectively, the minority population is still far below that of San Diego County in
general. Therefore, while there may be a higher non-white population within those isolated census tracts
compared to adjacent areas, these concentrations remain below the average regional minority population.
Expressed in terms of a total minority population, most of the census tracts contiguous with the sand
replenishment project area have a lower total minority population percentage than their jurisdictional cities
or the county as a whole.
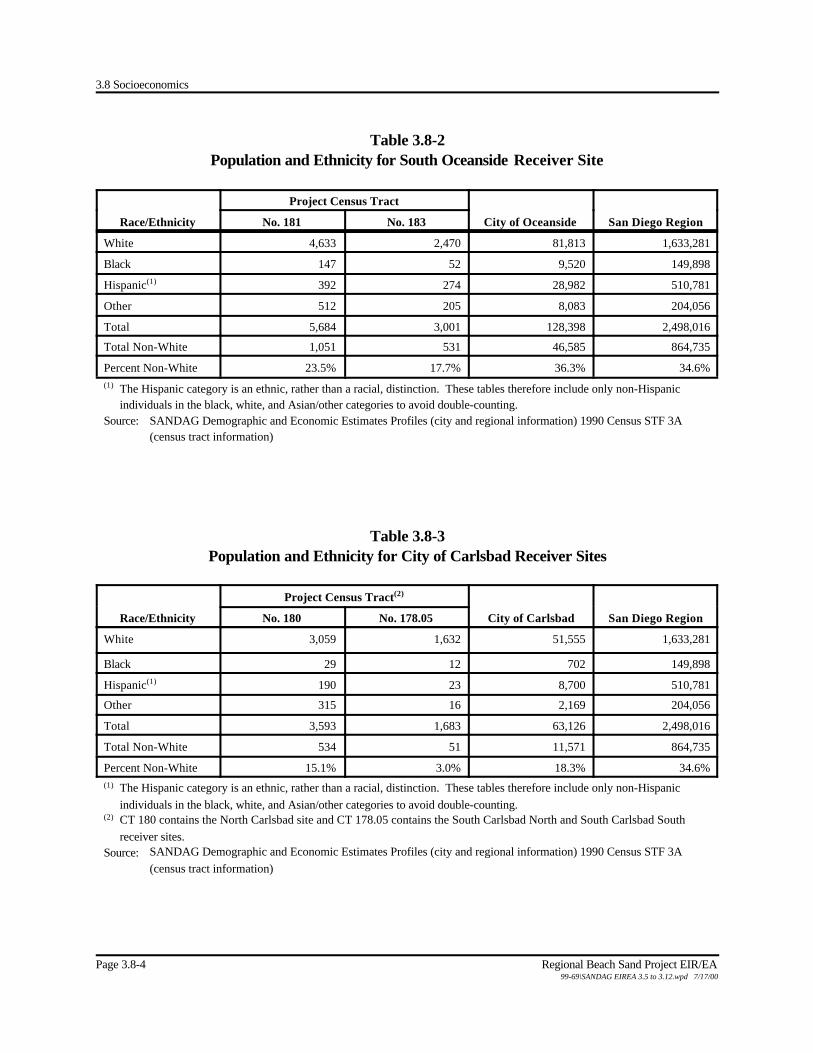
3.8 Socioeconomics
Page 3.8-4 Regional Beach Sand Project EIR/EA99-69\SANDAG EIREA 3.5 to 3.12.wpd 7/17/00
Table 3.8-2Population and Ethnicity for South Oceanside Receiver Site
Race/Ethnicity
Project Census Tract
City of Oceanside San Diego RegionNo. 181 No. 183
White 4,633 2,470 81,813 1,633,281
Black 147 52 9,520 149,898
Hispanic(1) 392 274 28,982 510,781
Other 512 205 8,083 204,056
Total 5,684 3,001 128,398 2,498,016
Total Non-White 1,051 531 46,585 864,735
Percent Non-White 23.5% 17.7% 36.3% 34.6%(1) The Hispanic category is an ethnic, rather than a racial, distinction. These tables therefore include only non-Hispanic
individuals in the black, white, and Asian/other categories to avoid double-counting.Source: SANDAG Demographic and Economic Estimates Profiles (city and regional information) 1990 Census STF 3A
(census tract information)
Table 3.8-3Population and Ethnicity for City of Carlsbad Receiver Sites
Race/Ethnicity
Project Census Tract(2)
City of Carlsbad San Diego RegionNo. 180 No. 178.05
White 3,059 1,632 51,555 1,633,281
Black 29 12 702 149,898
Hispanic(1) 190 23 8,700 510,781
Other 315 16 2,169 204,056
Total 3,593 1,683 63,126 2,498,016
Total Non-White 534 51 11,571 864,735
Percent Non-White 15.1% 3.0% 18.3% 34.6%(1) The Hispanic category is an ethnic, rather than a racial, distinction. These tables therefore include only non-Hispanic
individuals in the black, white, and Asian/other categories to avoid double-counting.(2) CT 180 contains the North Carlsbad site and CT 178.05 contains the South Carlsbad North and South Carlsbad South
receiver sites.Source: SANDAG Demographic and Economic Estimates Profiles (city and regional information) 1990 Census STF 3A
(census tract information)
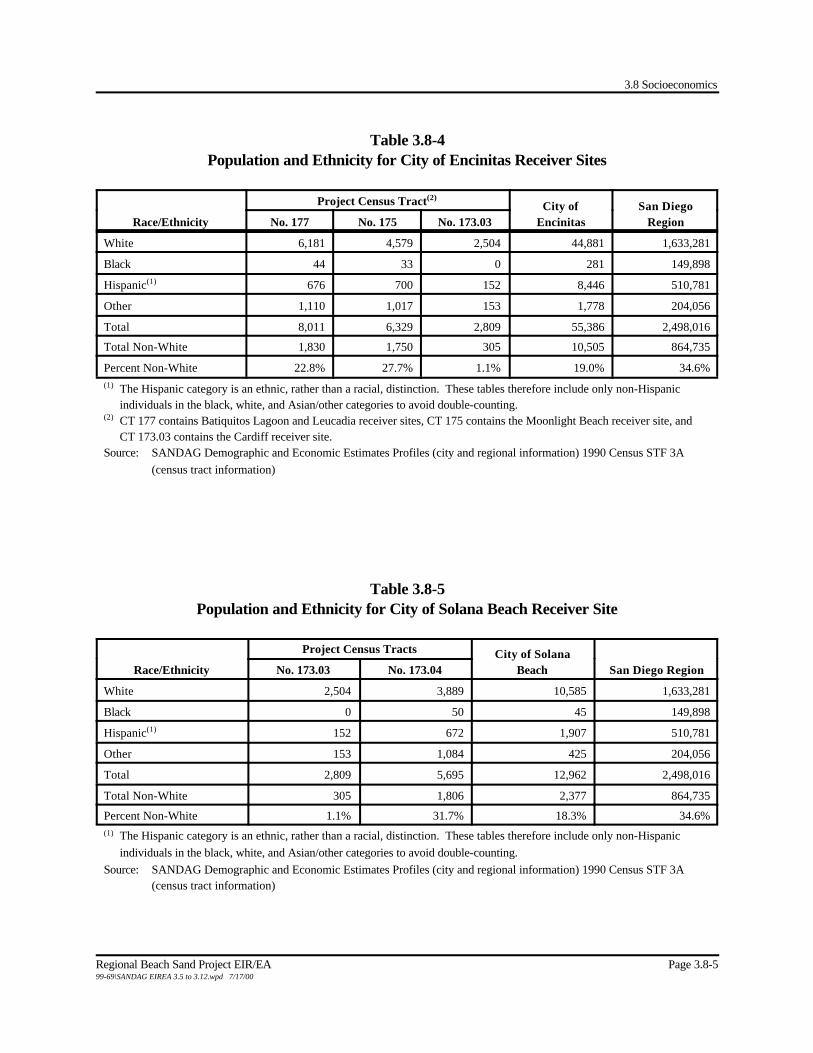
3.8 Socioeconomics
Regional Beach Sand Project EIR/EA Page 3.8-599-69\SANDAG EIREA 3.5 to 3.12.wpd 7/17/00
Table 3.8-4Population and Ethnicity for City of Encinitas Receiver Sites
Race/Ethnicity
Project Census Tract(2)City of
EncinitasSan Diego
RegionNo. 177 No. 175 No. 173.03
White 6,181 4,579 2,504 44,881 1,633,281
Black 44 33 0 281 149,898
Hispanic(1) 676 700 152 8,446 510,781
Other 1,110 1,017 153 1,778 204,056
Total 8,011 6,329 2,809 55,386 2,498,016
Total Non-White 1,830 1,750 305 10,505 864,735
Percent Non-White 22.8% 27.7% 1.1% 19.0% 34.6%(1) The Hispanic category is an ethnic, rather than a racial, distinction. These tables therefore include only non-Hispanic
individuals in the black, white, and Asian/other categories to avoid double-counting.(2) CT 177 contains Batiquitos Lagoon and Leucadia receiver sites, CT 175 contains the Moonlight Beach receiver site, and
CT 173.03 contains the Cardiff receiver site.Source: SANDAG Demographic and Economic Estimates Profiles (city and regional information) 1990 Census STF 3A
(census tract information)
Table 3.8-5Population and Ethnicity for City of Solana Beach Receiver Site
Race/Ethnicity
Project Census Tracts City of SolanaBeach San Diego RegionNo. 173.03 No. 173.04
White 2,504 3,889 10,585 1,633,281
Black 0 50 45 149,898
Hispanic(1) 152 672 1,907 510,781
Other 153 1,084 425 204,056
Total 2,809 5,695 12,962 2,498,016
Total Non-White 305 1,806 2,377 864,735
Percent Non-White 1.1% 31.7% 18.3% 34.6%(1) The Hispanic category is an ethnic, rather than a racial, distinction. These tables therefore include only non-Hispanic
individuals in the black, white, and Asian/other categories to avoid double-counting.Source: SANDAG Demographic and Economic Estimates Profiles (city and regional information) 1990 Census STF 3A
(census tract information)

3.8 Socioeconomics
Page 3.8-6 Regional Beach Sand Project EIR/EA99-69\SANDAG EIREA 3.5 to 3.12.wpd 7/17/00
Table 3.8-6Population and Ethnicity for Del Mar Receiver Site
Race/EthnicityProject Census Tract
No. 172 City of Del Mar San Diego Region
White 4,436 4,514 1,633,281
Black 24 33 149,898
Hispanic(1) 143 177 510,781
Other 172 136 204,056
Total 4,775 4,860 2,498,016
Total Non-White 339 346 864,735
Percent Non-White 7.1% 7.1% 34.6%(1) The Hispanic category is an ethnic, rather than a racial, distinction. These tables therefore include only non-Hispanic
individuals in the black, white, and Asian/other categories to avoid double-counting.Source: SANDAG Demographic and Economic Estimates Profiles (city and regional information) 1990 Census STF 3A
(census tract information)
Table 3.8-7Population and Ethnicity for City of San Diego Receiver Sites
Race/Ethnicity
Project Census Tract(2)
City of San Diego San Diego RegionNo. 83.12 No. 76
White 3,351 6,323 651,735 1,633,281
Black 13 39 98,852 149,898
Hispanic(1) 110 273 229,519 510,781
Other 166 268 130,443 204,056
Total 3,640 6,903 1,110,549 2,498,016
Total Non-White 289 580 458,814 864,735
Percent Non-White 7.9% 8.4% 41.3% 34.6%(1) The Hispanic category is an ethnic, rather than a racial, distinction. These tables therefore include only non-Hispanic
individuals in the black, white, and Asian/other categories to avoid double-counting.(2) CT 83.12 contains the Torrey Pines receiver site and CT 76 contains the Mission Beach receiver site.Source: SANDAG Demographic and Economic Estimates Profiles (city and regional information) 1990 Census STF 3A
(census tract information)
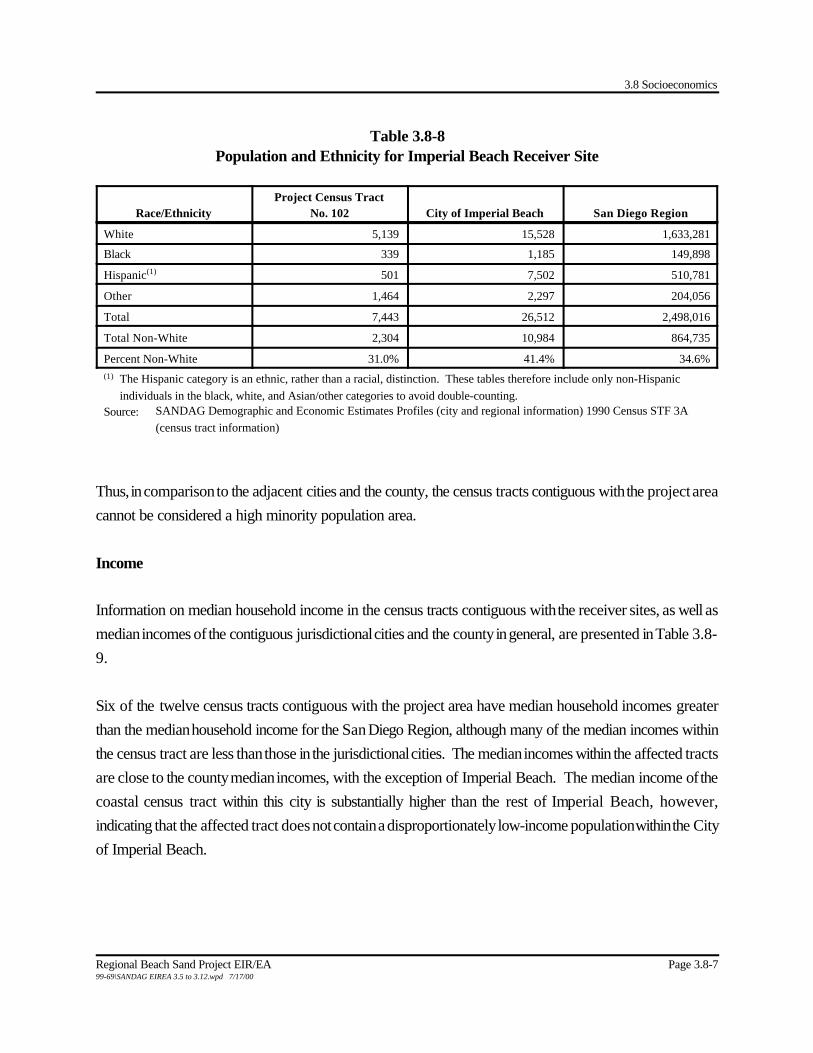
3.8 Socioeconomics
Regional Beach Sand Project EIR/EA Page 3.8-799-69\SANDAG EIREA 3.5 to 3.12.wpd 7/17/00
Table 3.8-8Population and Ethnicity for Imperial Beach Receiver Site
Race/EthnicityProject Census Tract
No. 102 City of Imperial Beach San Diego Region
White 5,139 15,528 1,633,281
Black 339 1,185 149,898
Hispanic(1) 501 7,502 510,781
Other 1,464 2,297 204,056
Total 7,443 26,512 2,498,016
Total Non-White 2,304 10,984 864,735
Percent Non-White 31.0% 41.4% 34.6%(1) The Hispanic category is an ethnic, rather than a racial, distinction. These tables therefore include only non-Hispanic
individuals in the black, white, and Asian/other categories to avoid double-counting.Source: SANDAG Demographic and Economic Estimates Profiles (city and regional information) 1990 Census STF 3A
(census tract information)
Thus, in comparison to the adjacent cities and the county, the census tracts contiguous with the project area
cannot be considered a high minority population area.
Income
Information on median household income in the census tracts contiguous with the receiver sites, as well as
median incomes of the contiguous jurisdictional cities and the county in general, are presented in Table 3.8-
9.
Six of the twelve census tracts contiguous with the project area have median household incomes greater
than the median household income for the San Diego Region, although many of the median incomes within
the census tract are less than those in the jurisdictional cities. The median incomes within the affected tracts
are close to the county median incomes, with the exception of Imperial Beach. The median income of the
coastal census tract within this city is substantially higher than the rest of Imperial Beach, however,
indicating that the affected tract does not contain a disproportionately low-income population within the City
of Imperial Beach.
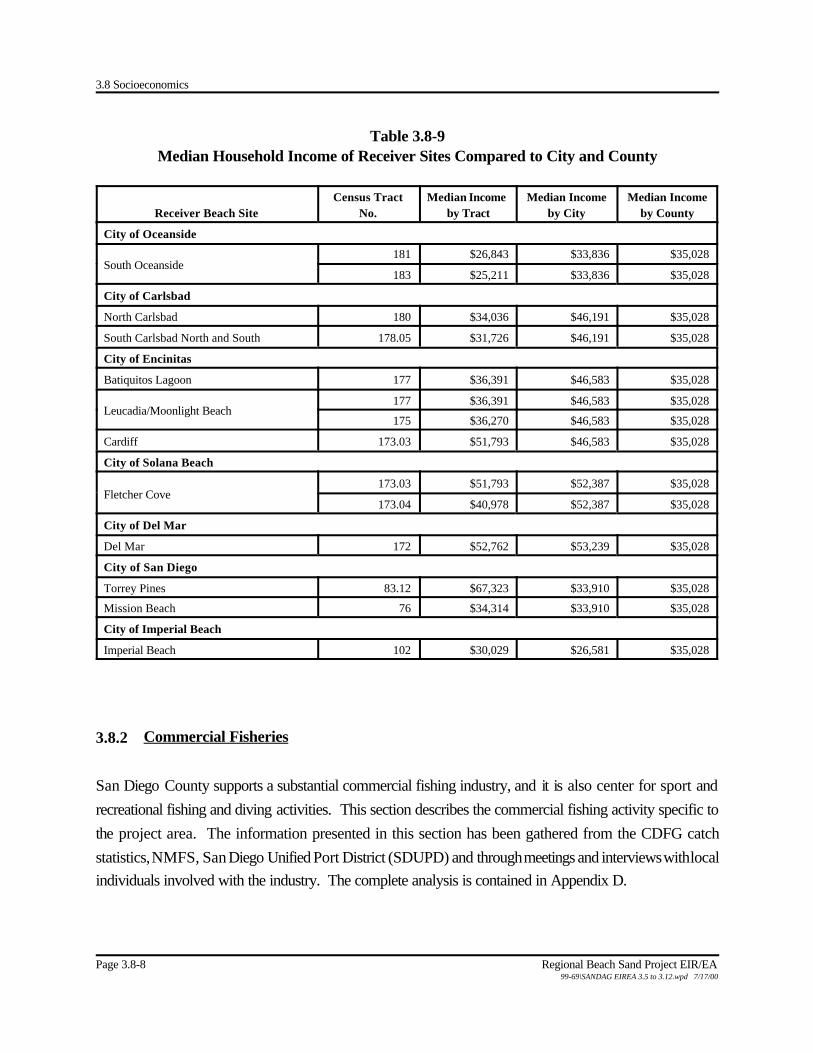
3.8 Socioeconomics
Page 3.8-8 Regional Beach Sand Project EIR/EA99-69\SANDAG EIREA 3.5 to 3.12.wpd 7/17/00
Table 3.8-9Median Household Income of Receiver Sites Compared to City and County
Receiver Beach SiteCensus Tract
No.Median Income
by TractMedian Income
by CityMedian Income
by County
City of Oceanside
South Oceanside181 $26,843 $33,836 $35,028
183 $25,211 $33,836 $35,028
City of Carlsbad
North Carlsbad 180 $34,036 $46,191 $35,028
South Carlsbad North and South 178.05 $31,726 $46,191 $35,028
City of Encinitas
Batiquitos Lagoon 177 $36,391 $46,583 $35,028
Leucadia/Moonlight Beach177 $36,391 $46,583 $35,028
175 $36,270 $46,583 $35,028
Cardiff 173.03 $51,793 $46,583 $35,028
City of Solana Beach
Fletcher Cove173.03 $51,793 $52,387 $35,028
173.04 $40,978 $52,387 $35,028
City of Del Mar
Del Mar 172 $52,762 $53,239 $35,028
City of San Diego
Torrey Pines 83.12 $67,323 $33,910 $35,028
Mission Beach 76 $34,314 $33,910 $35,028
City of Imperial Beach
Imperial Beach 102 $30,029 $26,581 $35,028
3.8.2 Commercial Fisheries
San Diego County supports a substantial commercial fishing industry, and it is also center for sport and
recreational fishing and diving activities. This section describes the commercial fishing activity specific to
the project area. The information presented in this section has been gathered from the CDFG catch
statistics, NMFS, San Diego Unified Port District (SDUPD) and through meetings and interviews with local
individuals involved with the industry. The complete analysis is contained in Appendix D.

3.8 Socioeconomics
Regional Beach Sand Project EIR/EA Page 3.8-999-69\SANDAG EIREA 3.5 to 3.12.wpd 7/17/00
Regional Overview
Several species of invertebrates and fish found in the project area are economically valuable marine
resources, and the commercial fishery has been well established in the local economy for decades. The
composition, volume, and the value of the local commercial catch have not been stable over time, however,
as measured by a number of indices.
In terms of number of participants, statewide the number of licensed commercial fisherman since 1980 has
declined by about 50 percent and roughly 70 percent since the late 1970s (SDUPD 1998). The data are
incomplete for San Diego but it is assumed that this area has paralleled the statewide decline. The number
of fishing vessels has shown a similar decline, and the San Diego fleet has decline by about 67 percent since
the mid 1970s. The Port of San Diego, Mission Bay, and Oceanside Harbor are the base for nearly all
commercial operations in the county.
The composition and relative economic importance of the local fishery has changed as well, with the largest
changes being attributable to the local decline of the tuna fishery. In 1950, the San Diego county area
produced the second largest volume and value of commercial fish landings among California’s six primary
fisheries statistical areas, accounting for 25 percent and 35 percent of the state’s total commercial fishing
landing volume and value respectively. By 1990, however, the San Diego county statistical area had
dropped to being the state’s lowest producer, with only one percent and four percent of the California’s
landings volume and value respectively. By 1996, area landings had declined to three percent of the state’s
total value of landings. The role of tuna in these large scale changes can be seen by the fact that in 1980,
various species of tuna comprised 96 percent of San Diego’s volume and value of landings. By 1990, this
figure had dropped to less than one percent of volume and value of local landings.
In general, over the past 25 years, the California fishing industry was harvesting less catch, required fewer
fisherman, and utilized a smaller fleet in both boat length and numbers to bring the catch to port. Locally,
since 1985, exclusive of tuna, while the number of fisherman and boats has declined significantly, the value
of the landings have only declined slightly (SDUPD 1998). Commercial harvest and value of nearshore
species showed a generally increasing trend from 1987 to 1995/1996, but since then has been declining.
Annual commercial fishery catch and landings in volume (pounds) and value (dollars) are compiled by the
CDFG. Landings are reported by area and port, and catch data are reported by fish block. Fish blocks
are statistical areas normally 10 minutes of longitude by 10 minutes of latitude, with blocks adjacent to
shore being somewhat smaller, with the area of specific blocks being determined by how the shoreline
intersects the block area.

3.8 Socioeconomics
Page 3.8-10 Regional Beach Sand Project EIR/EA99-69\SANDAG EIREA 3.5 to 3.12.wpd 7/17/00
Relevant fish blocks and their corresponding shorelines within the project area include 877 (Imperial
Beach), 860 (Point Loma to La Jolla), 842 (Torrey Pines to Del Mar), 821 (Encinitas), 822 and 801
(Oceanside), as shown in Figure 3.8-1. All fishing gear types are combined and include hook and line,
longline, troll, harpoon, trap, seine, and trawl. Assignation of a species to a specific block is not always
completely accurate, and fluctuations in annual catches are significant. Determining the cause of these
fluctuations can be difficult due to the complex set of variables that affect fish movements and abundance.
San Diego Area Overall Commercial Fishing Catch Volume and Value
San Diego area port landings for the five-year period 1994 through 1998 (inclusive) had a total dollar value
over $16.2 million and totaled 17 million pounds for the data blocks analyzed (Table 3.8-10). This dollar
amount was an ex-vessel value (e.g., whole fish, wholesale price), whereas the final economic contribution
may be estimated to have been three to four times higher.
Lobster was the highest ranked commercial species in San Diego, representing 42.7 percent of the 1994
to 1998 dollar value of all species. Five-year totals were $6.9 million for a total of 1 million pounds. The
majority of the catch (76 percent) came from the Point Loma and La Jolla areas. Approximately 13
percent of the catch came from the Encinitas to Solana Beach fish block, 8 percent from the Oceanside
block, 3 percent from the Del Mar to Torrey Pines block, and 0.2 percent from the Imperial Beach block.
Urchin dollar value was ranked second at $5.6 million, and urchin poundage was ranked second at 5.3
million pounds. The dollar value for urchin represents 34.8 percent of the total of all species. Nearly 99
percent of the urchin catch was from the La Jolla to Point Loma fish block. Crabs were the third ranked
taxa by dollar, with 479,000 pounds worth approximately $489,000 (3.0 percent of the total dollar value).
Mackerel and sardine were the first and third ranked catches by weight, at 6.4 and 1.4 million pounds,
respectively. The relatively low value per pound for these two species placed them fourth and thirteenth
by dollar value, respectively. California halibut, swordfish, rockfish, prawn/shrimp, and tuna all supported
local fisheries, with five-year dollar values ranging from approximately $257,000 to $379,000. Shark and
croaker had the next highest commercial value with five-year dollar values near $149,000. The 12
species/categories listed above had a combined dollar value of $15.4 million, which is 95 percent of the
total $16.2 million for all commercial fish species (Table 3.8-10) listed for these blocks, which include both
nearshore and offshore species.

3.8 Socioeconomics
Regional Beach Sand Project EIR/EA9969 SANDAG\Figures\Fig 3.8-1 1/17/00
NORTH
Figure 3.8-1CDFG Fish Blocks
Page 3.8-11
2200 Feet0
163
94
15
805
52
5
8
San Ysidro
Chula Vista
National City
ImperialBeach
San Diego
La Jolla
CampPendleton
Oceanside
Carlsbad
Encinitas
Solana Beach
Del Mar
ORANGECOUNTY
877
860
842
821
822
801
PACIFIC
OC
EAN
RIVERSIDECOUNTY
SAN DIEGOCOUNTY
MEXICO
Coronado
0 3 Miles

3.8 Socioeconomics
Page 3.8-12 Regional Beach Sand Project EIR/EA99-69\SANDAG EIREA 3.5 to 3.12.wpd 7/17/00
Table 3.8-10San Diego County Landings by Fish Block for 1994 to 1998.
Averaged Volume (Pounds) and Values (Dollars)
Species
Area Name and Fish Block Number
Totals
OceansideBlock
801/822
Encinitas /Solana Beach
Block 821
Del Mar /Torrey Pines
Block 842
La Jolla /Point LomaBlock 860
ImperialBeach
Block 877
Fish
Anchovy 187,550 683 23,690 211,923
$11,543 $378 $567 $12,487
Barracuda 118 422 22,009 30 22,578
$62 $319 $15,166 $24 $15,570
Bonito 18,194 34,615 52,809
$4,665 $10,849 $15,515
Croaker 123,108 110,128 10 233,246
$72,281 $76,898 $8 $149,187
Halibut 2,949 840 113,219 11 117,018
$7,189 $3,495 $368,157 $21 $378,863
Lingcod 94 700 794
$465 $696 $1,160
Mackerel 3,600,443 209,749 975,148 1,661,221 872 6,447,432
$230,204 $14,756 $61,095 $137,237 $277 $443,569
Rockfish 156,362 1,026 1,157 198,499 255 357,299
$58,054 $1,212 $1,571 $216,743 $268 $277,849
Sablefish 985 293 2,034 3,312
$876 $366 $1,364 $2,607
Sardine 214,446 100 439,000 755,115 2,935 1,411,596
$10,966 $45 $17,560 $39,329 $1,433 $69,332
Seabass 61 4,852 4,913
$163 $11,500 $11,663
Shark 17,831 324 1,039 101,511 7,651 128,356
$16,872 $425 $790 $119,207 $11,987 $149,281
Sheephead 13,026 5,565 481 138,749 188 158,010
$36,457 $16,800 $1,598 $425,892 $355 $97,800
Sole 1,471 119 6,018 7,608
$1,010 $154 $8,151 $9,315
Swordfish 7,242 2,214 87,697 1,628 98,781
$27,391 $7,926 $328,168 $3,460 $366,944

3.8 Socioeconomics
Regional Beach Sand Project EIR/EA Page 3.8-1399-69\SANDAG EIREA 3.5 to 3.12.wpd 7/17/00
Table 3.8-10. Continued
Species
Area Name and Fish Block Number
Totals
OceansideBlock
801/822
Encinitas /Solana Beach
Block 821
Del Mar /Torrey Pines
Block 842
La Jolla /Point LomaBlock 860
ImperialBeach
Block 877
Tuna 1,616 81 572,400 279 574,376
$1,529 $203 $254,026 $779 $256,536
Whitefish 645 6 11,788 12,439
$375 $5 $7,836 $8,216
Yellowtail 2,382 9 162 27,156 29,709
$2,870 $13 $165 $35,716 $38,764
Invertebrates
Crab 143,071 13,294 12,885 260,413 49,828 479,491
$143,012 $14,760 $11,865 $269,754 $49,652 $489,043
Lobster 79,373 135,281 27,744 779,563 1,117 1,023,078
$572,789 $922,362 $187,724 $5,242,231 $9,556 $6,934,662
Prawn / Shrimp 19,626 122 4,908 32,458 62,013 119,127
$143,336 $945 $35,275 $95,780 $0 $275,336
Urchin 7,620 24,362 10,329 5,198,139 18,903 5,259,353
$8,345 $22,768 $4,926 $5,603,039 $14,734 $5,653,812
Abalone 40 4,805 4,844
$285 $45,075 $45,360
Squid 4,900 93,951 62,535 161,386
$525 $14,488 $9,405 $24,418
Totals 4,446,752 390,316 1,568,619 9,987,981 169,154 16,562,822
$1,292,925 $998,958 $344,386 $12,722,780 $92,852 $15,451,902
Total for all spp. 4,491,015 391,491 1,570,938 10,350,749 201,938 17,006,131
$1,352,990 $1,000,456 $348,895 $13,418,781 $116,925 $16,238,047
Source: CDFG 1994 - 1999
The pattern of distribution of total catch between fish blocks is also apparent in Table 3.8-10. The La Jolla/
Point Loma block alone accounted for 60.9 percent of the total five block area volume of catch landed and
82.6 percent of the total area catch value over the period 1994-1998.
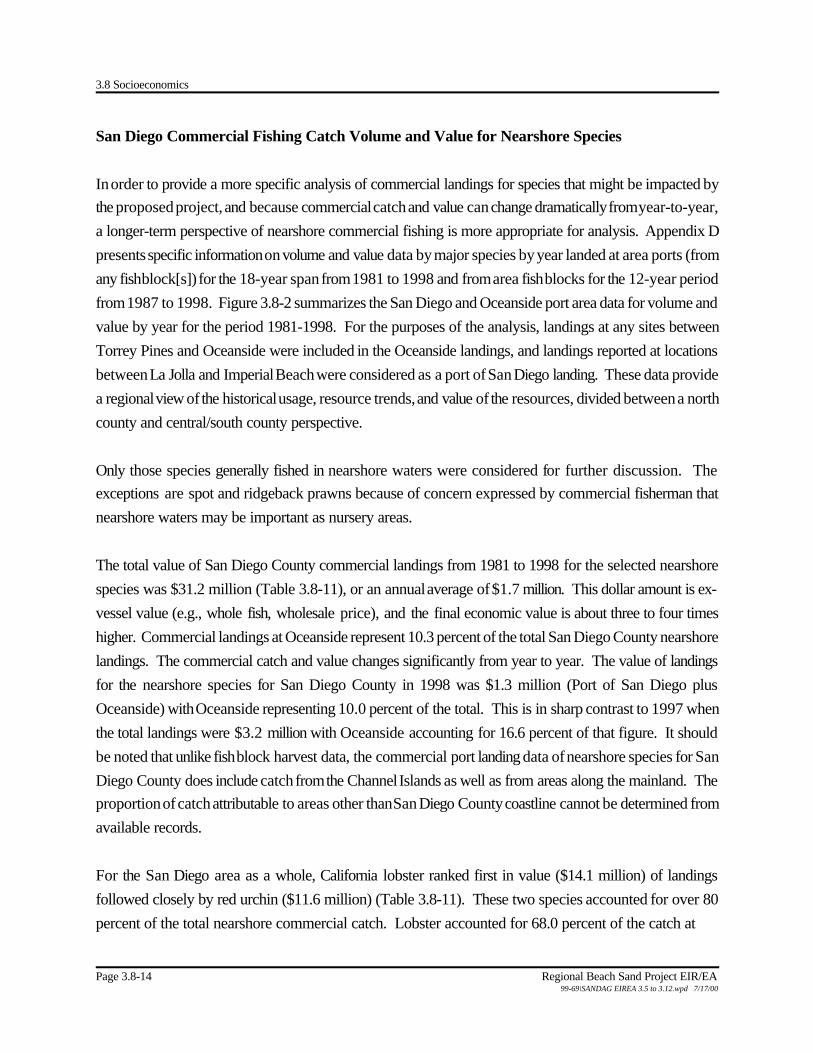
3.8 Socioeconomics
Page 3.8-14 Regional Beach Sand Project EIR/EA99-69\SANDAG EIREA 3.5 to 3.12.wpd 7/17/00
San Diego Commercial Fishing Catch Volume and Value for Nearshore Species
In order to provide a more specific analysis of commercial landings for species that might be impacted by
the proposed project, and because commercial catch and value can change dramatically from year-to-year,
a longer-term perspective of nearshore commercial fishing is more appropriate for analysis. Appendix D
presents specific information on volume and value data by major species by year landed at area ports (from
any fish block[s]) for the 18-year span from 1981 to 1998 and from area fish blocks for the 12-year period
from 1987 to 1998. Figure 3.8-2 summarizes the San Diego and Oceanside port area data for volume and
value by year for the period 1981-1998. For the purposes of the analysis, landings at any sites between
Torrey Pines and Oceanside were included in the Oceanside landings, and landings reported at locations
between La Jolla and Imperial Beach were considered as a port of San Diego landing. These data provide
a regional view of the historical usage, resource trends, and value of the resources, divided between a north
county and central/south county perspective.
Only those species generally fished in nearshore waters were considered for further discussion. The
exceptions are spot and ridgeback prawns because of concern expressed by commercial fisherman that
nearshore waters may be important as nursery areas.
The total value of San Diego County commercial landings from 1981 to 1998 for the selected nearshore
species was $31.2 million (Table 3.8-11), or an annual average of $1.7 million. This dollar amount is ex-
vessel value (e.g., whole fish, wholesale price), and the final economic value is about three to four times
higher. Commercial landings at Oceanside represent 10.3 percent of the total San Diego County nearshore
landings. The commercial catch and value changes significantly from year to year. The value of landings
for the nearshore species for San Diego County in 1998 was $1.3 million (Port of San Diego plus
Oceanside) with Oceanside representing 10.0 percent of the total. This is in sharp contrast to 1997 when
the total landings were $3.2 million with Oceanside accounting for 16.6 percent of that figure. It should
be noted that unlike fish block harvest data, the commercial port landing data of nearshore species for San
Diego County does include catch from the Channel Islands as well as from areas along the mainland. The
proportion of catch attributable to areas other than San Diego County coastline cannot be determined from
available records.
For the San Diego area as a whole, California lobster ranked first in value ($14.1 million) of landings
followed closely by red urchin ($11.6 million) (Table 3.8-11). These two species accounted for over 80
percent of the total nearshore commercial catch. Lobster accounted for 68.0 percent of the catch at
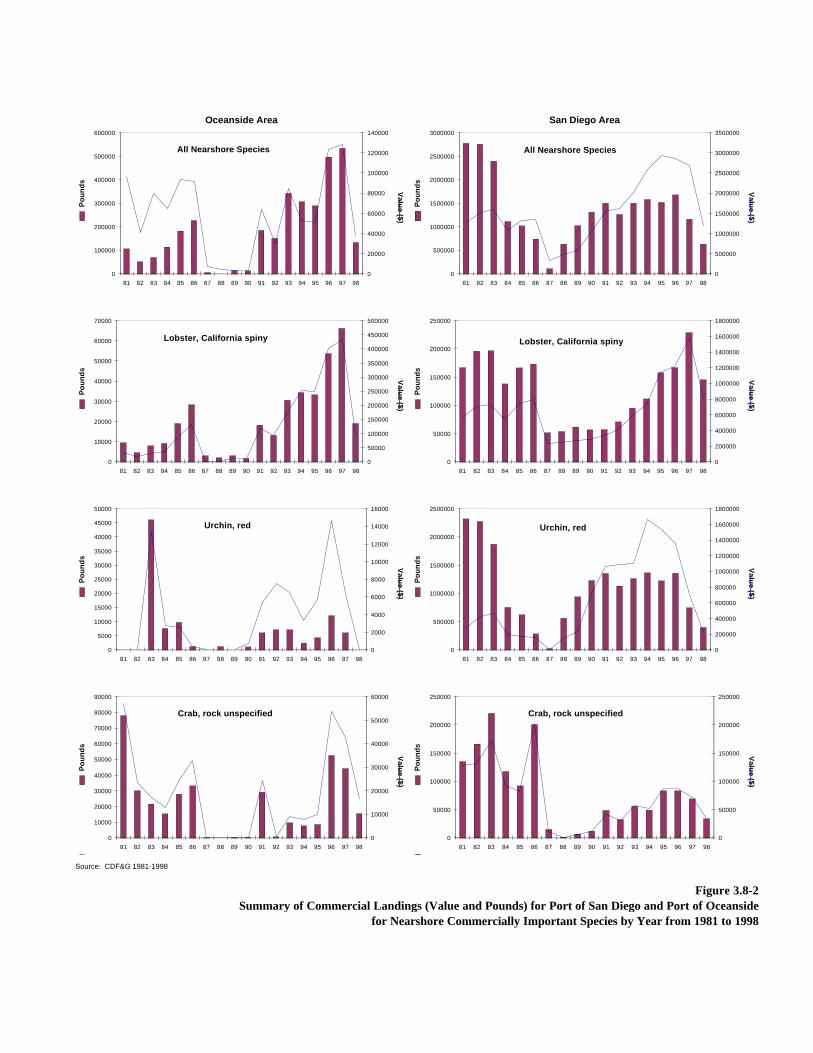
Oceanside Area San Diego Area
P
ou
nd
s
Valu
e ($)
Po
un
ds
Valu
e ($)
P
ou
nd
s
Valu
e ($)
Po
un
ds
Valu
e ($)
P
ou
nd
s
Valu
e ($)
Po
un
ds
Valu
e ($)
P
ou
nd
s
Valu
e ($)
Po
un
ds
Valu
e ($)
Source: CDF&G 1981-1998
for Nearshore Commercially Important Species by Year from 1981 to 1998
Figure 3.8-2 Summary of Commercial Landings (Value and Pounds) for Port of San Diego and Port of Oceanside
0
5000
10000
15000
20000
25000
30000
35000
40000
45000
50000
81 82 83 84 85 86 87 88 89 90 91 92 93 94 95 96 97 980
2000
4000
6000
8000
10000
12000
14000
16000
Urchin, red
0
10000
20000
30000
40000
50000
60000
70000
80000
90000
81 82 83 84 85 86 87 88 89 90 91 92 93 94 95 96 97 980
10000
20000
30000
40000
50000
60000
Crab, rock unspecified
0
10000
20000
30000
40000
50000
60000
70000
81 82 83 84 85 86 87 88 89 90 91 92 93 94 95 96 97 980
50000
100000
150000
200000
250000
300000
350000
400000
450000
500000
Lobster, California spiny
0
500000
1000000
1500000
2000000
2500000
81 82 83 84 85 86 87 88 89 90 91 92 93 94 95 96 97 980
200000
400000
600000
800000
1000000
1200000
1400000
1600000
1800000
Urchin, red
0
50000
100000
150000
200000
250000
81 82 83 84 85 86 87 88 89 90 91 92 93 94 95 96 97 980
50000
100000
150000
200000
250000
Crab, rock unspecified
0
50000
100000
150000
200000
250000
81 82 83 84 85 86 87 88 89 90 91 92 93 94 95 96 97 980
200000
400000
600000
800000
1000000
1200000
1400000
1600000
1800000
Lobster, California spiny
0
100000
200000
300000
400000
500000
600000
81 82 83 84 85 86 87 88 89 90 91 92 93 94 95 96 97 980
20000
40000
60000
80000
100000
120000
140000
All Nearshore Species
0
500000
1000000
1500000
2000000
2500000
3000000
81 82 83 84 85 86 87 88 89 90 91 92 93 94 95 96 97 980
500000
1000000
1500000
2000000
2500000
3000000
3500000
All Nearshore Species

Oceanside Area San Diego Area
P
ou
nd
s
Valu
e ($)
Po
un
ds
Valu
e ($)
P
ou
nd
s
Valu
e ($)
Po
un
ds
Valu
e ($)
P
ou
nd
s
Valu
e ($)
Po
un
ds
Valu
e ($)
P
ou
nd
s
Valu
e ($)
Po
un
ds
Valu
e ($)
P
ou
nd
s
Valu
e ($)
Po
un
ds
Valu
e ($)
Source: CDF&G 1981-1998
Figure 3.8-2. Continued.
0
2000
4000
6000
8000
10000
12000
14000
81 82 83 84 85 86 87 88 89 90 91 92 93 94 95 96 97 980
5000
10000
15000
20000
25000
30000
35000
Sheephead, California
0
0.1
0.2
0.3
0.4
0.5
0.6
0.7
0.8
0.9
1
81 82 83 84 85 86 87 88 89 90 91 92 93 94 95 96 97 980
0.1
0.2
0.3
0.4
0.5
0.6
0.7
0.8
0.9
1
Abalone
0
2000
4000
6000
8000
10000
12000
14000
81 82 83 84 85 86 87 88 89 90 91 92 93 94 95 96 97 980
10000
20000
30000
40000
50000
60000
70000
80000
90000
Prawn, spot
0
0
0
0
0
1
1
1
1
1
1
81 82 83 84 85 86 87 88 89 90 91 92 93 94 95 96 97 980
0
0
0
0
1
1
1
1
1
1
Cucumber, sea
0
5000
10000
15000
20000
25000
30000
35000
40000
45000
81 82 83 84 85 86 87 88 89 90 91 92 93 94 95 96 97 980
20000
40000
60000
80000
100000
120000
140000
Sheephead, California
0
20000
40000
60000
80000
100000
120000
81 82 83 84 85 86 87 88 89 90 91 92 93 94 95 96 97 980
50000
100000
150000
200000
250000
Abalone
0
2000
4000
6000
8000
10000
12000
14000
81 82 83 84 85 86 87 88 89 90 91 92 93 94 95 96 97 980
10000
20000
30000
40000
50000
60000
70000
80000
90000
Prawn, spot
0
5000
10000
15000
20000
25000
30000
81 82 83 84 85 86 87 88 89 90 91 92 93 94 95 96 97 980
2000
4000
6000
8000
10000
12000
Cucumber, sea
0
5000
10000
15000
20000
25000
30000
35000
40000
81 82 83 84 85 86 87 88 89 90 91 92 93 94 95 96 97 980
10000
20000
30000
40000
50000
60000
70000
Halibut, California
0
10000
20000
30000
40000
50000
60000
70000
80000
90000
100000
81 82 83 84 85 86 87 88 89 90 91 92 93 94 95 96 97 980
20000
40000
60000
80000
100000
120000
140000
160000
180000
200000
Halibut, California
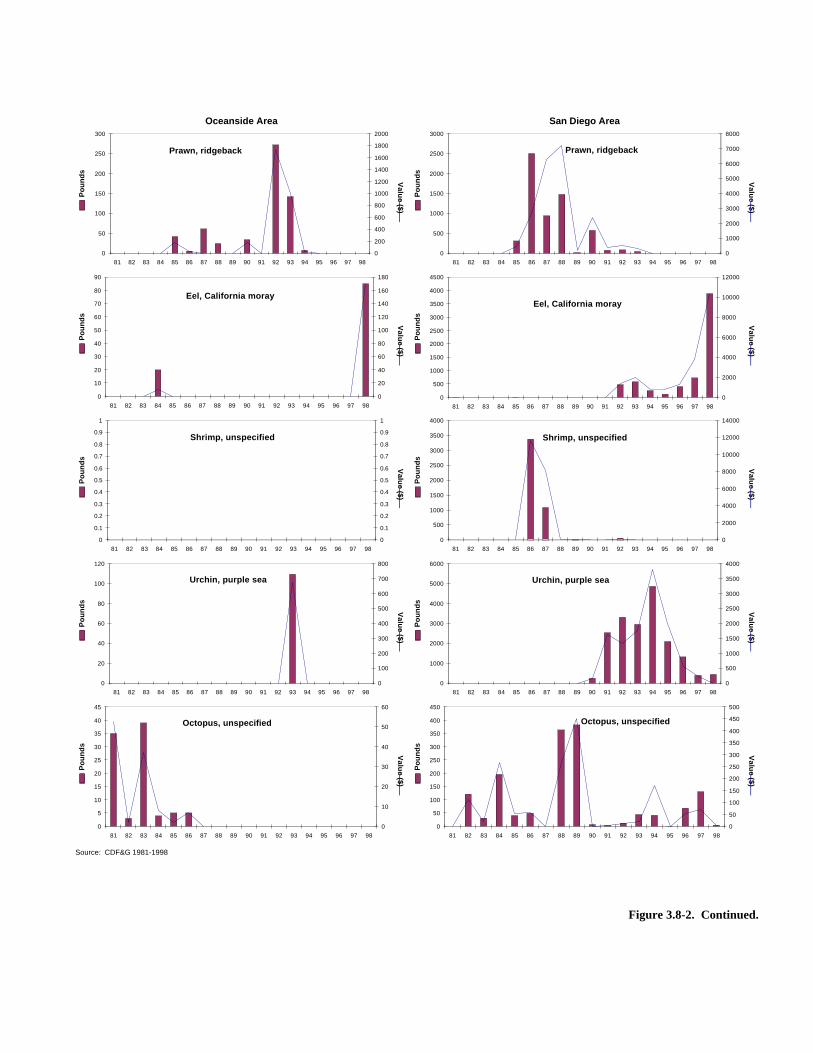
Oceanside Area San Diego Area
P
ou
nd
s
Valu
e ($)
Po
un
ds
Valu
e ($)
P
ou
nd
s
Valu
e ($)
Po
un
ds
Valu
e ($)
P
ou
nd
s
Valu
e ($)
Po
un
ds
Valu
e ($)
P
ou
nd
s
Valu
e ($)
Po
un
ds
Valu
e ($)
P
ou
nd
s
Valu
e ($)
Po
un
ds
Valu
e ($)
Source: CDF&G 1981-1998
Figure 3.8-2. Continued.
0
10
20
30
40
50
60
70
80
90
81 82 83 84 85 86 87 88 89 90 91 92 93 94 95 96 97 980
20
40
60
80
100
120
140
160
180
Eel, California moray
0
5
10
15
20
25
30
35
40
45
81 82 83 84 85 86 87 88 89 90 91 92 93 94 95 96 97 980
10
20
30
40
50
60
Octopus, unspecified
0
0.1
0.2
0.3
0.4
0.5
0.6
0.7
0.8
0.9
1
81 82 83 84 85 86 87 88 89 90 91 92 93 94 95 96 97 980
0.1
0.2
0.3
0.4
0.5
0.6
0.7
0.8
0.9
1
Shrimp, unspecified
0
20
40
60
80
100
120
81 82 83 84 85 86 87 88 89 90 91 92 93 94 95 96 97 980
100
200
300
400
500
600
700
800
Urchin, purple sea
0
500
1000
1500
2000
2500
3000
3500
4000
4500
81 82 83 84 85 86 87 88 89 90 91 92 93 94 95 96 97 980
2000
4000
6000
8000
10000
12000
Eel, California moray
0
50
100
150
200
250
300
350
400
450
81 82 83 84 85 86 87 88 89 90 91 92 93 94 95 96 97 980
50
100
150
200
250
300
350
400
450
500
Octopus, unspecified
0
500
1000
1500
2000
2500
3000
3500
4000
81 82 83 84 85 86 87 88 89 90 91 92 93 94 95 96 97 980
2000
4000
6000
8000
10000
12000
14000
Shrimp, unspecified
0
1000
2000
3000
4000
5000
6000
81 82 83 84 85 86 87 88 89 90 91 92 93 94 95 96 97 980
500
1000
1500
2000
2500
3000
3500
4000
Urchin, purple sea
0
50
100
150
200
250
300
81 82 83 84 85 86 87 88 89 90 91 92 93 94 95 96 97 980
200
400
600
800
1000
1200
1400
1600
1800
2000
Prawn, ridgeback
0
500
1000
1500
2000
2500
3000
81 82 83 84 85 86 87 88 89 90 91 92 93 94 95 96 97 980
1000
2000
3000
4000
5000
6000
7000
8000
Prawn, ridgeback

3.8 Socioeconomics
Page 3.8-16 Regional Beach Sand Project EIR/EA99-69\SANDAG EIREA 3.5 to 3.12.wpd 7/17/00
Table 3.8-11Summary of Values ($) of CDFG Commercial Landings
by Port for San Diego County from 1981 to 1998
ResourceNorth County
Oceanside Port of San DiegoTotal San Diego
County Value Ranking
Lobster $2,189,122 $11,928,314 $14,117,436 1
Urchin, red $69,315 $11,524,961 $11,594,276 2
Crab, rock $334,585 $1,303,726 $1,638,311 3
Halibut, California $287,148 $1,17l,691 $1,458,839 4
Abalone (all species) 0 $1,029,356 $1,029,356 5
Sheephead, California $83,740 $575,888 $659,628 6
Prawn, spot $250,530 392,664 $643,194 7
Sea cucumber 0 $36,387 $36,387 8
Prawn, ridgeback $3,123 $20,202 $23,325 9
Eel, California moray $180 $20,399 $20,579 10
Shrimp, unspecified 0 $19,789 $19,789 11
Urchin, purple $673 $11,441 $12,114 12
Octopus $109 $1,572 $1,681 13
Total Value $3,218,525 $28,036,390 $31,254,915 na
Oceanside. Landings of red urchins at Oceanside only account for 2.2 percent of the commercial value.
Lobster accounted for 42.5 percent of the value of the total catch at the San Diego port, and lobster and
combined red urchin accounted for 83.7 percent of the value of the total catch. Thus, lobster landings at
Oceanside were by far the most valuable resource for local fisherman while lobster and red urchin are
about equal for the San Diego area.
It is important to note how relatively large the lobster and urchin fisheries are in relation to other San Diego
area fisheries. As shown in Table 3.8-11, lobster and urchins were the only species whose ex-vessel value
was in excess of $10 million over the period 1981-1998. The next most valuable species for the same
period was well under $2 million.
Other important commercial species for San Diego County include rock crabs (various species of Cancer
spp.) which ranked third in value ($1.6 million), California halibut which ranked 4th ($1.4 million), and
abalone (all species of Haliotis spp.) ranked 5th ($1.0 million). Few red urchins are landed at Oceanside,
so rock crab and halibut ranked second and third in value at this port, respectively. These three species
3.8 Socioeconomics
Regional Beach Sand Project EIR/EA Page 3.8-1799-69\SANDAG EIREA 3.5 to 3.12.wpd 7/17/00
were the only species whose local landing value was in excess of $1 million each (but less than $10 million)
over the period 1981-1998.
Some species historically had low value and were not commercially exploited in even the recent past
(Figure 3.8-2). However, with the advent of the live trap market for California sheephead and spot prawn,
the value and importance of these resources has increased. Averaged over the last 18 years these species
ranked 6th and 7th, respectively, and in 1998 sheephead and spot prawn represented 4.4 percent and 2.2
percent of the nearshore San Diego County commercial catch. These two species, with values of
approximately $660,000 and $640,000 are the only species valued above $40,000 (but less than $1
million).
Other resources of lesser value include sea cucumber (Parastichopus spp.), ridgeback prawn, California
moray eel, shrimp, purple urchin, and octopus. The combined value of these latter species represents only
0.36 percent of the total value from 1981 to 1998 and only 1.3 percent of the value for total landings for
1998.
For all nearshore species of commercial importance, volume and value have fluctuated significantly both
in absolute and relative terms over the period 1981-1998, as shown in Figure 3.8-2. Perhaps the most
obvious trend has been the decline and subsequent closure of harvesting abalone. In the early 1980’s,
abalone ranked third in importance behind lobster and red urchin. However, abalone harvest has declined
significantly for multiple reasons and at the present time there is a moratorium on the harvesting of abalone
south of San Francisco. Furthermore, the white and black abalone are candidate species for listing as an
endangered species.
Other important trends include the variability and value of the lobster catch which declined significantly in
the late 1980’s following the 1983/1984 El Niño event and has shown an increasing trend until 1997, which
was the best year on record. Lobster catch declined significantly following the El Niño of 1997/1998. The
pattern of lower lobster catch following El Niño has been observed before by commercial fisherman, but
the magnitude of decreases varied by location (Guth 1999). As shown in Figure 3.8-1, the value of lobster
in 1998 dropped to approximately one-quarter of its 1997 value in the Oceanside/North County port area
and to approximately one-half of its 1997 value in the San Diego port area.
Poundage and value of the red urchin catch has also shown extreme fluctuation. This resource also showed
a decline in the late 1980s, followed by increases in the early 1990s, and then a leveling off followed by
3.8 Socioeconomics
Page 3.8-18 Regional Beach Sand Project EIR/EA99-69\SANDAG EIREA 3.5 to 3.12.wpd 7/17/00
a significant decline for 1997 and 1998 (Figure 3.8-2). A similar pattern is seen for rock crabs. Because
of the complexity of the natural environment and species life histories, causes for annual changes in
abundance of species are often not known and are difficult to determine. However, El Niño events
significantly affect the physical environment (e.g., temperature, nutrients) which directly affects the success
and survival of commercially important species. Equally important are the indirect effects caused by El
Niño; e.g., the loss of most kelp beds and the food and shelter these habitats provide. Red urchins may
well survive El Niño events but with a significant loss of kelp they have little food available and thus are not
capable of producing roe, which is the target of the commercial harvest. Thus, red urchin harvest declines
following El Niño events are more due to kelp loss and poor condition of the urchins, and not necessarily
because the urchins are directly affected by El Niño or have been overharvested.
Finfish catch and values have also shown considerable variability over the period. California halibut catch
has shown considerable annual variation, but was greatest in the mid 1980s (Figure 3.8-2). By 1998,
halibut represented only 3.8 percent of the total value for all the nearshore species. The live trap fishery
for the California sheephead is relatively new, becoming important around 1992. Similarly, the live trap
fishing for the spot prawn has become an important resource with 1993 representing a peak year for the
value of this resource. Sea cucumbers appear to have become a commercially important fishery beginning
around 1993.
It is important to note that harvest of all target resources declined in 1998 following the most recent El Niño
(Figure 3.8-2). A similar decline for most species also occurred following the 1983/1984 El Niño (Figure
3.8-2).
Economic Importance of Nearshore Species by Fish Block
Table 3.8-12 provides a breakout of ex-vessel value of most valuable nearshore species for the relevant
fish blocks for the period 1987-1998 to facilitate comparisons by block. Clearly lobster and red urchin
are the most valuable in terms of dollar amount.
In terms of geographic distribution of valuable nearshore species, several important facts are evident in
Table 3.8-12. First, the overall importance of fish block 860, La Jolla to Point Loma, must be highlighted.
This block accounts for 85 percent of the total value for the species and area listed. Second, lobster and
red urchins are each worth more than 14 times as much as the next most valuable species. Third, within
the two most valuable species, a very different geographic distribution pattern is found. For urchins, fully

3.8 Socioeconomics
Regional Beach Sand Project EIR/EA Page 3.8-1999-69\SANDAG EIREA 3.5 to 3.12.wpd 7/17/00
99 percent of the value of the local fishery is concentrated in fish block 860, stretching from La Jolla to
Point Loma. For lobsters, the La Jolla to Point Loma area dominates the value of catch as well, but not
as strongly. Seventy-seven percent of the value is concentrated in this block ($7.5 million), but the value
of lobster from the Oceanside ($0.8 million) and Encinitas/Solana Beach ($1.1 million) blocks are each
worth more than any other species (except urchins) for the entire five-block region combined. Each is also
worth in excess of 19 times the value of urchins from any one block in the region, aside from the La
Jolla/Point Loma block. The Del Mar/Torrey Pines block, with a lobster value of $353,000 comprises a
relatively small portion (four percent) of the regional lobster catch, however this value is still well in excess
(by a factor of two or more) of the value of any other single commercial nearshore species for any
individual block outside of block 860.
Table 3.8-12San Diego County Landings by Fish Block for 1987 to 1998
Most Valuable Nearshore Species Values (Dollars)
Species
Area Name and Fish Block Number
TotalsOceanside
Block 801/822
Encinitas /Solana Beach
Block 821
Del Mar /Torrey Pines
Block 842
La Jolla /Point LomaBlock 860
ImperialBeach
Block 877
Lobster $802,777 $1,109,232 $353,294 $7,467,964 $9,556 $9,742,823
Red Urchins $10,463 $41,827 $5,466 $9,869,331 $14,734 $9,941,821
Rock Crab $163,163 $25,348 $11,865 $412,939 $60,085 $673,400
Halibut $63,352 $8,285 $2,842 $540,178 $1,868 $616,525
Abalone(1) $0 $6,320 $1,138 $154,239 $0 $161,697
Sheephead $71,432 $20,734 $1,668 $581,807 $362 $676,003
Spot Prawn(2) $272,923 $16,486 $72,107 $279,826 $0 $641,342
Total $1,384,110 $1,228,232 $448,380 $19,306,284 $86,605 $22,453,611(1) Season currently closed due to a fishing moratorium. (2) Not a nearshore species, but included here in response to public input.Source: CDFG 1994 - 1999
Looking at the next tier species by value in Table 3.8-12, there are three nearshore species currently being
fished that have an aggregate value in the $600,000 to $700,000 range. Approximately 78 percent of the
combined value of these species is concentrated in the La Jolla/Point Loma fish block (slightly over $1.5
million out of just under $2.0 million total value). The pattern of distribution of catch is different for rock
crab, however, than for halibut and sheephead. Halibut and sheephead are more heavily concentrated (88
percent and 86 percent of total area species value, respectively) in the La Jolla/Point Loma area. Rock

3.8 Socioeconomics
Page 3.8-20 Regional Beach Sand Project EIR/EA99-69\SANDAG EIREA 3.5 to 3.12.wpd 7/17/00
crab catch, on the other hand, is less concentrated. While La Jolla/Point Loma still account for 61 percent
of the catch, Oceanside accounts for 24 percent of the area catch, and Imperial Beach comprises nine
percent of the catch. Oceanside is thus a relatively important area for the rock crab fishery, and rock crab
is by far the most valuable nearshore species in the Imperial Beach fish block (69 percent of total value of
nearshore catch from that block).
Nearshore Species Habitat Range and Fishing Techniques
The following sections provide additional information about the lifecycle and typical fishery operations for
lobster and red sea urchin. Specific biological life cycle data on these species may be found in Appendix
D. Appendix D also contains similar information for rock crab, halibut, abalone, sheephead, spot prawn,
and ridge back prawn.
California Spiny Lobster (Panulirus interruptus), the commercial species of greatest value locally, is
found from Monterey Bay to Manzanillo, Mexico, mostly from Point Conception to Magdalena Bay, Baja
California. Adult lobsters are typically found in rocky areas from the intertidal zone to at least 240 feet.
Local fishermen note that there is marked movement of adults between inshore and offshore areas. Most
of the fishing for this species occurs in rocky coastal areas up to 120 feet in depth, although lobsters have
been caught on any type of substrate. Traps are set on all bottom types from sand to rocky substrate.
Ninety percent of commercial trapping takes place in depths of 90 feet or less (CDFG 1993), with most
traps set at depths of 10 to 50 feet, according to local fishermen. The fishing season extends from October
to March.
Lobster are commercially fished locally via baited traps set from small boats that range from 20 to 45 feet
in length, with the typical vessels in the 25 to 35 foot range. Smaller vessels may work the season with a
single fisherman, while larger vessels may start the season with a skipper and two crew, but then reduce
to one crew member as the catch drops off. The basis for crew compensation apparently varies from
operation to operation, with some based on various types of the more traditional ‘share’ calculations, while
others have moved toward flat rates.
As noted in earlier sections, the area of highest concentration for lobster fishing occurs in the La Jolla to
Point Loma area, but vessels from Mission Bay to Oceanside can and do fish the North County coast,
according to interviews. Where a vessel is “homeported” is a trade-off between expense and convenience
as, for example, fuel costs and slip fees tend to be less expensive at port facilities farther from local fishing

3.8 Socioeconomics
Regional Beach Sand Project EIR/EA Page 3.8-2199-69\SANDAG EIREA 3.5 to 3.12.wpd 7/17/00
grounds. Also according to interviews, vessels working the area may have several hundred traps per
vessel, up to perhaps 600 to 700 traps per boat for the larger operations. As gear sets and hauls can be
six days apart, it is not necessarily the largest vessels that work the greatest number of traps, as small vessel
owners can increase their effective gear capacity by making more frequent sets. According to local
fishermen, an estimated 10,000 to 12,000 traps are set during peak season (October through November),
with progressively fewer traps set as the season continues past the peak.
The nature of the fishery has reportedly changed with the implementation of a limited entry regulatory
system several years ago. Prior to limited entry, there were apparently a larger number of part-time lobster
fishermen than is the case today. According to interviews, approximately one-half the fishermen who fish
lobster do so exclusively, and do not switch to other species after the lobster harvest starts to decline or
the season ends but, rather, discontinue fishing until the next lobster season. Those who do keep fishing
transition into a variety of other fisheries, including spot prawns, sheephead, rock crab, the live eel fishery,
or gillnetting. While levels of dependency vary, lobster is clearly the central element of the typical year’s
economic base for participants, especially for the smaller boats that have less flexibility in their ability to
change gear types and move between fisheries.
The market for locally caught lobster has varied considerably over the last few years. Lobster are not
landed at central processing facilities, rather, both the fishermen and the buyers are mobile and sales can
take place wherever appropriate harbor facilities are available. While a significant portion of the local catch
reportedly goes to the local restaurant market, it is not uncommon for larger operations to sell catch to Los
Angeles-based entities. Reportedly, a larger proportion of the catch was going to Far East until the recent
Asian economic crisis; in the wake of that set of events fishermen have had to rebuild local market
relationships.
Juvenile lobsters usually spend their first one to two years in nearshore surfgrass and eelgrass beds. Adults
are found in rocky habitats, though they will move onto sand in search of food. It takes about seven to
eleven years for lobsters to reach legal size. Fishermen expressed concerns about the impact that project-
related turbidity may have on these nursery areas and its effect on juvenile lobster. There are only few
studies on the effects of turbidity and sand burial on juvenile lobsters (e.g., Engle 1979, Perry 1999).
Perry’s work in New Zealand on juvenile rock lobster found that they could survive suspended sediment
of 363 mg/l for four days with no adverse effects. Juveniles of this species were also observed to bury with
no apparent detrimental effect. Thus, juvenile rock lobster appear capable of tolerating high turbidity and
suspended sediments. There may be benefits as well as high turbidity may reduce visual predation.
3.8 Socioeconomics
Page 3.8-22 Regional Beach Sand Project EIR/EA99-69\SANDAG EIREA 3.5 to 3.12.wpd 7/17/00
Cumulative ex-vessel dollar value for lobster from 1994-1998 comprised 42.7 percent of all commercial
species landed in San Diego County (Table 3.8-10). Considering only nearshore commercial species since
1981, lobster ranked number one in value representing 45.2 percent of the value for all nearshore species
landed (Table 3.8-11). In the North County areas, lobster represents 68 percent of the commercial catch
landed at Oceanside. Considering only the North County area for most recent two years, 1997-1998,
Encinitas to Solana Beach represented about 62 percent of the catch landed at Oceanside while Oceanside
and Del Mar to Torrey Pines represents about 29 percent and 9 percent, respectively, a pattern somewhat
different than that seen over the longer term, where the Oceanside area has normally played a much larger
role in proportion of landings.
Red sea urchins (Strongylocentrotus franciscanus) are ranked number two value to local fishermen.
Red and purple sea urchins are found from Alaska to Cedros Island in Baja California. They majority are
found in rocky bottom habitats from the intertidal zone out to a depth of about 100 feet. According to local
fishermen, urchins take three to five years to reach a commercially viable harvest size. Harvesting of red
sea urchins can occur from 5 to 100 feet, but most of the catch is taken between 20 and 60 feet.
According to fishermen contacted for this project, it is estimated that most of the local catch is taken
between 10 and 50 feet, with a smaller amount harvested somewhat deeper. Urchins are reportedly fished
locally anywhere between Oceanside and San Diego where there is a hard bottom, but kelp areas are
considered the prime fishing locations.
Red urchins are generally landed at San Diego, a processing center, and generally not landed at Oceanside
where there is no processing facility. In terms of harvest area, nearly 99 percent of the red urchins are
caught in the La Jolla to Point Loma fish block. Urchin harvest is conducted by divers. Diving typically is
done from small vessels (22 to 32 feet) with several divers generally using surface supplied air. Urchins
are collected in net bags and hauled to the surface at regular intervals. According to local fishermen, at
least some San Diego area based urchin divers harvest urchins from as far away as northern California.
3.8.3 Kelp Harvesting
Kelp harvesting operations also occur in the proposed project area. The giant kelp, Macrocystis pyrifera,
is found all along the western coast of the United States. Off the Southern California coast, kelp is found
on rocky substrate in wave-exposed areas at depths of 20 to 120 feet. Kelp harvesting has occurred in
California since 1911 and involves the use of cutter barges which harvest the upper the kelp canopy down
3.8 Socioeconomics
Regional Beach Sand Project EIR/EA Page 3.8-2399-69\SANDAG EIREA 3.5 to 3.12.wpd 7/17/00
to a depth of about four feet below the water surface. Kelp beds are located near some of the borrow sites
and beaches.
A number of factors can influence the vitality of kelp beds. Grazers such as the halfmoon, opaleye, perch,
sea urchins, and various crustaceans can affect the growth of kelp. Storms frequently pull kelp plants off
the substrate. Sedimentation of the rocky bottom has also been known to retard kelp growth and bury
young plants, preventing development and reproduction. Kelp beds are leased and harvested by Kelco
along the San Diego coast. Those beds located between Leucadia and Solana Beach are of prime concern
for the project (Glantz 1999).
3.8.4 Recreational Fishing and Diving
A wide range of marine recreational fishing and diving opportunities exist along the San Diego coast. These
include surf and shoreline fishing, pier fishing, party boat fishing, private boat fishing and diving and
skin/SCUBA diving. National Marine Fisheries Service conducted a study (NMFS 1991) to determine
the extent of recreational marine fishing in California and the economic impact of the activity. Data from
telephone interviews of California Coastal County residents was assessed to estimate annual expenditures,
locations and types of fishing methods, and target fish species. The total number of anglers utilizing San
Diego County fisheries resources in 1989 was estimated at 159,600, with annual expenditures exceeding
$82 million. Fishing from private and charter boats accounted for over $71 million of the total. Fishing
from piers and beaches was a popular activity, with 350,900 and 119,800 trips per year, respectively.
Annual expenditures for pier and beach fishing were $4.9 million and $5.8 million, respectively. The most
common target species for beach fishing were bass, halibut, corbina, white seabass, perch, and croaker.
The sport party boat fishing fleet specializes in carrying fisherman to areas where fish can be caught and
more recently for whale watching. Most of these charters target offshore and pelagic species especially
tuna, yellowtail, albacore, and shark. However, there is a small contingent of operators that specialize is
half and one-day charters that typically fish the nearshore areas and kelp beds. These operators target sand
and kelp bass and California halibut. Oceanside harbor has one to four boats that specialize in this fishery
while Mission and San Diego Bays have a large charter fleet.
Sport diving and spearfishing activity mostly occur in the nearshore waters, and the number of diving trips
in San Diego was about 30,000 per year (NMFS 1991). Most diving occurs in habitats rich in marine life,
especially kelp beds and rocky reefs. Much of the diving in San Diego involves trips to locations not
3.8 Socioeconomics
Page 3.8-24 Regional Beach Sand Project EIR/EA99-69\SANDAG EIREA 3.5 to 3.12.wpd 7/17/00
accessible other than by boat, including offshore kelp beds, the vessels intentionally sunk as artificial reefs
in “Wreck Alley” off of Mission Beach, and even offshore islands and banks. Shoreline diving is also
popular. Borrow site MB-1 is located inside the Wreck Alley area (refer to Section 3.6).
The most common local beach diving locations include the submarine canyon off La Jolla Shores (where
dive instruction classes are typically taught), La Jolla Cove (due to the abundant undersea life there
attributable in part to the area’s protected underwater reserve status), and numerous other sites along the
coast from La Jolla to Oceanside where public access to nearshore reefs is convenient. Photography,
spearfishing for kelp bass and halibut, and diving for spiny lobsters are three of the more popular diving
activities. Spearfishing can involve either skin diving (also known as snorkeling or free diving) or the
SCUBA gear. Sport diving for lobster usually involves SCUBA diving as the lobster must be captured by
hand without the use of snares or any other tools, and individual lobster are often found under reef ledges,
in crevices between rocks, or in other difficult to access areas. Some lobster diving takes place at night,
as lobsters are more likely to leave shelter to forage and are thus easier to capture by hand. Diving for fish
and/or lobster occurred at a rate of about 1,000 trips per month, season permitting. The average number
of divers varies according to season, weather, and sea conditions (NMFS 1991). In recent years, the
popularity of non-consumptive sport dive activities have increased relative to dives oriented toward taking
game.

3.9 Public Health and Safety
Regional Beach Sand Project EIR/EA Page 3.9-199-69\SANDAG EIREA 3.5 to 3.12.wpd 7/17/00
3.9 PUBLIC HEALTH AND SAFETY
For purposes of this EIR/EA, public health and safety issues are defined as those that directly affect the
continued ability to protect and preserve life and property at locations along the proposed receiver sites.
Specifically, these issues are lifeguard services and recreational safety. In addition, vessel safety is
addressed because dredging activity would occur in the ocean. Safety issues relating to structures and
utilities, including lifeguard towers, are discussed in Section 4.10 (Structures and Utilities). Sediment and
chemical comparisons of dredged material and receiver sites have been completed and there would be no
risk to health or safety. This issue is not addressed further.
3.9.1 Lifeguard Services
At five proposed receiver sites (i.e., South Oceanside, Solana Beach, Del Mar, Mission Beach, and
Imperial Beach), the respective jurisdiction provides lifeguard services. At the eight state beaches,
however, the California Department of Parks and Recreation provides lifeguard services. The lifeguards
are responsible for all recreational safety measures along the beach. Safety measures include manned
lifeguard towers and regular vehicle patrols during the summer months. Lifeguard towers are typically more
heavily staffed on weekends during summer months. The locations of lifeguard towers at each receiver site
are addressed in Section 3.10.
3.9.2 Recreational Safety
Storm drain outfalls occasionally contribute to water pollution at the receiver sites, especially after rainy
periods. Water pollution stemming from these outfalls has resulted in the periodic closing of the region’s
beaches, when water contact is not recommended. In the days after a rain period, tidal action and
longshore currents disperse pollutants and the beaches are reopened for recreation.
3.9.3 Vessel Safety
Commercial boats, fishing boats, and recreational vessels currently traverse the overall project area along
the San Diego region’s coast. Most vessels operate out of Oceanside Harbor, Mission Bay, and San
Diego Bay.

3.10 Structures and Utilities
Regional Beach Sand Project EIR/EA Page 3.10-199-69\SANDAG EIREA 3.5 to 3.12.wpd 7/17/00
3.10 STRUCTURES AND UTILITIES
For the purpose of this EIR/EA, structures and utilities are defined as sewer outfalls, access stairs and
ramps, storm drain pipes, sea walls, and lifeguard towers. The following section identifies the location of
the existing structures and utilities within or adjacent to the receiver sites. The description of structures and
utilities is based on limited field surveys and prior environmental documentation (Department of the Navy
1997a; 1997b). In addition, city personnel were contacted to determine the location of city sewer and
storm drain ocean outfalls and any other related facilities that could be potentially impacted by
implementation of the proposed action.
3.10.1 Receiver Sites
South Oceanside
A 36-inch sewer outfall pipe is buried almost perpendicular to the shoreline directly north of Loma Alta
Creek. The depth of cover is unknown. This pipe was installed in approximately 1971 (Department of
the Navy 1997a). There are two side-by-side 36-inch storm drains at the end of Marron Street. Two
side-by-side 18-inch storm drains are located directly south of Tyson Street. An 18-inch pipe, half filled
with sand, is located at the end of Forster Street.
Public access stairs are located at the end of Tyson Street, Ash Street, Marron Street, Cassidy Street, and
Vista Way. The bottom elevation of the stairs at Cassidy Street is approximately 6.6 feet above MSL.
Ramp access exists at Wisconsin Street, Forster Street, and just north of Loma Alta Creek. In addition,
there is an access road at Oceanside Boulevard. A number of additional access paths and stairs have been
constructed in front of private homes, including a stairway just north of the creek. Rip-rap (large boulders)
exists to protect beachfront residences and structures. Lifeguard Tower No. 9 is located at the base of
Oceanside Boulevard on top of a concrete and rip-rap structure, and Tower No.11 is located further south
at Buccaneer Beach on the sand. Both towers are located approximately 50 feet from the shoreline and
remain in their locations year-round. The platforms for these lifeguard towers are approximately eight feet
high.
3.10 Structures and Utilities
Page 3.10-2 Regional Beach Sand Project EIR/EA99-69\SANDAG EIREA 3.5 to 3.12.wpd 7/17/00
North Carlsbad
The 50-foot Buena Vista Lagoon weir is located directly north of this receiver site, at the mouth of the
lagoon. An 18-inch-wide by 6-inch-high rectangular concrete drainage outlet structure is located adjacent
to the bottom of the public access stairs off Ocean Street. The top of the structure lies approximately 18
inches above the beach surface. The concrete drainage structure contains two 4-inch storm drain outlets,
which extend approximately 4 feet above the existing beach surface at the base of the stairs.
Public access stairs to the beach are located off Ocean Street, Beech Avenue, Pacific Avenue, Grand
Avenue, and Carlsbad Village Drive. A public access road is located at Pine Avenue. Several residential
properties also have private stairways for beach access, a few of which reach the beach surface. A number
of properties in the vicinity have sea walls and rip-rap to protect against erosion.
Lifeguard Tower No. 9 is located on the sand at the southern end of the receiver site on Pine Avenue. The
tower is surrounded by rip-rap and remains in the same location throughout the year. Its platform is
approximately 15 feet above the sand.
South Carlsbad North
Lifeguard Tower No. 13 is located on the bluff just south of Palomar Airport Road and is permanent.
There are no structures or utilities located on the beach along this receiver site.
South Carlsbad South
One public access stairway is located in the vicinity of the proposed receiver site. The stairway is located
across from Ponto Drive and has beach access from the State Park on top of the bluff. In addition, two
lifeguard towers are located along the beach; approximately 30 yards north of the access staircase and 250
yards south of the access stairs. The towers are moved from the beach in late October to the jetty further
north against the bluff, and replaced on the beach in March.
Batiquitos
An 18-inch storm drain is located at the base of Moorgate Road. Public access stairs are located north
of Sea Bluffs Road. An additional private access stairway is located just south of Sea Bluffs Road. An
3.10 Structures and Utilities
Regional Beach Sand Project EIR/EA Page 3.10-399-69\SANDAG EIREA 3.5 to 3.12.wpd 7/17/00
elevated path with a sea wall and vegetated groundcover also extends along the receiver site. State
Lifeguard Tower No. 2 is located directly north of the receiver site, and Lifeguard Tower No. 1 is located
near the public restrooms. Both towers are annually removed from the beach in late fall and placed back
on the beach in mid-April.
Leucadia
Public access points are located to the south and north ends of the proposed receiver site. An access ramp
is located just south of Jasper Street, while a stairway is located just north of the base of Grandview Street.
Along the site, numerous private access stairs have been built from the bluffs down to the beach. Rip-rap
and seawalls also exist to protect bluff top residences. A lifeguard tower is located at the base of the
access stairs north of Grandview Street. The tower is located on the beach only during the summer months,
and is removed during the winter season.
Moonlight Beach
One 36-inch, one 60-inch, and three 48-inch storm drain pipes are located at the end of B Street at
Moonlight State Beach. The City of Encinitas has excavated several feet around the outlets to expose the
pipes and allow proper drainage flow.
A public stairway is located at D Street. Rip-rap exists at the base of the bluffs on the northern and
southern boundaries of the receiver site. A permanent lifeguard stand is located at the south end of
Moonlight Beach at C Street and a temporary tower is placed at the north end of the beach at B Street.
Both are situated on the berm above the low tide beach, and neither tower is moved during the winter
season.
Cardiff
The 30-inch diameter San Elijo sewer outfall is located just south of the mouth of San Elijo Lagoon. The
outfall is buried within the southern end of the proposed Cardiff receiver site.
A cluster of restaurants and shops, as well as a public parking lot, is located to the north of the receiver site.
The restaurants are protected by rip-rap. Just south of the restaurants, a lifeguard access ramp extends
to the beach. A low rip-rap sea wall protects the length of road, restaurants, and parking facilities along
3.10 Structures and Utilities
Page 3.10-4 Regional Beach Sand Project EIR/EA99-69\SANDAG EIREA 3.5 to 3.12.wpd 7/17/00
the receiver site. State Lifeguard Tower No. 6, located just south of the lagoon mouth, is pulled back to
the parking lot during the winter season. Lifeguard Tower No. 5 is located just south of the restaurants.
This tower is fixed by the cobbles on the beach and is not moved seasonally. Its viewing platform is
approximately 15 feet high.
Solana Beach
A 60-inch energy dissipator storm drain pipe is located at the west end of Plaza Street. Another storm
drain outlet is located at Seascape Surf, to the south of Fletcher Cove. This storm drain emerges from the
bluff face at approximately 9 to 10 feet above MSL.
There is a public access staircase at Del Mar Shores Beach Park, and a public access ramp at Plaza Street
at Fletcher Cove. In addition, private stairs extend to the beach from Seascape Surf. One temporary
lifeguard tower is located within the proposed receiver site at the Seascape Surf access point. Another
tower is located just north of the proposed site at Fletcher Cove. Both towers are annually placed on the
beach the weekend before Memorial Day and removed the weekend after Labor Day.
Del Mar
There is an eight by three-foot storm drain outlet located at 17th Street near the lifeguard headquarters that
emerges onto the beach. Three 12-inch storm drains exist along the bluffs at Powerhouse Park. There is
also a six-inch storm drain outlet at the west end of 20th Street and one 12-inch storm drain located
approximately 280 feet north of the 15th Street cliff.
There is a public access road located south of 17th Street. There are no access stairs along the receiver R
site, but two ramps exist near 15th Street and Powerhouse Park. The entire beach is accessible to R
pedestrians from the public streets which end at the beach. A sea wall extends along the site from 29th
Street to 19th Street. In addition, a protective rip-rap wall exists along commercial uses just north of
Powerhouse Park.
The City’s lifeguard headquarters is located at the foot of 17th Street. Additional lifeguard towers are
located at 20th, 25th, and 29th Streets. All stations are permanent structures located just east of the beach,
and the 29th Street tower is located just east of the seawall. All lifeguard stations’ viewing platforms are
3.10 Structures and Utilities
Regional Beach Sand Project EIR/EA Page 3.10-599-69\SANDAG EIREA 3.5 to 3.12.wpd 7/17/00
approximately 20 feet above the sand. No additional structures or utilities presently exist within the
shoreline area of the proposed receiver site.
Torrey Pines
A permanent County of San Diego lifeguard tower is located adjacent to the parking lot at the base of
Torrey Pines Road. Rip-rap has been placed on the beach to protect the road. No additional structures
or utilities presently exist within the shoreline area of the proposed receiver site.
Mission Beach
There are four access staircases along the receiver site. They are located at the ends of San Juan Place,
El Carmel Place, San Luis Obispo Place, and Santa Barbara Place. Lifeguard Tower No. 16 is located
at the end of Jersey Court, and Lifeguard Tower No.17 is located just west of the access stairs on San Luis
Obispo Place. These towers are temporary and are removed from the site in late October and replaced
in March of each year.
A boardwalk with a 2.5-foot high sea wall that extends the length of the receiver site was built between
1925 and 1928. The seawall is approximately 10 feet above MSL. No additional structures or utilities
presently exist within the shoreline area of the proposed receiver site.
Imperial Beach
A public access ramp exists at the end of Imperial Beach Boulevard. A gated access road used by
lifeguard vehicles is located at the south end of Seacoast Drive. In addition, emergency vehicle access is
also used by lifeguards at Admiralty Way and Descanso Avenue. One temporary lifeguard tower is located
at the end of Imperial Beach Boulevard, at the north terminus of the receiver site. Rip-rap protects
residences along the southern portion of the receiver site. No additional structures or utilities presently exist
within the shoreline area of the proposed receiver site.
3.10.2 Borrow Sites
All six borrow sites are located offshore and contain no utilities within their boundaries. For more
information, refer to Section 3.6 (Land Use) and Figures 2-15 to 2-20.
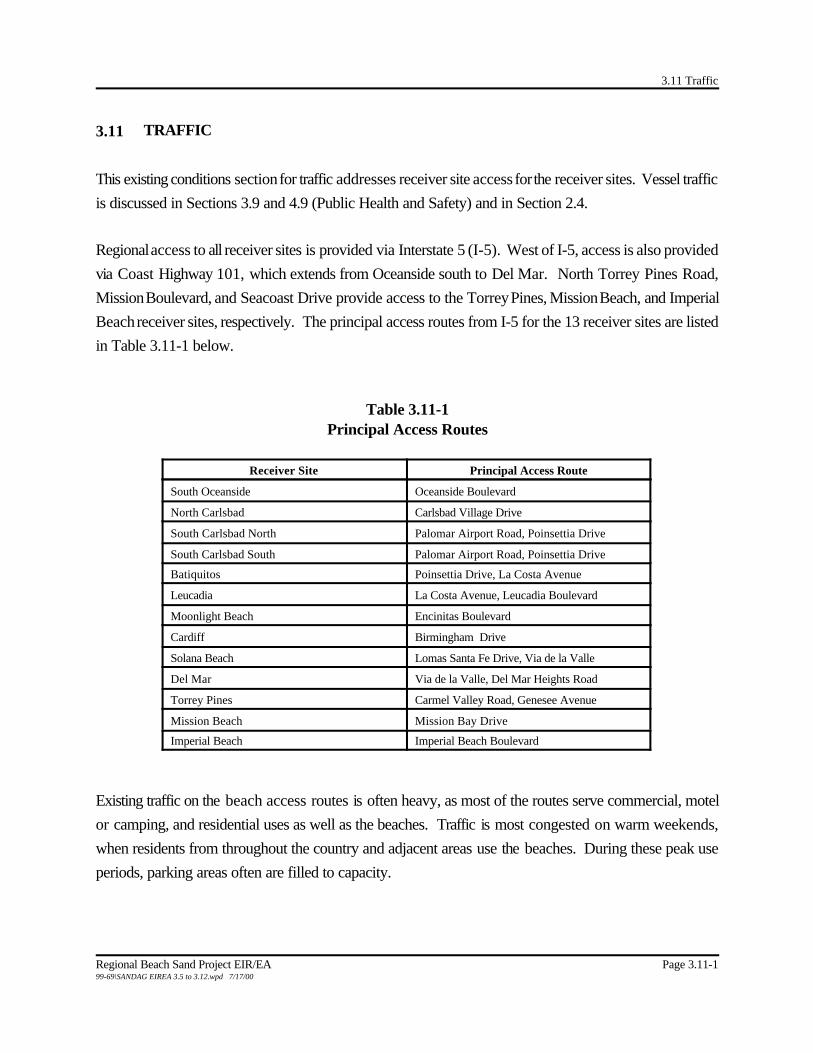
3.11 Traffic
Regional Beach Sand Project EIR/EA Page 3.11-199-69\SANDAG EIREA 3.5 to 3.12.wpd 7/17/00
3.11 TRAFFIC
This existing conditions section for traffic addresses receiver site access for the receiver sites. Vessel traffic
is discussed in Sections 3.9 and 4.9 (Public Health and Safety) and in Section 2.4.
Regional access to all receiver sites is provided via Interstate 5 (I-5). West of I-5, access is also provided
via Coast Highway 101, which extends from Oceanside south to Del Mar. North Torrey Pines Road,
Mission Boulevard, and Seacoast Drive provide access to the Torrey Pines, Mission Beach, and Imperial
Beach receiver sites, respectively. The principal access routes from I-5 for the 13 receiver sites are listed
in Table 3.11-1 below.
Table 3.11-1Principal Access Routes
Receiver Site Principal Access Route
South Oceanside Oceanside Boulevard
North Carlsbad Carlsbad Village Drive
South Carlsbad North Palomar Airport Road, Poinsettia Drive
South Carlsbad South Palomar Airport Road, Poinsettia Drive
Batiquitos Poinsettia Drive, La Costa Avenue
Leucadia La Costa Avenue, Leucadia Boulevard
Moonlight Beach Encinitas Boulevard
Cardiff Birmingham Drive
Solana Beach Lomas Santa Fe Drive, Via de la Valle
Del Mar Via de la Valle, Del Mar Heights Road
Torrey Pines Carmel Valley Road, Genesee Avenue
Mission Beach Mission Bay Drive
Imperial Beach Imperial Beach Boulevard
Existing traffic on the beach access routes is often heavy, as most of the routes serve commercial, motel
or camping, and residential uses as well as the beaches. Traffic is most congested on warm weekends,
when residents from throughout the country and adjacent areas use the beaches. During these peak use
periods, parking areas often are filled to capacity.

3.12 Air Quality
Regional Beach Sand Project EIR/EA Page 3.12-199-69\SANDAG EIREA 3.5 to 3.12.wpd 7/17/00
3.12 AIR QUALITY
This section provides an overview of the air quality in the San Diego region. It is not necessary or possible
to describe air quality at each of the specific borrow sites or receiver sites. Since potential air quality
impacts are addressed in terms of compliance with federal or state regulations, those regulations are
discussed in this section.
3.12.1 Environmental Setting, Climate and Meteorology
The receiver and borrow sites are located in the San Diego Air Basin (SDAB), which is contiguous with
San Diego County. The climate of San Diego County is characterized by warm, dry summers and mild,
wet winters. One of the main determinants of the climatology is a semi-permanent high-pressure area (the
Pacific High) in the eastern Pacific Ocean. In the summer, this pressure center is located well to the north,
causing storm tracks to be directed north of California. This high-pressure cell maintains clear skies for
much of the year. When the Pacific High moves southward during the winter, this pattern chances, and
low-pressure storms are brought into the region, causing widespread precipitation. In San Diego County,
the months of heaviest precipitation are November through April, averaging about 9 to 14 inches annually.
The mean temperature is 62.2ºF, and the mean maximum and mean minimum temperatures are 75.7ºF and
48.5ºF, respectively.
The Pacific High also influences the wind patterns of California. The predominant wind directions at
MCAS Miramar are westerly and west-southwesterly during all four seasons, and the average annual wind
speed is 5.6 mph.
A common atmospheric condition known as a temperature inversion affects air quality in San Diego.
During an inversion, air temperatures get warmer with increasing height rather than cooler. Subsidence
inversions occur during the warmer months (May through October) as descending air associated with the
Pacific high-pressure cell comes into contact with cool marine air. The boundary between the layers of air
represents a temperature inversion which traps pollutants below it. The inversion layer is approximately
2,000 feet MSL during the months of May through October. However, during the winter months
(November through April), the temperature inversion is approximately 3,000 feet MSL. Inversion layers
are important elements of local air quality because they inhibit the dispersion of pollutants, thus resulting in
a temporary degradation of air quality.

3.12 Air Quality
3 Standards for 8-hour O3 and PM2.5 standards became effective on September 15, 1997, and policies and systems toimplement these new standards are being developed. No new controls with respect to the new standards will be required by theUSEPA until after the year 2002. However, on May 14, and June 18, 1999, the United States Court of Appeals rendereddecisions that effectively struck down these standards. On June 28, 1999 the USEPA filed a petition asking the court for areversal of the decision.
Page 3.12-2 Regional Beach Sand Project EIR/EA99-69\SANDAG EIREA 3.5 to 3.12.wpd 7/17/00
3.12.2 Applicable Regulations, Plans, and Policies
The Federal Clean Air Act (42 U.S.C. §§ 7401-7671q) requires the adoption of national ambient air
quality standards (NAAQS) to protect the public health and welfare from the effects of air pollution. The
NAAQS have been updated occasionally. Current standards are set for sulfur dioxide (SO2), carbon
monoxide (CO), nitrogen dioxide (NO2), ozone (O3), particulate matter equal to or less than 10 microns
in size (PM10), fine particulate matter equal to or less than 2.5 microns in size (PM2.5), and lead (Pb)3. The
State of California Air Resources Board (ARB) has established additional standards which are generally
more restrictive than the NAAQS. Federal and state standards are shown in Table 3.12-1.
In San Diego County, the San Diego APCD is the agency responsible for protecting the public health and
welfare through the administration of federal and state air quality laws, regulations, and policies. Included
in the APCD’s tasks are the monitoring of air pollution, the preparation of the State Implementation Plan
(SIP) for the SDAB, and the promulgation of Rules and Regulations. The SIP includes strategies and
tactics to be used to attain the federal O3 standard in the County. The elements are taken from the Regional
Air Quality Strategies (RAQS), which is the APCD plan for attaining the state O3 standard, which is more
stringent than the federal standard. The Rules and Regulations include procedures and requirements to
control the emission of pollutants and to prevent adverse impacts.
The SD APCD does not have quantitative emissions limits for construction activities. With respect to the
proposed project, APCD Rule 51, Nuisance, is of interest, and includes the following:
A person shall not discharge from any source whatsoever such quantities of air
contaminants or other material which cause injury, detriment, nuisance or annoyance to any
considerable number of persons or to the public or which cause or have a natural tendency
to cause injury or damage to business or property.
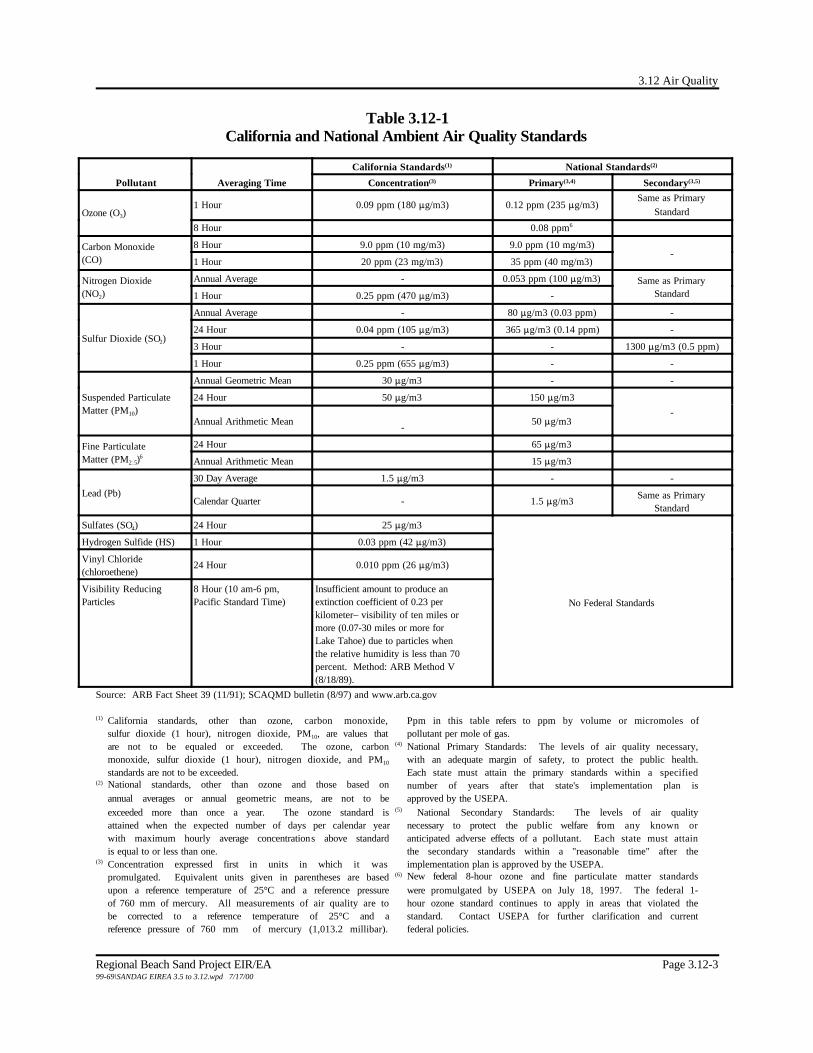
3.12 Air Quality
Regional Beach Sand Project EIR/EA Page 3.12-399-69\SANDAG EIREA 3.5 to 3.12.wpd 7/17/00
Table 3.12-1California and National Ambient Air Quality Standards
Pollutant Averaging Time
California Standards(1) National Standards(2)
Concentration(3) Primary(3,4) Secondary(3,5)
Ozone (O3)1 Hour 0.09 ppm (180 :g/m3) 0.12 ppm (235 :g/m3)
Same as PrimaryStandard
8 Hour 0.08 ppm6
Carbon Monoxide(CO)
8 Hour 9.0 ppm (10 mg/m3) 9.0 ppm (10 mg/m3)-
1 Hour 20 ppm (23 mg/m3) 35 ppm (40 mg/m3)
Nitrogen Dioxide(NO2)
Annual Average - 0.053 ppm (100 :g/m3) Same as PrimaryStandard1 Hour 0.25 ppm (470 :g/m3) -
Sulfur Dioxide (SO2)
Annual Average - 80 :g/m3 (0.03 ppm) -
24 Hour 0.04 ppm (105 :g/m3) 365 :g/m3 (0.14 ppm) -
3 Hour - - 1300 :g/m3 (0.5 ppm)
1 Hour 0.25 ppm (655 :g/m3) - -
Suspended ParticulateMatter (PM10)
Annual Geometric Mean 30 :g/m3 - -
24 Hour 50 :g/m3 150 :g/m3
-Annual Arithmetic Mean
-50 :g/m3
Fine ParticulateMatter (PM2.5)
6
24 Hour 65 :g/m3
Annual Arithmetic Mean 15 :g/m3
Lead (Pb)
30 Day Average 1.5 :g/m3 - -
Calendar Quarter - 1.5 :g/m3Same as Primary
Standard
Sulfates (SO4) 24 Hour 25 :g/m3
No Federal Standards
Hydrogen Sulfide (HS) 1 Hour 0.03 ppm (42 :g/m3)
Vinyl Chloride(chloroethene)
24 Hour 0.010 ppm (26 :g/m3)
Visibility ReducingParticles
8 Hour (10 am-6 pm,Pacific Standard Time)
Insufficient amount to produce anextinction coefficient of 0.23 perkilometer– visibility of ten miles ormore (0.07-30 miles or more forLake Tahoe) due to particles whenthe relative humidity is less than 70percent. Method: ARB Method V(8/18/89).
Source: ARB Fact Sheet 39 (11/91); SCAQMD bulletin (8/97) and www.arb.ca.gov
(1) California standards, other than ozone, carbon monoxide,sulfur dioxide (1 hour), nitrogen dioxide, PM10, are values thatare not to be equaled or exceeded. The ozone, carbonmonoxide, sulfur dioxide (1 hour), nitrogen dioxide, and PM10
standards are not to be exceeded.(2) National standards, other than ozone and those based on
annual averages or annual geometric means, are not to beexceeded more than once a year. The ozone standard isattained when the expected number of days per calendar yearwith maximum hourly average concentrations above standardis equal to or less than one.
(3) Concentration expressed first in units in which it waspromulgated. Equivalent units given in parentheses are basedupon a reference temperature of 25°C and a reference pressureof 760 mm of mercury. All measurements of air quality are tobe corrected to a reference temperature of 25°C and areference pressure of 760 mm of mercury (1,013.2 millibar).
Ppm in this table refers to ppm by volume or micromoles ofpollutant per mole of gas.
(4) National Primary Standards: The levels of air quality necessary,with an adequate margin of safety, to protect the public health.Each state must attain the primary standards within a specifiednumber of years after that state's implementation plan isapproved by the USEPA.
(5) National Secondary Standards: The levels of air qualitynecessary to protect the public welfare from any known oranticipated adverse effects of a pollutant. Each state must attainthe secondary standards within a "reasonable time" after theimplementation plan is approved by the USEPA.
(6) New federal 8-hour ozone and fine particulate matter standardswere promulgated by USEPA on July 18, 1997. The federal 1-hour ozone standard continues to apply in areas that violated thestandard. Contact USEPA for further clarification and currentfederal policies.
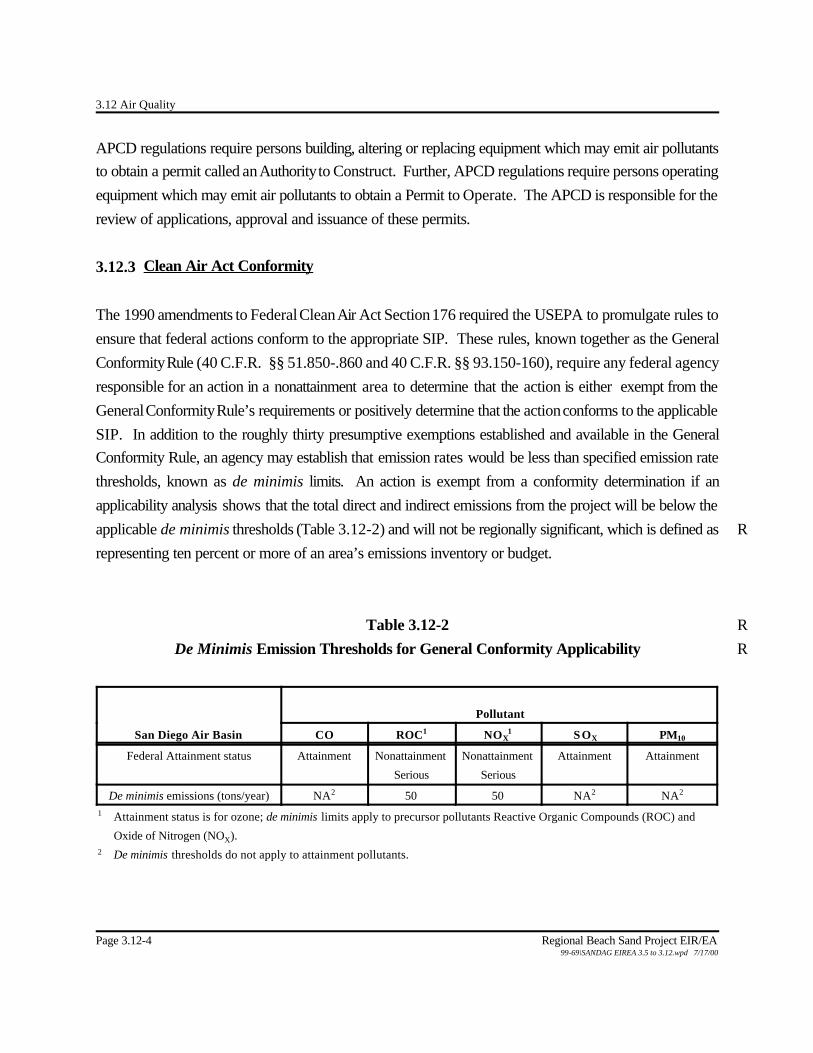
3.12 Air Quality
Page 3.12-4 Regional Beach Sand Project EIR/EA99-69\SANDAG EIREA 3.5 to 3.12.wpd 7/17/00
APCD regulations require persons building, altering or replacing equipment which may emit air pollutants
to obtain a permit called an Authority to Construct. Further, APCD regulations require persons operating
equipment which may emit air pollutants to obtain a Permit to Operate. The APCD is responsible for the
review of applications, approval and issuance of these permits.
3.12.3 Clean Air Act Conformity
The 1990 amendments to Federal Clean Air Act Section 176 required the USEPA to promulgate rules to
ensure that federal actions conform to the appropriate SIP. These rules, known together as the General
Conformity Rule (40 C.F.R. §§ 51.850-.860 and 40 C.F.R. §§ 93.150-160), require any federal agency
responsible for an action in a nonattainment area to determine that the action is either exempt from the
General Conformity Rule’s requirements or positively determine that the action conforms to the applicable
SIP. In addition to the roughly thirty presumptive exemptions established and available in the General
Conformity Rule, an agency may establish that emission rates would be less than specified emission rate
thresholds, known as de minimis limits. An action is exempt from a conformity determination if an
applicability analysis shows that the total direct and indirect emissions from the project will be below the
applicable de minimis thresholds (Table 3.12-2) and will not be regionally significant, which is defined as R
representing ten percent or more of an area’s emissions inventory or budget.
Table 3.12-2 R
De Minimis Emission Thresholds for General Conformity Applicability R
San Diego Air Basin
Pollutant
CO ROC1 NOX1 SOX PM10
Federal Attainment status Attainment Nonattainment
Serious
Nonattainment
Serious
Attainment Attainment
De minimis emissions (tons/year) NA2 50 50 NA2 NA2
1 Attainment status is for ozone; de minimis limits apply to precursor pollutants Reactive Organic Compounds (ROC) and
Oxide of Nitrogen (NOX).2 De minimis thresholds do not apply to attainment pollutants.
3.12 Air Quality
Regional Beach Sand Project EIR/EA Page 3.12-599-69\SANDAG EIREA 3.5 to 3.12.wpd 7/17/00
3.12.4 Regional and Local Air Quality
Specific geographic areas are classified as either “attainment” or “nonattainment” areas for each pollutant
based upon the comparison of measured data with NAAQS and state standards. The SDAB, which is
contiguous with San Diego County, currently meets the federal standards for all pollutants except O3 and
state standards for all pollutants except O3 and PM10. The SDAB is currently classified as a federal and
state “serious” O3 nonattainment area and a state nonattainment area for PM10. The SDAB currently falls
under a federal “maintenance plan” for CO, following a 1998 redesignation as a CO attainment area.
Ambient air pollutant concentrations in the SDAB are measured at ten air quality monitoring stations
operated by San Diego APCD. In the coastal area, O3 is monitored at Camp Pendleton, Oceanside, Del
Mar, and Chula Vista; PM10 is monitored at Oceanside and Chula Vista. Table 3.12-3 presents O3
exceedance of standard data for the county and coastal stations for the 1994-1998 period. Table 3.12-4
presents PM10 exceedance of standard data for the county and coastal stations for the 1994-1998 period.
3.12.5 Sources of Regional and Local Pollution
The most significant regional sources of O3, NO2, and CO are automobiles and other on-road vehicles.
O3 is formed by the reaction of volatile organic compounds (VOC) and oxides of nitrogen (NOx), which
are combustion products from gas and diesel engines. Other important sources of VOC are paints,
coatings and process solvents. The major sources of PM10 are construction, demolition and dust from
paved and unpaved roads.

3.12 Air Quality
Page 3.12-6 Regional Beach Sand Project EIR/EA99-69\SANDAG EIREA 3.5 to 3.12.wpd 7/17/00
Table 3.12-3Ozone – Number of Days Exceeding Federal and State Standards
San Diego County - 1994-1998
Station
Number of DaysExceeding Federal 1-Hour Standard
Concentration >12 pphm
Number of DaysExceeding State 1-Hour Standard
Concentration >9 pphm
Number of DaysExceeding Federal 8-Hour Standard
Concentration >8 pphm1998 1997 1996 1995 1994 1998 1997 1996 1995 1994 1998 1997 1996 1995 1994
Basinwide 9 1 2 12 9 54 43 51 96 79 35 16 31 48 46
Camp Pendleton 0 0 – – – 9 6 – – – 5 3 – – –
Oceanside 0 0 0 0 0 3 6 4 5 2 1 0 3 0 1
Del Mar 0 0 0 0 0 1 4 2 12 4 0 2 2 3 1
Chula Vista 0 0 0 1 0 2 10 1 7 4 0 3 0 1 0
Source: San Diego APCD 1999, CARB 1999Camp Pendleton station not operating prior to 1997.
Table 3.12-4PM10 – Samples Exceeding Federal and State Standards
San Diego County - 1994-1998
Station
Percent of Samplesabove Federal 24 hourstandard of 150 ::g/m3
Percent of Samplesabove State 24 hour standard of 50 ::g/m3
Exceed AnnualStandard?
1998 1997 1996 1995 1994 1998 1997 1996 1995 1994 Federal StateBasinwide 0 0 0 0 0 NA 26 18 27 29 N Y(1)
Oceanside 0 0 0 0 0 0 0 2 7 4 N N
Chula Vista 0 0 0 0 0 0 3 3 8 3 N N
Sources: San Diego APCD, 1999, CARB 1999NA - Data not available.(1) The state annual standard was exceeded each year 1994-1998 at the Otay Mesa station. The standard was not exceeded at any other station during the 5-year period.
3.1 Land Use
Regional Beach Sand Project EIR/EA Page 3.13-1 99-69\SECT-03.13.DOC 9/24/02
3.13 NOISE
3.13.1 Introduction Noise is defined as unwanted or objectionable sound. The effects of noise on people can include general annoyance, interference with speech communication, sleep disturbance and, in the extreme, hearing impairment.
Noise Terminology The human ear is not equally sensitive to all frequencies within the sound spectrum. Therefore, a method called “A-weighting” is used to filter noise frequencies that are not audible to the human ear. Noise levels are usually measured and expressed in decibels (dB) and noise levels using the “A-weighted” noise scale are usually written dB(A) or dBA. Decibels are measured on a logarithmic scale which quantifies sound intensity in a manner similar to the Richter scale used for earthquake magnitudes. Thus, a doubling of the energy of a noise source, such as doubling traffic volume, would increase the noise level by 3 dBA; a halving of the energy would result in a 3 dBA decrease. Table 3.13-1 shows the relationship of various sound levels to commonly experienced noise events. Average noise levels over a period of minutes or hours are usually expressed as dB Leq, or the equivalent noise level for that period of time. The period of time average may be specified; Leq(3) would be a three hour average; when no period is specified, a one hour average is assumed. Construction noise standards are usually stated as average noise levels over a period of 1, 8 or 12 hours. Noise standards for land use compatibility have been established by various jurisdictions, and in California are usually stated in terms of the Community Noise Equivalent Level (CNEL), which is a 24-hour weighted average measure of community noise. The computation of CNEL adds 5 dB to the average hourly noise levels between 7 p.m. and 10 p.m. - the evening hours, and 10 dB to the average hourly noise levels between 10 p.m. and 7 a.m. - the nighttime hours. This weighting accounts for the increased human sensitivity to noise in the evening and nighttime hours. A similar 24-hour weighted average is the Day-Night Average noise level (Ldn or DNL), which weights only the nighttime hours, and not the evening hours. CNEL is used primarily in California.
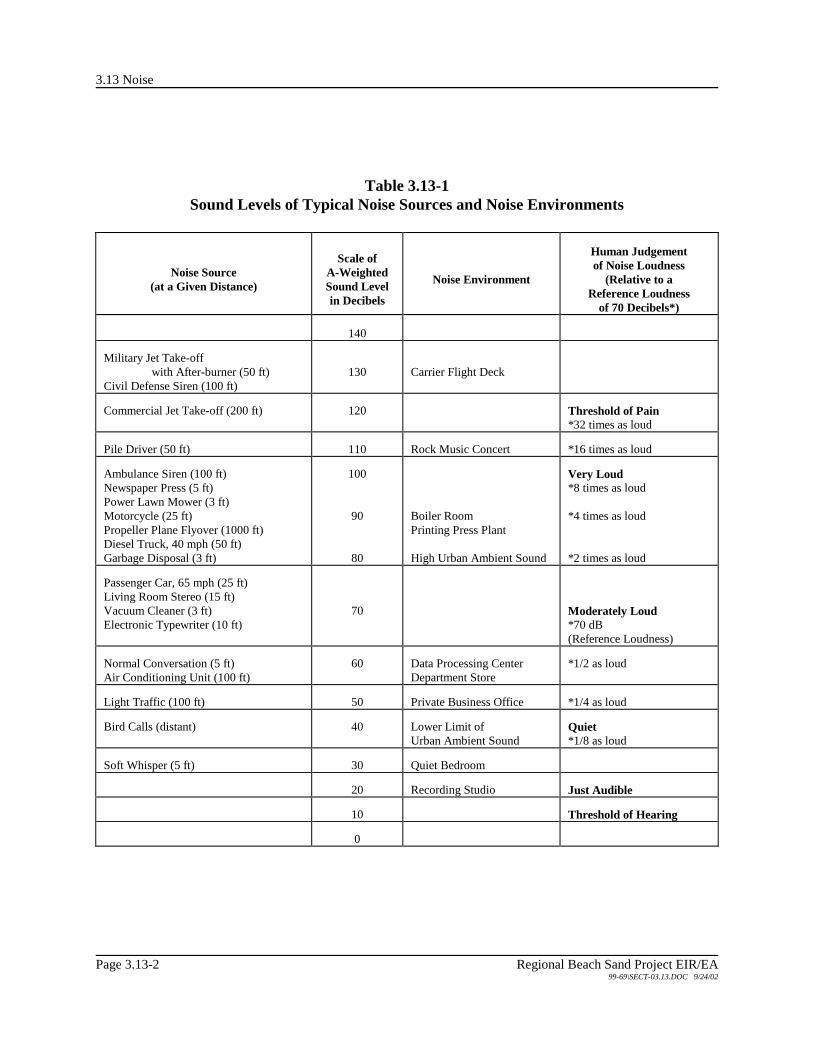
3.13 Noise
Page 3.13-2 Regional Beach Sand Project EIR/EA 99-69\SECT-03.13.DOC 9/24/02
Table 3.13-1 Sound Levels of Typical Noise Sources and Noise Environments
Noise Source
(at a Given Distance)
Scale of
A-Weighted Sound Level in Decibels
Noise Environment
Human Judgement of Noise Loudness
(Relative to a Reference Loudness
of 70 Decibels*)
140
Military Jet Take-off
with After-burner (50 ft) Civil Defense Siren (100 ft)
130
Carrier Flight Deck
Commercial Jet Take-off (200 ft)
120
Threshold of Pain *32 times as loud
Pile Driver (50 ft)
110
Rock Music Concert
*16 times as loud
Ambulance Siren (100 ft) Newspaper Press (5 ft) Power Lawn Mower (3 ft) Motorcycle (25 ft) Propeller Plane Flyover (1000 ft) Diesel Truck, 40 mph (50 ft) Garbage Disposal (3 ft)
100
90
80
Boiler Room Printing Press Plant High Urban Ambient Sound
Very Loud *8 times as loud *4 times as loud *2 times as loud
Passenger Car, 65 mph (25 ft) Living Room Stereo (15 ft) Vacuum Cleaner (3 ft) Electronic Typewriter (10 ft)
70
Moderately Loud *70 dB (Reference Loudness)
Normal Conversation (5 ft) Air Conditioning Unit (100 ft)
60
Data Processing Center Department Store
*1/2 as loud
Light Traffic (100 ft)
50
Private Business Office
*1/4 as loud
Bird Calls (distant)
40
Lower Limit of Urban Ambient Sound
Quiet *1/8 as loud
Soft Whisper (5 ft)
30
Quiet Bedroom
20
Recording Studio
Just Audible
10
Threshold of Hearing
0
3.13 Noise
Regional Beach Sand Project EIR/EA Page 3.13-3 99-69\SECT-03.13.DOC 9/24/02
Sleep Interference Sleep interference is a noise concern because sleep is a noise sensitive human activity. Sleep disturbance studies have identified interior noise levels that have the potential to cause sleep disturbance. Sleep disturbance does not necessarily mean awakening from sleep, but can refer to altering the pattern and stages of sleep (City of Solana Beach 1988). The California Department of Public Health has identified 35-45 dBA as the noise level that could cause interruption of sleep (County of San Diego 1980).
Human Reaction to Sound and Response to Changes in Noise Levels People tend to compare an intruding noise with the existing background noise. If the new noise is readily identifiable or considerably louder than the background or ambient, it usually becomes objectionable. An aircraft flying over a residential area is an example. Under controlled conditions in an acoustics laboratory, the trained healthy human ear is able to discern changes in sound levels of 1 dBA, when exposed to steady, single frequency (“pure tone”) signals in the mid-frequency range. Outside of such controlled conditions, the trained ear can detect changes of 2 dBA in normal environmental noise. It is widely accepted that the average healthy ear, however, can barely perceive noise level changes of 3 dBA, whereas a 5 dBA change is readily noticeable. A 10 dBA change normally is perceived as a doubling, or halving, of the noise level.
Sensitive Noise Receptors Noise sensitive receptors are generally considered to be human activities or land uses that may be subject to the stress of significant interference from noise. Land uses which are associated with sensitive receptors often include residential dwellings, mobile homes, hotels, motels, hospitals, nursing homes, education facilities, and libraries. Many jurisdictions recognize parks or recreation areas as noise sensitive land uses. All of the receiver sites include recreational beach areas. The recreational areas and activities and adjacent land uses are described in Section 3.6 of this EIR/EA. The descriptions in subsection 3.13.3 below highlight the non-recreational noise sensitive uses that would be exposed to noise sources included in the proposed action. These receptors are principally adjacent to the receiver areas.
3.13 Noise
Page 3.13-4 Regional Beach Sand Project EIR/EA 99-69\SECT-03.13.DOC 9/24/02
All of the borrow sites would be located offshore and there would be no adjacent sensitive receptors. The nearest sensitive receptors to any borrow site are approximately 4,000 feet away. These consist of residents on the shore near SO-7, SO-6, and SO-5. Sensitive receptors may also be threatened or endangered noise sensitive biological species. Noise sensitive avian species in the project area include the California least tern and the western snowy plover. The locations of these species relative to the receiver sites and borrow sites are described in Section 3.4 of this EIR/EA. The closest nesting locations are shown in Figure 3.4-1.
3.13.2 Applicable Standards The proposed action is a construction project. Most of the jurisdictions in which the project would occur have construction noise standards which would be applicable to the project. Construction noise standards are usually found in a “noise ordinance”, and include limitations on the hours that construction work may be performed, maximum allowable noise levels, or both. In addition to the specific requirements, each ordinance typically includes a “General Prohibition” on noise that prohibits disturbing, excessive or offensive noise which causes discomfort or annoyance to reasonable persons of normal sensitivity. A noise ordinance also usually contains conditions and procedures for obtaining variances from construction noise limitations. Table 3.13-2 summarizes the standards applicable at the receiver sites. As noted in Section 2.7, there are no applicable noise standards at receiver sites within the California State Parks System.
3.13.3 Existing Noise Levels at Receiver Sites The principal source of noise at each of the receiver sites is the ocean, including breaking waves and the interaction of water, rocks and sand in the surf area. Noise levels vary with the tide, height of the waves and the sand-rock composition. In general, all of the receiver sites have relatively high background noise levels due to constant surf activity. This is typical of a beach environment. The measured noise levels, and additional noise sources associated with the individual receiver sites, are described below. Existing noise levels were measured at the receiver sites between July 26 and September 27, 1999. A Larson-Davis Laboratories Model 712 Type 2 sound level meter was used. The meter calibration was checked before and after use. The following parameters were used: Filter: A-weighted;
3.13 Noise
Regional Beach Sand Project EIR/EA Page 3.13-5 99-69\SECT-03.13.DOC 9/24/02
Table 3.13-2 Summary of Applicable Construction Noise Standards (landscape – see end of file)

3.13 Noise
Page 3.13-6 Regional Beach Sand Project EIR/EA 99-69\SECT-03.13.DOC 9/24/02
Response: Slow; Time history period: 5 seconds. Generally, the total measurement time at each position was on the order of 10-15 minutes, because the ambient noise was relatively constant, and longer periods were not necessary to determine an average. Occasionally, measurements were cut short because of extraneous noise sources, such as barking dogs and curious people, or other conditions that precluded further measurement. Noise measurement locations were chosen at or near the sensitive receptors closest to the anticipated noise source locations, or at points that are equivalent. In some instances, access to representative points was not available, which is noted in the individual site descriptions.
South Oceanside Sensitive Receptors The proposed receiver site is bounded on the east by a rip-rap slope. The site would extend from north of Marron Street, on the north, to south of Cassidy Street, on the south. Sensitive noise receptors include single and multi-family residences that are east of the beach and rip-rap slope, with setbacks on the order of 5 to 10 feet. The east sides of these homes face South Pacific Street. South of Buccaneer Beach Park and Morse Street, the homes on the east side of South Pacific Street are also potential sensitive receptors. These homes are elevated approximately 20 feet above the homes to the west, thus providing partial views to the beach. The NCTD railroad tracks, which carry approximately 41 trains per day1, are located approximately 800 feet east of the fill site. Noise Levels Table 3.13-3 shows the measured noise levels in the South Oceanside receiver site area. From this data, it may be assumed that noise levels of 62-65 dBA at the beachfront homes during periods when there is little or no activity on the beach, and little or no train or traffic noise. The range of noise levels indicates the variance in distance from the homes to the east edge of the fill area and the surf line. Noise levels would be greater during periods of greater activity on the beach, principally from voices. Nighttime noise levels at the homes on the east side of South Pacific Street, south of Cassidy, would be approximately 10 dB less, in the 52-55 dBA range. At these homes, daytime noise levels would be higher because of traffic on South Pacific Street.
1 One way trips: 17 Amtrak, 18 Coaster and 6 freight. North of the Oceanside transit center, there are less
Coaster passbys, but additional Metrolink trains.
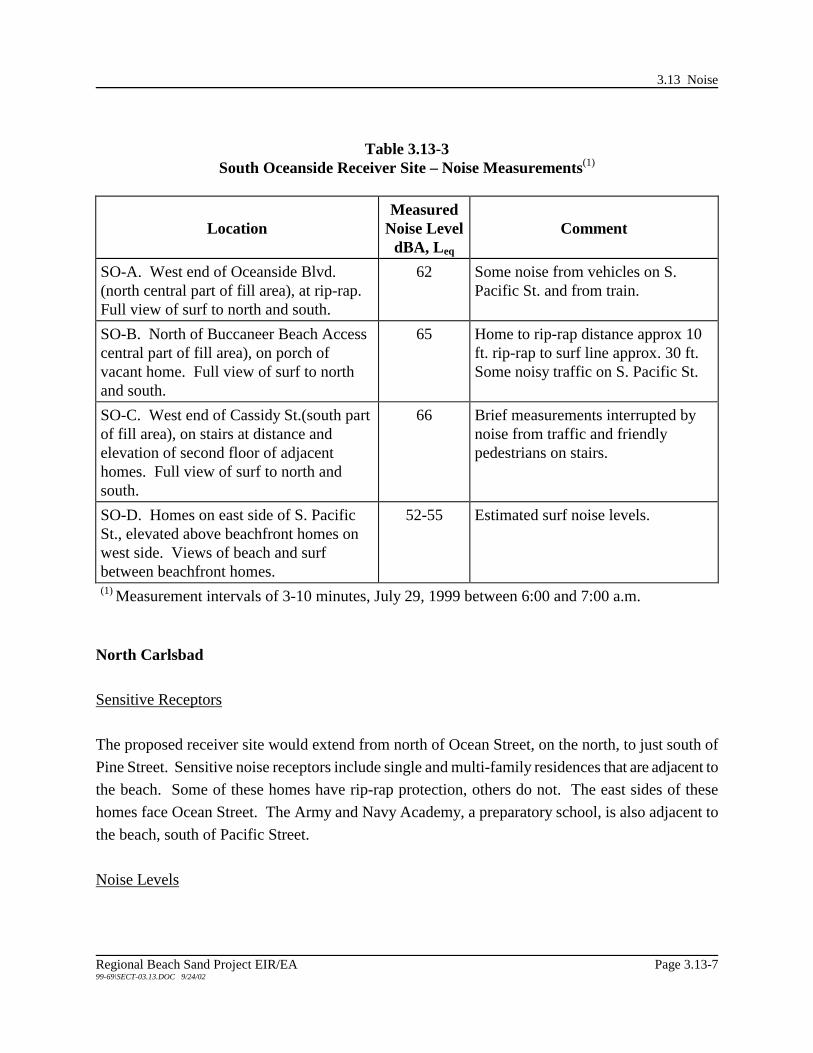
3.13 Noise
Regional Beach Sand Project EIR/EA Page 3.13-7 99-69\SECT-03.13.DOC 9/24/02
Table 3.13-3
South Oceanside Receiver Site – Noise Measurements(1)
Location
Measured
Noise LeveldBA, Leq
Comment
SO-A. West end of Oceanside Blvd. (north central part of fill area), at rip-rap. Full view of surf to north and south.
62
Some noise from vehicles on S. Pacific St. and from train.
SO-B. North of Buccaneer Beach Access central part of fill area), on porch of vacant home. Full view of surf to north and south.
65
Home to rip-rap distance approx 10 ft. rip-rap to surf line approx. 30 ft. Some noisy traffic on S. Pacific St.
SO-C. West end of Cassidy St.(south part of fill area), on stairs at distance and elevation of second floor of adjacent homes. Full view of surf to north and south.
66
Brief measurements interrupted by noise from traffic and friendly pedestrians on stairs.
SO-D. Homes on east side of S. Pacific St., elevated above beachfront homes on west side. Views of beach and surf between beachfront homes.
52-55
Estimated surf noise levels.
(1) Measurement intervals of 3-10 minutes, July 29, 1999 between 6:00 and 7:00 a.m.
North Carlsbad Sensitive Receptors The proposed receiver site would extend from north of Ocean Street, on the north, to just south of Pine Street. Sensitive noise receptors include single and multi-family residences that are adjacent to the beach. Some of these homes have rip-rap protection, others do not. The east sides of these homes face Ocean Street. The Army and Navy Academy, a preparatory school, is also adjacent to the beach, south of Pacific Street. Noise Levels

3.13 Noise
Page 3.13-8 Regional Beach Sand Project EIR/EA 99-69\SECT-03.13.DOC 9/24/02
Table 3.13-4 shows the measured noise levels in the North Carlsbad receiver site area. From this data, it may be assumed that noise levels of 68-69 dBA at the beachfront homes during periods when there is little or no activity on the beach.
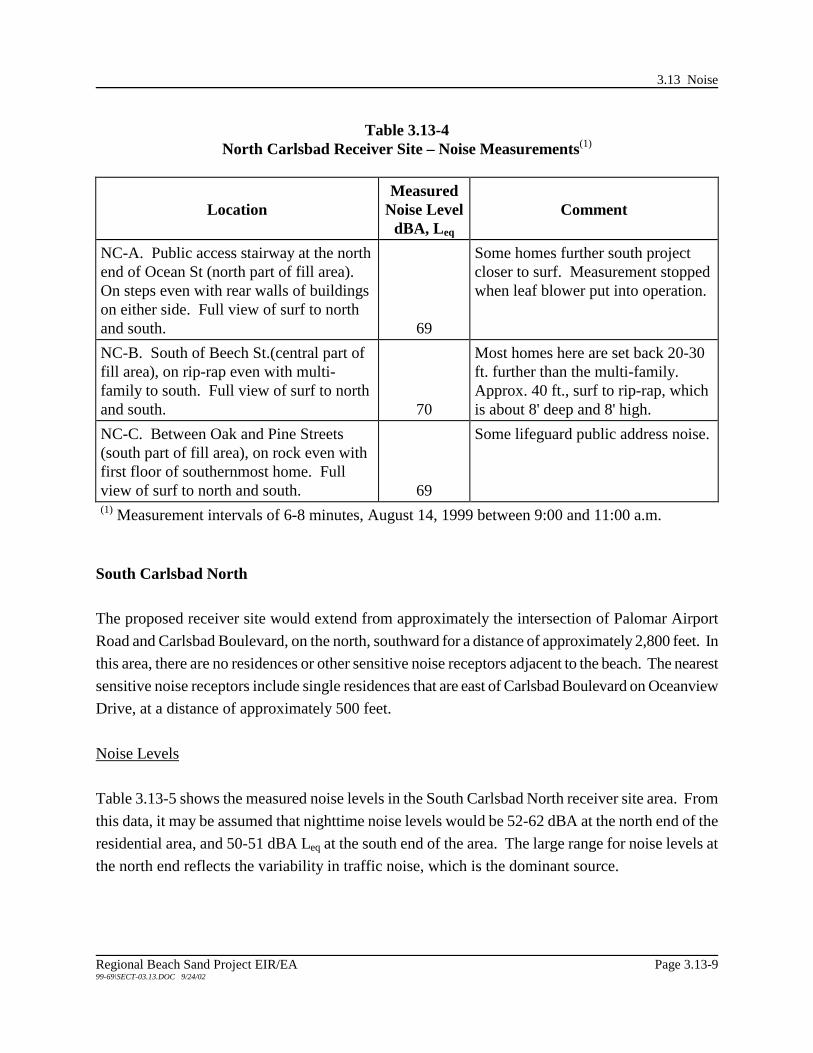
3.13 Noise
Regional Beach Sand Project EIR/EA Page 3.13-9 99-69\SECT-03.13.DOC 9/24/02
Table 3.13-4 North Carlsbad Receiver Site – Noise Measurements(1)
Location
Measured
Noise LeveldBA, Leq
Comment
NC-A. Public access stairway at the north end of Ocean St (north part of fill area). On steps even with rear walls of buildings on either side. Full view of surf to north and south.
69
Some homes further south project closer to surf. Measurement stopped when leaf blower put into operation.
NC-B. South of Beech St.(central part of fill area), on rip-rap even with multi-family to south. Full view of surf to north and south.
70
Most homes here are set back 20-30 ft. further than the multi-family. Approx. 40 ft., surf to rip-rap, which is about 8' deep and 8' high.
NC-C. Between Oak and Pine Streets (south part of fill area), on rock even with first floor of southernmost home. Full view of surf to north and south.
69
Some lifeguard public address noise.
(1) Measurement intervals of 6-8 minutes, August 14, 1999 between 9:00 and 11:00 a.m.
South Carlsbad North The proposed receiver site would extend from approximately the intersection of Palomar Airport Road and Carlsbad Boulevard, on the north, southward for a distance of approximately 2,800 feet. In this area, there are no residences or other sensitive noise receptors adjacent to the beach. The nearest sensitive noise receptors include single residences that are east of Carlsbad Boulevard on Oceanview Drive, at a distance of approximately 500 feet. Noise Levels Table 3.13-5 shows the measured noise levels in the South Carlsbad North receiver site area. From this data, it may be assumed that nighttime noise levels would be 52-62 dBA at the north end of the residential area, and 50-51 dBA Leq at the south end of the area. The large range for noise levels at the north end reflects the variability in traffic noise, which is the dominant source.

3.13 Noise
Page 3.13-10 Regional Beach Sand Project EIR/EA 99-69\SECT-03.13.DOC 9/24/02
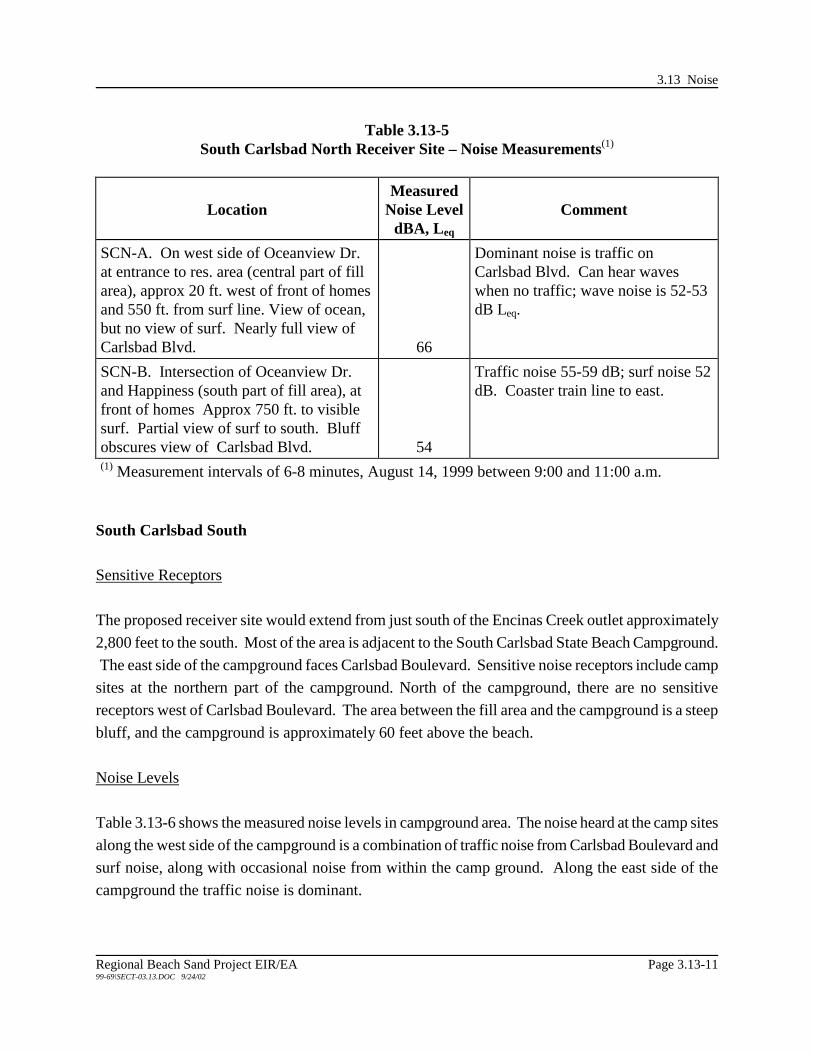
3.13 Noise
Regional Beach Sand Project EIR/EA Page 3.13-11 99-69\SECT-03.13.DOC 9/24/02
Table 3.13-5 South Carlsbad North Receiver Site – Noise Measurements(1)
Location
Measured
Noise LeveldBA, Leq
Comment
SCN-A. On west side of Oceanview Dr. at entrance to res. area (central part of fill area), approx 20 ft. west of front of homes and 550 ft. from surf line. View of ocean, but no view of surf. Nearly full view of Carlsbad Blvd.
66
Dominant noise is traffic on Carlsbad Blvd. Can hear waves when no traffic; wave noise is 52-53 dB Leq.
SCN-B. Intersection of Oceanview Dr. and Happiness (south part of fill area), at front of homes Approx 750 ft. to visible surf. Partial view of surf to south. Bluff obscures view of Carlsbad Blvd.
54
Traffic noise 55-59 dB; surf noise 52 dB. Coaster train line to east.
(1) Measurement intervals of 6-8 minutes, August 14, 1999 between 9:00 and 11:00 a.m.
South Carlsbad South Sensitive Receptors The proposed receiver site would extend from just south of the Encinas Creek outlet approximately 2,800 feet to the south. Most of the area is adjacent to the South Carlsbad State Beach Campground. The east side of the campground faces Carlsbad Boulevard. Sensitive noise receptors include camp sites at the northern part of the campground. North of the campground, there are no sensitive receptors west of Carlsbad Boulevard. The area between the fill area and the campground is a steep bluff, and the campground is approximately 60 feet above the beach. Noise Levels Table 3.13-6 shows the measured noise levels in campground area. The noise heard at the camp sites along the west side of the campground is a combination of traffic noise from Carlsbad Boulevard and surf noise, along with occasional noise from within the camp ground. Along the east side of the campground the traffic noise is dominant.
3.13 Noise
Page 3.13-12 Regional Beach Sand Project EIR/EA 99-69\SECT-03.13.DOC 9/24/02
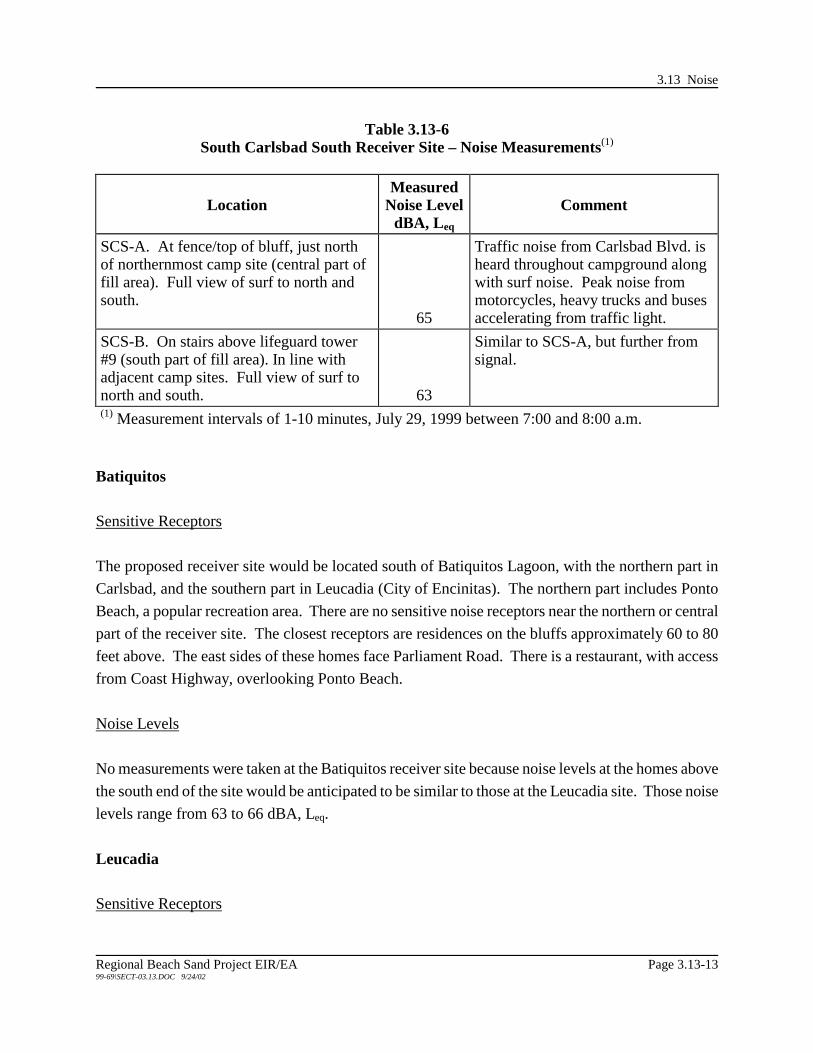
3.13 Noise
Regional Beach Sand Project EIR/EA Page 3.13-13 99-69\SECT-03.13.DOC 9/24/02
Table 3.13-6 South Carlsbad South Receiver Site – Noise Measurements(1)
Location
Measured
Noise LeveldBA, Leq
Comment
SCS-A. At fence/top of bluff, just north of northernmost camp site (central part of fill area). Full view of surf to north and south.
65
Traffic noise from Carlsbad Blvd. is heard throughout campground along with surf noise. Peak noise from motorcycles, heavy trucks and buses accelerating from traffic light.
SCS-B. On stairs above lifeguard tower #9 (south part of fill area). In line with adjacent camp sites. Full view of surf to north and south.
63
Similar to SCS-A, but further from signal.
(1) Measurement intervals of 1-10 minutes, July 29, 1999 between 7:00 and 8:00 a.m.
Batiquitos Sensitive Receptors The proposed receiver site would be located south of Batiquitos Lagoon, with the northern part in Carlsbad, and the southern part in Leucadia (City of Encinitas). The northern part includes Ponto Beach, a popular recreation area. There are no sensitive noise receptors near the northern or central part of the receiver site. The closest receptors are residences on the bluffs approximately 60 to 80 feet above. The east sides of these homes face Parliament Road. There is a restaurant, with access from Coast Highway, overlooking Ponto Beach. Noise Levels No measurements were taken at the Batiquitos receiver site because noise levels at the homes above the south end of the site would be anticipated to be similar to those at the Leucadia site. Those noise levels range from 63 to 66 dBA, Leq.
Leucadia Sensitive Receptors

3.13 Noise
Page 3.13-14 Regional Beach Sand Project EIR/EA 99-69\SECT-03.13.DOC 9/24/02
The proposed receiver site would be located approximately 0.5 miles south of the Batiquitos receiver site, between Grandview Street and Jasper Street in Leucadia (City of Encinitas). Sensitive receptors include homes on the bluffs approximately 60 to 80 feet above the beach. The east sides of these homes face Neptune Avenue. Noise Levels Table 3.13-7 shows the measured noise levels near the homes above the beach. Noise levels were measured at nighttime without other noise sources, and the noise levels of 65-66 dBA Leq may be considered typical for nighttime ambient noise at these bluff residences.
Table 3.13-7 Leucadia Receiver Site – Noise Measurements(1)
Location
Measured
Noise LeveldBA, Leq
Comment
LEU-A. On Grandview beach access stairs, 20-30' west of homes on bluff to south (north end of fill area). Full view of surf to north and south.
66
High tide. Range 64-69 dBA; highs at crashing waves. Noise from youths playing on beach below.
LEU-B. At northwest corner of Beacon’s Beach parking lot (south central part of fill area). Even with porch of 1st house to the north; windows of the 2nd. Approx 100 degree exposure.
63
Range 58-66 dBA. Noise less than positions A and C because of less exposure.
LEU-C. On Beacon’s Beach access stairs, even with homes on bluff to south (south central part of fill area). Full view of surf to north and south.
65
Range 60-69 dBA.
(1) Measurement intervals of 3-5 minutes, August 22, 1999 between 8:00 and 9:00 p.m.
Moonlight Beach Sensitive Receptors

3.13 Noise
Regional Beach Sand Project EIR/EA Page 3.13-15 99-69\SECT-03.13.DOC 9/24/02
The proposed receiver site would extend from A Street to D Street in the city of Encinitas. The Moonlight Beach recreation area and parking lot are east of the central part of the site. Sensitive noise receptors include single and multi-family residences that are adjacent to the beach at the north end. The east sides of these homes face 5th Street. The southernmost house is nominally at beach level, with a porch adjacent to the receiver site. There is rip-rap protection approximately 10 feet high and 8 feet deep at these houses. At the south end of the fill area, there is a day use park on a bluff approximately 20 feet above the beach, and residences to the east of the park, on the east side of Moonlight Lane. Noise Levels Table 3.13-8 shows the measured noise levels near the receptors north and south of the beach. Noise levels were measured in early morning without other noise sources. Nighttime noise levels at the homes close to the beach are estimated at 67-68 dBA.
Table 3.13-8 Moonlight Beach Receiver Site – Noise Measurements(1)
Location
Measured
Noise LeveldBA, Leq
Comment
MOO-A. West end of beach opposite the foot of A Street (north end of fill area). Top of berm. 20' south of first house. 90 degree view of surf to south. View to north blocked by house.
65
Range 62-67 dBA. Would be louder with a full exposure.
MOO-B. Moonlight overlook on bluff (south end of fill area). Nearly full exposure.
65
Range 62-68 dBA.
MOO-C. East side of Moonlight Lane, at residential building; east of MOO-B
54
Bluff shields noise from surf below.
MOO-D. On D Street stairs, even with home on bluff to north (south of fill area). Approx. 40 feet above beach. Full view of surf to north and south.
66
Range 64-68 dBA.
(1) Measurement intervals of 6-12 minutes, August 5, 1999 between 6:00 and 7:30 a.m.

3.13 Noise
Page 3.13-16 Regional Beach Sand Project EIR/EA 99-69\SECT-03.13.DOC 9/24/02
Cardiff Sensitive Receptors The proposed receiver site would be parallel to Coast Highway and the San Elijo Lagoon. Three restaurants are built adjacent to the beach just north of the receiver site. The east side (front) of the restaurants faces Coast Highway. Two restaurants have outdoor dining areas facing the ocean. The rear of the restaurants are 10 to 15 feet above the beach and are protected somewhat by heavy rock riprap. The nearest residential receptors are east of Coast Highway and the railroad, more than 1,000 feet from a visible part of the site.

3.13 Noise
Regional Beach Sand Project EIR/EA Page 3.13-17 99-69\SECT-03.13.DOC 9/24/02
Noise Levels Table 3.13-9 shows the measured noise levels at the rear of one of the restaurants. Noise levels were measured in late morning, and would be typical during restaurant use hours for surf and highway noise.
Table 3.13-9 Cardiff Receiver Site – Noise Measurements(1)
Location
Measured
Noise Level
dBA, Leq
Comment
CAR-A. West end of parking lot on south side of the Chart House (center of fill area). Top of riprap. Full view of surf.
68
Includes highway noise and voices of restaurant staff; restaurant not open.
CAR-B. Just inside outdoor dining area. Barrier (transparent on upper part) between tables and ocean, but open on the bottom. Building and end panel provide some shielding from highway noise. Nearly full exposure.
64
CAR-C. One table north of CAR-B
64
(1) Measurement intervals of approx. 5 minutes, September 27, 1999 between 10:00 and 10:30 a.m.
Solana Beach Sensitive Receptors The proposed receiver site would extend south from west end of Plaza Street (the western extension of Loma Santa Fe Drive) to a point approximately 900 feet south of Dahlia Drive. Sensitive receptors include single- and multi-family residences on the bluffs approximately 60 feet above the beach. The east sides of these buildings face Helix Avenue and South Sierra Avenue.
3.13 Noise
Page 3.13-18 Regional Beach Sand Project EIR/EA 99-69\SECT-03.13.DOC 9/24/02
No measurements were taken at the Solana Beach receiver site because of lack of access; however, noise levels at the homes on the bluffs above the beach would be similar to those at the Leucadia site which range from 63 to 66 dBA Leq.

3.13 Noise
Regional Beach Sand Project EIR/EA Page 3.13-19 99-69\SECT-03.13.DOC 9/24/02
Del Mar Sensitive Receptors The proposed receiver site is bounded on the east by a short concrete sea wall. The fill area would extend from north of 27th Street (south of the San Dieguito River mouth) to south of 17th Street, near Powerhouse Park. Sensitive noise receptors include single and multi-family residences that are immediately east of the sea wall from the north end of the site to just north of 17th Street. The rear of the homes are typically two to four feet above the level of the beach. The beach is relatively deep, on the order of 200 feet from sea wall to surf line. The east sides of the homes face Ocean Front Street. At 17th Street, there are motels and restaurants. Powerhouse Park, a popular recreation area, is south of 17th Street. During July and August, there are concerts at Powerhouse Park on alternate Tuesday evenings. The railroad track is adjacent to the southeast side of Powerhouse Park. Noise Levels Table 3.13-10 shows the measured noise levels in the Del Mar receiver site area. From this data, it may be assumed that noise levels of 59-61 dBA would be typical at the homes and other sensitive receptors adjacent to the sea wall during periods when there is little or no activity on the beach. Noise levels would be greater during periods of greater activity on the beach, principally from voices. Near the southern end of the site, additional noise would come from trains on the railroad tracks east of Powerhouse Park, and from recreational activities in the park.
Torrey Pines Sensitive Receptors The proposed receiver site is located south of the mouth of Peñasquitos Creek, in the area where North Torrey Pines Road transitions from being adjacent to the beach to an inland route. The area is part of the Torrey Pines State Reserve. The nearest residential receptors are approximately 2,000 feet northeast of the receiver site, and are separated from the receiver site by North Torrey Pines Road, the railroad, and Carmel Valley Road.

3.13 Noise
Page 3.13-20 Regional Beach Sand Project EIR/EA 99-69\SECT-03.13.DOC 9/24/02
Table 3.13-10 Del Mar Receiver Site – Noise Measurements(1)
Location
Measured
Noise LeveldBA, Leq
Comment
DM-A. West end of 29th Street (north of fill area), at sea wall, at same distance from surf line as adjacent homes. Full view of surf to north and south.
61
No other notable noise sources. Some fishing and running activities on beach, with no noise measurable above the surf background.
DM-B. West end of 18th Street (south part of fill area), at sea wall, at same distance from surf line as adjacent homes. Full view of surf to north and south.
59
No other notable noise sources. Some fishing and running activities on beach, with no noise measurable above the surf background.
(1) Measurement intervals of 10-17 minutes, July 26, 1999 between 6:00 and 6:30 a.m. Noise Levels No noise levels were measured at this receiver site. There are no adjacent receptors so noise measurements at this location would not be reflective of any experienced noise levels.
Mission Beach Sensitive Receptors The proposed receiver site is bounded on the east by a short concrete sea wall. The site would extend from north of Ostend Court, on the north, to Santa Barbara Place, on the south. East of the sea wall is Ocean Front Walk (also called The Boardwalk), a concrete walk approximately eight feet wide, that is used extensively by pedestrians, at various speeds. Sensitive noise receptors include single and multi-family residences that are east of the sea wall, with setbacks on the order of 10 to 25 feet. Sensitive receptors also include the people who use Ocean Front Walk. Noise Levels Table 3.13-11 shows the measured noise levels in the Mission Beach receiver site area. From this data, it may be assumed that noise levels of 65 dBA would be typical at Ocean Front Walk, and 63 to 64 dBA at the homes east of Ocean Front Walk during periods when there is little or no activity on

3.13 Noise
Regional Beach Sand Project EIR/EA Page 3.13-21 99-69\SECT-03.13.DOC 9/24/02
the beach. Noise levels would be greater during periods of greater activity on the beach, principally from voices.
Table 3.13-11 Mission Beach Receiver Site – Noise Measurements(1)
Location
Measured
Noise Level
dBA, Leq
Comment
MB-A. West end of Nahant Court (north central part of fill area), at sea wall. Full view of surf to north and south.
66
Machinery working beach 700-900 feet to the north; backup alarms spike meter to 68. One commercial airplane flyover at 70.
MB-B. West end of Ormond Court (north of fill area), at sea wall. Full view of surf to north and south.
Not
applicable
Purpose of measurement was to sample equipment noise during beach sand maintenance operations. Case 621 Wheel Loader with rakes and Case 621B with bucket. Working noise levels 68-71 dB at 75-100 feet from sea wall. Surf noise only, est. at 61-65 dB.
MC-C. West end of Kennebeck Court at Sea Wall (south central part of fill area). Full view of surf to north and south.
65
Most of period included drone of boat engine approx. 1/4 mile offshore.
(1) Measurement intervals of 10-17 minutes, July 27, 1999 between 7:00 and 8:00 a.m.
Imperial Beach Sensitive Receptors The proposed receiver site is bounded on the east mostly by a rip-rap slope on the order of 10 feet deep. The fill area would extend from north of Imperial Beach Boulevard to approximately 1,000 feet south of Encanto Avenue, on the south. Sensitive noise receptors include single and multi-family residences that are east of the beach and rip-rap slope, with setbacks on the order of 5 to 10 feet. The Naval Auxiliary Landing Field, Imperial Beach, is located 3/4 mile east of the southern portion of the fill site.

3.13 Noise
Page 3.13-22 Regional Beach Sand Project EIR/EA 99-69\SECT-03.13.DOC 9/24/02
Noise Levels Table 3.13-12 shows the measured noise levels in the Imperial Beach receiver site area. From this data, it may be assumed that noise levels of 65-67 dBA would be typical at the homes closest to the beach during periods when there is little or no activity on the beach. Noise levels may be at the higher end of the range at the northen and southern portions of the site than at the central portion because the surf line is closer to the homes. Homes south of Descanso Avenue are subject to helicopter noise from Naval Auxiliary Landing Field, Imperial Beach.

3.13 Noise
Regional Beach Sand Project EIR/EA Page 3.13-23 99-69\SECT-03.13.DOC 9/24/02
Table 3.13-12 Imperial Beach Receiver Site – Noise Measurements(1)
Location
Measured
Noise Level
dBA, Leq
Comment
IB-A. West end of Cortez Ave. (central part of fill area), on rip-rap. Full view of surf to north and south.
72
Some noise from refuse truck and auto horns on Seacoast Drive.
IB-B. Same location as IB-A, but at rear wall of residence.
67
IB-C. West end of Elkwood Ave. (north of fill area), even with rear windows of residences on either side. Level here, with no rip-rap. Full view of surf to north and south.
Purpose of measurement was to sample equipment noise during beach sand maintenance operations. Case 621B Wheel Loader with bucket. Working noise levels 68-72 dBA at 50-100 feet measurement point, with machine working perpendicular to surf line. Background surf noise estimated at 67 dBA. A pass parallel to surf at 100 feet from SLM was 72 dBA.
IB-D. Near location IB-C 67
No beach equipment operating. Supports background estimate.
IB-E. West end of Imperial Beach Blvd, even with rear walls of adjacent residences. Ful view of surf.
65
IB-F. West end of empty lot between Descanso and Encanto Aves. Behind rip-rap, and even with windows of residence to the south.
63
One helicopter flyover at 67 dBA.
IB-G. West end of Encanto Ave., even with rear walls of adjacent homes. Full view of surf.
63
Includes noise from helicopters and motorcycle.
(1) Measurement intervals of 3-10 minutes, July 27, 1999 between 10:00 a.m. and 12:00 noon.

3.13 Noise
Page 3.13-24 Regional Beach Sand Project EIR/EA 99-69\SECT-03.13.DOC 9/24/02
This page intentionally left blank.

Table 3.13-2 Summary of Applicable Construction Noise Standards
Receiver Site
Jurisdicti
on
Construction Hours Prohibited
Construction Noise Limits
South Oceanside
City of Oceanside
6:00 p.m.-7:00 a.m. weekdays; weekends; Federal holidaysO1
North Carlsbad
Carlsbad
After sunset any day; before 7:00 a.m. weekdays; before 8:00 a.m. Saturday; Sundays; seven holidays
75dBA Leq
S. Carlsbad N. S .Carlsbad S. Batiquitos Leucadia Moonlight Cardiff
California State Parks
None
None
Solana Beach
Solana Beach
7:00 p.m.-7:00 a.m. weekdays; 7:00 p.m.-8:00 a.m. Saturday; Sundays; nine holidaysSB1
75 dBA Leq(8) at residential properties
Del Mar
Del Mar
7:00 p.m.-7:00 a.m. weekdays; 7:00 p.m.-9:00 a.m. Saturday; Sundays; City holidaysDM1
75 dBA Leq at residential properties
Torrey Pines
California State Parks
The Torrey Pines conveyance plan includes use of Del Mar’s beach for pipeline conveyance of sand and a booster pump would be necessary. The use of the City of Del Mar’s beach for this purpose may necessitate conformance with the City of Del Mar noise ordinance even though the Torrey Pines receiver site is within State Park’s jurisdiction.
Mission Beach
San Diego
7:00 p.m.-7:00 a.m. Monday-Saturday; Sundays; City holidays except Columbus Day and Washington’s BirthdaySD1
75 dBA Leq(12) at residential properties
Imperial Beach
Imperial Beach
10:00 p.m.-7:00 a.m.IB1
75 dBA
O1 - Applies to grading; Grading Ordinance Section 515. City Engineer may permit operations during specific hours if not
detrimental to health, safety or welfare of residents. SB1 - Municipal Code Section 7.34, Noise Abatement And Control, Section 7.34.100. Variance procedures in Section 7.34.240-

400 DM1 - Municipal Code Section 9.20.050. Exemption provisions for emergency work or government preempted activities. SD1 - Municipal Code Section 59.5.0404; the Section also allows exception by permit of the Noise Abatement and Control
Administrator. IB1 - Municipal Code Section 9.32.020H. Section 9.32.060 allows exemption by permit of the City Manager.
4.0 Environmental Consequences
Regional Beach Sand Project EIR/EA Page 4.1-199-69\SANDAG EIREA 4.1 to 4.13.wpd 7/17/00
CHAPTER 4.0ENVIRONMENTAL CONSEQUENCES
According to federal and state regulations, a finding of whether a proposed action significantly affects the
quality of the human environment is determined by considering the context in which it will occur and the
intensity of the action (40 C.F.R. § 1508.27; CEQA Guidelines § 15126.2[a]). Consistent with these
regulations and guidelines, the impact analyses contained in this chapter follow a step-by-step format where
each potential impact within an issue area is addressed separately. For each impact, there is a separate
subsection on significance thresholds and criteria. The significance threshold is a set of criteria used to
judge whether a given consequence of a specific project alternative is significant. The impact analysis
presentation is organized by alternative. Following the analysis, the level of significance is identified. An
impact is deemed to be either not significant, adverse but not significant, or significant. In the latter
category, impacts may be mitigable (i.e., measures are available to reduce the impact to below a level of
significance), or unmitigable (i.e., the impact cannot be reduced to below a level of significance by mitigation
measures, although mitigation may be proposed to lessen the intensity of the impact). For this project,
several measures have been incorporated into project design as described in Sections 2.4 and 2.5.
As described in Chapter 2.0 (Description of the Proposed Action and Alternatives), the following three
alternatives are considered in detail in this section:
• Alternative 1: Replenishment of 12 receiver sites using approximately 2 million cy of dredged sediment
from six borrow sites. There would be two possible construction variations: (a) would occur on a 24-
hour, 7-day per week schedule and (b) would occur with restrictions on construction times and days
consistent with local noise ordinances, where applicable.
• Alternative 2: Replenishment of nine receiver sites using approximately 2 million cy of dredged
sediment from six borrow sites. There would be two possible construction variations: (a) would occur
on a 24-hour, 7-day per week schedule and (b) would occur with restrictions on construction times
and days consistent with local noise ordinances, where applicable.
• No Action Alternative: No beach replenishment or dredging activities would be implemented.
Detailed analyses of coastal geomorphology and biological resources are contained in technical appendices R
C and D, respectively (bound separately). The appendices reflect studies of various alternatives that are R

4.1 Geology and Soils
Page 4.1-2 Regional Beach Sand Project EIR/EA99-69\SANDAG EIREA 4.1 to 4.13.wpd 7/17/00
not analyzed in detail in this EIR/EA because they were rejected prior to the distribution of the EIR/EA but R
after some technical analyses were completed. To help the reader understand the relationship between R
alternatives in the EIR/EA and various technical appendices a matrix is provided below. R
Alternative Characteristics EIR/EA RAppendix C R
(Geomorphology) RAppendix D R
(Marine Biology) R
3 million cy at 13 sites RN/A RAlternative 1 R3 MCY Alternative R
2 million cy at 12 sites RAlternative 1 RAlternative 2 R2 MCY Alternative R
2 million cy at 11 sites RN/A RAlternative 3 R2 MCY Alternative Modified R
2 million cy at 9 sites RAlternative 2 RAlternative 4 RN/A (1) R
(1) Since this alternative was generated by combining sand quantities and configurations of some receiver sites Rwithin the 3 million cy alternative and some from the 2 million cy alternative which were analyzed in the marine Rbiology technical report, the combined analysis is provided only in the EIR/EA. R

4.1 Geology and Soils
Regional Beach Sand Project EIR/EA Page 4.1-399-69\SANDAG EIREA 4.1 to 4.13.wpd 7/17/00
4.1 GEOLOGY AND SOILS
The following analysis of coastal geology and littoral processes related to beach replenishment is based on
studies performed in Shoreline Morphology Study, San Diego Regional Beach Sand Project (Moffatt
& Nichol 2000a) and the previous EAs prepared by the U.S. Navy (Department of the Navy 1997a,
1997b).
4.1.1 Significance Criteria
The protection of unique geologic coastal features and the minimization of erosion are considered when
evaluating potential impacts of a proposed action. For this analysis, an impact to geologic resources would
be significant if it would:
• destroy, permanently cover, or modify any unique geologic or physical features;
• increase erosion of soils, either on or offsite; or
• cause erosion of beach sand.
Beach replenishment using dredged sediments is generally considered beneficial in areas where beach
erosion is a problem as material provides recreational beach area and shoreline protection, including
stabilizing fragile bluffs. However, placement of the sand can also create a temporary change in the
shoreline. Over a period of time, the sand would be moved and redistributed from the placement location
alongshore and cross-shore through natural littoral transport creating an equilibrium beach profile. The
equilibrium beach profile would have a similar shape as the pre-fill beach profiles, but may extend further
seaward. The longshore spread of the beach fill would temporarily widen the beaches upcoast and
downcoast of the receiver sites, until natural littoral transport redistributed the sand through the littoral cell.
4.1 Geology and Soils
Page 4.1-4 Regional Beach Sand Project EIR/EA99-69\SANDAG EIREA 4.1 to 4.13.wpd 7/17/00
4.1.2 Alternative 1
Impacts of Alternative 1a
Receiver Sites
For all receiver sites, sediment deposited on the beach would be spread alongshore and cross-shore
through natural littoral transport. Shoreline positions were modeled based on the anticipated sediment
movement and were predicted for periods of 1, 2, 3, 4, and 5 years after sand placement.
Borrow materials would be similar to the receiving beach because the fill material has been the subject of
grain-size analyses and was found to be compatible with the receiver sites’ existing sediments (Sea
Surveyor 1999). Temporary changes in the functional properties (e.g., permeability) of the existing beach
are expected until the replenishment material is mixed with existing sand and dispersed by coastal
processes, and no long-term impact would occur in terms of grain-size distribution.
For all receiver sites, seismic activity associated with the Rose Canyon fault and other nearby faults may
lead to liquefaction, ground failure, sand volcanoes, and seaward slumping of beach material. The impact
of beach replenishment would be of no greater significance than conditions expected in the absence of
additional sediment.
Coastal Geology
Similar coastal geology processes for each receiver site would occur regardless of the season the R
replenishment activity occurs. After placement of sand onto a receiver site, the existing beach area north R
and south of the receiver site would widen as a result of longshore and cross-shore spreading. The results
of the modeling indicating the length of time that the beach fill would return to its pre-fill condition are shown
in Table 4.1-1. Seasonal cross-shore movement would transport the fill material offshore in the winter and
back onto the beach in the summer, repeating this trend over subsequent seasons. Also, the longshore
transport changes direction seasonally, moving the sand north in the summer and south in the winter.
Seasonal loss of the beach would occur from natural littoral processes. Placing the material on the beach R
in spring instead of summer would increase the chance that more material would be available on the shore R
during the peak recreation period. Placing it in late summer/fall increases the opportunity for winter storms R
to remove the material prior to heavy summer usage the following year. R
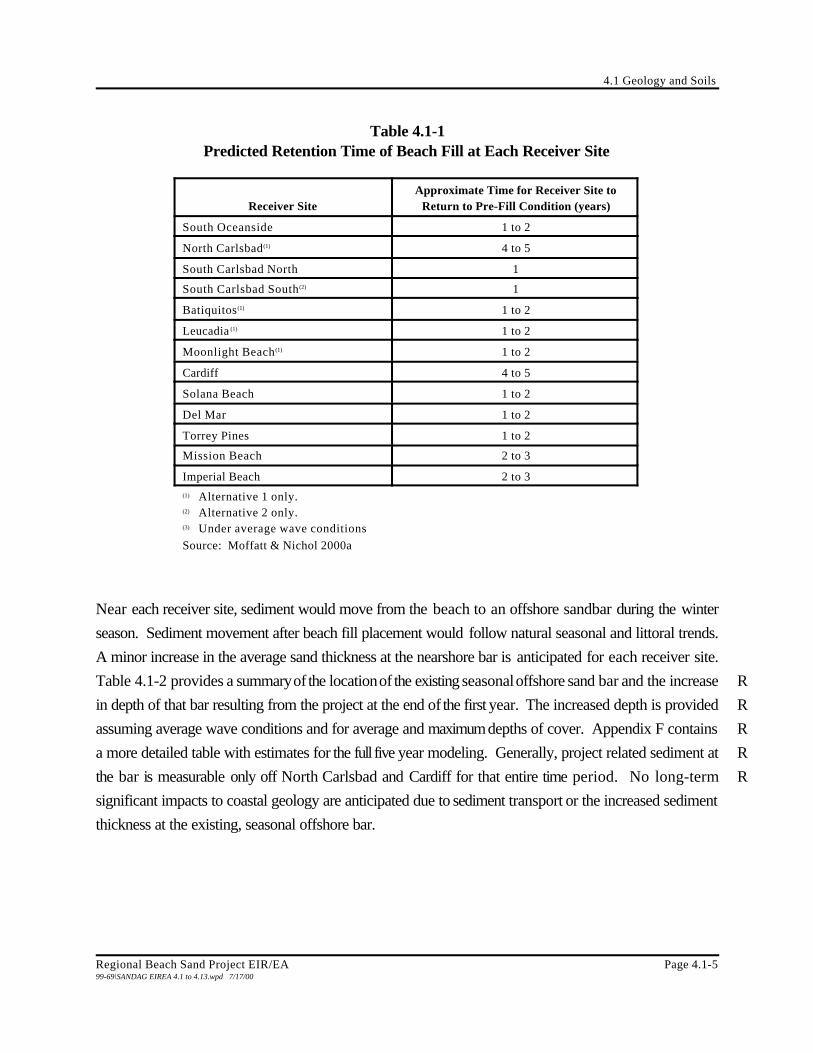
4.1 Geology and Soils
Regional Beach Sand Project EIR/EA Page 4.1-599-69\SANDAG EIREA 4.1 to 4.13.wpd 7/17/00
Table 4.1-1Predicted Retention Time of Beach Fill at Each Receiver Site
Receiver SiteApproximate Time for Receiver Site to
Return to Pre-Fill Condition (years)
South Oceanside 1 to 2
North Carlsbad(1) 4 to 5
South Carlsbad North 1
South Carlsbad South (2) 1
Batiquitos(1) 1 to 2
Leucadia (1) 1 to 2
Moonlight Beach (1) 1 to 2
Cardiff 4 to 5
Solana Beach 1 to 2
Del Mar 1 to 2
Torrey Pines 1 to 2
Mission Beach 2 to 3
Imperial Beach 2 to 3(1) Alternative 1 only.(2) Alternative 2 only.(3) Under average wave conditionsSource: Moffatt & Nichol 2000a
Near each receiver site, sediment would move from the beach to an offshore sandbar during the winter
season. Sediment movement after beach fill placement would follow natural seasonal and littoral trends.
A minor increase in the average sand thickness at the nearshore bar is anticipated for each receiver site.
Table 4.1-2 provides a summary of the location of the existing seasonal offshore sand bar and the increase R
in depth of that bar resulting from the project at the end of the first year. The increased depth is provided R
assuming average wave conditions and for average and maximum depths of cover. Appendix F contains R
a more detailed table with estimates for the full five year modeling. Generally, project related sediment at R
the bar is measurable only off North Carlsbad and Cardiff for that entire time period. No long-term R
significant impacts to coastal geology are anticipated due to sediment transport or the increased sediment
thickness at the existing, seasonal offshore bar.

4.1 Geology and Soils
Page 4.1-6 Regional Beach Sand Project EIR/EA99-69\SANDAG EIREA 4.1 to 4.13.wpd 7/17/00
Table 4.1-2 REstimated Location of Offshore Sand Bar and Project-Related Increase in Sand Bar Depth R
Receiver Site
Feet Above Average Historical Bar(1)
Offshore BarRange (feet from
back of beach)
Alternative 1 Alternative 2
Average Maximum Average Maximum
South Oceanside 600 to 1,750 0.3 0.6 0.3 0.6
North Carlsbad 350 to 1,700 0.7 1.4 0.7 1.4
South Carlsbad(North and South)
500 to 1,700 0.1 0.2 0.4 0.8
Batiquitos 400 to 2,000 0.4 0.9 0.6 1.3
Moonlight Beach 600 to 1,800 0.4 0.8 Not measurable Not measurable
Cardiff 700 to 1,800 0.1 0.3 Not measurable Not measurable
Solana Beach 500 to 1,800 Not measurable Notmeasurable
Not measurable Not measurable
Del Mar 700 to 1,450 0.5 0.9 0.5 0.9
Torrey Pines 500 to 1,500 0.4 0.8 0.4 0.8(1) At end of year 1, assuming average wave conditionsNote: Values are not included for Leucadia because historic profiles do not exist to calculate the sandbar. Values Rare not provided for Mission and Imperial beaches because numerical modeling was not performed due to Rsimplified coastline conditions and lack of sensitive resources. R
Littoral Processes
For each receiver site situated within the South Oceanside Littoral Cell (i.e, South Oceanside to Torrey
Pines) sediment placed onshore would be distributed along the coast by the net littoral sand transport to
the south at approximately 100,000 to 250,000 cy per year. This downcoast net transport movement is
the difference between upcoast and downcoast sand transport rates, which are predominantly driven by
the angle of wave approach to shore.
South Oceanside. Alternative 1 involves placing approximately 380,000 cy of dredged sediment at the
South Oceanside receiver site. Previous placement of fills on the beaches in Oceanside have not shown
dramatic changes in the littoral process. Since 1955, over 13 million cy of fill have been placed onshore
or nearshore in Oceanside by the USACOE and the City with no adverse geologic or soils impacts
recorded. These past beach fills quantities have been in the same range as the proposed fill. Therefore,
based on past fill events, placement of sediment onshore at the South Oceanside receiver site would not
be anticipated to impact the littoral transport process.
4.1 Geology and Soils
Regional Beach Sand Project EIR/EA Page 4.1-799-69\SANDAG EIREA 4.1 to 4.13.wpd 7/17/00
North Carlsbad. Alternative 1 would involve placing approximately 240,000 cy of dredged sediment at
the proposed North Carlsbad receiver site. Previous placement of fills on beaches in Carlsbad have not
shown dramatic changes in the littoral process. Over 12 million cy of fill has been placed onshore in
Carlsbad as a result of maintenance dredging of Agua Hedionda Lagoon and enhancement of Batiquitos
Lagoon. No adverse impacts to littoral transport have occurred. These past beach fills were in the same
range or less than the proposed fill quantity. Therefore, based on past fill events, placement of sediment
onshore at North Carlsbad would not change the littoral transport process.
Remaining Oceanside Littoral Cell Receiver Sites. No significant impacts would occur to the littoral
process. For the other receiver sites in the Oceanside Littoral Cell, (i.e, South Carlsbad North, Batiquitos,
Leucadia, Moonlight Beach, Cardiff, Solana Beach, Del Mar, and Torrey Pines). The existing offshore
sand berm would increase some amount after the first year, but that thickness would be less than a foot and
typically in the range of less than one-half foot. Only minor increases in thickness to the respective offshore
bars is anticipated. No significant impacts are anticipated. This alternative would also serve to temporarily
stabilize fragile bluffs near the South Carlsbad North, Batiquitos, Leucadia, Moonlight Beach, and Torrey
Pines receiver sites.
Mission Beach. Alternative 1 would involve placing approximately 100,000 cy of dredged sediment at
the Mission Beach receiver site. The length of the coast affected by the beach fill increases each year. The
initial beach fill length is approximately 1,590 feet. At post-project equilibrium, the length of beach
widening increases to 15,000 feet, and at the end of the first year, the length of coast affected increases to
20,000 feet based on an analytical modeling method. The fill remains perceptive along approximately
20,000 feet through the fifth year. Approximately 16 percent of the post-construction beach width at the
project’s centerline remains after five years (Moffatt & Nichol 2000a). No significant impacts are
anticipated due to the replenishment action proposed under Alternative 1.
The net longshore sediment transport rate at Mission Beach is predominantly to the south. The beach fill
will likely spread in both directions, but primarily to the south toward Mission Jetty. A sand berm would
be expected to form in the shallow subtidal areas as a result of sediment transported into these zones, but
no significant increases are expected as a result of implementation of Alternative 1.
Imperial Beach. Alternative 1 would place approximately 120,000 cy of dredged sediment at the Imperial
Beach receiver site. The length of the shoreline that is affected by the beach fill increases each year. The
4.1 Geology and Soils
Page 4.1-8 Regional Beach Sand Project EIR/EA99-69\SANDAG EIREA 4.1 to 4.13.wpd 7/17/00
initial beach fill length is approximately 2,310 feet, and at post-project equilibrium the length of beach
widening increases to 15,000 feet. At the end of the first year the length of coast affected increases to
20,000 feet based on an analytical modeling method and remains constant to the fifth year (Moffatt &
Nichol 2000a). No significant increases are expected as a result of implementing this alternative.
The net longshore sediment transport at this receiver site is to the north, away from the river inlet. This
effect is caused by wave refraction over the relic Tijuana River delta offshore and to the north of the river
and south of Imperial Beach, driving wave-induced currents northward at the project site (USACOE
1991). Based on wave refraction effects occurring at Imperial Beach and longshore transport estimates
provided by the USACOE (1991), the fill will likely disperse northward. A sand berm would be expected
to form in the shallow subtidal areas as a result of sediment transported into these zones, but no significant
increases are expected as a result of implementation of Alternative 1.
Borrow Sites
For all six offshore borrow sites, dredge site deepening would alter local bathymetry; however, the
proposed dredging action has been determined to be in accordance with recommendations based on
geotechnical investigations of the proposed borrow sites and accepted engineering practice.
As described in Section 1.1, the proposed dredging activities would take sand from borrow sites outside
(deeper than) the depth of closure and place sand within the three littoral cells. New sand would be
introduced to the system. As such, the borrow sites would not intercept sand that typically rebuild beaches
in the summer. No significant geology and soils impacts are anticipated to occur to the dredge borrow sites
with implementation of Alternative 1.
Mitigation Measures for Alternative 1a
As no significant impacts have been identified, no mitigation measures would be necessary.
Impacts/Mitigation Measures for Alternative 1b
This alternative would not change the impact analysis described above for Alternative 1a. The only
differences under this alternative with respect to geology and soils is that less sand would be dredged and
4.1 Geology and Soils
Regional Beach Sand Project EIR/EA Page 4.1-999-69\SANDAG EIREA 4.1 to 4.13.wpd 7/17/00
placed on the receiver sites and the predicted years in Table 4.1-1 and thickness at the sandbars would
be less. Impacts would continue to be less than significant and no mitigation measures would be necessary.
4.1.3 Alternative 2
Impacts of Alternative 2a
Receiver Sites
Under this alternative, nine receiver sites would receive sand (refer to Table 2-1). At these receiver sites,
impacts would be similar for those described for Alternative 1. Table 4.1-1 shows time estimates for the
erosion of sand replenishment fills. Even though different amounts of sand are proposed for some receiver
sites under Alternative 2, the information given in the table for the receiver sites proposed under Alternative
2 is not expected to substantially differ. The increases in the offshore sand bars for the receiver sites where
more sand is proposed than under Alternative 1 (i.e., South Oceanside, South Carlsbad North, South
Carlsbad South, Torrey Pines, Mission Beach, and Imperial Beach) would be short-term and would not
cause significant geology and soils impacts. Accordingly, impacts would not be significant. The receiver
sites where no sand is proposed (i.e., North Carlsbad, Batiquitos, Leucadia, and Moonlight Beach) would
not benefit from wider beaches under Alternative 2. Additionally, the benefit of added shoreline protection
to fragile bluffs at the Batiquitos, Leucadia, and Moonlight Beach receiver sites would not be realized under
this alternative. Sand placement in spring would have the same benefits as described for Alternative 1. R
Borrow Sites
Similar impacts to geology and soils would occur under this alternative. The same borrow sites would be
used under this alternative but at different quantities. The proposed dredging activities would take sand
from borrow sites outside (deeper than) the depth of closure and place sand within the three littoral cells.
New sand would be introduced to the system. As such, the borrow sites would not intercept sand that
typically moves back and forth to the beach; they would not detract from normal littoral processes which
typically rebuild beaches in the summer. No significant geology and soils impacts are anticipated to occur
to the dredge borrow sites with implementation of Alternative 2.

4.1 Geology and Soils
Page 4.1-10 Regional Beach Sand Project EIR/EA99-69\SANDAG EIREA 4.1 to 4.13.wpd 7/17/00
Mitigation Measures for Alternative 2a
No significant impacts have been identified, and no mitigation measures are necessary for Alternative 2.
Impacts/Mitigation Measures for Alternative 2b
This alternative would not change the impact analysis described above for Alternative 2a. The only
differences under this alternative with respect to geology and soils is that less sand would be dredged and
placed on the receiver sites. Impacts would be less than significant and no mitigation measures would be
necessary.
4.1.4 No Action Alternative
Under the No Action Alternative, no fill would be dredged from the offshore borrow sites, and no sand
would be placed on the proposed receiver beaches. The receiver beaches would continue to erode
undeterred.

4.2 Coastal Wetlands
Regional Beach Sand Project EIR/EA Page 4.2-199-69\SANDAG EIREA 4.1 to 4.13.wpd 7/17/00
4.2 COASTAL WETLANDS
As noted in Sections 2.5 and 3.2, coastal lagoons in the northern part of the San Diego region vary from
having inlets that are always open, intermittently open, or closed to tidal flows. Inlet closures may vary
seasonally from days to several months depending upon lagoon. The main ramification of inlet closure is
a reduction in water quality, which in turn may degrade habitat quality and result in loss of populations. Inlet
closure also can also promote the development of nuisance species such as mosquitos. The degree of
change to habitats and populations is directly related to the duration of inlet closure. Ongoing maintenance
programs are implemented at most of the region’s local lagoons (refer to Table 2-7). Excess sediment is
dredged at some lagoons and at others the inlet is mechanically opened by bulldozer. The evaluation of
potential effects to coastal wetlands is summarized below from the biological resources technical report
(Appendix D) as well as previous Navy analysis (1997a, 1997b).
4.2.1 Impact Significance Criteria
Potential impacts to coastal wetlands would be significant if:
• substantial sediment accretion substantially increased the rate of closure above historical occurrences
at any lagoon, river, or creek mouth; or
• increased turbidity resulted in adverse affects to the water quality in the water body.
4.2.2 Alternative 1
This analysis focuses on the coastal lagoons and river mouths along the coast that would be located near
the potential receiver sites and is organized by water body, in geographic order from north to south.
Nearby receiver sites are identified as appropriate.
No direct impacts to coastal lagoons would occur from the project, which proposes to dredge sands from
offshore borrow sites and replenish beaches away from lagoon mouths. Any potential impacts would be
related to indirect sedimentation or turbidity. The season of construction, late summer or spring, would not R
change the conclusions in the analysis. R

4.2 Coastal Wetlands
Page 4.2-2 Regional Beach Sand Project EIR/EA99-69\SANDAG EIREA 4.1 to 4.13.wpd 7/17/00
Impacts of Alternative 1a
San Luis Rey River
No impacts to the San Luis Rey River are anticipated from the project. Sedimentation from the South
Oceanside beach fill would not be expected to reach the river, which is located over one mile to the north.
Similarly, turbidity plumes would not be expected to travel that far north of the site.
Loma Alta Creek
The Loma Alta Creek is a seasonal freshwater creek that discharges into the ocean near the south end of
the proposed South Oceanside receiver site. The City of Oceanside constructs a sand berm in front of the
creek to prevent flow between Memorial Day and Labor Day, and during the wet season excavates a
temporary channel to facilitate stream flows to the ocean for flood control. Short-term (less than five years)
beach widening on the order of 50 to 100 feet is predicted in the vicinity of the creek (Appendix C). This
may require the winter discharge channel to be lengthened, but because the City currently maintains the
creek outlet on an as-needed basis, no significant impact to the creek habitat would occur. Turbidity
generated from receiver site construction would not be expected to impact the water quality of the creek.
Buena Vista Lagoon
Buena Vista Lagoon is closed to tidal influence by a man-made weir. The City of Oceanside maintains a
discharge outlet to the ocean for flood control. For similar reasons as Loma Alta Creek, no significant
impacts to water or habitat quality would occur.
Agua Hedionda Lagoon
The ocean inlet to Agua Hedionda Lagoon is located over 0.5 mile south of the proposed North Carlsbad
receiver site and over one mile north of the proposed South Carlsbad North receiver site. Turbidity plumes
from receiver site construction are anticipated to be localized, less than 100 to 1,400 feet downcurrent,
under typical current speeds, and would not extend very far into the lagoon even under maximum current
speeds. If project-related turbidity did enter the lagoon, particulate concentrations would be low given the
distance to the lagoon and rapid settling rate of the predominantly sandy material. There would be no
significant impacts to the lagoon due to turbidity.
4.2 Coastal Wetlands
Regional Beach Sand Project EIR/EA Page 4.2-399-69\SANDAG EIREA 4.1 to 4.13.wpd 7/17/00
Modeling predicts a potential worst-case increased sediment flow of approximately 62,500 cy from this
alternative over five years. Much of this material would be present in the first few years and taper off at
the end of five years. The lagoon inlet is continuously open as a result of jetties and routine maintenance
dredging. Sedimentation from littoral transport occurs within the lagoon under existing conditions,
therefore, the proposed project would incrementally increase the volume of sedimentation over that which
occurs naturally. Since maintenance dredge volumes historically have ranged from about 100,000 to
465,000 cy per year, the project’s anticipated volume would not be anticipated to increase the frequency
of planned maintenance activities. It may slightly increase the cost of the dredging effort. As described in
Section 2.5, a lagoon monitoring program would be implemented as part of this project. The monitoring
program is designed to mimic the on-going monitoring as required under the Navy’s USACOE permit.
SANDAG would provide for mitigation of any increased rates of sand accumulation determined to occur
as a result of the project above and beyond existing conditions, as determined by the USACOE and in
consultation with the resource agencies. Mitigation would consist of removing accumulated sediment
attributable to the replenishment project, by funding additional dredge activity during normal maintenance.
Previous monitoring in the lagoon indicates that fewer species and abundance of invertebrates occur in
areas that receive substantial sedimentation in comparison to less disturbed areas. The distribution of
eelgrass also is affected by sedimentation. Maintenance dredging routinely occurs in the outer basin where
benthic invertebrates within the maintenance dredge footprint recolonize rapidly. Maintenance dredging
occurs within set limits designed to avoid significant impacts to eelgrass. Impacts to lagoon fauna and
sensitive vegetated habitats as a result of sedimentation is not expected to be substantially different from
that which occurs in the lagoon under existing conditions. Therefore, project related impacts to lagoon
habitat quality would not be significant.
Batiquitos Lagoon
The ocean inlet at Batiquitos Lagoon remains open continuously due to jetties and maintenance dredging.
The ocean inlet is located about 1,000 feet north of the Batiquitos receiver site. No significant impact
would occur to water quality within the lagoon during construction given that turbidity plumes are
anticipated to be less than 100 to 500 feet downcurrent. Even under maximum current speeds they would
not extend far into the lagoon. If project related turbidity did enter the lagoon, particulate concentrations
would be low given the distance to the lagoon and rapid settling rate of the predominantly sandy material.

4.2 Coastal Wetlands
Page 4.2-4 Regional Beach Sand Project EIR/EA99-69\SANDAG EIREA 4.1 to 4.13.wpd 7/17/00
Sediment transport modeling results indicated no substantial beach widening at the lagoon entrance nor
substantial sedimentation offshore the inlet (Appendix C). Therefore, potential lagoon closure due to
sandbar formation would not be expected. However, the lagoon would experience sedimentation from the
project. The maximum predicted sediment increase over existing sediment patterns under this alternative
is 27,000 cy of sedimentation over five years, with over half that in the first year after construction. Project-
related sedimentation either would increase the volume dredged during the existing maintenance dredging
interval, or the dredging may have to be done more frequently. This impact is of most concern within the
first year after construction of the receiver site. As described for the Agua Hedionda Lagoon, the lagoon
monitoring program in Section 2.5 would be implemented to determine how much sand accumulation is
associated with the project and then mitigation would be provided as necessary.
Similar to the discussion for Agua Hedionda Lagoon, lagoon habitat quality is currently affected by
sedimentation and the necessary corrective action of maintenance dredging. Benthic organisms that inhabit
these shallow waters are quick to recolonize. No significant impacts would result from this action.
San Elijo Lagoon
The ocean inlet at San Elijo Lagoon is subject to frequent closure due to its relatively small tidal prism and
frequent blockage by cobbles. Mechanical excavations have resulted in periodic opening of the lagoon for
short durations spanning few to several months. The ocean inlet is located about 1,000 feet north of the
proposed Cardiff receiver site. As with the other lagoons, localized turbidity would not result in significant
impacts to lagoon water quality.
Sediment transport modeling results indicate beach widening at the lagoon entrance and offshore the inlet
(Appendix C). Therefore, there is the potential for the project to contribute to a more frequent closure of
the lagoon after mechanical opening. San Elijo Lagoon currently is mechanically opened three times a year.
It is possible, in the worst-case, that the project may necessitate one additional inlet opening in a year
(approximately 5,000 cy). As part of the project, SANDAG will implement a four-year monitoring
program to determine any increased rates of sedimentation to the lagoon and will provide mitigation for
mouth closures attributable the project (Section 2.5). This measure will ensure no significant impact from
the project on routine inlet maintenance activities.
4.2 Coastal Wetlands
Regional Beach Sand Project EIR/EA Page 4.2-599-69\SANDAG EIREA 4.1 to 4.13.wpd 7/17/00
San Dieguito Lagoon
San Dieguito Lagoon has an intermittently open inlet that is frequently subject to closure under existing
conditions. Historically, the inlet has been opened on an as-needed basis for flood control. Restoration
of the lagoon is planned for the fall of 2001 that includes maintaining an open tidal inlet.
The inlet is located about 1,500 feet north of the proposed Del Mar receiver site and over 2,000 ft south
of the proposed Solana Beach receiver site. No significant impact to water quality within the lagoon would
occur during receiver site construction given localized turbidity plumes.
Sediment transport modeling results predicted only short-term (about one year) substantial beach widening
near the lagoon entrance (Alternative C). However, under restored conditions, the project could result in
sedimentation within the lagoon. The maximum predicted project-related sediment increase rate for this
alternative is 12,500 cy over the four years post-restoration, with much of that in the first year. As part of
the project, SANDAG will implement a monitoring program to determine any increased rates of
sedimentation to the lagoon, or mouth closures, and will provide for mitigation of increased rates of
accumulation of sand or mouth closures attributable to the project (Section 2.5). This measure will ensure
no significant impact from the project on routine inlet maintenance.
Los Peñasquitos Lagoon
The ocean inlet at Los Peñasquitos Lagoon is mechanically opened each year (typically two to three times)
to sustain prolonged periods of tidal flushing. The ocean inlet is located about 750 feet north of the
proposed Torrey Pines receiver site. As with the other lagoons, no significant impact to water quality within
the lagoon would occur from localized turbidity plumes.
Sediment transport modeling results indicate only short-term beach widening and limited sedimentation
offshore the inlet. The lagoon could experience some sedimentation from the project, and it is possible,
in the worst-case, that the action may necessitate one additional inlet opening in a year (approximately
5,000 cy). The monitoring program described in Section 2.5 and above would be suitable to verify no
significant impacts.

4.2 Coastal Wetlands
Page 4.2-6 Regional Beach Sand Project EIR/EA99-69\SANDAG EIREA 4.1 to 4.13.wpd 7/17/00
Mission Bay
The proposed Mission Bay receiver site is almost one mile north of the entrance to Mission Bay. Turbidity
plumes would be very localized (approximately 80 feet) and even under maximum current conditions the
jetty would prevent significant impacts to the bay. Sediment transport from the receiver site is predicted
to migrate south toward the jetty at Mission Bay; however, the jetty is so long that sediment from this action
would not likely be transported into the bay. Some small, incremental quantity of sand may move through
the jetty and contribute to the existing shoals in the channel, but the project’s contribution would not be
measurable given other sand movement.
Tijuana Estuary
No significant impacts to water or habitat quality within the Tijuana Estuary are anticipated from the project.
The receiver site is more than one mile north of the inlet and turbidity plumes are calculated approximately
135 to 80 feet. Turbidity plumes would not be expected to enter the wetland, even under maximum current
speeds. Migration of sand towards the Tijuana River mouth would be unlikely given the net longshore
sediment transport rate being to the north. Therefore, no significant impacts to the estuary are anticipated
from project-related sedimentation.
Mitigation Measures for Alternative 1a
Turbidity would not significantly affect any coastal lagoons so no mitigation would be necessary. As
described in Section 2.5, a monitoring program would be implemented at several lagoons to verify whether
or not project-related sediment would result in increased rates of sand accumulation or mouth closures
attributable to the project. SANDAG has committed to fund the removal of sediment or inlet openings as
determined to be appropriate by the USACOE and in consultation with the resource agencies. No further
measures would be necessary.
Impacts/Mitigation Measures for Alternative 1b
Under this alternative, construction would occur over a longer time period, but less sand would be placed
most receiver sites. Potential effects at individual lagoons would not be any greater under this construction
variation. The monitoring program in Section 2.5 would be implemented to either verify no significant
impact or institute mitigation as necessary.

4.2 Coastal Wetlands
Regional Beach Sand Project EIR/EA Page 4.2-799-69\SANDAG EIREA 4.1 to 4.13.wpd 7/17/00
4.2.3 Alternative 2
Impacts of Alternative 2a
San Luis Rey River
Sediment from the beach fill at South Oceanside is predicted to migrate northward to the vicinity of the San
Luis Rey River mouth after sand placement and potentially widen the onshore beach at this location
approximately one year after sand placement. Because the existing berm that crosses most of the San Luis
Rey River mouth is already at a higher elevation than the predicted contribution from the proposed action,
the migrating sand would not be anticipated to impact the overall configuration of the river mouth.
Stormwater discharge from the river is constrained by flow through eight, 36-inch-diameter pipes that pass
under Pacific Street. The initial small increase in beach width at this location would be reduced over time
as the sand moves back along the shoreline in a southerly direction. The predicted temporary increase in
sediment at this location would not be anticipated to constrain river runoff, therefore, additional maintenance
is not required with implementation of the proposed project.
The City of Oceanside Streets Division is responsible for maintaining the Pacific Street stormwater outlet
on an as-needed basis for flood control. Therefore, no adverse impacts would be anticipated upon
implementation of the proposed action.
Loma Alta Creek/Buena Vista Lagoon
The impacts to these locations would be no worse than under Alternative 1. Impacts would be less than
significant.
Agua Hedionda Lagoon
Under this alternative, there would be no sand placement at the North Carlsbad receiver site but the South
Carlsbad sites (North and South) would receive over twice the volume as under Alternative 1. Given this
configuration, the sand placement would be about one mile from the lagoon mouth. Turbidity plumes would
be localized and there would be no significant impacts. Modeling predicts a potential worst-case increased
sediment flow of approximately 57,500 cy of sediment over five years, of which most would occur in the

4.2 Coastal Wetlands
Page 4.2-8 Regional Beach Sand Project EIR/EA99-69\SANDAG EIREA 4.1 to 4.13.wpd 7/17/00
first year. As described under Alternative 1, maintenance dredging has historically ranged from about
100,000 to 465,000 cy per year. The volume of sediment possibly entering the lagoon from the project
would not increase the number of times it would be dredged, but may increase the total amount to be
dredged. As described under Alternative 1, SANDAG has committed to a lagoon monitoring program
to determine the amount of sedimentation above natural conditions. Any project-related accumulated
sediment would be removed. Dredging of accumulated sediment, if necessary, would not result in any
significant impacts to lagoon habitat.
Batiquitos Lagoon
Under this alternative, three sites in Encinitas would not receive sand, but sites to the north of the lagoon
would receive more sand than under Alternative 1. It is estimated that possible sediment accumulation from
the project would be on the same order of magnitude as Alternative 1 (27,000 cy over five years), but
likely less. The model predicts well over one half of that volume in the first year after replenishment. As
with Agua Hedionda lagoon, the volume of sediment possibly entering the lagoon from the project may
increase the total amount to be dredged. As described under Alternative 1, SANDAG has committed to
a lagoon monitoring program based on the Navy’s on-going effort to determine the amount of sedimentation
above natural conditions. Any project-related accumulated sediment would be removed. Dredging of
accumulated sediment, if necessary, would not result in any significant impacts to lagoon habitat.
San Elijo Lagoon/San Dieguito Lagoon/Los Peñasquitos Lagoon
The volume of sand at receiver sites Cardiff, Solana Beach, and Del Mar would be the same as under
Alternative 1, but would be slightly greater for the Torrey Pines site. The predicted impacts to these three
lagoons would be similar under this alternative; specifically, up to one more inlet opening over the course
of a year during the monitoring period (maximum 5,000 cy). The monitoring program described in Section
2.5 and above would be suitable to verify no significant impacts.
Mission Bay/Tijuana Estuary
Under this alternative, both receiver sites would receive 50 percent more material than under Alternative
1. However, in both cases the increased sediment would not affect significantly coastal bodies. In the case
of Mission Bay, any substantial sediment movement to the south would be prevented from the reaching the
entrance to the bay by a jetty. In Imperial Beach, the northward current would prevent sediment from

4.2 Coastal Wetlands
Regional Beach Sand Project EIR/EA Page 4.2-999-69\SANDAG EIREA 4.1 to 4.13.wpd 7/17/00
affecting the estuary. Turbidity plumes would also be very localized. There would be no significant impacts
to either water body.
Mitigation Measures for Alternative 2a
Turbidity would significantly affect any coastal lagoons so no mitigation would be necessary. As described
in Section 2.5, a monitoring program would be implemented to verify whether or not project-related
sediment would result in increased rates of sand accumulation or mouth closures attributable to the project.
SANDAG has committed to fund the removal of sediment or inlet openings as determined to be
appropriate by the USACOE and in consultation with the resource agencies. No further measures would
be necessary.
Impacts/Mitigation Measures for Alternative 2b
Under this alternative, construction would occur over a longer time period but less sand would be placed
most receiver sites. Potential effects at individual lagoons would not be any greater under this construction
variation. The monitoring program in Section 2.5 would be implemented to either verify no significant
impact or institute mitigation as necessary.
4.2.4 No Action Alternative
Under this alternative, there would be no potential for change to lagoon sedimentation volumes or lagoon
mouth closures above the current patterns.
4.3 Water Resources
Regional Beach Sand Project EIR/EA Page 4.3-199-69\SANDAG EIREA 4.1 to 4.13.wpd 7/17/00
4.3 WATER RESOURCES
Potential impacts to water resources (e.g., chemical properties and turbidity) would primarily occur at the
borrow sites as result of dredging, and in nearshore waters adjacent to the beach receiver sites as a result
of their construction. There is also the potential for impacts to occur due to accidental leaks from land-
based construction equipment, although these scenarios are more speculative. The complete technical
analysis is contained in Appendix D. This section summarizes the potential impacts in terms of receiver
sites, borrow sites, and other construction issues. The season of construction, late summer or spring, would R
not affect the conclusions in this analysis. R
4.3.1 Significance Criteria
Impacts to water resources are considered in terms of water quality and associated regulations. An impact
to water resources would be significant if it would:
• adversely affect water quality in the long-term;
• endanger public health by creating or worsening health hazards conditions;
• threaten or damage unique biological characteristics, primarily due to turbidity; or
• violate the water quality criteria in the California Ocean Plan.
4.3.2 Alternative 1
Impacts of Alternative 1a
Receiver Sites
None of the fill material would exceed the criteria established in the California Ocean Plan for bacteria,
dissolved oxygen, contaminants and sulfides, nutrients or pH and there would be no impacts associated with
placement of fill material at the receiver sites. The main issue of concern in the nearshore environment is
turbidity. The analysis of turbidity at receiver sites focuses on groups of sites that would receive material
from the same borrow site since turbidity would be a direct consequence of the material type to be placed
on the shore. Generally, fine grain silt/clay materials, of less than 63 µm in size, would remain suspended
4.3 Water Resources
Page 4.3-2 Regional Beach Sand Project EIR/EA99-69\SANDAG EIREA 4.1 to 4.13.wpd 7/17/00
longer, while larger sand materials (greater than 63 µm in size) would settle very quickly to the bottom in
minutes.
Increased turbidity would occur along the shore as a result of sediment disposal. The action involves
pumping a sand/sea water mixture directly onto the beach from a dredged location offshore. Increased
turbidity would be caused by return water from pumping operations, as suspended sediments in the
sand/sea mixture would flow into the surf zone subsequent to pumping. As described in Section 2.4,
training dikes would be constructed during discharge to direct the flow of discharge and slow the water flow
thereby allowing more sediment to settle onto the beach instead of washing back into the surf zone. This
would reduce the potential water quality impact. The calculated turbidity plumes in this document are R
worst-case and do not factor in the reductions associated with training dikes or sand placement onshore R
instead of nearshore. R
Sediment pumping operations would vary depending on the type of dredge. With the cutterhead dredge,
turbidity would be nearly continuous. Turbidity would occur in pulses with the hopper dredge and the time
intervals between pump cycles would provide for greater settling of the dredged sands.
As described in Appendix D, there have been several nearby beach replenishment projects in the recent
past where turbidity plumes have been monitored. The extent and concentration of turbidity plumes are
directly proportional to the silt/clay content of the replenishment materials. When the silt/sand content
ranges from 2.5 to 10.5 percent, visible turbidity plumes range from approximately 50 to 2,000 feet down
current. However, the concentration of particulates generally was not noticeable above background levels
in the surf zone when the silt/clay content was less than 5 percent. The offshore extent of turbidity is much
more restricted but dependent upon wave conditions, rip currents, and speed and direction of longshore
currents. Measured turbidity plumes did not extend much beyond the surf zone when the silt/clay
concentrations were very low, and generally were limited to water depths less than 10 feet above MLLW
when silt/clay concentrations were 10 percent or less. Even when the silt/clay content ranged from 11 to
18 percent, turbidity plumes were not measured beyond 1,000 feet offshore (about -15 to -20 feet
MLLW).
South Oceanside and North Carlsbad
These two sites would be replenished from SO-9. The silt/clay content from this borrow site ranged from
2 to 11 percent with an average of 8 percent. Native sediments in the Oceanside Cell average 3 percent
4.3 Water Resources
Regional Beach Sand Project EIR/EA Page 4.3-399-69\SANDAG EIREA 4.1 to 4.13.wpd 7/17/00
above MSL and 12 percent below MSL. Turbidity plumes are calculated to be localized within about 100
to 300 feet of the discharge point, and may be visible up to 3,000 feet down current under maximum
current speeds when the finest grain sands are pumped. Both are consistent with the measurements from
Agua Hedionda Lagoon and Oceanside Harbor beach replenishment projects with sediments less than 10
percent silt/clays. Construction would occur at the South Oceanside receiver sites for approximately 30
days and at the North Carlsbad receiver site for 20 days. Depending upon the type of dredge, there may
be continuous turbidity or periodic episodes. However, due to the localized nature of the impact, the grain
size of the material (average 92 percent sand), and the presence of training dikes which would help reduce
turbidity, there would be no significant impacts to water quality at these two receiver sites.
South Carlsbad (North and South), Batiquitos, Leucadia, Moonlight Beach
All these receiver sites would receive material from the SO-7 borrow site. Percent of fine grain material
(less than 63 µm) would be three percent or less which is equal to the natural condition in the Oceanside
Littoral Cell above MSL. Turbidity plumes are calculated to be localized within 100 feet of the discharge
location, but may extend 1,000 feet down current under maximum current speeds. The average plume
distance, and the conservative maximum plume distance, are both within the range of turbidity plumes
detected during the Agua Hedionda Lagoon replenishment project involving sediments with less than 10
percent silt/clays. Construction at any given receiver site would occur over 10 to 15 days and may be
either relatively continuous or episodic, depending upon the type of dredge. Again, due to the localized
nature of the impact, the grain size of the material (97 percent sand) which is equal to the natural condition,
and the presence of training dikes which would help control and reduce turbidity, there would be no
significant impacts to water quality at these series of receiver sites.
Cardiff
Cardiff would be the only site to receive material from borrow site SO-6. Material from this borrow site
would 97 percent sand, also similar to the existing condition in the Oceanside Littoral Cell above MSL.
Localized turbidity plumes are calculated to be less than 200 feet from the point of discharge, with a
maximum visible plume under the greatest current conditions of 1,500 feet down current. Construction with
training dikes would occur over an estimated 11-day period. As with the other sites, the localized nature
of the short-term impact and the use of training dikes would ensure no significant impact.
4.3 Water Resources
Page 4.3-4 Regional Beach Sand Project EIR/EA99-69\SANDAG EIREA 4.1 to 4.13.wpd 7/17/00
Solana Beach, Del Mar, Torrey Pines
All three receiver sites would utilize material from the SO-5 borrow site. The average silt/clay content of
the sediment layers is 5 percent at this borrow site. Turbidity plumes are calculated to extend about 300
feet from the discharge point on average, but may extend up to 1,500 feet down current under maximum
current speeds. This would be consistent with the range of turbidity plumes detected during the Agua
Hedionda Lagoon replenishment project involving sediments with less than 10 percent silt/clays.
Construction would occur at these three sites for approximately 13, 16 and 20 days, respectively, and
turbidity levels may vary over this time depending upon the type of the dredge. There would be no
significant water quality at these locations given the high sand content (95 percent) and use of training dikes.
Mission Beach
The sands at MB-1 have an extremely low silt/clay content of 1 percent. Turbidity plumes at this receiver
site are calculated at less than 100 feet on average and less than 350 feet under maximum downcurrent
conditions. Construction may occur over an 11-day period either as a continuous event or periodic,
depending on the dredge type. Given the very high sand content and very localized nature of the effect,
as well as use of training dikes, there would be no significant impacts.
Imperial Beach
Borrow site SS-1 also has a high sand content of 99 percent and turbidity plumes are estimated to extend
an average of 200 feet but possibly up to 600 feet under maximum current speeds. The duration of this
elevated condition would be on the order of 12 days. Given the very high sand content and very localized
and short-term nature of the effect, as well as use of training dikes, there would be no significant impacts.
Borrow Sites
Dredging at all of the borrow sites was evaluated for potential to exceed the criteria established in the
California Ocean Plan for bacteria, dissolved oxygen, contaminates and sulfides, turbidity, nutrients, and
pH. All of the borrow sites would be of sufficient distance from wastewater outfalls to avoid bacterial
exposure. Sandy sediments such as those in the borrow sites would have low organic carbon and
contaminant concentrations, which have the least potential to degrade oxygen concentrations, and they are
located in coastal waters, which remain well oxygenated due to mixing from currents, surge, and tidal
4.3 Water Resources
Regional Beach Sand Project EIR/EA Page 4.3-599-69\SANDAG EIREA 4.1 to 4.13.wpd 7/17/00
movements. Measured contaminant concentrations indicate little potential for biological effects from
contaminant release during sediment resuspension. Dissolved sulfide concentrations were below detection
at all sites and total sulfide concentrations were low in borrow site sediments. Given the predominantly
sandy nature of the borrow site sediments, and the mixing and diluting capacities of the coastal environment,
any increases in nutrients are anticipated to be short-term and not of sufficient concentrations to result in
plankton blooms that could cause red tides. The mixing and diluting capacity of waters at the borrow sites
are considered sufficient to avoid changes in pH as a result of dredging activities. No violation of the
California Ocean Plan objective would occur from dredging any of the borrow sites.
The potential for turbidity impacts associated with dredging at the borrow sites is also addressed in detail
in Appendix D. The California Ocean Plan specifies that discharges shall not result in significant reductions
in natural light at any point outside the initial dilution zone. Water clarity may be determined by numerous
methods including measurement of light transmissivity, irradiance, or secchi disk. Turbidity also may be
determined by collection of water samples and measurement of total suspended solids, chlorophyl
concentrations, and/or national turbidity units (NTU).
The duration and extent of turbidity relates to the concentration and settling rate of the resuspended
material, water depth, turbulence of the water, and current speed. Silts/clays remain in suspension longer
than sands. Turbulence contributes to sediment resuspension. High current speeds will transport turbidity
plumes greater distances than low currents. At the subject borrow sites, suspended sand-sized particles
would tend to settle through the 40-to 80-foot depths of the water column and reach the bottom within
minutes, while finer silt/clay particles could take several hours.
In the open ocean environment of the borrow sites, the extent of the turbidity plume will relate to particle
concentration, size, and settling rate, water depth, current speed and direction, and turbulence. The average
downcurrent turbidity plume distances that may be generated from dredging each borrow site were
estimated based upon the median grain size diameters of the sediment, and three different current speeds,
assuming the utilization of a hopper dredge. (The plume from a cutter dredge would be approximately one
half of those calculated for the hopper dredge.) As shown in Table 4.3-1, the estimated turbidity plume
would range from less than 100 feet to over 500 feet at average current speeds. Visible turbidity plumes
could extend several thousand feet at several of the sites under maximum current conditions, although the
concentration of particulates within the plumes would be highest near the dredge and would decrease with
distance away from the dredge.
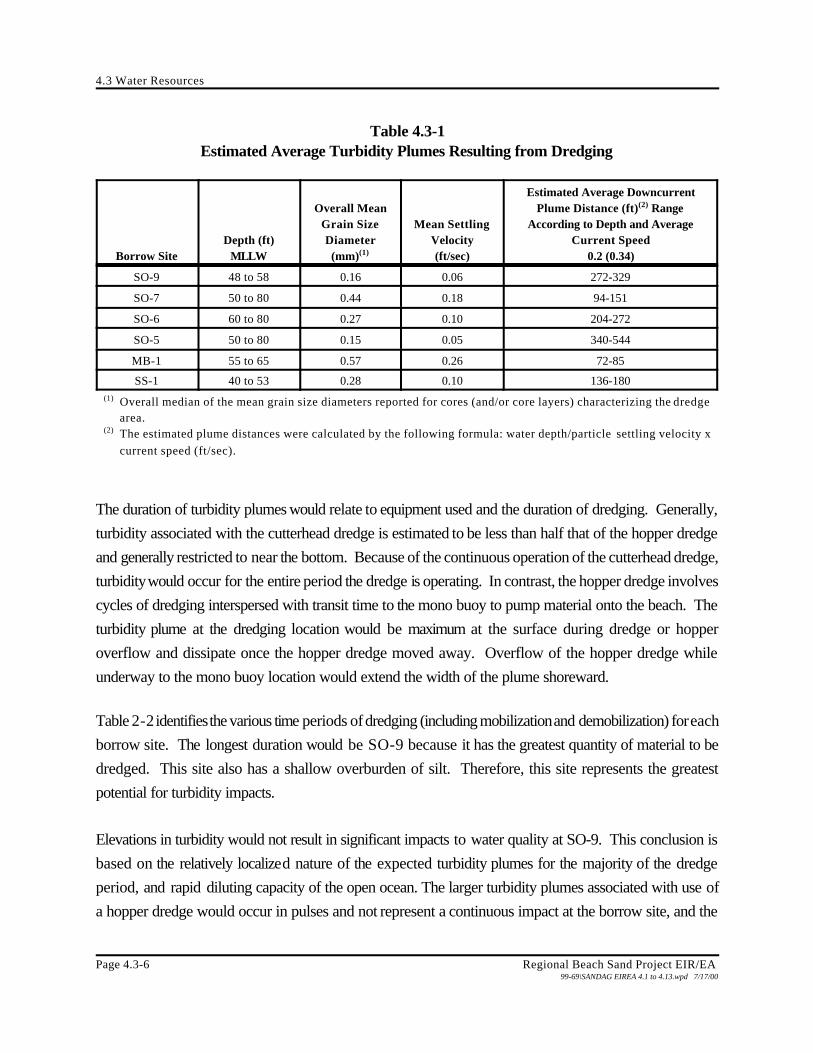
4.3 Water Resources
Page 4.3-6 Regional Beach Sand Project EIR/EA99-69\SANDAG EIREA 4.1 to 4.13.wpd 7/17/00
Table 4.3-1Estimated Average Turbidity Plumes Resulting from Dredging
Borrow SiteDepth (ft)
MLLW
Overall MeanGrain SizeDiameter(mm)(1)
Mean SettlingVelocity(ft/sec)
Estimated Average DowncurrentPlume Distance (ft)(2) Range
According to Depth and AverageCurrent Speed
0.2 (0.34)
SO-9 48 to 58 0.16 0.06 272-329
SO-7 50 to 80 0.44 0.18 94-151
SO-6 60 to 80 0.27 0.10 204-272
SO-5 50 to 80 0.15 0.05 340-544
MB-1 55 to 65 0.57 0.26 72-85
SS-1 40 to 53 0.28 0.10 136-180(1) Overall median of the mean grain size diameters reported for cores (and/or core layers) characterizing the dredge
area.(2) The estimated plume distances were calculated by the following formula: water depth/particle settling velocity x
current speed (ft/sec).
The duration of turbidity plumes would relate to equipment used and the duration of dredging. Generally,
turbidity associated with the cutterhead dredge is estimated to be less than half that of the hopper dredge
and generally restricted to near the bottom. Because of the continuous operation of the cutterhead dredge,
turbidity would occur for the entire period the dredge is operating. In contrast, the hopper dredge involves
cycles of dredging interspersed with transit time to the mono buoy to pump material onto the beach. The
turbidity plume at the dredging location would be maximum at the surface during dredge or hopper
overflow and dissipate once the hopper dredge moved away. Overflow of the hopper dredge while
underway to the mono buoy location would extend the width of the plume shoreward.
Table 2-2 identifies the various time periods of dredging (including mobilization and demobilization) for each
borrow site. The longest duration would be SO-9 because it has the greatest quantity of material to be
dredged. This site also has a shallow overburden of silt. Therefore, this site represents the greatest
potential for turbidity impacts.
Elevations in turbidity would not result in significant impacts to water quality at SO-9. This conclusion is
based on the relatively localized nature of the expected turbidity plumes for the majority of the dredge
period, and rapid diluting capacity of the open ocean. The larger turbidity plumes associated with use of
a hopper dredge would occur in pulses and not represent a continuous impact at the borrow site, and the
4.3 Water Resources
Regional Beach Sand Project EIR/EA Page 4.3-799-69\SANDAG EIREA 4.1 to 4.13.wpd 7/17/00
continuous turbidity plumes associated with use of a cutterhead dredge would be highly localized. Because
silty sands occur in a shallow and non-uniform overburden at the site, there is the potential for more
extensive turbidity plumes to develop, however, they should be of short duration if they occurred. There
would be no significant turbidity impacts at any other borrow sites.
Water quality monitoring will be required as part of the RWQCB 401 Certification Order which also sets
conditions on proposed operations. If monitoring indicates that RWQCB permit specifications are
exceeded, the dredging operation will be modified/suspended and appropriate measures taken to ensure
compliance. Modification of dredge and/or disposal operations, as necessary, to adhere to the RWQCB
conditions will help ensure no significant impacts to water quality resulting from the alternative.
Combined Turbidity (Borrow and Receiver Sites) R
R
Simultaneous plumes at the borrow site and receiver sites only would be generated if a cutterhead dredge R
is used. That dredge involves pumping of sands directly from the borrow site to the receiver site. The R
hopper dredge moves between the borrow site and receiver site. Because the borrow sediments are R
predominantly sands, turbidity plumes generated at the borrow site with the hopper dredge would be R
expected to dissipate during the transit and offloading time required to deliver sands to the receiver site. R
The hopper dredge operation involves surface overflows (with suspended particulates) at the borrow site, R
therefore, turbidity plumes generated during dredging are greater with this method than with the cutterhead R
dredge, which lacks surface overflows. Due to overflow while the hopper dredge is in transit to the R
receiver site, there also will be some tailwater discharge behind the vessel that should quickly dissipate. R
Because the hopper dredge operation involves these overflows, the sediment conveyed to the receiver site R
generally will have less fines than the material conveyed by a cutterhead dredge. The turbidity estimates R
of about 1,000 to 3,000 feet identified for receiver sites in prior text represent worst case estimates based R
on a maximum current speed, the greater plume generated by the hopper dredge at the borrow site, and R
potentially by the cutterhead offshore the receiver site if training dikes were not used and material were R
placed directly in the nearshore. Turbidity plumes under more typical current speeds would range from less R
than 100 to about 1,000 feet at the borrow site with the hopper dredge and less 500 feet with the R
cutterhead dredge. Plumes offshore the receiver sites would be expected to be less than 1,000 ft under R
typical current speeds, and training dikes would be used to further control turbidity. Additionally, the R
turbidity plume calculations assume placement in the nearshore which would not occur with this project. R
All material would be placed on the beach as far landward as possible which would further reduce turbidity. R

4.3 Water Resources
Page 4.3-8 Regional Beach Sand Project EIR/EA99-69\SANDAG EIREA 4.1 to 4.13.wpd 7/17/00
Other Construction Issues
Earthmoving equipment and cranes will be used on the beaches to spread the material pumped to the beach
and to place and maintain the discharge pipeline. Vehicle use has some potential for introducing
contaminants to beach fill sediments from minor spills and leaks from the equipment. No significant impacts
are anticipated since no refueling or fuel storage will occur on the beach, and the dredging contractor will
be required to develop a Spill Prevention Control and Counter-Measure Plan (SPCC) prior to initiating
pumping operations. Additional protection will be provided by the contractor using biodegradable (e.g.,
vegetable oil-based) lubricants and hydraulic fluids, and/or electric or natural gas powered equipment,
where practicable.
Mitigation Measures for Alternative 1a
There would be no significant impacts so no mitigation measures would be required. Some monitoring
would be required consistent with the RWQCB permit.
Impacts/Mitigation Measures for Alternative 1b
As shown in Table 2-2, there would be longer construction periods for several receiver and borrow sites
when compared to Alternative 1a. Although the construction period would be longer at these receiver and
borrow sites, the same construction practices (e.g., training dikes) and monitoring would be performed.
Construction would also still be short-term, and no significant impacts to water quality would result with
implementation of this alternative. Some monitoring would be required consistent with the RWQCB permit.
4.3.3 Alternative 2
Impacts of Alternative 2a
Receiver Sites
Construction at receiver sites in South Oceanside, South Carlsbad, Torrey Pines, Mission Beach, and
Imperial Beach would take incrementally longer under this alternative than Alternative 1 because they would
receive more sand. Still, the impacts would remain localized and training dikes would help reduce turbidity.
No significant impacts to water quality would occur at these receiver sites. Several receiver sites that are

4.3 Water Resources
Regional Beach Sand Project EIR/EA Page 4.3-999-69\SANDAG EIREA 4.1 to 4.13.wpd 7/17/00
slated to receive sand under Alternative 1 are not proposed for sand replenishment under Alternative 2.
As no construction would occur at these sites, even short-term impacts to water quality would not occur.
Borrow Sites
As under Alternative 1, given the predominantly sandy nature of the borrow site sediments, and the mixing
and diluting capacities of the coastal environment, any increases in nutrients are anticipated to be short-term
and not of sufficient concentrations to result in plankton blooms that could cause red tides. The mixing and
diluting capacity of waters at the borrow sites are considered sufficient to avoid changes in pH as a result
of dredging activities. No violation of the California Ocean Plan objective would occur from dredging any
of the borrow sites.
The potential for turbidity impacts associated with dredging at the borrow sites is also addressed in detail
in Appendix D. Modification of dredge and/or disposal operations, as necessary, to adhere to the
RWQCB conditions will help ensure no significant impacts to water quality resulting from the alternative.
Localized increases in turbidity would not result in significant impacts to water quality at any of the borrow
sites. This conclusion is based on the relatively localized nature of the expected turbidity plumes for the
majority of the dredge period, and rapid diluting capacity of the open ocean. The larger turbidity plumes
associated with use of a hopper dredge would occur in pulses and not represent a continuous impact at the
borrow site, and the continuous turbidity plumes associated with use of a cutterhead dredge would be highly
localized. Because silty sands occur in a shallow and non-uniform overburden at the SO-9 site, there is
the potential for more extensive turbidity plumes to develop, however, they should be of short duration if
they occurred.
Water quality monitoring will be required as part of the RWQCB 401 Certification Order which also sets
conditions on proposed operations. If monitoring indicates that suspended particulate concentrations
outside the zone of initial dilution exceeds RWQCB conditions, the dredging operation will be
modified/suspended and appropriate measures taken to ensure compliance.
Mitigation Measures for Alternative 2a
As no significant impacts would occur, no mitigation measures would be necessary. Some monitoring
would be required consistent with the RWQCB permit.

4.3 Water Resources
Page 4.3-10 Regional Beach Sand Project EIR/EA99-69\SANDAG EIREA 4.1 to 4.13.wpd 7/17/00
Impacts/Mitigation Measures for Alternative 2b
As shown in Table 2-6, there would be longer construction periods for several receiver and borrow sites
when compared to Alternative 2a. Although the construction period would be longer at these receiver and
borrow sites, the same construction practices (e.g., training dikes) and monitoring would be performed.
Construction would also still be short-term, and no significant impacts to water quality would result with
implementation of this alternative. Some monitoring would be required consistent with the RWQCB permit.
4.3.4 No Action Alternative
As no dredging or replenishment activities are proposed under this alternative. No change to water quality
would result, and no mitigation measures would be necessary.

4.4 Biological Resources
Regional Beach Sand Project EIR/EA Page 4.4-199-69\SANDAG EIREA 4.1 to 4.13.wpd 7/17/00
4.4 BIOLOGICAL RESOURCES
Impacts to biological resources can be direct resulting in loss of habitat or individual species, or they can
be indirect resulting in diminished reproduction, impaired foraging and growth, interruption of wildlife
movement, or reduction in habitat quality. Direct impacts to marine biological resources may occur through
burial, removal, or smothering. Indirect impacts may result from decreases in marine water quality
associated with dredging and beach replenishment activities, sediment transport related to movement of
sands from the fill sites, noise, and contaminant releases associated with sediment disturbance, vessel traffic,
and/or construction equipment. Indirect noise impacts to sensitive bird species are addressed in Section
4.13.
Direct impacts would be the same whether the project is constructed in late summer or spring. Indirect R
impacts would generally be the same for sedimentation since the analysis considered duration in terms of R
a series of seasons, not dependent upon a specific start date. Construction in spring would result in some R
activity during the nesting season of the federally listed western snowy plover and California least tern. This R
issue is addressed separately in the Final EIR/EA. Finally, construction in spring may provide benefits to R
grunion by establishing sandy beaches where currently there are cobble structures, thereby increasing their R
spawning habitat. R
4.4.1 Significance Criteria
Impacts to marine resources were considered significant if:
• an individual or population of a threatened or endangered species is adversely affected as a result of
the project;
• fisheries protected under Essential Fish Habitat designation are adversely affected; and/or
• long-term adverse impacts from sediment transport would result in the irreversible removal, disturbance
or destruction of sensitive resources. Such sensitive resources are defined to include high relief reefs
and vegetated low relief reefs. Indicator species are feather boa kelp (Egregia menziesii), giant kelp
(Macrocystis pyrifera), surfgrass (Phyllospadix spp.), large sea fans (Muricea spp.), and sea palms
(Eisensia arborea).
4.4 Biological Resources
Page 4.4-2 Regional Beach Sand Project EIR/EA99-69\SANDAG EIREA 4.1 to 4.13.wpd 7/17/00
4.4.2 Alternative 1
This impact analysis is separated into receiver sites and borrow sites and for each of those locations,
impacts are addressed in terms of direct and indirect. The receiver sites have been designed so that the
sand replenishment footprints would not result in significant direct impacts to biological resources. The
greater potential for significant impacts occurs from the indirect effects of sediment transport where sand
deposition may have long-term effects to sensitive resources.
Impacts of Alternative 1a
Receiver Sites
Sand replenishment at the receiver sites would directly impact marine life by burying organisms within the
footprint of the fill. Indirect impacts would occur from turbidity generated during construction of the
receiver sites, migration of sand away from the site via natural transport processes up and down the coast,
mechanical disturbance associated with grading the slope of the fill, and construction noise disturbance.
The complete analysis is contained in Appendix D and summarized below.
Direct Impacts of Sand Placement
Construction of the beach receiver sites would result in burial impacts to marine biota. During beach
nourishment, large volumes of sand are placed above and throughout the intertidal zone. The amount of
sand overburden varies in thickness across the footprint of the fill. From the back beach to the top of the
slope, where sand depths would be deeper, all benthic organisms would be smothered. Organisms also
would be buried under decreasing depths of sand towards the toe of the slope and outside edges of the fill.
Past studies of dredge material disposal have demonstrated that some mobile organisms such as clams and
worms are capable of burrowing through deposited materials of one to three feet in thickness. Some
crustaceans such as amphipods and decapods also may escape burial at the leading edge of deposition.
Therefore, not all benthic organisms would be expected to die within the receiver site footprint, particularly
near the edges of the fill.
The loss of benthic organisms within the receiver site footprint is an expected and unavoidable impact
during beach replenishment projects. However, due to the adaptability of organisms within this sandy
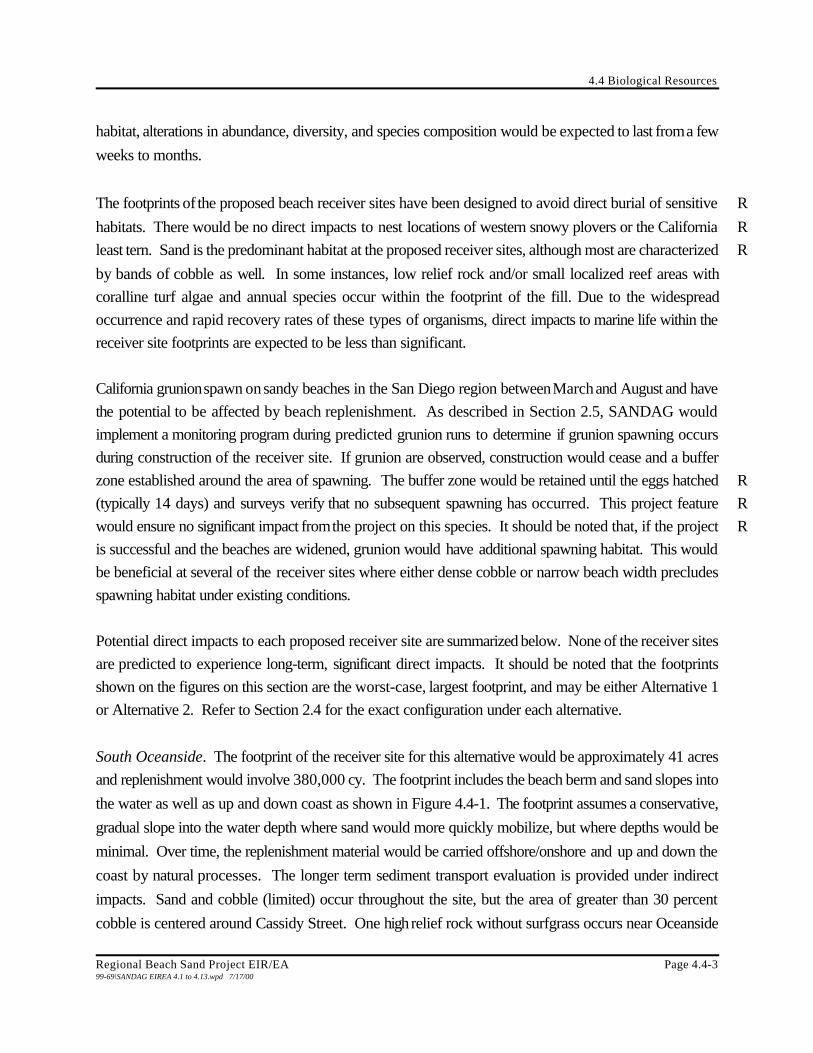
4.4 Biological Resources
Regional Beach Sand Project EIR/EA Page 4.4-399-69\SANDAG EIREA 4.1 to 4.13.wpd 7/17/00
habitat, alterations in abundance, diversity, and species composition would be expected to last from a few
weeks to months.
The footprints of the proposed beach receiver sites have been designed to avoid direct burial of sensitive R
habitats. There would be no direct impacts to nest locations of western snowy plovers or the California R
least tern. Sand is the predominant habitat at the proposed receiver sites, although most are characterized R
by bands of cobble as well. In some instances, low relief rock and/or small localized reef areas with
coralline turf algae and annual species occur within the footprint of the fill. Due to the widespread
occurrence and rapid recovery rates of these types of organisms, direct impacts to marine life within the
receiver site footprints are expected to be less than significant.
California grunion spawn on sandy beaches in the San Diego region between March and August and have
the potential to be affected by beach replenishment. As described in Section 2.5, SANDAG would
implement a monitoring program during predicted grunion runs to determine if grunion spawning occurs
during construction of the receiver site. If grunion are observed, construction would cease and a buffer
zone established around the area of spawning. The buffer zone would be retained until the eggs hatched R
(typically 14 days) and surveys verify that no subsequent spawning has occurred. This project feature R
would ensure no significant impact from the project on this species. It should be noted that, if the project R
is successful and the beaches are widened, grunion would have additional spawning habitat. This would
be beneficial at several of the receiver sites where either dense cobble or narrow beach width precludes
spawning habitat under existing conditions.
Potential direct impacts to each proposed receiver site are summarized below. None of the receiver sites
are predicted to experience long-term, significant direct impacts. It should be noted that the footprints
shown on the figures on this section are the worst-case, largest footprint, and may be either Alternative 1
or Alternative 2. Refer to Section 2.4 for the exact configuration under each alternative.
South Oceanside. The footprint of the receiver site for this alternative would be approximately 41 acres
and replenishment would involve 380,000 cy. The footprint includes the beach berm and sand slopes into
the water as well as up and down coast as shown in Figure 4.4-1. The footprint assumes a conservative,
gradual slope into the water depth where sand would more quickly mobilize, but where depths would be
minimal. Over time, the replenishment material would be carried offshore/onshore and up and down the
coast by natural processes. The longer term sediment transport evaluation is provided under indirect
impacts. Sand and cobble (limited) occur throughout the site, but the area of greater than 30 percent
cobble is centered around Cassidy Street. One high relief rock without surfgrass occurs near Oceanside

4.4 Biological Resources
Page 4.4-4 Regional Beach Sand Project EIR/EA99-69\SANDAG EIREA 4.1 to 4.13.wpd 7/17/00
Boulevard. The approximate locations of scattered rocks as identified by commercial fisherman are shown
as well. In all but one case, the symbol reflects the general location of such rocks, the extent is not known.
One offshore area, generally south of Cassidy Street, where scattered rock was identified by commercial
fisherman was investigated further for potential indirect impacts related to model-predicted persistent sand
deposition. Figure 4.4-1 shows both the scattered rock symbol and the substrate mapped based on the
side-scan sonar and dive effort in early 2000. The evaluation of indirect impacts to this substrate is
addressed under sediment transport impacts.
Most sedentary or slow moving marine animals within the footprint area would be killed from burial and
construction. Direct impacts would not be significant because of rapid recolonization of the habitat and the
absence of sensitive species. Significant impacts to grunion would be avoided by the process established
in Section 2.5 and summarized briefly above.
North Carlsbad. The footprint of the receiver site would be approximately 29 acres with 240,000 cy.
Sand and cobble occur throughout the site although only the larger areas with greater percent sand cover
are illustrated in Figure 4.4-2. Similar to the summary for the South Oceanside receiver site, direct impacts
to marine life within the footprint of the fill would not be significant, and no significant impacts to grunion
are anticipated.
South Carlsbad North. A total of 160,000 cy would fill a footprint of approximately 21 acres. Sand and
cobble occur throughout the site (Figure 4.4-3) although the cobble pattern at the northern end is less dense
(less than 30 percent cover). Similar to the summary for the Oceanside receiver site, direct impacts to
marine life within the footprint of the fill would be less than significant and no significant impacts to grunion
are anticipated.
Batiquitos. The footprint at this receiver would be approximately 22 acres and up to 118,000 cy would
be placed at the site. The footprint and nearby resources are shown in Figure 4.4-4. Sand and cobble
occur throughout the site. As with the other receiver sites, direct impacts to marine life would not be
significant and no significant impacts to California grunion are anticipated.
Leucadia. The Leucadia footprint would be approximately 13 acres and involve 130,000 cy. Sand and
cobble occur within the site as well as a few localized rocks without marine life (refer to Figure 4.4-5).
Patches of surfgrass are located outside the footprint. As with the other receiver sites, direct impacts to
marine life would not be significant and no significant impacts to California grunion are anticipated.
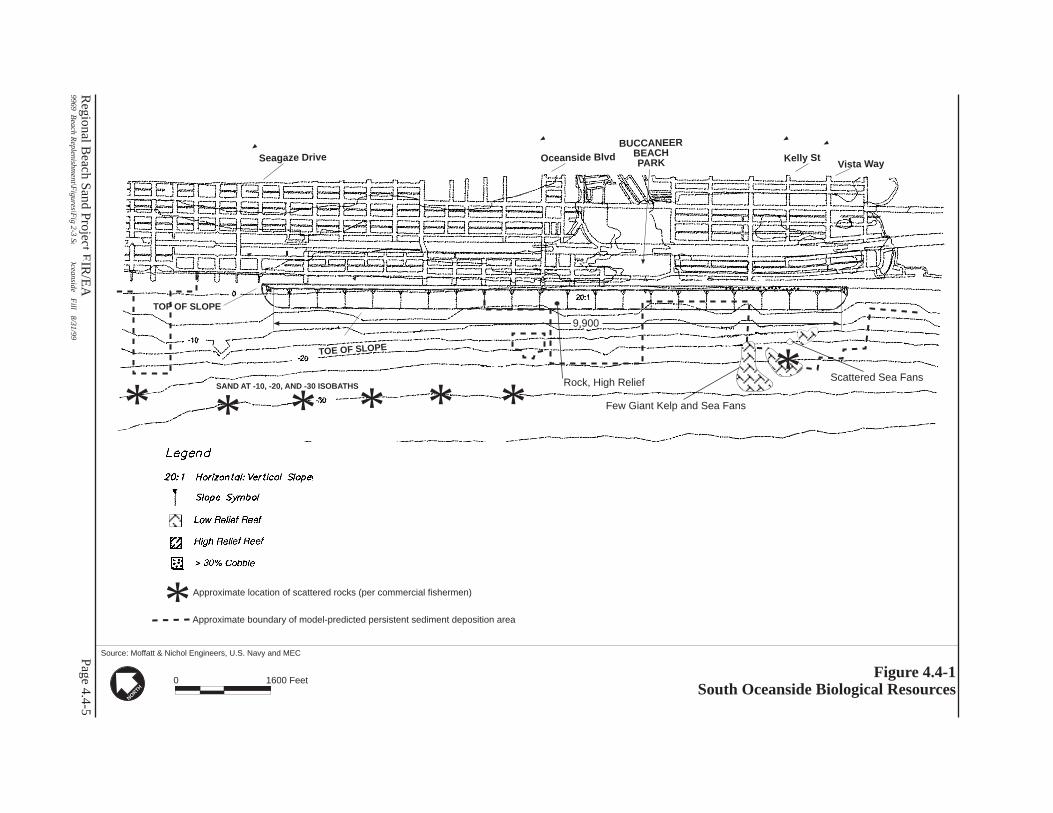
X.X
Section Nam
e
Page 4.4-5
Source: Moffatt & Nichol Engineers, U.S. Navy and MEC
Regional B
each Sand Project EIR
/EA
9969 Beach R
eplenishment\F
igures\Fig 2-3 South O
ceanside Fill 8/31/99
Figure 4.4-1South Oceanside Biological Resources
NORTH
1600 Feet0
9,900
TOE OF SLOPE
TOP OF SLOPE
Seagaze Drive Oceanside Blvd Kelly StVista Way
BUCCANEERBEACHPARK
9,900
SAND AT -10, -20, AND -30 ISOBATHS
Approximate location of scattered rocks (per commercial fishermen)
*
*
**
Approximate boundary of model-predicted persistent sediment deposition area
Few Giant Kelp and Sea Fans
Scattered Sea FansRock, High Relief
*** *

Page 4.4-6
Source: Moffatt & Nichol Engineers and MEC, U.S. Navy
Regional B
each Sand Project EIR
/EA
9969 Beach R
eplenishment\F
igures\Fig 4.4-2 2/2/00
Figure 4.4-2North Carlsbad Biological Resources
NORTH
500 Feet0
3,150’
Surfgrass Approximate boundary of model-predicted persistent sediment deposition area
Patchy surfgrass, scatteredfeather boa,and few giant kelp
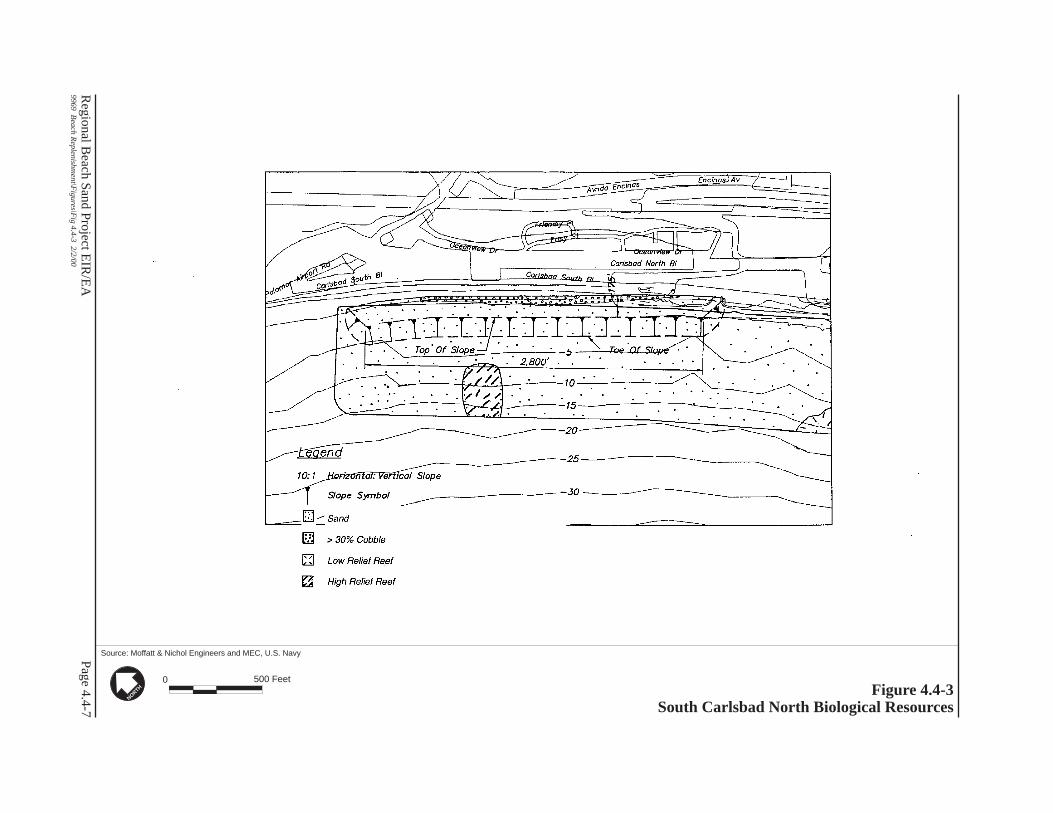
Page 4.4-7
Source: Moffatt & Nichol Engineers and MEC, U.S. Navy
Regional B
each Sand Project EIR
/EA
9969 Beach R
eplenishment\F
igures\Fig 4.4-3 2/2/00
Figure 4.4-3South Carlsbad North Biological Resources
NORTH
500 Feet0
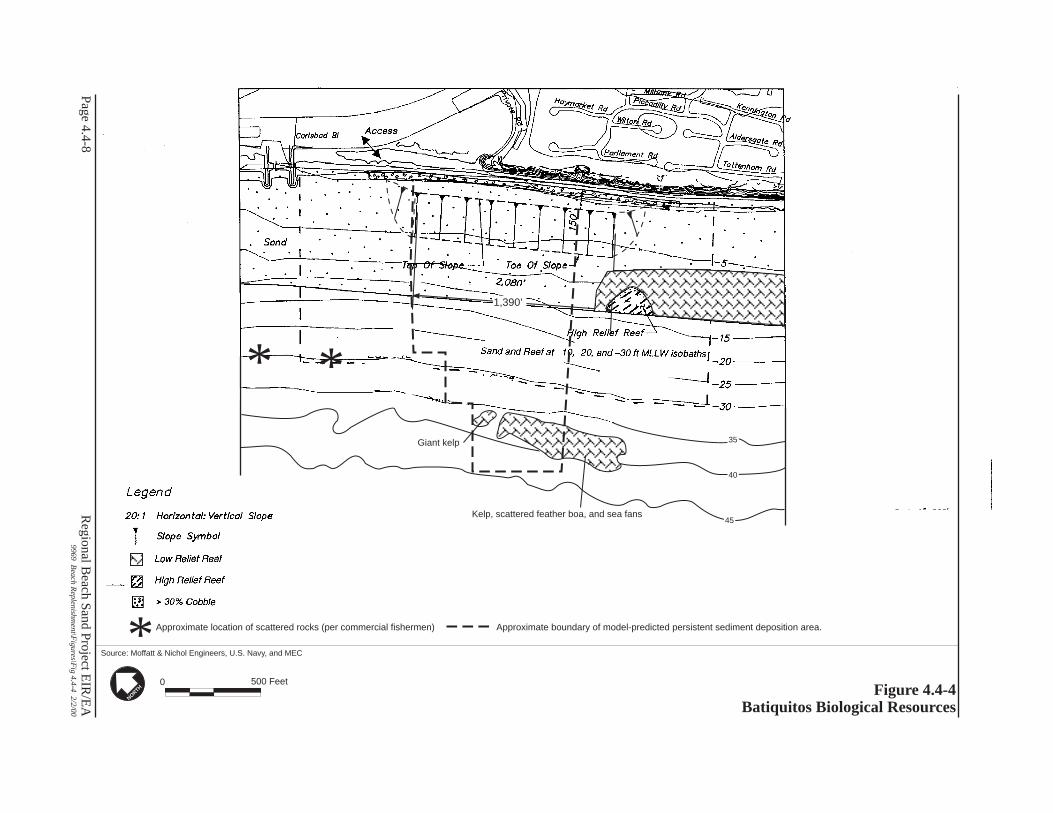
Page 4.4-8
Source: Moffatt & Nichol Engineers, U.S. Navy, and MEC
Regional B
each Sand Project EIR
/EA
9969 Beach R
eplenishment\F
igures\Fig 4.4-4 2/2/00
Figure 4.4-4Batiquitos Biological Resources
NORTH
Approximate location of scattered rocks (per commercial fishermen)
* *
*
1,390’
35
40
45
Giant kelp
Kelp, scattered feather boa, and sea fans
Approximate boundary of model-predicted persistent sediment deposition area.
500 Feet0

Page 4.4-9
Source: Moffatt & Nichol Engineers, U.S. Navy, and MEC
Regional B
each Sand Project EIR
/EA
9969 Beach R
eplenishment\F
igures\Fig 4.4-5 2/2/00
Figure 4.4-5Leucadia Biological Resources
NORTH
Surfgrass
2,700
Gra
ndvi
ew S
t
Gla
ucus
St
500 Feet0
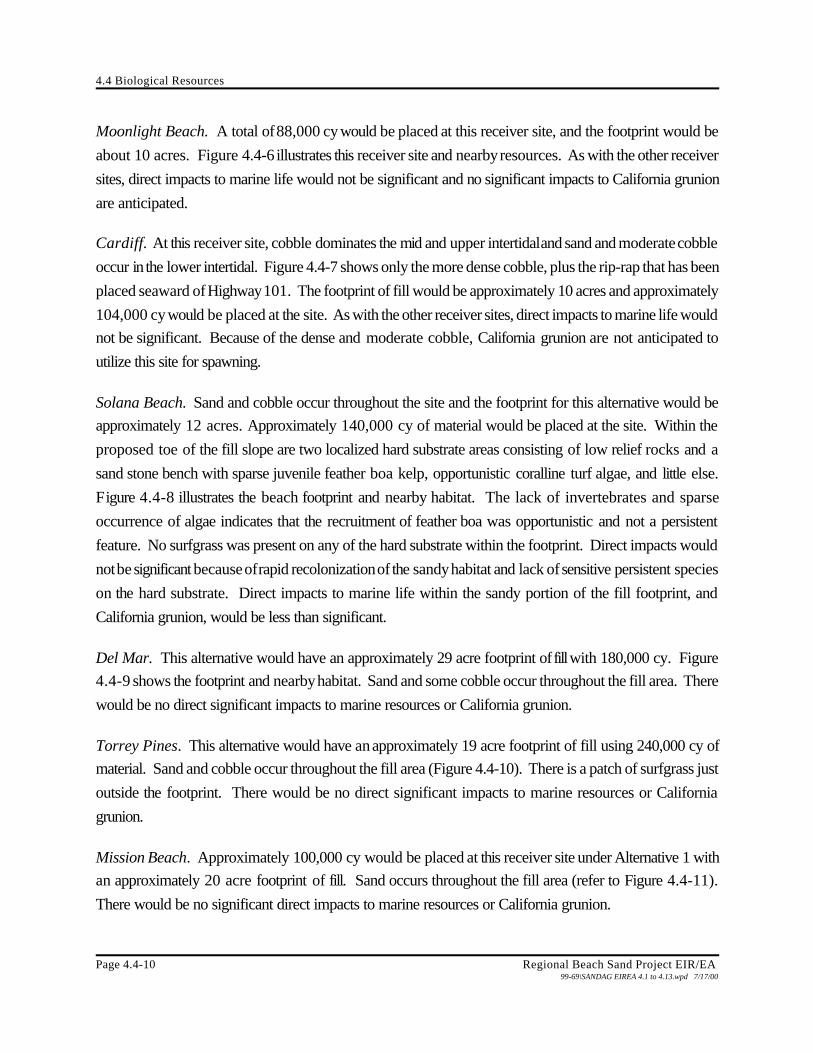
4.4 Biological Resources
Page 4.4-10 Regional Beach Sand Project EIR/EA99-69\SANDAG EIREA 4.1 to 4.13.wpd 7/17/00
Moonlight Beach. A total of 88,000 cy would be placed at this receiver site, and the footprint would be
about 10 acres. Figure 4.4-6 illustrates this receiver site and nearby resources. As with the other receiver
sites, direct impacts to marine life would not be significant and no significant impacts to California grunion
are anticipated.
Cardiff. At this receiver site, cobble dominates the mid and upper intertidal and sand and moderate cobble
occur in the lower intertidal. Figure 4.4-7 shows only the more dense cobble, plus the rip-rap that has been
placed seaward of Highway 101. The footprint of fill would be approximately 10 acres and approximately
104,000 cy would be placed at the site. As with the other receiver sites, direct impacts to marine life would
not be significant. Because of the dense and moderate cobble, California grunion are not anticipated to
utilize this site for spawning.
Solana Beach. Sand and cobble occur throughout the site and the footprint for this alternative would be
approximately 12 acres. Approximately 140,000 cy of material would be placed at the site. Within the
proposed toe of the fill slope are two localized hard substrate areas consisting of low relief rocks and a
sand stone bench with sparse juvenile feather boa kelp, opportunistic coralline turf algae, and little else.
Figure 4.4-8 illustrates the beach footprint and nearby habitat. The lack of invertebrates and sparse
occurrence of algae indicates that the recruitment of feather boa was opportunistic and not a persistent
feature. No surfgrass was present on any of the hard substrate within the footprint. Direct impacts would
not be significant because of rapid recolonization of the sandy habitat and lack of sensitive persistent species
on the hard substrate. Direct impacts to marine life within the sandy portion of the fill footprint, and
California grunion, would be less than significant.
Del Mar. This alternative would have an approximately 29 acre footprint of fill with 180,000 cy. Figure
4.4-9 shows the footprint and nearby habitat. Sand and some cobble occur throughout the fill area. There
would be no direct significant impacts to marine resources or California grunion.
Torrey Pines. This alternative would have an approximately 19 acre footprint of fill using 240,000 cy of
material. Sand and cobble occur throughout the fill area (Figure 4.4-10). There is a patch of surfgrass just
outside the footprint. There would be no direct significant impacts to marine resources or California
grunion.
Mission Beach. Approximately 100,000 cy would be placed at this receiver site under Alternative 1 with
an approximately 20 acre footprint of fill. Sand occurs throughout the fill area (refer to Figure 4.4-11).
There would be no significant direct impacts to marine resources or California grunion.
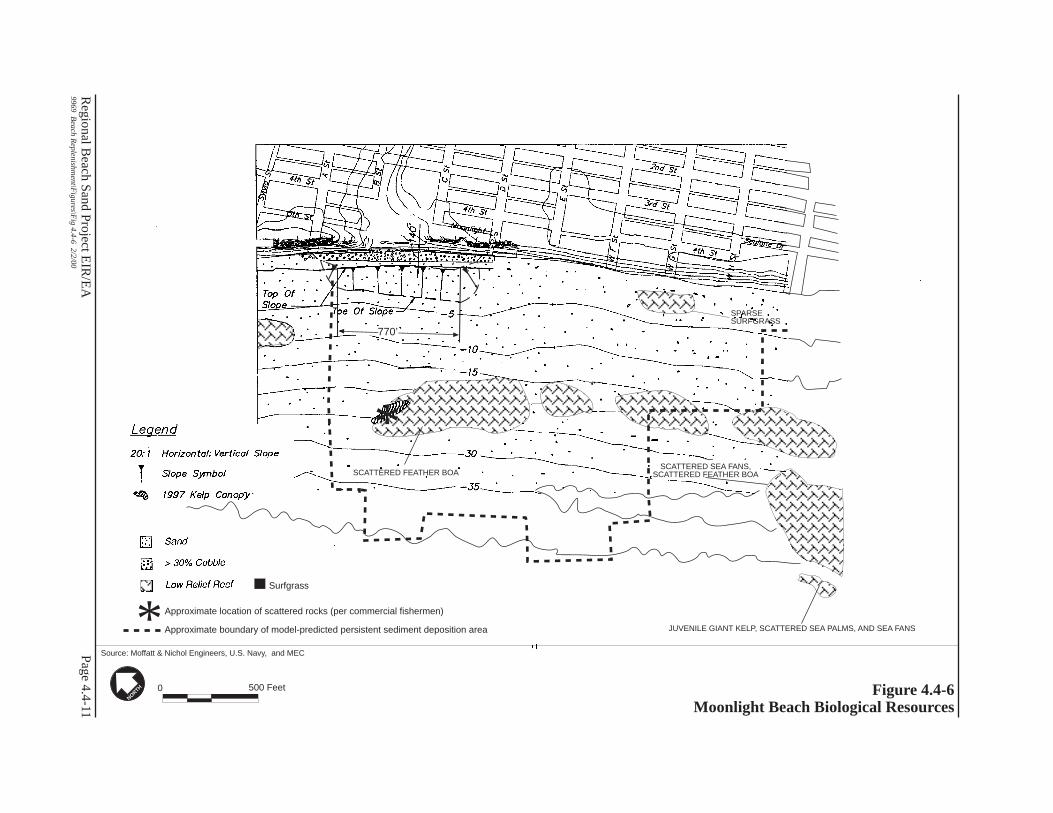
Page 4.4-11
Source: Moffatt & Nichol Engineers, U.S. Navy, and MEC
Regional B
each Sand Project EIR
/EA
9969 Beach R
eplenishment\F
igures\Fig 4.4-6 2/2/00
Figure 4.4-6Moonlight Beach Biological Resources
NORTH
*
*
SPARSESURFGRASS
770’
SCATTERED FEATHER BOASCATTERED SEA FANS,
SCATTERED FEATHER BOA
500 Feet0
Approximate location of scattered rocks (per commercial fishermen)
Approximate boundary of model-predicted persistent sediment deposition area JUVENILE GIANT KELP, SCATTERED SEA PALMS, AND SEA FANS
Surfgrass

Page 4.4-12
Source: Moffatt & Nichol Engineers, U.S. Navy, and MEC
Regional B
each Sand Project EIR
/EA
9969 Beach R
eplenishment\F
igures\Fig 4.4-7 2/2/00
Figure 4.4-7Cardiff Biological Resources
NORTH
*
**
780’
500 Feet0
Approximate location of scatteredrocks (per commercial fishermen)
Surfgrass
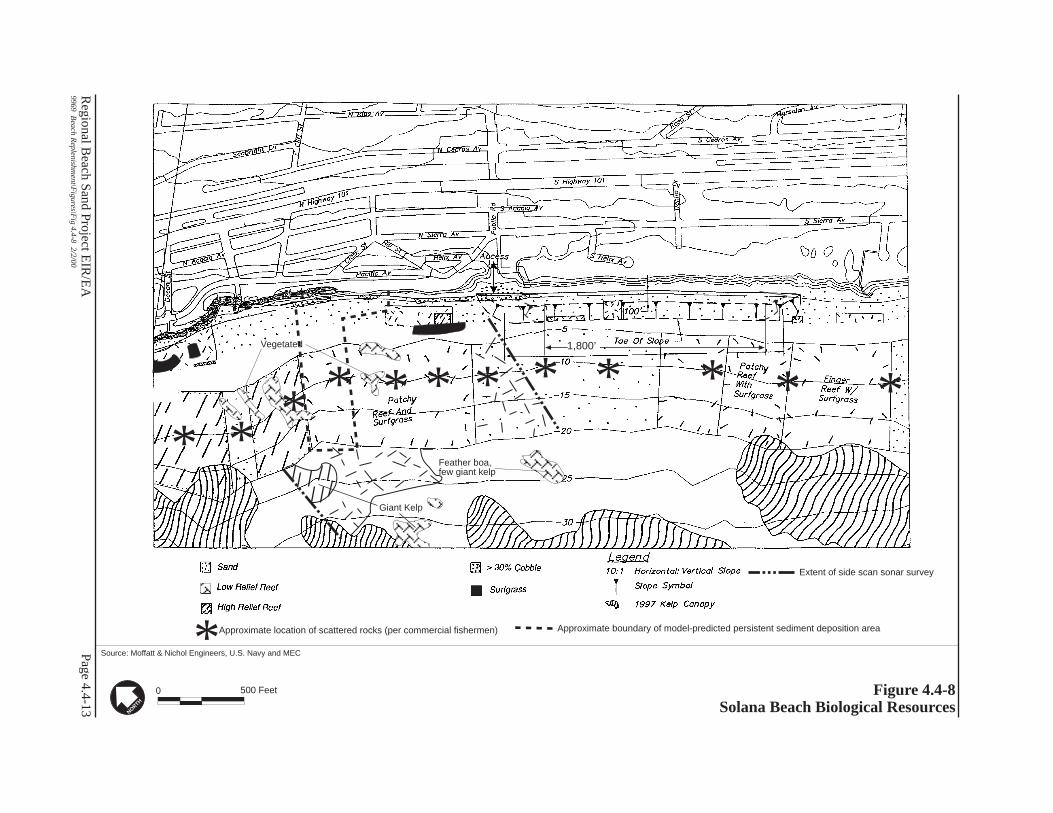
Page 4.4-13
Source: Moffatt & Nichol Engineers, U.S. Navy and MEC
Regional B
each Sand Project EIR
/EA
9969 Beach R
eplenishment\F
igures\Fig 4.4-8 2/2/00
Figure 4.4-8Solana Beach Biological Resources
NORTH
Approximate location of scattered rocks (per commercial fishermen)* Approximate boundary of model-predicted persistent sediment deposition area
* ** * * * * * * * **
Giant Kelp
Feather boa,few giant kelp
1,800’Vegetated
Extent of side scan sonar survey
500 Feet0

Page 4.4-14R
egional Beach Sand Project E
IR/E
A9969 B
each Replenishm
ent\Figures\F
ig 4.4-9 2/2/00
Page X-XX
Figure 4.4-9Del Mar Biological Resources
NORTH
*
****
Source: Moffatt & Nichol Engineers, U.S. Navy and MEC
**
500 Feet0
Approximate location of scattered rocks (per commercial fishermen)
Approximate boundary of model-predicted persistent sediment deposition area
Approximate boundary of reef (per commercial fishermen)
Page 4.4-15
Source: Moffatt & Nichol Engineers, U.S. Navy and MEC
Regional B
each Sand Project EIR
/EA
9969 Beach R
eplenishment\F
igures\Fig 4.4-10 2/2/00
Figure 4.4-10Torrey Pines Biological Resources
NORTH
Surfgrass
500 Feet0
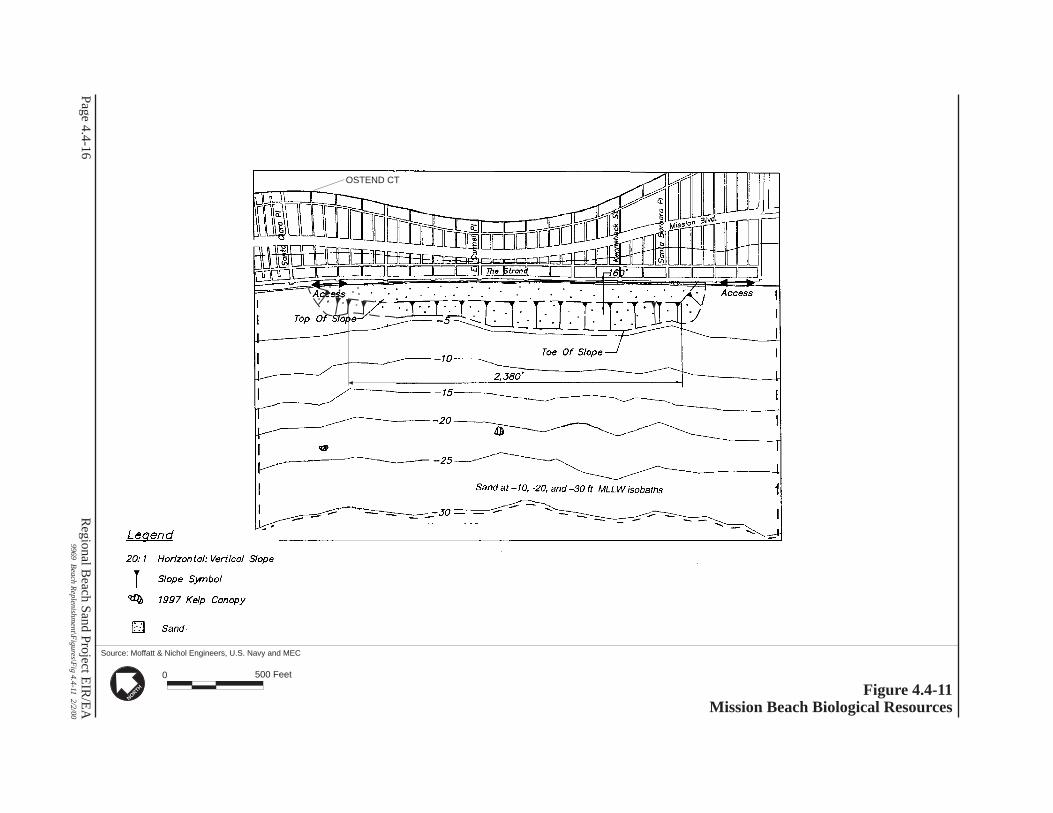
Page 4.4-16
Source: Moffatt & Nichol Engineers, U.S. Navy and MEC
Regional B
each Sand Project EIR
/EA
9969 Beach R
eplenishment\F
igures\Fig 4.4-11 2/2/00
Figure 4.4-11Mission Beach Biological Resources
NORTH
OSTEND CT
500 Feet0
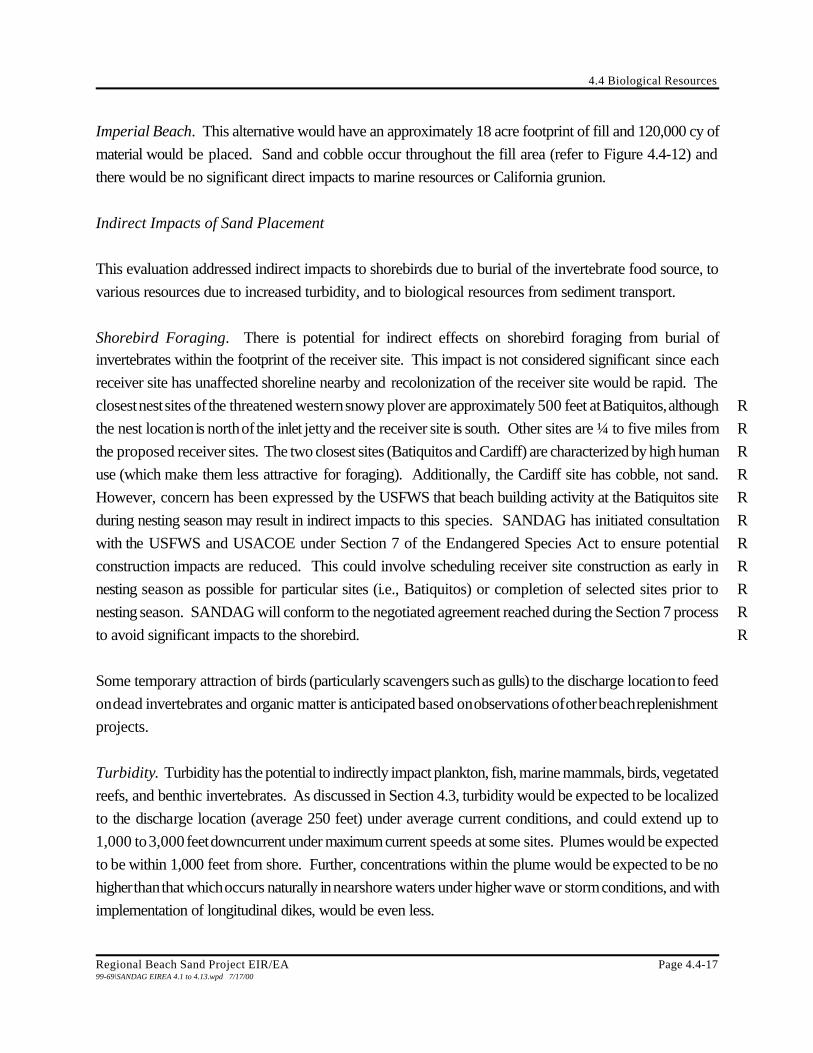
4.4 Biological Resources
Regional Beach Sand Project EIR/EA Page 4.4-1799-69\SANDAG EIREA 4.1 to 4.13.wpd 7/17/00
Imperial Beach. This alternative would have an approximately 18 acre footprint of fill and 120,000 cy of
material would be placed. Sand and cobble occur throughout the fill area (refer to Figure 4.4-12) and
there would be no significant direct impacts to marine resources or California grunion.
Indirect Impacts of Sand Placement
This evaluation addressed indirect impacts to shorebirds due to burial of the invertebrate food source, to
various resources due to increased turbidity, and to biological resources from sediment transport.
Shorebird Foraging. There is potential for indirect effects on shorebird foraging from burial ofinvertebrates within the footprint of the receiver site. This impact is not considered significant since each
receiver site has unaffected shoreline nearby and recolonization of the receiver site would be rapid. The
closest nest sites of the threatened western snowy plover are approximately 500 feet at Batiquitos, although R
the nest location is north of the inlet jetty and the receiver site is south. Other sites are ¼ to five miles from R
the proposed receiver sites. The two closest sites (Batiquitos and Cardiff) are characterized by high human R
use (which make them less attractive for foraging). Additionally, the Cardiff site has cobble, not sand. R
However, concern has been expressed by the USFWS that beach building activity at the Batiquitos site R
during nesting season may result in indirect impacts to this species. SANDAG has initiated consultation R
with the USFWS and USACOE under Section 7 of the Endangered Species Act to ensure potential R
construction impacts are reduced. This could involve scheduling receiver site construction as early in R
nesting season as possible for particular sites (i.e., Batiquitos) or completion of selected sites prior to R
nesting season. SANDAG will conform to the negotiated agreement reached during the Section 7 process R
to avoid significant impacts to the shorebird. R
Some temporary attraction of birds (particularly scavengers such as gulls) to the discharge location to feed
on dead invertebrates and organic matter is anticipated based on observations of other beach replenishment
projects.
Turbidity. Turbidity has the potential to indirectly impact plankton, fish, marine mammals, birds, vegetated
reefs, and benthic invertebrates. As discussed in Section 4.3, turbidity would be expected to be localized
to the discharge location (average 250 feet) under average current conditions, and could extend up to
1,000 to 3,000 feet downcurrent under maximum current speeds at some sites. Plumes would be expected
to be within 1,000 feet from shore. Further, concentrations within the plume would be expected to be no
higher than that which occurs naturally in nearshore waters under higher wave or storm conditions, and with
implementation of longitudinal dikes, would be even less.
Page 4.4-18
Source: Moffatt & Nichol Engineers, U.S. Navy, and MEC
Regional B
each Sand Project EIR
/EA
9969 Beach R
eplenishment\F
igures\Fig 4.4-12 2/2/00
Figure 4.4-12Imperial Beach Biological Resources
NORTH
788 Feet0
Approximate boundary of model-predicted persistent sediment deposition area
4.4 Biological Resources
Regional Beach Sand Project EIR/EA Page 4.4-1999-69\SANDAG EIREA 4.1 to 4.13.wpd 7/17/00
The effects of suspended particulates on plankton are generally considered to be negligible because of the
limited area affected and short exposure time as they drift through the affected area. Fish offshore the
receiver sites, and any marine mammals that ventured close to shore, may temporarily leave the area
affected by turbidity, but would not be expected to be adversely affected in the long-term. Some studies
of beach replenishment have observed fish attraction to turbidity plumes, presumably to feed upon dead
invertebrates and organic particulates that are washed offshore.
Fish-eating birds such as the California brown pelican and California least tern could be impacted in the
vicinity of the receiver site by a temporary reduction in their prey base if fish move away from the turbidity
plume. Given that turbidity would be localized and not extend from site to site, turbidity would not extend
beyond normal foraging distances for either of these species. California least tern forage generally within
a two-mile radius of their nesting site, but may forage as far as five miles away. California brown pelicans
forage over several miles. Since ample alternative forage areas would be available to these species during
receiver site construction, particularly during non-nesting periods, no adverse impacts to these species are R
anticipated. There may even be a temporary attraction to the plume areas if fish concentrate within the
plume. Monitoring of a beach replenishment project in Orange County demonstrated that California least
tern preferred to forage inside the turbidity plume (MEC 1997). Attraction of fish-eating birds to dredge
areas has also been noted in San Diego Bay.
With the project schedule shifted from later summer to the spring nesting season (April to September), R
additional analysis was undertaken to evaluate potential turbidity impacts to least tern foraging. The least R
tern can forage up to five miles distant, but prefers to remain closer (two miles or less) during the nesting R
season when eggs or baby birds may be threatened by predators. Additionally, the newly hatched birds R
require relatively small fish because they have small beaks and the adults feed them whole, not regurgitated, R
fish. Concern has been expressed that construction of the project during nesting season could increase R
turbidity in the nearby foraging area, necessitating greater distances for foraging and therefore resulting in R
increased predation while the adults are gone from the nest. R
R
Figures 4.4-13 through 4.4-17 provide a graphic representation of the relative distance between tern R
nesting locations, which are generally near lagoons and river mouths, and the borrow and receiver sites R
where turbidity would be generated. Distances from the nesting locations are shown in one-quarter, one- R
half, one and two mile increments so the relative location of project features is evident. It should be noted R
that the center point for calculating the distances is the river mouth, as requested by the USFWS, but the R
actual nest locations may be well inland from this point. For example, a least R

#
Sources: SANDAG (Base Layers), Moffatt & Nichol Engineers (Site Locat ions).
Regional Beach Sand Project EIR/EA9969 SANDAG\GIS\s ite 1.apr 6/22/00
Figure 4.4-13Relative Proximity of Receiver and Borrow Sites
to Least Tern Foraging Locations(Santa Margarita River Mouth)
2000 0 2000 4000 Feet
Scale: 1' = 4000'
1/4-
mil e
rad
iu
s
1/2 -
mile
radiu
s
1-m
ile ra
dius
2-mil e
radius
!"#@
!"#@ MISSION
COAST
San LuisRey
Rive
r
Santa Margarita
River
OCEANSIDE HARBOR
SOUTH OCEANSIDE RECEIVER SITE
Vande
g rift
Blv
d
S tuart Mesa Rd
DREDGE DISCHARGE LINE
DREDGEAREABORROW SITE
SO-9
Overview of San Diego County
#
#
#
#
#
Project Detail
4.4-20
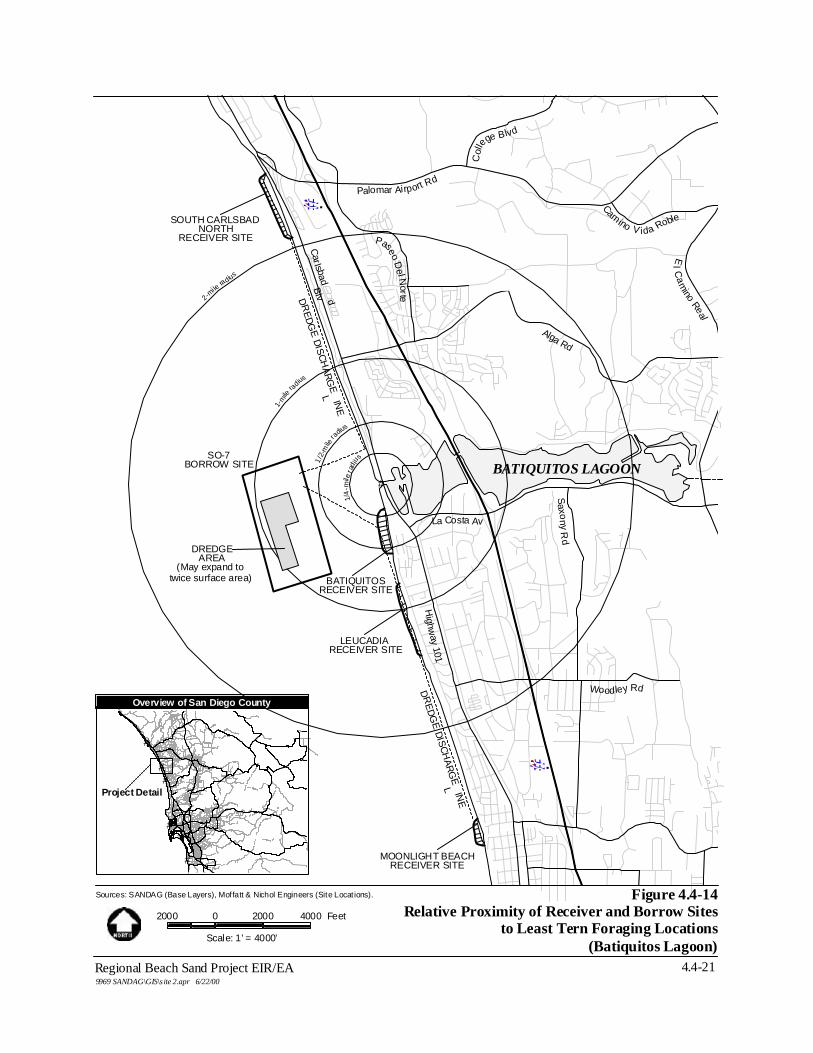
#
#
#
#
#
#
Sources: SANDAG (Base Layers), Moffatt & Nichol Engineers (Site Locat ions).
Regional Beach Sand Project EIR/EA9969 SANDAG\GIS\s ite 2.apr 6/22/00
Figure 4.4-14Relative Proximity of Receiver and Borrow Sites
to Least Tern Foraging Locations(Batiquitos Lagoon)
2000 0 2000 4000 Feet
Scale: 1' = 4000'
1/4-
mil e
rad
iu
s1/2-
mile
radius
1-m
ile ra
dius
2-mi le ra
dius
!"#@
LEUCADIA RECEIVER SITE
DREDGEAREA
DREDG
E DISCHARG
E L INE
BATIQUITOS LAGOON
Palomar Airport Rd
Col
lege Blvd
Camino V ida Roble
El C
amino Real
Alga Rd
Paseo De l N
orte
Carlsbad Blv d
Highw
ay 101
Woodley Rd
Sax on y Rd
La Costa AvDR
EDGE DISCH
ARGE L IN
E
SO-7BORROW SITE
BATIQUITOSRECEIVER SITE
MOONLIGHT BEACHRECEIVER SITE
Project Detail
Overview of San Diego County
SOUTH CARLSBAD NORTH
RECEIVER SITE
(May expand totwice surface area)
4.4-21
!"#@

#
Sources: SANDAG (Base Layers), Moffatt & Nichol Engineers (Site Locat ions).
Regional Beach Sand Project EIR/EA9969 SANDAG\GIS\s ite 3.apr 5/25/00
Figure 4.4-15Relative Proximity of Receiver and Borrow Sites
to Least Tern Foraging Locations(San Elijo Lagoon)
2000 0 2000 4000 Feet
Scale: 1' = 4000'
1/4-
mil e
rad ius1/
2-m
ile ra
dius
1-mile
radius
2-mil e
radius !"#@
!"#@
SOLANA BEACHRECEIVER SITE
DREDGEAREA SAN
ELIJOLAGOON
SO-6BORROW SITE
CARDIFF RECEIVER SITE
DREDGE
DISCHARGE LINE
San El ijo Sewer Outfall
SANDIEGUITOLAGOON
DRED
GE
DISC
HARG
E LIN
E
SO-5BORROW SITE
Project Detail
#
#
#
#
#
Overview of San Diego County
Enc ini tas Blvd
Santa Fe Dr
Birmingham Dr
Highwa y 101
Lomas Santa Fe Dr
Via De La Valle
MOONLIGHT BEACHRECEIVER SITE
4.4-22
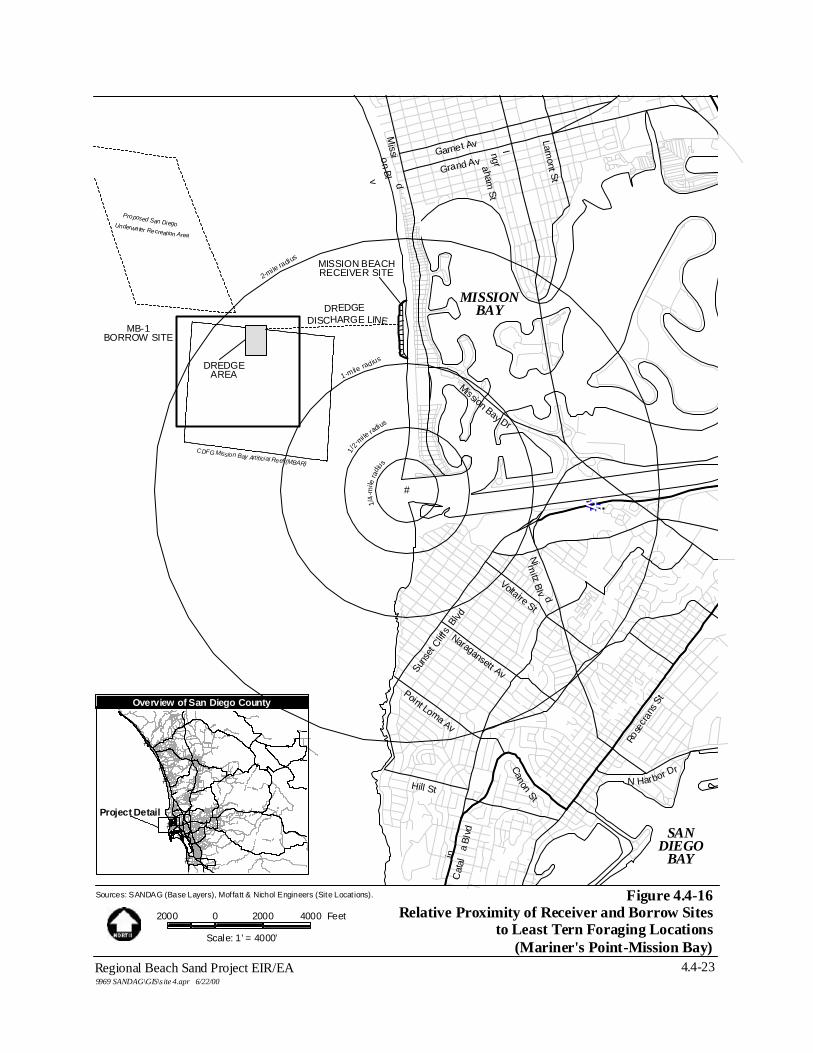
#
#
#
#
#
#
Sources: SANDAG (Base Layers), Moffatt & Nichol Engineers (Site Locat ions).
Regional Beach Sand Project EIR/EA9969 SANDAG\GIS\s ite 4.apr 6/22/00
Figure 4.4-16Relative Proximity of Receiver and Borrow Sites
to Least Tern Foraging Locations(Mariner's Point-Mission Bay)
2000 0 2000 4000 Feet
Scale: 1' = 4000'
1/4-
mil e
rad ius
1/2-
mi le radius
1-mile radius
2-mi le radius
DREDGEAREA
MISSIONBAY
MB-1BORROW SITE
MISSION BEACHRECEIVER SITE
DREDGE
SANDIEGO
BAY
Project Detail
Overview of San Diego County
CDFG Mission Bay Artificial Reef (MBAR)
DISCHARGE LINE
Proposed San DiegoUnderwater Recreation Area
Garnet Av
Grand Av
Ing ra ham St
Lamont St
Mi ssion Blv d
!"#A
Mission Bay DrSu
nset
Cli ffs
Blvd
Naragansett Av
Voltaire St
Point Loma Av
Hill St
Rose
crans
St
N Harbor DrCanon St
Cat
ali n
a B l
vd
N imitz Blv d
4.4-23

#
#
#
#
#
#
Sources: SANDAG (Base Layers), Moffatt & Nichol Engineers (Site Locat ions).
Regional Beach Sand Project EIR/EA9969 SANDAG\GIS\s ite 5.apr 6/22/00
Figure 4.4-17Relative Proximity of Receiver and Borrow Sites
to Least Tern Foraging Locations(Tijuana River)
2000 0 2000 4000 Feet
Scale: 1' = 4000'
1/4-
mil e
rad ius
1/2-
mi le radius
1-mile radius
2-mi le radius
DREDGEAREA
SS-1BORROW SITE
IMPERAL BEACHRECEIVER SITE
TIJUANA RIVERESTUARY
Project Detail
Overview of San Diego County
DREDGE
DISCHARGE LINETijuana River
International Border
Toll Road 1
Monument Rd
Saturn Blvd
Tower Rd
Halo St
Coronado Av
Elm Av
Highway 75
Otay River
S
ilv er Str and Bl vd
4.4-24

4.4 Biological Resources
Regional Beach Sand Project EIR/EA Page 4.4-2599-69\SANDAG EIREA 4.1 to 4.13.wpd 7/17/00
tern nesting island was constructed at Batiquitos lagoon just east of the I-5 freeway which is approximately R
0.75 mile further inland than the river mouth. R
R
Based on the figures, borrow sites S0-9, MB-1 and SS-1 would be greater than one mile distant while SO- R
7 and SO-6 would be under one mile. Receiver sites at South Oceanside, South Carlsbad North and R
Moonlight Beach would be outside the two mile radius. The two closest receiver sites would be Batiquitos R
and Cardiff which are just south of the lagoon mouths at Batiquitos and San Elijo, respectively. R
R
To gain an understanding of the potential impact to tern foraging during nesting season the percentage of R
foraging area potentially affected by turbidity within the one and two mile distances was calculated for the R
both the cutterhead and hopper dredge. The calculations and supporting technical notes are contained in R
Appendix F while key conclusions are summarized in Table 4.4-1. The potential turbidity varies with the R
two dredges. With the cutterhead there would be simultaneous dredging and sand placement. With the R
hopper dredge there would be tailings at the dredge and mono buoy locations. The percentage calculation R
considers both average and maximum typical current conditions. It is an extremely conservative analysis R
because it assumes nearshore sand placement not onshore, and no training dikes. Both of these elements R
are part of this project’s design and would further reduce turbidity in the near shore. It also does not R
consider the available foraging area inside the lagoons themselves, which the terns are known to utilize. R
R
Under the very worst-case conditions of maximum current speed at the two receiver sites closest to the R
nesting locations (Batiquitos and Cardiff) the percentage of area affected by the hopper dredge would be R
less than four percent of the available foraging area within one mile. At the remaining sites, the percentage R
of foraging area affected would range from zero to less than 2.5 percent. With the cutterhead dredge the R
percent potentially affected would be a maximum of two percent at the Cardiff site, within one mile. R
Considering the two mile radii the percentage would reduce further. R
R
Based on the remaining area available for foraging and the fact that this worst-case analysis likely overstates R
the potential impact, impacts associated with construction turbidity during the tern nesting season would R
be less than significant. However, the USFWS and USACOE have requested that SANDAG continue R
to consult with them under Section 7 of the Endangered Species Act to further reduce the potential for R
construction impacts. This process would be completed during the permit negotiation process and would R
consider such items as phasing to construct more sensitive sites such as Batiquitos prior to nesting, or early R
in the nesting season, other construction methods to minimize turbidity, and predator control. R

4.4 Biological Resources
Page 4.4-26 Regional Beach Sand Project EIR/EA99-69\SANDAG EIREA 4.1 to 4.13.wpd 7/17/00
Table 4.4-1 RPercent of Least Tern Foraging Habitat(1) Affected By Worst-Case Turbidity(2) R
Within One and Two Mile(3) Radii RRR
Receiver Site RWithin One Mile RWithin Two Miles R
RAverage Current RMaximum Typical R
Currents RAverage Current R
Maximum Typical RCurrents R
Cutterhead Dredge R
Oceanside R0 R0 R0.02 R0.5 R
N. Carlsbad R0 R0 R0.02 R0.5 R
S. Carlsbad (N) R0.01 R0.5 R0.003 R0.1 R
S. Carlsbad (S) R0.01 R0.5 R0.009 R0.2 R
Batiquitos R0.03 R1.1 R0.009 R0.2 R
Leucadia R0.03 R1.1 R0.009 R0.2 R
Moonlight R0.01 R0.5 R0.003 R0.1 R
Cardiff R0.14 R2.0 R0.03 R0.5 R
Solana Beach R0.3 R1.0 R0.07 R0.3 R
Del Mar R0 R0 R0 R0 R
Torrey Pines R0 R0 R0 R0 R
Mission Beach R0.02 R0.05 R0.007 R0.02 R
Imperial Beach R0.1 R0.3 R0.03 R0.07 R
Hopper Dredge R
Oceanside R0 R0 R0.06 R1.0 R
N. Carlsbad R0 R0 R0.06 R1.0 R
S. Carlsbad (N) R0.05 R1.8 R0.01 R0.5 R
S. Carlsbad (S) R0.05 R1.8 R0.02 R0.5 R
Batiquitos R0.07 R2.4 R0.02 R0.6 R
Leucadia R0.07 R2.4 R0.02 R0.6 R
Moonlight R0.07 R1.8 R0.02 R0.5 R
Cardiff R0.3 R3.9 R0.07 R1.0 R
Solana Beach R0.3 R1.0 R0.07 R0.3 R
Del Mar R0 R0 R0 R0 R
Torrey Pines R0 R0 R0 R0 R
Mission Beach R0.02 R0.15 R0.01 R0.4 R
Imperial Beach R0.18 R0.5 R0.04 R0.1 R(1) Does not consider habitat within the lagoons which is also known to be used for foraging. R(2) Worst-case turbidity assuming nearshore placement and no reduction for training dikes. R(3) Radii calculated from river/lagoon mouth, not necessarily exact for tern nesting locations. R
4.4 Biological Resources
Regional Beach Sand Project EIR/EA Page 4.4-2799-69\SANDAG EIREA 4.1 to 4.13.wpd 7/17/00
Kelp beds occur from about 1,200 to 4,000 feet offshore, which is outside the distance that turbidity
plumes would be expected to travel offshore. In the unlikely event that turbidity did extend that far
offshore, the particulate concentration would be so low as to have a negligible effect on the kelp bed.
Therefore, no significant indirect impacts to kelp beds are anticipated from turbidity generated from receiver
site construction.
Nearshore vegetated reefs may be impacted by reduced light transmittance and siltation associated with
turbidity plumes. Turbidity will be controlled by the construction of longitudinal dikes and would not be
expected to exceed concentrations that naturally occur in turbid nearshore waters during higher wave or
storm conditions. Similarly, turbidity would not be anticipated to have significant impacts on benthic
invertebrates offshore the receiver sites and within the distance of the expected turbidity plumes. Limited
information from recent beach replenishment projects reported 43 mg/L at the discharge location when the
discharged sediments had a silt/clay content less than 10 percent. Based on the sandy nature of the borrow
site sediments and use of longitudinal dikes to control turbidity, it seems reasonable that suspended
particulate concentrations would be less than 100 mg/L offshore the discharge location and decrease with
increasing distance from that location at the receiver site. As adults, mussels and oysters can tolerate
suspended matter in the range of 100 to 1000 mg/L over reasonably short exposure times. For larvae and
juveniles the effects appear to be negligible below 200 mg/L and slowly increase to critical levels at about
750 mg/L. Juvenile rock lobsters tolerate suspended particulate concentrations of at least 360 mg/L for
several days as well as exposure to sand. Thus, marine invertebrates adapted to living in naturally turbid
nearshore waters have relatively broad tolerance levels that would not be expected to be exceeded by the
project.
Sediment Transport. Fill material placed on individual receiver sites would eventually be washed by
waves and redistributed offshore and alongshore through natural processes. There is the potential for sand
introduced into the system to indirectly impact sensitive resources if material deposits on those resources
at sufficient depth and with persistence to result in irreversible removal, disturbance or destruction of that
resource. As defined in Section 4.4.2, sensitive indicator species consist of surfgrass, feather boa kelp, sea
fans, sea palms, and giant kelp.
Evaluating potential indirect sedimentation impacts is complex and the impact conclusions must be
determined in light of the dynamic ocean system, where season fluctuation of up to three feet of sand has
been monitored and where historic beach replenishment activities have occurred in many of the same
locations as proposed by the Regional Beach Sand Project; with an understanding of the life history of
4.4 Biological Resources
Page 4.4-28 Regional Beach Sand Project EIR/EA99-69\SANDAG EIREA 4.1 to 4.13.wpd 7/17/00
sensitive species and their relative distribution along the coast; and in conservative interpretation of model
predictions. A very detailed evaluation of potential impact associated with sediment transport is provided
in Appendix D, and this summary is provided to briefly describe the methodology and results. Overall,
the evaluation concludes that no significant indirect impacts to sensitive marine resources are anticipated,
although SANDAG would prepare and implement a monitoring plan to verify significant impacts do not
occur. As described in Section 2.5, this monitoring plan would be similar to the Coastal Monitoring Plan
approved by the USACOE in 1997 for the Navy Homeporting project.
The approach to analysis of indirect sedimentation impacts involved the following steps:
(1) Review of life history information for indicator species to understand sensitivity and recovery rates
after disturbance and therefore generate species-specific significance criteria.
(2) Review of historical profile data to establish the range in sand fluctuation that naturally occurs along
beach profiles correlated to individual receiver sites.
(3) Review of historic beach replenishment volumes in the vicinity of the receiver sites to establish the
degree of disturbance to habitats previously experienced from sedimentation.
(4) Review of project-specific model predictions to identify potential depositional areas, and review of
reef height and occurrence of sensitive resources within predicted depositional areas.
• Life History Information. Surfgrass is considered a stress-tolerant species that withstands
sedimentation by having an extensive root system, fibrous leaf sheaths that provide protection from
abrasion, and long leaves (three to five feet) that extend above the sand. While the amount of sand that
would certainly cause mortality is not known, the recovery of surfgrass is tied to the degree of disturbance
to the root system. Surfgrass can recover quickly via regrowth if the root system remains intact. Given that
sand burial does not remove the root system, it is assumed that sedimentation would not be expected to
result in an irreversible impact as long as burial did not persist for several years at the location. An impact
would be significant if sedimentation substantially buried surfgrass (root system and the entire length of
leaves) for more than two consecutive seasons. For this project there were no cases where a reef with R
surfgrass would be completely buried for two seasons. So further evaluation of the relative sand depth to R
leaf length was also considered. R
Feather boa kelp commonly occurs from intertidal to subtidal depths and has a naturally high recruitment
rate on exposed hard substrates and rapid growth. Impacts to feather boa kelp would be expected to last
only as long as a reef was covered by sand. Irreversible impacts to feather boa kelp would not be

4.4 Biological Resources
Regional Beach Sand Project EIR/EA Page 4.4-2999-69\SANDAG EIREA 4.1 to 4.13.wpd 7/17/00
expected unless sedimentation permanently buried a reef. Therefore, impacts to feather boa kelp were
considered significant if sedimentation was predicted to substantially bury reef, where the species occurs,
for several years.
Sea palms and sea fans also are considered relatively tolerant of physical stress, living in areas with very
strong waves and occurring from the low intertidal to subtidal. Their occurrence on low to high relief reefs
without interspersed sand patches suggests they may be less tolerant of sedimentation than surfgrass and
feather boa kelp. They also have a longer life span and take longer to reach sexual maturity. Given the
longer life spans of the species and suspected lower tolerance to sedimentation, impacts were considered
significant if sedimentation was predicted to substantially bury a reef where they occurred for greater than
one year.
Giant kelp forms persistent beds, but the extent of the beds may vary considerably year to year in response
to a variety of physical and biological stresses. Giant kelp, particularly in the microscopic and juvenile
stages, is considered highly sensitive to sand movement and disturbance and is one of the first species to
be eliminated under wave or sand scour stresses. Based on the naturally high seasonal variation in kelp bed
size due to a variety of factors, an impact would not be considered irreversible unless sedimentation
affected a substantial part of the historic kelp bed area and persisted such that recruitment potential would
be substantially affected.
• Historic and Proposed Beach Replenishment Volumes. In the past 45 years, over 33 million cy
of sand has been artificially introduced to the Oceanside Littoral Cell, approximately 1.3 million cy of sand
has been artificially introduced to the Mission Bay Littoral Cell, and about one million cy has been
introduced to the Silver Strand Littoral Cell (Appendix D). Nearshore areas off Oceanside and Carlsbad
have been exposed to frequent and recent sedimentation from projects similar to, or in excess of, that
proposed with the Regional Beach Sand Project. This is also true for Imperial Beach. Less frequent
disturbance, but at similar to higher volumes, has occurred off Mission Beach. Areas that have been less
subject to sedimentation from beach replenishment occur between Leucadia and Torrey Pines.
• Natural Sand Fluctuation. Beach profiles have been measured at various frequencies since the 1930s
at 50 transect locations between Oceanside and the U.S.–Mexican border with most of the data being
collected since 1983. In shallow water the changes in sand level are related primarily to wave condition,
whereas changes in sand level in deeper water are more complex. Generally, larger waves in fall and winter
resulted in several feet of sand being removed from the nearshore and redeposited directly outside the cut

4.4 Biological Resources
Page 4.4-30 Regional Beach Sand Project EIR/EA99-69\SANDAG EIREA 4.1 to 4.13.wpd 7/17/00
portion. In the spring and summer, small waves resulted in the return of sand to the beach and shallow
water area, thus completing the cycle. Cut and fill depths on the order of two to three feet are common
inshore of –25 feet MLLW, and sand depth changes of one-half to one foot are common at depths greater
than –25 feet MLLW.
• Model Interpretation and Conservative Assumptions. The indirect sedimentation analysis is based
on model-predicted, worst-case outputs from the GENESIS model. Input parameters into the model were
conservative with regards to wave energy, gross longshore sediment transport, five year time frame, and
negligible offshore losses except at Scripps Canyon in La Jolla. Worst-case model outputs were
interpreted conservatively with the initial screening based on persistence of project-related sand deposition
for one year or more, regardless of model-predicted sand depth. Finally, worst-case, model-predicted
sand depths were compared to reef heights and resources on that hard substrate to determine the potential
for substantial burial of sensitive resources.
As previously stated, there would be no significant impacts from direct deposition of sand at the receiver
sites. In evaluating indirect sedimentation impacts, the focus was on hard substrate with sensitive resources,
particularly where such resources may experience worst-case, model-predicted persistent sedimentation
of greater relative depth. In general, those locations of greater sand persistence and greater depth
(sedimentation risk) are located where there is an indented shoreline or gradual bathymetry. Less
sedimentation risk would occur at offshore coastlines that curve outward as headlands or have steeper
depth profiles. Locations near receiver sites off South Oceanside, south of North Carlsbad, near
Batiquitos, near Moonlight Beach, north of Solana Beach, north of Del Mar and offshore Imperial Beach
are predicted by the model to have a greater risk for sedimentation (depth and duration). The model
indicates that other receiver sites would not have the same risk of indirect sedimentation, specifically South R
Carlsbad North, Leucadia, Cardiff, Torrey Pines, and Mission Beach. R
Sediment deposition at the Cardiff receiver site is not predicted by the model to have duration of one year
or greater and is therefore not identified with the seven locations above as having greater sedimentation risk
with possible long-term impacts. However, nearby resources were evaluated for potential short-term
impacts. Some sedimentation is predicted by the model to occur offshore the receiver site to a maximum
distance of 1,400 feet from shoreline and to the north toward Cardiff reef. Cardiff reef is a high relief reef
with heights of five to seven feet at the southern edge, closer to shore, and three to four feet further
offshore. Worst-case, model-predicted sand depths of one to two feet would be limited in movement up
and over the reef by its height, and sensitive resources on top of the reef would not be exposed to project-
4.4 Biological Resources
Regional Beach Sand Project EIR/EA Page 4.4-3199-69\SANDAG EIREA 4.1 to 4.13.wpd 7/17/00
related sedimentation. There would be no significant indirect sedimentation impact at the Cardiff receiver
site.
The evaluation below describes briefly the potential indirect sedimentation impacts at these six locations
were sedimentation risk (depth and duration) is predicted. A more detailed analysis of each location is
provided in Appendix D.
• Potential Indirect Sedimentation Near South Oceanside. As shown in Figure 4.4-1, a model-
predicted persistent sediment deposition area would be located offshore the southern end of the receiver
site in a location where commercial fisherman had identified scattered rocks. That area was later mapped
during the side-scan sonar and dive effort and found to contain hard substrate. Two hard substrate areas
in this location (-15 to -25 feet MLLW) have scattered occurrences of sea fans but the heights of the reef
would be above the maximum persistent sedimentation depths and no significant impacts would occur.
Other hard substrates within the area include cobble and rock relief with opportunistic coralline algal turf.
Scattered rocks to the north of Oceanside Boulevard are not considered to be at risk of substantial
sedimentation because model-predicted increases in sand levels are within the historical average resulting
from seasonal variation in sand.
Results of the model predictions exhibit similarity to empirical profile data collected before and after 1983
and 1988 beach replenishment projects. For both of those projects, sedimentation mainly occurred out
from 1,100 to 1,300 feet from the backbeach, and sedimentation was not obvious past 1475 feet from the
backbeach. Similarly, model predictions for this project indicate little sedimentation beyond 1,200 feet
from the backbeach.
• Potential Indirect Sedimentation South of North Carlsbad. Worst-case sedimentation transport from
the North Carlsbad receiver site would be toward the south, and some sedimentation risk is predicted by
the model immediately south of the site (between Oak and Chestnut Avenues), south of Tamarack Avenue,
and south of the discharge jetty for Agua Hedionda Lagoon. Figure 4.4-2 illustrates the biological
resources offshore and just south of the receiver site and Figure 4.4-18 illustrates the resources in those
areas surveyed near the lagoon. Intertidal hard substrate that supports surfgrass is located off Juniper
Avenue (Figure 4.4-2) and south of Cannon Road (Terra Mar) (Figure 4.4-18). Nearshore reef with
various sensitive resources occurs south of the receiver site near Agua Hedionda Lagoon. Historically, kelp
has occurred offshore and further south at depths generally greater than –20 feet MLLW, which is typically

4.4 Biological Resources
Page 4.4-32 Regional Beach Sand Project EIR/EA99-69\SANDAG EIREA 4.1 to 4.13.wpd 7/17/00
at distances greater than 1,200 feet from the backbeach. Kelp generally has been absent directly offshore
Agua Hedionda Lagoon.
No long-term, significant impacts to intertidal reefs are expected from this alternative because reef heights
generally are above the maximum persistent sand depths at these locations. Several nearshore reefs with
surfgrass occur in the risk area at the southern end of the receiver site (Figure 4.2-2). At three small reefs
with a total area of 0.24 acre, surfgrass may experience partial sedimentation (less than one foot) such that
short-term impacts to growth could occur; however, because the long leaves would extend well above most
of the predicted deposition, there would be no significant, long-term effect. Nearshore reefs with surfgrass
are also located near Tamarack Avenue (Figure 4.4-18) but shallow depositional depths would not result
in significant impacts at this location.
There is one reef location where giant kelp may, under worst-case conditions, experience partial
sedimentation. A 0.73-acre reef just south of the discharge jetty and north of Cannon Road has a sparse
occurrence of giant kelp and sea fans on the higher relief portions of the reef. This location is within the
inshore limit of giant kelp. Maximum worst-case predicted sand cover would be predominantly well below
reef heights, except at the lower parts of the reef where less than four inches is predicted for up to 1.5
years. Given the sensitivity of kelp to sedimentation, there could be partial impacts at the lower portions
of the reef; however, based on the sparseness of kelp cover and its ephemeral nature at this location, the
impact would be less than significant.
Finally, no long-term impacts to sea fans, sea palms or feather boa kelp are anticipated.
• Potential Indirect Impacts Near Batiquitos. Under this alternative, the model predicts sedimentation
risk just south of the lagoon mouth at the Batiquitos receiver site. The nearshore area is cobble with
opportunistic species. No long-term impacts would result since any resources buried would quickly re-
establish. There is a reef complex over 2,000 feet from the back beach at depths greater than -38 feet
MLLW. The complex consists of a larger reef (6.8 acres) that supports sparse amounts of giant kelp,
feather boa and sea fans and a smaller reef (0.5 acre) with sparse kelp (Figure 4.4-4). The reef complex
has heights of zero to 1.5 feet, although most of it is one foot. Furthermore, most of the reef occurs beyond
the depth of closure, which is the seaward limit of normal sand transport. Under worst-case model
predictions, partial sedimentation is indicated for an area of approximately 1.5 acres which is characterized
by sparse giant kelp. Although there maybe some short-term impacts, the overall impact would not be
significant based on the short duration (one and one-half years) of maximum, worst-case predicted
sedimentation and the relatively small amount of reef that would be affected.

Page 4.4- 33
Source: Mffatt & Nichol Engineers, U.S. Navy, and MEC
Regional B
each Sand Project EIR
/EA
9969 Beach R
eplenishment\F
igures\Fig 4.4-13 2/2/00
Figure 4.4-18Biological Resources Near Agua Hedionda Lagoon in Carlsbad
NORTH
TAM
AR
AC
K A
VE
RE
DW
OO
D A
VE
HE
MLO
CK
AV
E
JUN
IPE
R A
VE
AC
AC
IA A
VE
CH
ES
TN
UT
AV
E
CA
NN
ON
RD
AGUA HEDIONDA LAGOON
Giant Kelp, Sea Fans,Feather Boa
Patchy surfgrass,Scattered Feather Boa,Sea Palms, Sea Fans
Scattered Sea Fans
Sand
Sand
Sand
Patchysurfgrass
1000 Feet0
Approximate boundary of model-predicted persistentsediment deposition area
Low Relief Reef
High Relief Reef
Surfgrass
Kelp
4.4 Biological Resources
Page 4.4-34 Regional Beach Sand Project EIR/EA99-69\SANDAG EIREA 4.1 to 4.13.wpd 7/17/00
• Potential Indirect Impacts Near Moonlight Beach. Sand and hard substrate habitats occur in the
vicinity of the Moonlight Beach receiver site (Figure 4.4-6). The Encinitas City Marine Life Refuge is R
located just south of the receiver site boundary. Refer to Section 3.6. The nearest intertidal hard substrates R
that support surfgrass are located north in Leucadia, south of the receiver site off F and G Streets, and
further south off I through K Streets near the surfing sites known as Boneyards and Swami’s. Only the
intertidal surfgrass off F and G Streets is within the map boundaries of Figure 4.4-6.
Similarly, nearshore reef occurs offshore the receiver site, further north off Leucadia, and further south
towards Swami’s. Historically, kelp has occurred offshore, north, and south of the receiver site at depths
of greater than -20 feet MLLW, which is typically at distances greater than1,200 ft from the backbeach.
The occurrence of kelp directly offshore the receiver site and extending south off H Street has been
characterized by relatively low persistence over the past 30 years.
As shown in Figure 4.4-6, the area of model-predicted persistent deposition is offshore south to I Street.
Under this alternative, sedimentation levels are within the historical average difference in sand depths
resulting from seasonal onshore and offshore migration of sand. Nearly two acres of intertidal reef
consisting of scattered rock with heights ranging from one to four feet occurs near F and G Streets. About
0.6 acres of intertidal surfgrass occurred in several discrete patches (15 feet diameter) on rocks with
heights of two and one-half to four feet at the more seaward portion of the reef (per low tide surveys in
January 2000). These heights are well above the maximum, worst-case persistent sand depth predictions
of 1.1 to 1.5 feet (for average and above average wave conditions, respectively). The nearshore reef with
sparse notation of surfgrass (1 turion per 10 square feet) would also not be overtopped under this
alternative. There would be no long-term significant impact to intertidal or nearshore surfgrass habitat.
Offshore of H and I Streets at depths -15 to -40 feet MLLW there are a variety of low relief reefs with
scattered sea fans, feather boas and at the greatest depths, giant kelp. Predicted sedimentation does not
overtop most of the reefs. Under worst-case model predictions, 0.27 acre of subclimax reef habitat with
sparse feather boa would experience sedimentation for up to two years. This potential impact, under
worst-case model predictions, would not be significant because sediment would not completely cover the
reef, feather boa kelp is tolerant of some sedimentation, and has life characteristics that favor rapid
recolonization. There would be no long-term adverse impact to the Marine Life Refuge. R
• Potential Indirect Impacts Near Solana Beach. Sand and reef habitats occur offshore and to the
north and south of the receiver site. Intertidal hard substrate occurs in localized patches north and south

4.4 Biological Resources
Regional Beach Sand Project EIR/EA Page 4.4-3599-69\SANDAG EIREA 4.1 to 4.13.wpd 7/17/00
of the receiver site and varies considerably from non-vegetated low relief benches and rock, low relief
vegetated with opportunistic species, to more developed areas that support surfgrass. Intertidal surfgrass
was mapped in January 2000 north of the receiver site at “Pill Box” reef (offshore of Helix Avenue in
Figure 4.4-8), near Tide Park and at “Table Tops” reef (offshore Ocean Street in Figure 4.4-8). Nearshore
hard substrate includes low relief benches that start around the entrance to Fletcher Cove and extend
further north, and higher relief areas near Tide Park and “Table Tops” reef. Nearshore reefs also occur
offshore the southern end of the receiver site and extend further south. Historically, giant kelp has had a
relatively high persistence offshore and north and south of the receiver site at depths greater than -25 feet
MLLW, and less persistence at shallower depths. Kelp canopy was not present in the vicinity of the
receiver site 1999 probably due to El Niño associated losses.
Pill Box reef, which is closest to the site, is not predicted to be a sand depositional area. Less than four
inches of sand above the average profile is predicted under above average wave conditions, and no
measurable persistent sedimentation is predicted under average waves conditions. Predicted sand depths
are well within the range of historical average seasonal differences in sand depth. Furthermore, no
substantial burial of the reef is expected given that predominant relief heights range between one and four
feet. No measurable persistent sedimentation is predicted for the intertidal surfgrass bed at Pill Box reef
and there would be no significant project-related impact.
No measurable persistent sedimentation is predicted for intertidal surfgrass beds located near Tide Park
or at Table Tops reef. Similarly, nearshore reef and historic kelp bed areas near Tide Park and Table Tops
reef are predicted to receive negligible (about two inches) or no persistent sedimentation. Additionally, no
persistent sedimentation is predicted for intertidal, nearshore reef, and historic kelp bed areas offshore and
to the south of the receiver site. Impacts to these resources at these locations would, accordingly, be less
than significant.
As is seen in Figure 4.4-8, the nearshore area is characterized by numerous reefs, some with vegetation
and some without. As with all the nearshore zone, habitat at this location is subject to the dynamic forces
of nature. Areas that were obscured by kelp in January 2000 during the side-scan sonar survey were found
to be almost void of kelp when divers surveyed the same area in March 2000. Storms had removed much
of the kelp from the nearshore reef and only a few giant kelp plants had scattered occurrence on reefs less
than -25 feet MLLW. The winter reef heights range from one to two feet (mainly one and one-half foot)
and summer heights would be expected to be approximately one foot higher based on the historical average
differences in sand depths between winter and summer seasons. Model-predicted, worst-case sediment
4.4 Biological Resources
Page 4.4-36 Regional Beach Sand Project EIR/EA99-69\SANDAG EIREA 4.1 to 4.13.wpd 7/17/00
depths under this alternative would be under the heights of the reefs at this location and there would be no
significant impacts to remaining vegetation.
Partial sedimentation is, however, predicted under worst-case conditions at two areas supporting giant kelp
in deeper water. These two substrate locations are located between -25 and -35 feet MLLW offshore of
Pill Box reef, adjacent to, but not within, the areas of more persistent kelp as indicated by the 1997 kelp
canopy in Figure 4.4-8. These two substrate areas consist of both sparse juveniles and giant kelp and total
just over one acre. Based on the worst-case model predictions, these two reefs would receive partial
sedimentation, not burial, for no more than one year under above average wave conditions. The temporary
loss of kelp in non-persistent kelp bed areas would not be a significant impact. Substantial, persistent
sedimentation is not predicted for the more offshore, historical kelp beds as indicated by the 1997 kelp
cover in Figure 4.4-8 and there would be no significant impact at these locations.
• Potential Indirect Impacts North of Del Mar. Sand is the predominant habitat in the vicinity of the
Del Mar receiver site. Historic kelp bed locations indicate that most hard substrate is located further south
of the receiver site. Commercial fisherman indicate scattered rocks south of the site at depths of
approximately -25 feet MLLW, but the 1997 historic kelp canopy does not enter into the area mapped
in Figure 4.4-9. Intertidal surfgrass is located south of 15th Street, which indicates hard substrate as well.
The nearest hard substrate to the north includes commercial fishermen identified areas of scattered rock
near the mouth of San Dieguito Lagoon, historic kelp bed areas north of the lagoon, and intertidal and
nearshore reef north of the lagoon. The identified scattered rock off the lagoon mouth was surveyed in
February and March 2000 and the mapped hard substrate is shown in 4.4-9.
Under worst-case model predictions, the only areas of hard substrate with sediment risk are the scattered
rock locations identified by commercial fishermen. All hard substrates within this area included cobble and
rock relief without sensitive resources. They are vegetated only with opportunistic species such as coralline
algal turf. Given the lack of sensitive species, there would be no significant indirect impacts at this location.
Intertidal and nearshore reef areas to the north off San Dieguito Lagoon and to the south of the receiver
site are not predicted to be at risk from substantial sedimentation. Intertidal surfgrass beds located south
between the Del Mar and Torrey Pines receiver sites (not shown in mapped boundary of Figure 4.4-9) are
predicted to experience shallow sedimentation (less than one-half foot) under above average wave
conditions, but not under average wave conditions. That level of sedimentation would not be expected to
result in any long-term significant impacts to the surfgrass beds because they occur on higher relief reef.
4.4 Biological Resources
Regional Beach Sand Project EIR/EA Page 4.4-3799-69\SANDAG EIREA 4.1 to 4.13.wpd 7/17/00
Additionally, no measurable sedimentation is predicted for historic kelp bed locations to the north or south
of the receiver site.
• Potential Indirect Impacts at Imperial Beach. Sand is the predominant habitat offshore Imperial Beach
(Figure 4.4-12). Kelp have historically occurred offshore with low to moderate persistence at depths of
-20 to -35 MLLW which is at a minimum of 1,900 feet from the shoreline of Imperial Beach.
A maximum persistent depths of cover less than four inches is predicted for distances ranging from
approximately 1,900 to 2,300 feet offshore for one year (Figure 4.4-12). After the first year, maximum
persistent predicted sand is one inch. These estimates of sedimentation are within the historical average
differences in sand depth between winter and summer profiles at these distances offshore and there would
be no significant impact.
• Summary of Conclusion, Indirect Sedimentation Impacts. In conclusion, based on worst-case model
predictions, partial sedimentation could occur to hard substrate with indicator species near four receiver
sites: North Carlsbad, Batiquitos, Moonlight Beach, and Solana Beach. A total of 3.2 acres with giant kelp
could experience partial sedimentation off of North Carlsbad (0.73 acres), near Batiquitos (1.46 acres),
and near Solana Beach (1.05 acres). The impact is considered to be less than significant because the kelp
is generally sparse and located in a non-persistent kelp area. A 0.27 acre reef off Moonlight Beach is
predicted by the model to experience partial sedimentation and it contains a subclimax community of sparse
feather boa. Impacts would be less than significant in the long-term because sedimentation would not
overtop the reef and feather boa is characterized by rapid re-colonization. Finally, three small reefs totaling
0.24 acre, with some surfgrass, off of North Carlsbad may experience partial sedimentation under worst-
case conditions. This impact would also be less than significant because it is predicted to affect only one
growing season and the leaves would be well above the sand deposition levels, allowing for long-term
recovery.
Borrow Sites
Potential impacts to marine resources would be related to the dredge itself (direct and indirect) and
placement of the dredge equipment (pipelines, etc.). The following section addresses these impacts in that
order.

4.4 Biological Resources
Page 4.4-38 Regional Beach Sand Project EIR/EA99-69\SANDAG EIREA 4.1 to 4.13.wpd 7/17/00
Direct Impacts of Dredging
Approximately 330 acres of surface area would be needed to provide 2 million cy of sediment for
Alternative 1a from Oceanside to Imperial Beach. There are approximately 53 miles of coastline with a
variable shelf width at depths of 40 to 80 feet, or about 0.6 mile offshore. For this alternative, this acreage
represents less than two percent of the available shelf habitat. If SO-7 is expanded and SO-9/SO-6 are R
eliminated, the surface area would be approximately 318 acres which is slightly less overall. There would R
be no change to the impact conclusion regarding direct impacts. R
The dredging of sand sediments from the borrow sites would impact marine biota by the direct removal of
the organisms and alteration of habitat. All of the benthic infauna, epifaunal, and demersal organisms in the
area of excavation would be displaced or destroyed. The extent of the loss and/or displacement is directly
proportional to the area and amount of sediment removed at each site. As discussed in Section 3.4, the
infaunal and epifaunal communities within the dredge areas consist of broadly distributed species and none
would be significantly reduced at the population level from the loss of individuals within the dredge areas.
Mobile epibenthic macroinvertebrates and fish would be expected to move from areas being actively
dredged, but these species would not be lost to the ecosystem nor would migration patterns be affected.
This would be considered an adverse impact, but not significant.
Epibenthic invertebrates and fishes that feed upon benthic biota would suffer a localized, short-term loss
of prey. However, because the active area being dredged would be small and localized, short-term loss
of food on these organisms is judged to be adverse, but not significant.
Dredging at borrow sites would also have some beneficial aspects because many of the infaunal organisms
recruit rapidly to disturbed and newly exposed sediments. This produces heterogeneity in the environment,
which can contribute to increased biodiversity of the community. Furthermore, most epibenthic
invertebrates and demersal fish are opportunistic in their feeding. They could be attracted to disturbed
areas where feeding opportunities may be increased by dredging activity.
Concern has been expressed that borrow site excavations have the potential to trap organic material and
drift kelp. The accumulation and decay of excessive organic material could lead to altered water quality
parameters and possibly degraded benthic biota. However, these concerns have proven to be unfounded
for open coastal areas and in harbors with good tidal flushing (Appendix D). All of the borrow sites are

4.4 Biological Resources
Regional Beach Sand Project EIR/EA Page 4.4-3999-69\SANDAG EIREA 4.1 to 4.13.wpd 7/17/00
within open coastal areas and the potential for material trapping would be low. The impact would be less
than significant.
Indirect Impacts of Dredging
As discussed in Section 4.3, dredging of the borrow sites would cause localized turbidity plumes. Indirect
impacts may occur if turbidity plumes and siltation affect sensitive resources beyond the boundaries of the
dredge areas. Turbidity results from suspended particles in the water column that can reduce ambient light
levels and lead to siltation. Turbidity can have a number of adverse effects on marine biota. Turbidity can
reduce ambient light levels in the water, which can impact primary production of plankton and inhibit kelp
and algae recruitment and growth. Turbidity can also affect the feeding efficiency of filter feeding organisms,
including zooplankton.
The location and footprint of the dredge area for each borrow site has been designed to minimize both
direct and indirect impacts from the dredging operations. A minimum 500 foot buffer has been provided
between the dredge area and kelp or reef, except at SO-7 where there is one artificial reef approximately
350 feet distant. Table 4.3-1 provides estimates of the average turbidity plumes from each borrow site,
assuming the hopper dredge which is the worst-case condition for generating turbidity. As shown, they
would range from an estimated 72 to 544 feet and average about 260 feet. The borrow sites with higher
sand content (SO-7, MB-1 and SS-1) would generally have the smaller plumes. The plume estimates and
the nearby known resources of reefs and kelp (Table 3.4-6) were used to evaluate the potential indirect
impacts for each of the borrow sites. A detailed analysis by borrow site is provided in Appendix D;
however, since the impact conclusions would be identical for all sites, only a summary is provided in this
document.
In general, turbidity plumes from the borrow site are predicted to be small for this project as the sands to
be dredged are sandy sediments with low percentages of fines. All reefs and kelp would be beyond the
estimated length of average turbidity plumes. Site SO-6 would be the closest to any resources with
nearshore reefs approximately 500 feet distant and historical kelp shown as 500 feet distant. Kelp mapping
conducted in 1999 shows the nearest kelp was 3,000 feet away. While the probability for some turbidity
to occasionally reach reefs and/or kelp cannot be entirely eliminated, turbidity is a natural occurrence at
these sites. The artificial reefs at all borrow sites naturally experience increased turbidity from storms, rip
currents, and plumes from river and harbor discharges. Therefore, even though there is some potential for
turbidity plumes to reach reefs, the duration would be limited, and the actually amount of turbidity reaching

4.4 Biological Resources
Page 4.4-40 Regional Beach Sand Project EIR/EA99-69\SANDAG EIREA 4.1 to 4.13.wpd 7/17/00
the area would be expected to be within the range that these resources would naturally experience. Indirect
turbidity impacts would be less than significant.
Dredge Equipment Impacts
The placement of temporary pipelines, the deployment of anchors for moving the cutterhead dredge,
installation of the mono buoy for the hopper dredge, and vessel movements have the potential to affect
sensitive resources. To avoid significant impacts to sensitive resources (i.e., reef habitat with well
developed biota, kelp and kelp habitat, artificial reefs, and surfgrass) pipeline routes and vessel traffic need
to utilize corridors free from these resources. Similarly, anchor and anchor cables used to position the
dredge and to hold pipelines in place must avoid hard bottom habitats, kelp beds, and surfgrass. This is also
good operational practice, as anchors do not hold well on hard bottom. The relationship between
proposed sensitive resources and features at each borrow site is provided below.
SO-9. The proposed pipeline route for this borrow site extends about 10,500 feet south from the borrow
site about 3,000 feet south of the Oceanside Harbor and San Luis Rey River mouth where the pipeline
would then turn to the east and extend about 7,500 feet to the beach. If a hopper dredge is used, the mono
buoy would be located in water depths between 30 to 40 feet located between 2,600 and 4,500 feet,
respectively from the shore. There are no sensitive resources near the proposed pipeline pathway (Table
3.4-6). Commercial fishermen have indicated that there may be an isolated patch reef/scattered rock near
the pipeline route at about the –25-foot depth contour. If this reef exists at the indicated location, then
anchoring and emplacement of the mono buoy would need to avoid this reef with a 300-foot buffer zone.
No significant impacts are expected from the emplacement of temporary pipelines and mono buoy at this
location.
SO-7. There are two pipeline routes proposed for this site to replenish several receiver beaches. For the
South Carlsbad North site, the pipeline would run about 3,000 feet and go directly from the eastern area
of the borrow site to the beach just upcoast from the Batiquitos Lagoon. Sensitive resources in this area
includes a series of artificial reefs located along the eastern edge and inshore of the borrow site (Table 3.4-
6 and Figure 2-16). The locations of these reefs are known and all anchoring activities would have to avoid
these reefs. Near the shoreline where the submerged portion of the pipeline would be placed there are low
lying reefs and some potential surfgrass as identified by commercial fishermen. The pipeline has been
routed so as to go between the low lying reefs and be just south of the potential surfgrass area. If a hopper
dredge were used, the mono buoy would be located in water depths between 30 and 40 feet, which lies
4.4 Biological Resources
Regional Beach Sand Project EIR/EA Page 4.4-4199-69\SANDAG EIREA 4.1 to 4.13.wpd 7/17/00
between 1,500 and 1,875 feet from the shoreline, respectively. The location of the mono buoy could be
near the northern most artificial reef. The location for the mono buoy needs to be carefully positioned so
that all anchoring activities, both for the hopper dredge and for the installation of the mono buoy, avoids
these artificial reefs by at least 350 feet. No significant impacts are expected for the emplacement of
temporary pipelines and mono buoy at this location.
The second pipeline for this site would run from the eastern corner of the dredge area and run about 3,000
feet and go directly onshore to a location just south of the Batiquitos Lagoon. Sensitive resources near this
pipeline route include kelp and kelp habitat to the south, artificial reefs inshore and to the north, and
potential surfgrass habitat located south of the pipeline along the shoreline (Table 3.4-6). The pipeline R
location has been selected to avoid direct impacts to these resources and all anchoring activities would have R
to avoid these resources. Vessel traffic would have to avoid transits through the kelp or across the CDFG R
artificial reefs and anchoring of the dredge would have to avoid placing anchors in the kelp beds (refer to R
Section 2.4.1 and Table 2-8). If a hopper dredge were to be used, then the location of the mono buoy R
would be in water depths of between 30 and 40 feet located between 1,500 and 1,875 feet from the
shoreline, respectively. This location would be south of the artificial reefs and all anchoring activities
associated with mooring the hopper dredge and installing the mono buoy would have to avoid these reefs. R
The hopper dredge would be conditioned to avoid transiting over the CDFG reefs, either empty or full. R
Thus, no significant impacts are expected for the emplacement of temporary pipelines and mono buoy at R
this location. R
SO-6. The pipeline for this borrow site would go about 3,000 feet directly onshore from the borrow site
to the Cardiff beach. Sensitive resources and possible constraints include kelp and kelp habitats inshore
and to the north and the San Elijo outfall pipeline located to the south (Table 3.4-6). The proposed pipeline
route would avoid kelp habitat and reefs and run parallel to the outfall pipeline. Vessel traffic would have
to avoid transits through the kelp and anchoring of the dredge would have to avoid placing anchors in the
kelp beds. If a hopper dredge were to be used, then the location of the mono buoy would be in water
depths of between 30 and 40 feet located between 1,680 and 2,440 feet from the shoreline, respectively.
This location would be south of the kelp and reefs and north of the outfall pipeline. All anchoring activities
associated with mooring the hopper dredge and installing the mono buoy would have to avoid kelp habitat
and the outfall pipeline. No significant impacts are expected for the emplacement of temporary pipelines
and mono buoy at this location.

4.4 Biological Resources
Page 4.4-42 Regional Beach Sand Project EIR/EA99-69\SANDAG EIREA 4.1 to 4.13.wpd 7/17/00
SO-5. There are two pipeline routes proposed for this site to replenish three receiver beaches. For the
Solana Beach site, the pipeline would run about 7,500 feet and go from the northeastern corner running
northeast between the Solana Beach kelp beds and then turn east to the beach near Plaza Street. Sensitive
resources in this area include kelp beds and kelp habitat and in the nearshore area there are reefs and
surfgrass (Table 3.4-6). Even though these resources are mapped, the final location of the pipeline and
anchor placements would need to avoid kelp beds, vegetated reefs, and surfgrass resources. Near the
shoreline, where the submerged portion of the pipeline would be placed, there are low lying reefs and some
surfgrass. The pipeline has been routed to go between the mapped kelp beds and avoid vegetated reefs
and surfgrass areas. Vessel traffic would have to use corridors between the kelp bed and would not be
allowed to transit through the kelp bed.
If a hopper dredge were used, the mono buoy would be located in water depths between 30 and 40 feet,
which lies between 1,875 and 2,625 feet from the shoreline, respectively. The location of the mono buoy
would have to be inshore of the kelp bed and all anchoring activities, both for the hopper dredge and for
the installation of the mono buoy, would have to avoid kelp, kelp habitat, and reefs. The recovery of the
kelp beds from the recent El Niño has been rapid and aided by the colder than normal winter water
temperature. It is possible that the kelp beds may be too extensive to allow hopper dredge use at this site.
Final decision for selection of dredge type for this site may need to be postponed until the start of the
dredging when a kelp bed reconnaissance would be recommended. No significant impacts are expected
for the emplacement of temporary pipelines and mono buoy at this location.
The second pipeline for this site would run from the southeast corner of the dredge area and run about
4,000 feet and go directly onshore to a location at about 18th Street in Del Mar. Sensitive resources near
this pipeline route include possible kelp, low lying mud reefs to the south, and possible surfgrass to the north
near the shoreline (Table 3.4-6). The pipeline location has been selected to avoid these resources and all
anchoring activities would have to avoid these resources. If the kelp bed inshore of the borrow site is
present then the pipeline route would need to be altered to avoid kelp beds. Vessel traffic would have to
avoid transits through the kelp and anchoring of the dredge would have to avoid placing anchors in the kelp
beds.
If a hopper dredge were to be used, then the location of the mono buoy would be in water depths of
between 30 and 40 feet located between 1,875 and 2,625 feet from the shoreline, respectively. This
location would be south of the potential surfgrass area and north of the reefs and all anchoring activities
associated with mooring the hopper dredge and installing the mono buoy would have to avoid these reefs

4.4 Biological Resources
Regional Beach Sand Project EIR/EA Page 4.4-4399-69\SANDAG EIREA 4.1 to 4.13.wpd 7/17/00
and surfgrass areas. No significant impacts are expected for the emplacement of temporary pipelines and
mono buoy at this location.
MB-1. The pipeline from the Mission Bay borrow site would run from the eastern edge of the dredge area
and run about 4,500 feet directly onshore (Figure 2-19). There are no nearby sensitive resources and the
nearest resources are artificial reefs located over 1,000 feet from the proposed pipeline route (Table 3.4-
6). If a hopper dredge is used the mono buoy would be located in water depths between 30 to 40 feet
located between 1,875 and 3,000 feet, respectively from the shore. No significant impacts are expected
from the emplacement of temporary pipelines and mono buoy at this location.
SS-1. The pipeline from the Imperial Beach borrow site would run from the northeastern edge of the
dredge area and run about 6,000 feet northeast to the beach (Figure 2-20). There are no nearby sensitive
resources and the nearest resources are kelp beds located over 3,000 feet to the north (Table 3.4-6). If
a hopper dredge is used the mono buoy would be located in water depths between 30 to 40 feet located
between 2,400 and 4,875 feet, respectively, from the shore. No significant impacts are expected from the
emplacement of temporary pipelines and mono buoy at this location.
Mitigation Measures for Alternative 1a
In designing the Regional Beach Sand Project measures were taken to minimize impacts to biological
resources and avoid sensitive habitat areas. Pre-design field surveys were conducted to identify the least
sensitive areas for sand borrowing and placement. The selection of borrow sites and receiver beaches; the
placement of buoys, anchors, and pipelines; the selection of methods and equipment for dredging and
deposition of sand; and the establishment of buffer zones to protect sensitive areas were all specifically
selected to minimize biological impacts. Where potentially significant impacts were identified (i.e., impacts
to grunion spawning due to sand placement), measures were developed and incorporated into project
design to reduce these impacts to below a level of significance. Further project design features may be R
negotiated with the USFWS as part of the Section 7 process including scheduling selected sites early in or R
advance of nesting season and predator control. R
Although no significant impacts to sensitive marine resources are anticipated at the receiver sites or at
nearby locations where worst-case sedimentation risk has been predicted by the model, monitoring would
be implemented as described in Section 2.5 to verify that significant impacts do not occur. The monitoring
program would be effective from the date of issuance of an USACOE permit and four years after
4.4 Biological Resources
Page 4.4-44 Regional Beach Sand Project EIR/EA99-69\SANDAG EIREA 4.1 to 4.13.wpd 7/17/00
replenishment to confirm that sand discharge operations would not result in long-term, net loss of sensitive
marine resources. The final monitoring plan and subsequent monitoring would be conducted by a biologist
familiar with southern California marine waters and biological habitats. SANDAG would submit the final
monitoring plan to the USACOE for approval, in consultation with the resource agencies, at least 15
working days prior to initiating onshore discharge at the receiver sites. The monitoring reports would be
submitted to the USACOE and resource agencies by January 30th of each year.
SANDAG would mitigate any significant, long-term adverse impacts to sensitive marine resources that
were documented by the monitoring effort to have resulted from discharge activities via restoration or
creation of like habitat at a 1:1 ratio as described in Section 2.5. A “not-to-exceed” cap on mitigation costs
would be negotiated by SANDAG, similar to the previously permitted Navy Homeporting project.
Impacts of Alternative 1b
Under Alternative 1b, the proposed action would be implemented at the same 12 receiver sites using the
same six borrow sites as described for Alternative 1a. The differences would be: 1) under Alternative 1b,
the duration on site at several of the borrow and receiver sites would be extended due to the required
adherence to noise ordinances, and 2) the quantity of sand dredged and deposited on the beaches would
be less for the South Oceanside, North Carlsbad, Solana Beach, Del Mar, Torrey Pines, Mission Beach,
and Imperial Beach sites.
Receiver Sites
Direct impacts resulting from implementation of Alternative 1b would be similar to those identified for
Alternative 1a, as all receiver sites would be the same for both alternatives. The quantity of sand deposited
on the beaches would be less for the South Oceanside, North Carlsbad, Solana Beach, Del Mar, Torrey
Pines, Mission Beach, and Imperial Beach sites. Given the smaller quantity of sand, either the thickness
of the sand would be less, or the length would decrease. There would be no significant direct impacts
under Alternative 1a, and less sand would not result in any direct impacts beyond those previously
discussed.
Indirect impacts resulting from sediment transport related to movement of sands from the fill sites, and the
decreases in marine water quality associated with beach replenishment activities were analyzed in detail
under Alternative 1a. The quantity of sand deposited on the beaches would be less for the South

4.4 Biological Resources
Regional Beach Sand Project EIR/EA Page 4.4-4599-69\SANDAG EIREA 4.1 to 4.13.wpd 7/17/00
Oceanside, North Carlsbad, Solana Beach, Del Mar, Torrey Pines, Mission Beach, and Imperial Beach
sites, therefore, fewer relative impacts would be anticipated at these locations. No additional indirect
impacts beyond those previously discussed under Alternative 1a would be anticipated.
Borrow Sites
Under Alternative 1b, less sand would be dredged from borrow sites SO-9, SO-5, MB-1, and SS-1, as
smaller quantities would be deposited at the corresponding receiver sites. Under this alternative, it is
possible that the same underwater surface area would be affected, less than two percent of the shelf-area,
but dredged at a shallower depth. Alternatively, less surface area could be dredged at the same depths.
Either impact would be less than significant. The borrow sites would not be degraded as a result of the
proposed action because the impacted area is small and the biota appears to recover quickly from physical
alterations. As with Alternative 1a, there would be no significant indirect turbidity impacts from activity at
the borrow sites.
Mitigation Measures for Alternative 1b
As with Alternative 1a, there would be no direct or indirect significant impacts to marine resources;
however, SANDAG would implement a monitoring program for verification. That program is described
in Section 2.5. If significant, long-term adverse impacts to marine resources are documented by the
monitoring effort resulting from project discharge activities, then restoration or creation of like habitat at 1:1
ratio would be implemented as described in Section 2.5. A “not-to-exceed” cap on mitigation costs would
be negotiated by SANDAG, similar to the previously permitted Navy Homeporting project.
4.4.3 Alternative 2
Impacts of Alternative 2a
Receiver Sites
As with Alternative 1, the construction of receiver sites would directly impact marine life by burying
organisms within the footprint of the fill. As concluded in that alternative, where direct placement would
affect sand, cobble, or seasonal hard substrate, the impact would be less than significant due to rapid
recolonization of affected species, and because of project design features which would avoid impacts to

4.4 Biological Resources
Page 4.4-46 Regional Beach Sand Project EIR/EA99-69\SANDAG EIREA 4.1 to 4.13.wpd 7/17/00
California grunion where they may occur. In Alternative 2, there would be one new receiver site (South
Carlsbad South) and the size of the footprints would increase at the South Oceanside, South Carlsbad
North, Torrey Pines, Mission Beach and Imperial Beach receiver sites. Other receiver sites would be
eliminated and there would be no direct impacts at the North Carlsbad, Batiquitos, Leucadia, or Moonlight
Beach receiver sites.
Direct Impacts of Sand Placement
The potential effects at new or larger sites under this alternative are discussed below.
South Oceanside/Torrey Pines/Mission Beach/Imperial Beach. All of these receiver sites are
characterized by sand and/or sand and cobble in the larger footprint areas and greater fill quantities (refer
to Section 2.4). Direct impacts to marine resources would be identical, that is, less than significant.
South Carlsbad South. This receiver site would have a footprint of approximately 15 acres for
approximately 142,000 cy. Sand and cobble occur throughout the site. A localized hard substrate area,
approximately 185 feet in length, consisting of low relief rocks and bench with opportunistic coralline turf
algae and few marine resources occurs within the proposed toe of the slope of the fill (Figure 4.4-19).
Similar to the Solana Beach site, direct impacts would be less than significant, because the hard bottom
area lacks sensitive species and clearly experiences normal sediment activity. Significant direct impacts to
California grunion would be avoided.
Indirect Impacts
Under Alternative 2, the receiver sites at North Carlsbad and within the northern portion of the City of
Encinitas (excluding Cardiff) would not undergo replenishment. Receiver sites at South Oceanside, Torrey
Pines, Mission Beach and Imperial Beach would receiver more sand. The receiver site at South Carlsbad
South would receive sand that it would not receive under Alternative 1. The pattern of sand placement
would not change the significance conclusions regarding temporary reduction in foraging prey for shorebirds
or turbidity at receiver sites; indirect impacts would be less than significant. There would be relative
differences; however, because there would be no temporary prey reductions or turbidity at those locations
where sand would not be placed.
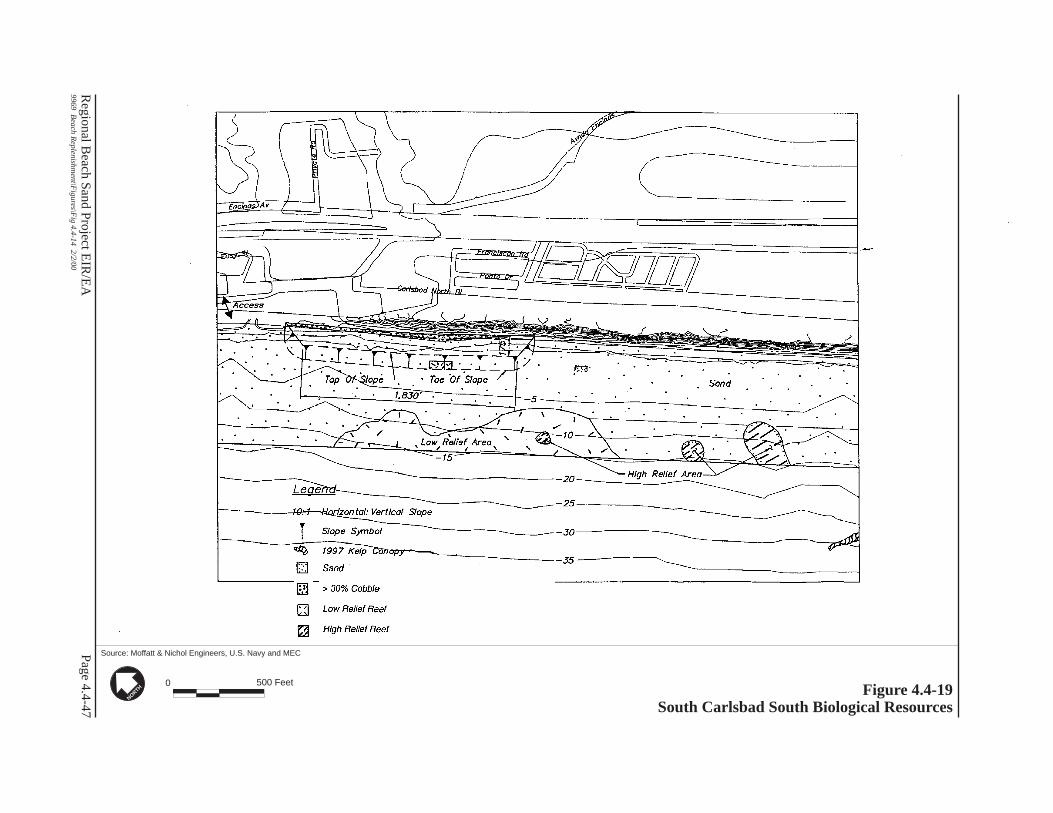
Page 4.4-47
Source: Moffatt & Nichol Engineers, U.S. Navy and MEC
Regional B
each Sand Project EIR
/EA
9969 Beach R
eplenishment\F
igures\Fig 4.4-14 2/2/00
Figure 4.4-19South Carlsbad South Biological Resources
NORTH
500 Feet0

4.4 Biological Resources
Page 4.4-48 Regional Beach Sand Project EIR/EA99-69\SANDAG EIREA 4.1 to 4.13.wpd 7/17/00
The variation in sand replenishment would also have a relative difference in potential indirect sediment
transport impacts, although there would be no significant indirect sedimentation impacts to marine resources
under Alternative 2. The key difference under Alternative 2 would be the change in the patterns of potential
sedimentation risk. Under Alternative 1, areas of greater sedimentation risk were identified off South
Oceanside, south of North Carlsbad, near Batiquitos, near Moonlight Beach, north of Solana Beach, north
of Del Mar, and off Imperial Beach. Each of these same areas is addressed below to allow for comparison
of alternatives. There would be no measurable sedimentation at resources near the South Carlsbad South
receiver site, and it is not discussed further in this text (Appendix D). Indirect sediment impacts at Torrey
Pines, Mission Beach and Imperial Beach would not be significant even with the greater quantity of sand
associated with this alternative (refer to the 3 million cy analysis at these three receiver sites in Appendix
D).
It should be noted that this complete alternative is not evaluated in Appendix D. The three southern-most
sites are identical to the 3 million cy alternative that is evaluated in Appendix D. Other significance
conclusion are based on predicted patterns as derived from the 2 million cy analysis in Appendix D,
professional judgement and worst-case assumptions. The intent is to provide full disclosure of the potential
worst-case indirect impacts.
Potential Indirect Sedimentation Impacts Near Oceanside. Marine resources near South Oceanside
are limited as most of the nearshore area is sand. Sand was mapped previously by the Navy at -10, -20
and -30 isobaths (Department of the Navy 1997a, 1997b). Isolated scattered rock identified by
commercial fisherman have been verified in one location; specifically, at the southern end of the receiver
site where worst-case sedimentation risk was predicted by the model for Alternative 1. Under Alternative
2, the amount of sand would be greater than under Alternative 1 but the receiver site would be 5,600 feet
longer (over one mile to the north) and the beach width after sand placement would be 60 feet narrower.
While the replenishment material would enter the seasonal sand cycle and result in some indirect
sedimentation, the indirect impact would not be any greater than assumed under Alternative 1. This is
because the material on the narrower, longer beach would be relatively less exposed to the dynamic system
and would not erode as fast. Also, it would be spread further north and would not likely result in
sedimentation risks greater than those identified under Alternative 1 (Moffatt & Nichol 2000d).
Mapped hard substrate is primarily cobble and rock relief with no sensitive species. Two locations with
scattered sea fans are at the model-predicted seaward edge of the area of higher sedimentation risk.
Empirical data from replenishment projects in 1983 and 1988 indicate no obvious sedimentation at the
4.4 Biological Resources
Regional Beach Sand Project EIR/EA Page 4.4-4999-69\SANDAG EIREA 4.1 to 4.13.wpd 7/17/00
distances where hard substrate is either mapped or indicated by commercial fisherman. The indirect
sediment impacts under this alternative would be the less than significant.
Potential Indirect Sedimentation Impacts Near North Carlsbad. Under Alternative 2, there would be
no replenishment at the North Carlsbad receiver site, but a greater amount would be placed at the South
Oceanside receiver site and that greater amount would be configured differently. Under Alternative 1, the
total replenishment amount at South Oceanside and North Carlsbad would be 620,000 cy, while under
Alternative 2 the total would be 570,000. Sediment transport would continue to be toward the south,
although 50,000 cy less sand would be introduced to the system overall, that sand would be less likely to
erode from the South Oceanside receiver sites at as fast a rate and it would have farther to travel to reach
the North Carlsbad sediment risk area. While the potential for worst-case, indirect sedimentation would
certainly be less at this location under Alternative 2 than under Alternative 1, the transport patterns under
this alternative have not been modeled and it is difficult to predict with certainty how much less. Under
Alternative 1, an area of approximately 0.13 acre of surfgrass and 0.73 acre with giant kelp would receive
partial sedimentation based on worst-case model predictions. Under Alternative 2, the area to experience
partial inundation would be less, but this analysis does not speculate how much less. In either case, the
indirect impact would be less than significant.
Potential Indirect Sedimentation Impacts Near Batiquitos/Moonlight Beach. Under Alternative 2
neither of these two receiver sites would receive sand, nor would the Leucadia receiver site located in
between these two locations. Because there would be no sand introduced in this area of the coast, there
would be no potential indirect sedimentation impacts under this alternative.
Potential Indirect Sedimentation Impacts North of Solana Beach and North of Del Mar. Under
Alternative 2, these two receiver sites would receive the same amount of replenishment material as under
Alternative 1 and the potential impacts would be identical. The area of sedimentation risk off Del Mar is
characterized by cobble and rock relief with no sensitive indicators. There would be no significant impact.
North of Solana Beach there is the worst-case potential for sedimentation to result in partial sedimentation
on two reefs (totaling approximately one acre) with both sparse juveniles and giant kelp. The temporary
loss of kelp in a non-persistent kelp bed area would not be a significant impact.
Summary of Indirect Sedimentation Impacts. Under Alternative 2a, worst-case, conservative estimates
of partial sedimentation impacts total just over two acres. Near North Carlsbad, potential impacts could
occur to less than 1.73 acres with giant kelp and less than 0.24 acre with surfgrass. This acreage amount
4.4 Biological Resources
Page 4.4-50 Regional Beach Sand Project EIR/EA99-69\SANDAG EIREA 4.1 to 4.13.wpd 7/17/00
is likely an over-estimation. There is also the potential for partial sedimentation on reef habitat with giant
kelp near Solana Beach totaling 1.05 acres, based on worst-case model predictions. Impacts at all these
locations would be less than significant because the surfgrass leaves would extend well above the predicted
sand deposition levels, allowing for long-term recovery, and the kelp is generally sparse and in non-
persistent kelp locations.
Borrow Sites
As with Alternative 1, the potential effects at borrow sites are described in terms of direct and indirect
impacts, plus dredge equipment.
Direct Impacts of Dredging
Alternative 2a would require about 330 acres of surface area for dredging or less than two percent of the
shelf habitat, however, because more material would be needed from borrow sites MB-1 and SS-1, the
depth of dredge would be one to three feet deeper at these locations. As discussed in the previous analysis
for Alternative 1a, the borrow sites would not be degraded as a result of the proposed action. Recovery
of the infauna appears to be rapid and undergoes a succession dependent upon grain size. Fish and
macroinvertebrates are plentiful and diversity appears to be enhanced within the excavated areas. While
abundances may be lower for some period, fish within the borrow excavations tend to be larger. Although
the presence of the borrow excavations would constitute a long-term alteration of benthic habitat with
impacts on species composition, the impact would not be significant. The impacted area would be relatively
small and the biota appears to recover quicker than the physical alterations.
Indirect Impacts of Dredging
All sensitive reef and kelp resources would have a 500-foot buffer, except at SO-7 where one artificial reef
would be 350 feet distant, so turbidity at those locations would not be greater than normal conditions. Even
with additional sand dredged from MB-1 and SS-1, the buffers would be retained and turbidity plumes
would be localized. These two sites in particular have high sand content and low silt levels with accordingly
small turbidity plumes.
4.4 Biological Resources
Regional Beach Sand Project EIR/EA Page 4.4-5199-69\SANDAG EIREA 4.1 to 4.13.wpd 7/17/00
Dredge Equipment Impacts
Dredging operations would be the same as those discussed under Alternative 1. Therefore, impacts
resulting from implementation of Alternative 2a would be similar to those identified for Alternative 1a. No
additional impacts beyond those previously discussed under Alternative 1a would be anticipated.
Mitigation Measures for Alternative 2a
As described under Alternative 1a, measures were taken during design to minimize impacts to biological
resources and avoid sensitive habitat areas. Where potentially significant impacts were identified (i.e.,
impacts to grunion spawning due to sand placement), measures were developed and incorporated into
project design to reduce these impacts to below a level of significance (refer to Section 2.5). Additionally,
monitoring would be implemented as described in Section 2.5 to verify that significant indirect sedimentation
impacts do not occur. If significant, long-term adverse impacts to sensitive marine resources are
documented by the monitoring effort to have resulted from discharge activities, SANDAG would mitigate
via restoration or creation of like habitat at a 1:1 ratio as described in Section 2.5. A “not-to-exceed” cap
on mitigation costs would be negotiated by SANDAG, similar to the previously permitted Navy
Homeporting project.
Impacts of Alternative 2b
Receiver Sites
Direct impacts resulting from implementation of Alternative 2b would be similar to those identified for
Alternative 2a, as all receiver sites would be the same. The relative quantity of sand deposited on the
beaches would be less for the South Oceanside, North Carlsbad, Solana Beach, Del Mar, Torrey Pines,
Mission Beach, and Imperial Beach sites. Given the smaller quantity of sand, either the thickness of the
sand would be less, or the length would decrease. There would be no significant direct impacts under
Alternative 2a, and less sand would not result in any direct impacts beyond those previously discussed.
Indirect impacts resulting from sediment transport related to movement of sands from the fill sites, and the
decreases in marine water quality associated with beach replenishment activities were analyzed in detail
under Alternative 2a.
4.4 Biological Resources
Page 4.4-52 Regional Beach Sand Project EIR/EA99-69\SANDAG EIREA 4.1 to 4.13.wpd 7/17/00
Borrow Sites
Under Alternative 2b, less sand would be dredged from borrow sites SO-9, SO-5, MB-1, and SS-1, as
smaller quantities would be deposited at the corresponding receiver sites. Under this alternative, it is
possible that the same underwater surface area would be affected, 1.8 percent of the shelf-area, but
dredged at a shallower depth. Alternatively, less surface area could be dredged at the same depths. Either
impact would be less than significant. The borrow sites would not be degraded as a result of the proposed
action because the impacted area is small and the biota would recover quickly. As with Alternative 2a,
there would be no significant indirect turbidity impacts from activity at the borrow sites.
Mitigation Measures for Alternative 2b
As with Alternative 2a, there would be no direct or indirect significant impacts to marine resources;
however, SANDAG would implement a monitoring program for verification. That program is described
in Section 2.5. If significant, long-term adverse impacts to marine resources are documented by the
monitoring effort resulting from project discharge activities, then restoration or creation of like habitat at 1:1
ratio would be implemented as described in Section 2.5. A “not-to-exceed” cap on mitigation costs would
be negotiated by SANDAG, similar to the previously permitted Navy Homeporting project.
4.4.4 No Action Alternative
Under this alternative, there would be no direct or indirect effects of material removal at the borrow sites.
The potential for increased biodiversity at borrow sites would not be realized. There would be no potential
for even partial project-related sedimentation to marine resources as no new sand would be introduced;
however, there would also be no potential for improved shore bird and grunion habitat at currently cobble-
filled beaches.
4.5 Cultural Resources
Regional Beach Sand Project EIR/EA Page 4.5-199-69\SANDAG EIREA 4.1 to 4.13.wpd 7/17/00
4.5 CULTURAL RESOURCES
This analysis is summarized from a cultural resources technical report included as Appendix E. The season R
of construction has no bearing on the potential impact evaluation. R
4.5.1 Significance Criteria
The federal criteria used to evaluate resources that may be affected by this project are those provided in
the NHPA. The National Register criteria are presented in 36 C.F.R. 60 as follows:
The quality of significance in American history, architecture, archeology, and culture is present
in districts, buildings, structures, and objects that possess integrity of location, design, setting,
materials, workmanship, feeling, and association, and:
A. That are associated with events that have made a significant contribution to the broad
patterns of our history; or
B. That are associated with the lives of persons significant in our past; or
C. That embody the distinctive characteristics of a type, period, or method of
construction, or that represent the work of a master, or that possess high artistic
values, or that represent a significant and distinguishable entity whose components
may lack individual distinction; or
D. That have yielded, or may be likely to yield, information important in prehistory or
history.
A cultural resource is considered “historically significant” under CEQA if the resource meets
the criteria for listing on the California Register of Historical Resources. These criteria define
an “important” archaeological resource as one which:
A. Is associated with events that have made a significant contribution to the broad
patterns of California’s history and cultural heritage; or
B. Is associated with the lives of persons important in our past; or
C. Embodies the distinctive characteristics of a type, period, region, or method of
construction, or represents the work of an important creative individual, or possess
high artistic values; or

4.5 Cultural Resources
Page 4.5-2 Regional Beach Sand Project EIR/EA99-69\SANDAG EIREA 4.1 to 4.13.wpd 7/17/00
D. Has yielded, or may be likely to yield, information important in prehistory or history.
4.5.2 Alternative 1
Impacts of Alternative 1a
Evaluations of potential impacts to cultural resources within proposed borrow sites can be considered in
terms of (1) prehistoric resources, where previously exposed river valleys were available for human
habitation and remaining artifacts would be contained in now buried materials; and (2) historic resources,
where shipwrecks and other more modern human artifacts may be located. Table 4.5-1 identifies the
probability for prehistoric resources to be located within a dredge area as well as the targets in the side-
scan sonar which suggests the need for further investigation of potential historic resources. Side-scan
targets can be difficult to interpret and noted targets may, in fact, be non-sensitive resources such as
scattered gravel or a bed of sand dollars. Methods to determine with certainty include field verification by
diver or remotely operated vehicle (ROV).
Table 4.5-1Summary of Cultural Resource Investigation Results at Borrow Sites
Borrow SitePotential for Occurrence
of Prehistoric Materials in Dredge Area(1)Potential for Occurrence of Historic Resources
in Dredge Area(2)
SO-9 High, but maximum potential below ninefeet.
12 identified targets; all likely remains of scattered Rrock reef experiment, no-side scan sonar data for Rapproximately 10 percent of dredge area
SO-7 Moderate None
SO-6 High None(3)
SO-5 Moderate to High None
MB-1 Moderate to High, maximum potentialbelow 12 feet
3 identified targets
SS-1 High No side scan sonar available(1) Based on dredge area location relative to historic river channel.(2) Based on interpretation of side-scan sonar data.(3) Identified target, likely shipwreck, offshore from western boundary, 250 foot buffer must be maintained during
dredge

4.5 Cultural Resources
Regional Beach Sand Project EIR/EA Page 4.5-399-69\SANDAG EIREA 4.1 to 4.13.wpd 7/17/00
During project design, every effort has been made to locate the dredge areas to avoid high probability
locations to the maximum extent possible; however, the dredge area location is driven by numerous factors
including sand quantity, biological resources (i.e., avoiding reefs) and engineering considerations (i.e.,
avoiding ocean outfalls). Additionally, in the underwater environment within which prehistoric resources
may be located it is extremely difficult to apply the typical terrestrial methodology of surveys for resources,
testing to determine significance, data recovery and/or site avoidance. Therefore, when determining
potential for occurrence of prehistoric materials, a conservative conclusion has been provided.
To avoid potentially significant impacts, a monitoring program has been defined in Section 2.5 that would
be implemented prior to, and during, the dredge. As part of that program, verification of potential historic
resources would be undertaken at SO-9, MB-1 and SS-1 using divers, ROV’s and/or supplementary side
scan sonar. Any substantial historic resources would be avoided and a buffer defined to avoid potential
indirect impacts. Monitoring would be instituted as material is dredged from each borrow site. If
monitoring identifies substantial artifacts suggesting that dredging had entered into an archaeological site,
then the dredging operation would be permanently relocated away from that site and a 250-foot wide buffer
would be established around the site. The location of the site would be recorded for the appropriate
clearinghouse.
Mitigation Measures for Alternative 1a
As described in Section 2.5, a monitoring program would be implemented prior to and during the dredge
operation to verify no dredging impacts to underwater archaeological resources (historic or prehistoric).
If sites are identified, they would be recorded and avoided. No further measures would be necessary.
Impacts/Mitigation Measures for Alternative 1b
This alternative’s impacts would be similar to Alternative 1a, and no significant impacts would occur. No
mitigation measures would be necessary.
4.5 Cultural Resources
Page 4.5-4 Regional Beach Sand Project EIR/EA99-69\SANDAG EIREA 4.1 to 4.13.wpd 7/17/00
4.5.3 Alternative 2
Impacts of Alternative 2a
Under Alternative 2a, the dredge volume would increase at SO-5, MB-1 and SS-1 when compared to
Alternative 1. The increased volume at MB-1 and SS-1 would result dredging at greater depths, an
incremental increase of three feet and one foot, respectively. This would incrementally increase the
potential for entering sediments with cultural resources. The increased depth would not change the
conclusions in Table 4.5-1. The increased volume could be achieved at SO-5 without a change in acreage
or depth of the dredge area. As with Alternative 1, a monitoring program would be implemented to verify
that no significant impacts would occur.
Mitigation Measures for Alternative 2a
As described in Section 2.5, a monitoring program would be implemented to verify no dredging impacts
to underwater cultural resources. If encountered, the site would be recorded and avoided. No further
measures would be necessary.
Impacts/Mitigation Measures for Alternative 2b
This alternative’s impacts would be similar to Alternative 2a, and no significant impacts would occur. No
mitigation measures would be necessary.
4.5.4 No Action Alternative
Under the No Action Alternative, no dredging or beach replenishment activities would occur, and erosion
at the region’s beaches would continue without intervention. No impacts to cultural resources would occur,
and no monitoring would be instituted.
4.6 Land and Water Use
Regional Beach Sand Project EIR/EA Page 4.6-199-69\sect-04.06.wpd 7/19/00
4.6 LAND AND WATER USE
This analysis of land and water use impacts addresses the alternatives’ compatibility with existing and
planned land uses; conformance with local land use plans; and compatibility with recreational uses.
Compatibility with existing land and water uses is assessed to determine to whether the proposed land and
water uses (i.e., dredging and beach replenishment) would conflict with existing, planned, and adjacent
uses. Conformance with land use plans is based on consistency between the proposed use and adopted
plans such as the general plans discussed in Section 3.4. Permitting requirements are discussed in Section
2.7 of this EIR/EA. Noise-related land use issues are described in Section 4.13. Information regarding
potential impacts to commercial fishing operations is found in Section 4.8 (Socioeconomics).
4.6.1 Significance Criteria
The significance of potential land use impacts associated with implementation of the proposed action is
based on the level of land use sensitivity in areas that would be affected. In general, land use and
recreational impacts would be significant if they would:
• be inconsistent or non-compliant with applicable land use patterns or policies;
• preclude the viability of existing or planned land use activities;
• preclude continued use or occupation of an area;
• be incompatible with adjacent or vicinity land use to the extent that public health or safety is threatened;
or
• result in long-term impacts to the quality or quantity of existing recreational opportunities.
4.6.2 Alternative 1
Impacts of Alternative 1a
Receiver Sites
As described in Section 3.6, the general plans, community plans, and LCP’s of all applicable jurisdictions
recognize the need to implement beach replenishment activities and the proposed project would be
consistent with guiding documents at all receiver sites. In fact, several jurisdictions have adopted policies
4.6 Land and Water Use
Page 4.6-2 Regional Beach Sand Project EIR/EA99-69\sect-04.06.wpd 7/19/00
and goals specifically in support of a regional approach to sand replenishment and erosion control. Artificial
nourishment with excavated sand is clearly identified as an acceptable response for erosion control.
Recreational activities at all receiver sites include some or all of the following: surfing, swimming, diving, surf
fishing, sport fishing, sailing, picnicking, and sun bathing. Several beaches support adjacent public
campgrounds. During replenishment, there would be temporary beach closures but following project
completion, total recreational beach area would be increased. Both the short-term closure and long-term
benefits are addressed below.
Because of public safety concerns associated with heavy equipment operations on the beach, replenishment
operations would require the receiver site and offshore area be closed temporarily to the public during
construction. The length of closure would vary by receiver site; the greater the volume of sand the longer
the period of restricted access. (Table 2-2 identifies the total construction period associated with each
receiver site, including mobilization and demobilization.) Access restriction would result in a temporary
redistribution of beach activities to surrounding areas. However, the area restricted would be limited only
to the smaller area where activity would occur over a daily period, not the entire length of the receiver site.
This length ranges from 100 to 325 feet closed per day, and averages about 200 feet (Table 2-4).
The potential affect to beach users would be greatest during summer periods of high activity so initiating R
construction during spring instead of late summer would result in more potential conflicts. However, sand R
placement in spring would maximize the available material during the peak usage period because it would R
be less likely washed away by winter storms. As noted in Section 2.4.1, SANDAG would coordinate the R
schedule at individual receiver sites to the extent possible to avoid major holidays and special events. R
The worst-case situation would occur at the South Oceanside receiver site which would receive 380,000
cy of material over a 30-day period. Within that month, the typical length closed on a given day would be
175 feet. Receiver sites at South Carlsbad North, Batiquitos, Leucadia, Moonlight Beach, Cardiff, Solana
Beach, Del Mar, Mission Beach, and Imperial Beach would have localized restrictions over an estimated
10 to 16 days. Construction at the Torrey Pines and North Carlsbad receiver sites would occur over
approximately 20 days. At all receiver sites, access restriction would be a temporary localized effect and
would not result in a permanent significant condition. Conversely, without beach replenishment, beach use
could decline as beaches continue to deteriorate (i.e., erode).
4.6 Land and Water Use
Regional Beach Sand Project EIR/EA Page 4.6-399-69\sect-04.06.wpd 7/19/00
With the movement of replenished beach sand through the littoral processes, offshore bars could develop
over time, thereby affecting surf breaks (i.e., beach breaks). Some sediment accumulation is anticipated
in reef areas, however, natural transport processes move sediments through these reef areas under normal
conditions. Changes in the formation of offshore sandbars is a naturally occurring event, and there are
seasonal periodic changes to surfing localities. This project would not have a significant, long-term impact
to surfing.
Once the receiver sites have been replenished, recreation activities would resume and be enhanced.
Replenishment would create additional recreational beach area as calculated in Appendix C. Following
replenishment, an estimated 85 acres of new recreational area would be created. It should be noted that
the benefit is also temporary. At the majority of locations, the added recreation beach would either not
persist for five years, or added beach area would be less than one acre after five years. Where beach area
would be created, an estimated 252 acres of recreational beach currently exists. Post-construction, total
recreational beach area would be approximately 378 acres.
No direct impacts would occur to the City of Encinitas Marine Life Refuge because there would be no sand R
placement. Potential impacts to reefs and biological resources in the vicinity are discussed in Section 4.4. R
Finally, the replenishment action would not preclude the viability of any planned land use, either onshore
or offshore.
Borrow Sites
At all proposed borrow sites, kelp harvesting operations would not be affected. The borrow locations have
been specifically sited to avoid these resources. For information on impacts to kelp, refer to Section 4.4
(Biological Resources). For information on impacts to commercial fishing, refer to Section 4.8.
Whale watching activities would not be adversely affected near any of the proposed borrow sites. As
described in Section 4.4 (Biological Resources), marine mammals such as whales would not be adversely
affected. Therefore, the dredging and replenishment operations would not negatively affect whale watching
operations.

4.6 Land and Water Use
Page 4.6-4 Regional Beach Sand Project EIR/EA99-69\sect-04.06.wpd 7/19/00
Similarly, recreational fishing activities would not be significantly affected by the proposed dredging or
replenishment operations. Boaters would be restricted from areas in the vicinity of the dredge sites and
pipelines, but this would be a short-term effect to localized areas.
SO-9
Direct impacts to the 12 artificial reefs near SO-9 would be avoided given their distance to the proposed R
dredging (a minimum of 500 feet for mapped reefs and 350 feet on recently re-located experimental rock R
scatter). Consultation with CDFG would be necessary prior to dredging for purposes of notification and R
a letter of non-objection must be obtained from CDFG (Bedford 1999). While the distance to these
artificial reefs varies, and distant reefs may be used for recreational diving during the dredge, the reefs that
are closest (up to 500 feet) may be closed for safety reasons. In the worst-case scenario, recreational
diving would be temporarily restricted at the nearest reefs for a period of approximately 50 days (worst- R
case). Given the availability of other available dive sites in the region, and the short-term nature of closure, R
impacts would not be significant.
SO-7
The Encina Wastewater Authority’s sewer line (1.6 miles north) and SONGS artificial reef (750 feet north)
would not be negatively impacted by dredging operations at SO-7 because both are of sufficient distance
away to avoid impacts during dredging at this borrow source. The 12 artificial reefs in the vicinity of SO-7
would also be avoided. Consultation with CDFG would be necessary before dredging could occur for
purposes of notification and a letter of non-objection must be obtained from CDFG (Bedford 1999).
Recreational diving would be temporarily restricted for a period of approximately 50 days (possibly longer R
if SO-9 and/or SO-6 are not utilized). Given the availability of other available dive sites in the region, and R
the short-term nature of closure, impacts would not be significant.
SO-6
Due to the short-term nature of dredging and distance from the underwater park, no significant long-term
impacts to the features within the lease area are anticipated.
4.6 Land and Water Use
Regional Beach Sand Project EIR/EA Page 4.6-599-69\sect-04.06.wpd 7/19/00
SO-5
The San Diego-La Jolla Underwater Park is located approximately two miles south of SO-5, which is
adequate distance to avoid any adverse impacts to the park. No other land or water use impacts would
occur under Alternative 1.
MB-1
MB-1 is within the Mission Bay Artificial Reef (which includes Wreck Alley) and is adjacent to the San
Diego Underwater Recreation Area. As illustrated in Figure 2-19, there are no artificial reefs within the
dredge area itself. The closest artificial reef utilized primarily by sport fishermen is the Mission Bay Bridge
Wreckage Site No. 1, located approximately 1,000 feet to the south. The closest sunken structures or
wrecks frequently utilized by sport scuba divers are the NOSC Tower, the Ruby E, and the Yukon, located
approximately 1,800, 2,000, and 3,000 feet from the dredge site, respectively. While these are the most
popular local wrecks for dive charter businesses as well as recreational divers, these artificial reefs/dive
sites would not be directly impacted during dredge operations. Turbidity plumes are not projected to reach
the dive sites. There may be increased underwater noise experienced by those visiting nearby underwater
sites, and dive and fishing vessels transiting between features may have to maneuver to avoid the dredge
operations, but dredging operations would be short-term (approximately 11 days). A letter of non-
objection from CDFG would be required for dredging activities within the MBAR (Bedford 1999).
Impacts would be less than significant.
SS-1
Given the distance from the borrow site to the City of San Diego outfall and ocean monitoring stations,
there would be no long-term effect from dredging activities.
Mitigation Measures for Alternative 1a
No significant impacts have been identified; accordingly, no mitigation measures are necessary.
Impacts/Mitigation Measures for Alternative 1b
This alternative would differ from Alternative 1a in that construction of the proposed action would comply
with applicable jurisdictions’ noise ordinances. Because dredging and replenishment activities would take
a longer amount of time, the receiver sites would be closed longer than under Alternative 1a (refer to Table
4.6 Land and Water Use
Page 4.6-6 Regional Beach Sand Project EIR/EA99-69\sect-04.06.wpd 7/19/00
2-2). Although this alternative would take longer to implement, activity at any given receiver site would be
short-term in nature and the length closed on any given day would be minimal (Table 2-4).
As with Alternative 1a, closure of the receiver sites would result in a short-term redistribution of
recreational activities to adjacent areas; however, replenishment would result in a beneficial impact overall.
In comparison to Alternative 1 a, there would be less sand at most beaches so the relative benefit would
decrease slightly. No significant long-term impacts to land and water use are anticipated. Accordingly,
no mitigation measures would be necessary.
4.6.3 Alternative 2
Impacts of Alternative 2a
Receiver Sites
Under this alternative, land use and recreation impacts would be similar to those described for Alternative
1, although the length of time and locations of receiver site access restriction would vary. There would be
no access restrictions at the North Carlsbad, Batiquitos, Leucadia, or Moonlight Beach receiver sites which
would eliminate short-term impacts, as well as benefits. Sand volumes would increase at the Oceanside,
South Carlsbad North, Del Mar, Torrey Pines, Mission Beach, and Imperial Beach receiver sites.
Maximum length of restricted access would continue to be the South Oceanside site which would be 42
days (Table 2-6). Other sites with more sand would experience additional construction (and restricted
access) for several days to a week. The South Carlsbad North site would have restricted access over a
total 13-day period. As discussed, access restriction would apply to a localized area and not the entire site.
Refer to Table 2-4 for typical lengths at specific receiver sites. Recreation impacts would be short-term
and would be less than significant at all receiver sites.
Replenishment under this alternative would also provide benefits by creating new recreational beach area.
A total of approximately 92 acres would be created but distributed at fewer locations relative to Alternative
1, for a total post-construction recreational beach area of approximately 345 acres. Long-term (five years)
beach area of one acre or greater would only be present at South Oceanside and Cardiff.

4.6 Land and Water Use
Regional Beach Sand Project EIR/EA Page 4.6-799-69\sect-04.06.wpd 7/19/00
Borrow Sites
Under this alternative, water use and recreation impacts would be similar to those described for Alternative
1. Differences between Alternative 1 and Alternative 2 also include relative recreation impacts at SO-9,
closure would be approximately 42 days instead of 50. At SO-7, the dredge area would be restricted for
32 days instead of 50. The overall impact would be short-term and less than significant.
Mitigation Measures for Alternative 2a
As no significant impacts to land and water use or recreation have been identified, no mitigation measures
would be necessary with implementation of this alternative.
Impacts/Mitigation Measures for Alternative 2b
This alternative would differ from Alternative 2a in that construction of the proposed action would comply
with applicable jurisdictions’ noise ordinances (refer to Table 2-6). Because dredging and replenishment
activities would take a longer amount of time, the receiver sites would be closed longer than under
Alternative 2a (refer to Table 2-4 and Table 2-6). Although this alternative would take longer to
implement, it would still be short-term. There would also be less relative benefit under this alternative as
the sand quantity would be less.
As with Alternative 2a, closure of the receiver sties would result in a short-term redistribution of
recreational activities to adjacent areas. Replenishment would result in a beneficial impact to recreation;
no significant impacts to land and water use are anticipated. Accordingly, no mitigation measures would
be necessary.
4.6.4 No Action Alternative
No dredging or beach replenishment activities would occur under the No Action Alternative. There would
be no land and water use or recreation impacts under this alternative and no mitigation measures would be
necessary. No recreational beach area would be created and this alternative would not fulfill the goals and
policies of the various general plans and LCPs as described in Section 3.6, nor satisfy the project purpose
and need.
4.7 Aesthetics
Regional Beach Sand Project EIR/EA Page 4.7-199-69\SANDAG EIREA 4.1 to 4.13.wpd 7/17/00
4.7 AESTHETICS
Construction of the project in spring instead of late summer would potentially increase the number of R
sensitive viewers experiencing the project, but that would not change the significance conclusion. R
4.7.1 Significance Criteria
San Diego’s coastal beaches are some of the region’s most important visual resources. For this reason,
the coastal areas of San Diego County are considered a highly sensitive visual resource. Coastal beaches
offer scenic views that are considered a trademark of the southern California area. Additionally, all of the
13 possible receiver sites would be visible to either residents, scenic drivers or recreationalists, and in some
cases all three types of viewers. For these viewer types the scenic quality does affect the value of an
activity and they are considered sensitive viewers. Therefore, construction or operation that would cause
permanent degradation of existing views along coastal beaches would be considered significant.
Degradation may result from scale and size of project features, site design, color and texture contrast, or
permanent introduction of light and glare.
4.7.2 Alternative 1
Under Alternative 1a, the beach nourishment activities could potentially occur over a 24-hour period, up
to seven days per week. This activity would provide the maximum sand within the minimum overall time
frame but would involve more disturbance in an average day. Additionally, lights may be necessary to
allow for construction after the sun sets.
Impacts of Alternative 1a
Receiver Sites/Temporary Pipeline Routes
South Oceanside
The proposed action would alter existing views along the receiver site during proposed beach replenishment
operations because a pipeline would discharge sand, grading equipment (typically two large machines)
would construct a training dike and move the sand and pipelines around the site, and several construction
personnel would operate the equipment. If the hopper dredge is used, then it would make periodic
4.7 Aesthetics
Page 4.7-2 Regional Beach Sand Project EIR/EA99-69\SANDAG EIREA 4.1 to 4.13.wpd 7/17/00
deliveries to the site. This boat would be anchored just offshore while the load of sand is delivered via
pipeline to the site. If the cutterhead dredge is used, delivery would be made entirely via pipeline.
Construction lights would be placed at the work place to allow for construction after daylight hours. Under
this construction scenario, activity and associated lighting could occur anytime within a 24-hour period.
The City of Oceanside has a Light Pollution Ordinance (Ordinance No. 091-46) which prohibits certain
types of outdoor lights and restricts outdoor lighting between 11:00 p.m. and sunrise. The intent of this
ordinance is to support Palomar Observatory by restricting certain light fixtures which emit undesirable light
rays into the night sky. There are exemptions for various activities and types of lighting. One exemption
allows outdoor facilities to remain illuminated to complete specific organized activities that are in progress
and under illumination at 11:00 p.m. The proposed construction lighting would be short-term in nature and
exempt.
The proposed action is anticipated to take up to 30 days at the South Oceanside receiver site. Sand
placement operations during this time would degrade existing coastal views in the area. Residents along the
site and users of Buccaneer Beach Park would have clear views of the activity when the sand placement
would occur near those specific uses. More distant views would be available for persons using the pier
or the Strand. Sand placement would not affect the entire length of the receiver site for the 30-day
construction period. Instead, approximately 175 linear feet would be affected in any one day. Sand
placement activities at the southern end of the receiver site would be over one mile from the Strand and
about 2,000 feet from Buccaneer Beach which would reduce the visual contrast of the action for those
viewers. The overall contrast of the action at a specific land use or individual sensitive viewer would vary
over time because the construction activities would be continually moving along the site length.
Subsequent to beach replenishment operations, the receiver site beach would be enhanced. Sand
replenishment would widen the existing beach, thereby eliminating views of the eroded beach area south
of Wisconsin Street. Operations would be short-term overall and the daily construction area would travel
down the beach which would reduce the visual contrast to any one sensitive viewer. The end result would
be enhancement of this important resource, and visual impacts would be considered less than significant.
Core samples have been taken from borrow site SO-9 which would supply the material for this receiver
site (Sea Surveyor 1999). The beach fill material from this borrow sites will likely be slightly darker in color
than existing beach sand due to organic materials in the sediment. As is typical in beach nourishment
projects, the material would be washed and reworked by waves, bleached under exposure to the sun, and
mixed with existing sand. Any discoloration of the sediment would be short-term (USACOE 1984) and
4.7 Aesthetics
Regional Beach Sand Project EIR/EA Page 4.7-399-69\SANDAG EIREA 4.1 to 4.13.wpd 7/17/00
no permanent adverse visual conditions would result from the discoloration of fill materials at the receiver
beach.
The delivery pipeline would make landfall south of 9th Street and be placed on the beach to reach the
receiver site. During construction, viewers along the Strand would see trucks and crew assembling the
pipeline which could take two to four days. In the remaining time period, the pipeline would be inert on
the beach. Because the pipeline would serve both the South Oceanside and the North Carlsbad receiver
sites, the pipeline could be on the beach for approximately 50 days. The pipeline would be clearly visible
when placed on the light sand because of its size (up to three feet in diameter) and dark color. However,
where the pipeline would be placed at the base of the Strand or along dark rip-rap the contrast would be
reduced overall. Views for most residents looking west at the beach would be substantially eliminated
because other features such as rip-rap would intervene. The visual contrast would be considered less than
significant, given the following: the presence of other man-made features such as sea walls and rip-rap
which reduce the visual contrast; the location of the pipe as far up the beach as possible to avoid wave
action, which would also reduce the strong contrast with light colored sand; and the temporary nature of
the feature.
North Carlsbad
Similar to the South Oceanside receiver site, views of the North Carlsbad receiver site would be degraded
during pumping and construction operations associated with the proposed action. At this site, the sand
fill area would be conducted entirely seaward of the 1998 surveyed mean high tide line. Immediately
following construction, the beach area directly in front of the existing revetment would remain at the current
elevation, approximately six feet above MLLW. At an estimated 35 feet seaward of the revetment, a slope
would extend up to the top of the replenishment fill at 12 feet above MLLW. Residents would view this
higher berm near the middle of the beach and extending seaward, the berm would not block views of the
ocean but would present a not-typical beach view. Immediately following the placement, wave action and
tentative beach maintenance would serve to flatten the berm and reduce the elevation difference.
Ultimately, replenishment would serve to enhance this degraded beach. Further, beach replenishment
operations would be short-term (approximately 20 days). No permanent adverse visual impact would
occur. Impacts to aesthetic resources would not be significant.
The sand source for this receiver site would be SO-9 which has slightly darker material due to the presence
of organics. Over time the fill material would be washed by waves, bleached by the sun, and mixed with
4.7 Aesthetics
Page 4.7-4 Regional Beach Sand Project EIR/EA99-69\SANDAG EIREA 4.1 to 4.13.wpd 7/17/00
the existing material to reduce the contrast. No permanent visual effects would result and the impact would
be less than significant.
The pipeline to serve this site would extend south from Oceanside. Where it would be located at the base
of the walkway or up against the existing slopes, the contrast would be reduced and much of the view from
existing residences would be obscured. Where it would be placed on sand not adjacent to the features,
it would be more visible. However, no permanent visual effects would result and the impact would be less
than significant.
South Carlsbad North
Views at this receiver site would be available to campers at the state park. During construction, which
would last approximately 15 days, the receiver site would be degraded from pumping and construction
operations. In any given day, approximately 200 linear feet would be affected by direct closure. However,
the proposed action would ultimately improve long-term views in the area through the enhancement of the
existing beach. Because of the short-term nature of the project and the fact that construction would move
along the site minimizing the visual contrast at any one location, no permanent adverse visual impact would
occur.
The dredged fill material for this site would come from SO-7. The material from this borrow site has been
found to be relatively light in color with less organics than the other borrow sites so the contrast between
the fill material and the existing sand would be reduced (Sea Surveyor 1999). Eventually, natural processes
including wave washing, sun exposure, and mixture with existing sand would eliminate any noticeable
differences between sediment color.
In a past sand replenishment project near this site, there has been very strong contrast between the receiver
site and the sand source. As a result, the replenished beach was not utilized by beach-goers until the color
contrast was reduced. The previous situation resulted when nourishment material from a roadway
construction project was placed on the beach. That material was very reddish in color and had a content
of 80 percent sand and 20 percent silt. The red color was linked to the silt layer which covered the sand
grains. Once the nourishment material was worked by wave action causing the silt to wash off, and the
remaining sand mixed with the existing sand, then the site was utilized. Under the currently proposed
project, the nourishment source will not be more than 10 percent silt. Additionally, the core samples from
the borrow site indicate that the nourishment material will not appear red. Therefore, while there will be

4.7 Aesthetics
Regional Beach Sand Project EIR/EA Page 4.7-599-69\SANDAG EIREA 4.1 to 4.13.wpd 7/17/00
a short-term color contrast between the receiver sand and nourishment material, it should not result in
public avoidance.
The pipeline for this receiver site would be located on the beach from just north of Batiquitos Lagoon to
the site. There are no permanent residents to view this temporary pipeline. Because the pipeline would
be located at the base of the bluffs it would be outside the field of vision for drivers along Carlsbad
Boulevard, except where the roadway is near the lagoon mouth and height differential would not obscure
views. The short-term nature of the pipeline and reduced visibility to sensitive viewers support a finding
of no significant impact.
Batiquitos
At this receiver site residents on the bluffs would be able to view the construction activity for approximately
12 days. As with the other receiver sites, the short-term nature of the impact would be out-weighed by
the overall enhancement of the beach. The visual impact of construction would be considered less than
significant. Material for nourishment would be from SO-7 which has relatively lighter sand color than from
other borrow sites, so the contrast between the existing and new material would be relatively less. Any
contrast would eventually be eliminated by wave action, exposure to the sun, and seasonal mixing.
The pipeline for this site would come directly onshore from the borrow site approximately 0.8 mile offshore.
The visual impact is discussed in the borrow site section below.
Leucadia
This receiver site is much like the southern portion of Batiquitos with residents along high bluffs viewing a
sand and cobble beach. Construction activities would occur over approximately 13 days and typically
cover 325 linear feet in a day. As with the other receiver sites, the overall contrast of the action at any
given sensitive viewer would vary over time because the construction activity would continually move down
the beach. The nourishment material would be from SO-7 which has relatively lighter in color material,
likely resulting in less contrast with the existing sand. The short-term visual change would not be considered
significant and the enhanced beach would result in a visual benefit.
The pipeline to serve this site would be located at the base of the bluffs. While visible, the contrast would
be minimized by its location next to a much larger cliff face and dark colored rip-rap. Additionally, the

4.7 Aesthetics
Page 4.7-6 Regional Beach Sand Project EIR/EA99-69\SANDAG EIREA 4.1 to 4.13.wpd 7/17/00
viewscape of expansive ocean would not be obscured for either beach users or residents. The visual
impact would not be significant.
Moonlight Beach
In this location the viewers would include not only residents on the bluff tops but park users at Moonlight
State Beach. Construction activity would occur over approximately 10 days with construction in a typical
day affecting approximately 150 linear feet of beach. As with the other receiver sites, the overall contrast
of the action would be reduced at any given sensitive viewer because the construction activity would
continually move down the beach. The material for this site would be from SO-7 which has relatively
lighter material likely resulting in less contrast with the existing sand. The short-term visual change would
not be considered significant and the enhanced beach would result in a visual benefit.
The pipeline in this location would be at the base of the bluffs only in the northern and southern portions.
At Moonlight State Beach Park, the pipe would be placed as far landward as possible. The visual contrast
would not be significant.
Cardiff
This receiver site is characterized completely by cobbles and placement of material would greatly enhance
the beach. Construction activities would occur over an approximately 11-day time period. Nearby viewers
can be characterized as drivers, users of the beach, and persons at Restaurant Row. There are residential
viewers in the hills to the north and south of San Elijo Lagoon. Their views include numerous elements
including the lagoon, beach and ocean. All material would be piped from borrow site SO-6 which has
organics similar to SO-9. The contrast between the dark cobbles and sand would not be significant, in part
because the contrast between the two types of materials would overshadow the color contrast, and the two
darker tones may be more of a match. Overall, the view of sand placement equipment would be short-
term, there are numerous elements in the viewscape which minimize the overall importance of the receiver
site itself, and the enhancement of the beach from cobble to sand would be beneficial. The visual impact
would be less than significant.
4.7 Aesthetics
Regional Beach Sand Project EIR/EA Page 4.7-799-69\SANDAG EIREA 4.1 to 4.13.wpd 7/17/00
Solana Beach
This receiver site has sand and cobble below bluffs with residences constructed along the top, as well as
a recreation area at Fletcher Cove. Construction activities would occur up to 13 days and typical
construction in one day would be approximately 200 feet. The activity would move along the length of the
beach which would reduce the visual contrast to any one viewer. The delivery pipeline would extend
across the water’s surface from SO-7 and make landfall at the northern end of the receiver site. However,
this pipeline would only serve this single site and would be utilized up to 13 days. The views of construction
and dredging equipment would be short-term and less than significant.
The borrow site that would serve this receiver site (SO-5) has organics that will likely make the material
slightly darker than the existing sand. The color contrast would be reduced by wave action, exposure to
the sun, and mixing, and there would be no permanent adverse visual conditions.
Del Mar
At this site, the receiver beach is directly fronted by homes at the same elevation so there would be clear,
foreground views of the construction process. The activity would occur for approximately 16 days under
this alternative, typically 250 linear feet a day. The activity would move along the length of the beach which
would reduce the visual contrast to any one viewer. Similar to the Cardiff site, more distant viewers on the
hills would view the receiver site as one element of a viewscape including the expansive ocean and other
beach scenes. The short-term activity at this one location would not be a permanent, adverse change.
The delivery pipeline would extend directly offshore from SO-5. As described in Solana Beach, the slightly
darker material will be washed and worked over time so there would also be no permanent visual impact.
Torrey Pines
Foreground viewers of this site are limited to recreationalists at the state beach and drivers on North Torrey
Pines Road. Distant views are available from residents on the hills north of Carmel Valley Road.
Construction activities would occur for up to 20 days and would enhance and widen this thin and cobble
beach. The nourishment material would be slightly darker but would be washed by waves, exposed to the
sun and eventually mixed with the existing sand to eliminate the contrast. The visual impact is regarded as
less than significant.

4.7 Aesthetics
Page 4.7-8 Regional Beach Sand Project EIR/EA99-69\SANDAG EIREA 4.1 to 4.13.wpd 7/17/00
The delivery pipeline would extend south from the Del Mar receiver site, primarily at the base on the bluffs
south of Sea Coast Park. In this location it would not be visible from residents along the bluff tops, but it
would be visible to beach users. The contrast would be reduced by its placement against the large bluffs.
As it would extend across the lagoon mouth and enter the site, it would be on the sand where its size and
darker color would make more it readily visible. Given the presence of other man made features such as
rip-rap as well as the temporary nature of the feature, the visual impact would be less than significant.
Mission Beach
Like Del Mar, this receiver site consists of residences built behind a low sea wall at the same elevation as
the sandy beach so there are clear, foreground views of the construction activity. Views would be available
to residents and users of the boardwalk. At this site, construction would occur along the site for 11 days,
typically 250 linear feet per day. The activity would move along the length of the beach, which would
reduce the visual contrast to any one viewer. Material from borrow site MB-1 is also characterized by
lighter material so the contrast between the fill material and existing sand would be less noticeable and
eventually the contrast would not be visible at all. Because operations would be short-term and the end
result would be enhancement of this important resource, the visual impact is regarded as less than
significant.
Imperial Beach
The majority of this receiver site is characterized by a cobble beach. Existing residents front the beach
behind rip-rap protection and have clear, foreground views of the construction activity. Construction
activity would be approximately 12 days. An estimated 300 linear feet per day would be affected over the
more than one-half mile long site. The activity would move along the length of the beach, which would
reduce the visual contrast to any one viewer. As fill material is placed on the site, it would be washed and
bleached to blend with the existing sand. Because of the short-term nature of the activity and the beneficial
enhancement of this degraded beach, the visual impact would be regarded as less than significant.
Borrow Sites
Visual impacts as a result of dredging activities at all borrow sites would be similar. For this impact
analysis, the SO-7 borrow site is addressed as a representative worst-case scenario because it would have
the longest duration of construction, and has the closest sensitive viewers.

4.7 Aesthetics
Regional Beach Sand Project EIR/EA Page 4.7-999-69\SANDAG EIREA 4.1 to 4.13.wpd 7/17/00
At its closest point, SO-7 would be located approximately 0.8 mile offshore. Residents on the bluffs would
have some view of the dredging operation for its entire duration. Because SO-7 would serve five receiver
sites (Table 2-2) dredging would continue within the dredge area for approximately 50 days. The dredge
area is approximately 50 acres in size. Depending on the type of dredge the view would be slightly
different. The cutterhead dredge would appear as a boat working in one area for some time, then moving
to another nearby location, and then another within the dredge area and would remain offshore. While
possibly visible, it would appear on the horizon much like many other boats (fishing, pleasure, etc.) which
are active along the coast. It would not be highly evident or dominate the landscape. The hopper dredge
would come to shore periodically which would make it more visible, but this would not be a permanent
significant visual impact.
Similar to SO-7, visual impacts at all borrow sites would be short-term. Dredging activities would not be
highly evident or dominate the landscape. Accordingly, impacts would be less than significant.
Mitigation Measures for Alternative 1a
No significant impacts have been identified, and no mitigation measures would be necessary.
Impacts/Mitigation Measures for Alternative 1b
Under this alternative, sand placement activities would occur within a more restricted time frame when the
noise ordinance of a local jurisdiction would be applicable. The more restrictive noise ordinance would
not apply to receiver sites at South Carlsbad North, Batiquitos, Leucadia, Moonlight or Cardiff which are
served by borrow sites SO-7 and SO-6. Construction at the remaining receiver sites would be restricted
to generally 7 p.m., Monday through Friday, between 8:00 a.m. and 7:00 p.m. on Saturdays, and excluded
entirely on Sundays and holidays (Section 2.4). There would be no need for lights for nighttime
construction. However, the overall construction length would be increased by one-third and the amount
of sand placed would be reduced by one-half (refer to Table 2-2). Visual impacts are discussed below
for the receiver sites where construction practices would vary under Alternative 1b than that previously
described under Alternative 1a.
4.7 Aesthetics
Page 4.7-10 Regional Beach Sand Project EIR/EA99-69\SANDAG EIREA 4.1 to 4.13.wpd 7/17/00
Receiver Sites/Temporary Pipeline Routes
At the South Oceanside, North Carlsbad, Solana Beach, Del Mar, Torrey Pines, Mission Beach, and
Imperial Beach receiver sites, the construction period would be longer than Alternative 1a (refer to Table
2-2). Although the time period would be longer, there would be no nighttime construction lights which
would eliminate short-term light and glare associated with Alternative 1a. While there would be less sand
overall, there would still be an improvement to the existing degraded condition. Because the construction
activity would move along the beach no single viewer would have impacts from construction over the entire
time period and because the end result would be enhancement of this important visual resource, there
would be no permanent, significant visual impact.
Borrow Sites
Dredging activity would occur over a longer duration at borrow sites SO-9, SO-5, MB-1 and SS-1
because they would have to halt dredging until construction could resume at the receiver sites. Table 2-2
identifies the longer time frame for each borrow site. Because of the distance between borrow sites and
viewers, the relatively small size of dredge area when viewed in the ocean horizon, and the other boating
activity that is also visible there would be no permanent significant visual impact. No mitigation measures
would be necessary.
4.7.3 Alternative 2
Impacts of Alternative 2a
Receiver Sites/Temporary Pipelines
Under Alternative 2a, beach nourishment activities could occur anytime within 24 hours a day, seven days
a week. Lights may be necessary to allow for sand placement on the receiver site after the sun sets. The
total number of sites would be less under this alternative than under Alternative 1 as the North Carlsbad,
Batiquitos, Leucadia, and Moonlight Beach receiver sites would not receive sand. Nearby sensitive
receptors, typically residents, at those sites would not experience even short-term visual effects, nor would
they experience the visual benefit of enhanced beaches. Under this alternative, beach replenishment
activities at the Cardiff, Solana Beach and Del Mar receiver sites would be identical to Alternative 1a and
the impacts would be identical – short-term views of construction resulting in long-term beach
4.7 Aesthetics
Regional Beach Sand Project EIR/EA Page 4.7-1199-69\SANDAG EIREA 4.1 to 4.13.wpd 7/17/00
enhancement. Four other receiver sites would have a larger footprint under this alternative, but impacts
would be similar to those described for Alternative 1. The South Carlsbad South receiver site is proposed
for sand replenishment under this alternative, and is addressed below.
South Carlsbad South
Beach replenishment at the South Carlsbad South receiver site would have visual impacts identical to South
Carlsbad North. Nearby viewers would be campers in the State Park. During implementation views
would temporarily degraded but on any given day only 200 linear feet would be affected by direct closure.
Construction is anticipated to occur over a 13-day time period. Fill for this site would come from SO-7
which would be slightly lighter in color than the receiver site, but natural processes would eliminate any
noticeable differences and the impact would not be significant. As with Alternative 1, there would be no
significant, long-term impact associated with the pipeline. Because of the short-term nature of the project
and long-term enhancement benefit, visual impacts would not be considered significant.
Borrow Sites
Visual impacts associated with borrow sites would be similar to Alternative 1. Some borrow activity would
be decreased in duration (i.e., SO-9 and SO-7) while some would take longer (MB-1). The overall time
of borrow activity would be an estimated two weeks less under Alternative 2 than Alternative 1. Still, there
would not be long-term, significant visual impacts.
Mitigation Measures for Alternative 2a
No mitigation would be required as no significant impacts have been identified.
Impacts/Mitigation Measures for Alternative 2b
Under this alternative, construction at some sites would occur over a longer time period (refer to Table 2-
6). As noted under Alternative 1b, there would be no lights for nighttime construction which would
eliminate one short-term change to the visual environment; however, the reduction in sand volume
associated with this alternative would result in reduced long-term visual benefits. No mitigation would be
necessary.
4.7 Aesthetics
Page 4.7-12 Regional Beach Sand Project EIR/EA99-69\SANDAG EIREA 4.1 to 4.13.wpd 7/17/00
4.7.4 No Action Alternative
With the No Action Alternative, the beaches would not be enhanced. Where there are visible cobbles they
would remain, and where the beach overall is narrow it would not be widened. Adjacent residents and
beach users would not experience the disturbance of construction or views of the pipeline; however, they
would not experience the benefits of more scenic beaches.
4.8 Socioeconomics
Regional Beach Sand Project EIR/EA Page 4.8-199-69\SANDAG EIREA 4.1 to 4.13.wpd 7/17/00
4.8 SOCIOECONOMICS
As stated in Section 3.8, NEPA requires consideration of “economic” and “social” effects (40 C.F.R. §§
1502.16 and 40 C.F.R. §§ 1508.8) but CEQA only requires evaluation of population and housing such
that increased population or housing results in physical impacts. There would be no housing constructed
with this project and no increase in population so there is no applicable CEQA analysis.
The social and economic effects of the action would be beneficial. The nourished beaches would have
wider and larger sand areas, or would replace cobblestone beaches with sand-covered beaches.
Expansive sandy beaches provide greater recreational opportunities, opportunity for public access, and
enhance tourism in the region. Public property and infrastructure would have additional protection from
wave action and storm events while the sand remained at the wider location. Either of the two action
alternatives would result in satisfying the project purpose and need of replenishing eroded beaches.
The primary focus of this impact analysis therefore, is the socioeconomic effect to commercial fisheries,
kelp harvesting and recreation fishing/diving from a NEPA perspective. There would be no substantial R
difference in effect based on season of construction because this analysis considers the larger, regional R
fishery and long-term health. As with Section 4.4, it considers potential impacts overtime with no particular R
start date. NEPA does not require explicit definition of significance criteria. Potential impacts specific to R
environmental justice concerns are addressed in Sections 6.6 and 6.7.
4.8.1 Alternative 1
Impacts of Alternative 1a
Commercial Fisheries
Numerous interactions with commercial fisherman and their representatives have identified four main areas
of concern regarding the beach replenishment project. These concerns all focus on the potential for loss
of resources and income and can be summarized as follows:
• Sand placed on the beaches will move from the beaches onto sensitive habitat areas causing immediate
loss of commercial resources associated with these habitats (e.g., lobster, crab, urchin), effectively
causing area preclusion for some period of time,
4.8 Socioeconomics
Page 4.8-2 Regional Beach Sand Project EIR/EA99-69\SANDAG EIREA 4.1 to 4.13.wpd 7/17/00
• Turbidity plumes from the project would cause commercial resources to move from the area for some
period of time, effectively causing area preclusion for some period of time,
• Movement of the sand from the beaches onto sensitive subtidal habitat areas would adversely affect
nursery habitat causing significant long-term damage (through population reduction) to the fishery, and
• Dredging operations will lead to loss of fishing gear and equipment as well as limit access to fishing
areas.
These three concerns (area preclusion, adverse effects to nursery habitat, and gear loss/limit access) are
each discussed below.
It is appropriate to note that commercial trawl and gill netting operations would not be directly affected by
this project because these activities are not permitted within three miles of the coast. California halibut
(ranked 4th in value among local nearshore species) are commercially fished using nets and trawls and these
methods are generally restricted to waters at least three miles from shore. Since the borrow sites are all
located approximately one mile or less from shore, no significant impacts are predicted for this component
of the fishery.
Area Preclusion Issues
Socioeconomic impacts to the commercial fishery can be examined in terms of the regional fishery and
individual fishing (local level) operations.
Preclusion in Regional Perspective. In terms of the regional fishery, there would be no significant impact
to the overall San Diego region fishery from the proposed project. This conclusion is based on the
distribution of the commercial catch among fish blocks along the coast, and the relatively low contribution
of the North County area, where most dredging and sand placement would occur, to the overall area
fishery. Looking at the three North County fish blocks in terms of aggregate value over the years 1987 to
1998, for the five most valuable nearshore species currently fished, the North County accounted for 23
percent of area lobster value, 0.6 percent of area urchin value, 30 percent of rock crab value, 12 percent
of halibut value, and 14 percent of sheephead value. In order to result in even a 10 percent reduction of
the overall San Diego county fishery for any of these species, the project would have to degrade the North
County lobster catch by over approximately 43 percent; rock crab catch by one-third; and nearly eliminate

4.8 Socioeconomics
Regional Beach Sand Project EIR/EA Page 4.8-399-69\SANDAG EIREA 4.1 to 4.13.wpd 7/17/00
the North County halibut (with a 83 percent decline) and sheephead (with a 71 percent decline) fisheries.
None of these conditions are considered likely to result from the proposed project.
Setting aside the halibut, sheephead, and urchin fisheries as having relatively low levels of effort in the North
County, it is possible that there would be localized impacts on the lobster and rock crab fisheries. That is,
if fishermen are displaced from certain areas, effort will be directed toward other areas. This shift in effort
could result in a marked increase in fishing pressure on the areas to which the effort was redirected and
cause localized overfishing of these resources. This type of impact, except for small areas, is not
considered likely for several reasons. First, the model-predicted sand movement shows a concentration
of longer term sand deposits in relatively few, relatively small areas. These are typically near the mouths
of lagoons (there are several in the North County) and/or where the coast contains a feature that is irregular
enough to disrupt the smooth flow of sand in the nearshore area (North Carlsbad and Moonlight Beach
areas). Second, fishermen will attempt to avoid reducing their catch per unit by not placing too much gear
in any one area. Third, fishermen move traps that are not productive, so that effort is redistributed based
on relative level of success.
Preclusion in the Local Level Perspective. Using available quantitative data to examine small, localized
impacts within the North County area is difficult. In general, there is an inherent difficulty in using available
quantitative data to assess localized impacts to the fishery. CDFG data are collected by two separate
geographies: fish block data for catch and port data for landings. Landings data are useful for a look at
fisheries in a general area, but (particularly in the case of larger ports) may include data from resources
caught considerable distances away from the port. Fish block data, while more closely tied to the actual
distribution of resources, is less useful in understanding localized impacts. Fish blocks encompass an area
that is 10 minutes longitude by 10 minutes latitude, except as reduced in size where a particular block
intersects the coastline (Figure 3.8-1). In general, these areas are too large to capture localized project
impacts. While the CDFG data have inaccuracies, they are the best available data and are supplied by
local fishermen (and fish buyers) themselves. Potential inaccuracies are somewhat minimized, however,
by using data from more than one block, and checking San Diego port data against Oceanside port data.
Another problem in quantifying potential impacts attributable to the project is the inherent variability of the
fishery from year to year. The relatively large (normal) fluctuations seen from year to year could serve to
either dampen or accentuate project-related impacts. For example, lobster landings at Oceanside dropped
approximately four-fold volume and value from 1997 to 1998. In this case, the trend is generally attributed
4.8 Socioeconomics
Page 4.8-4 Regional Beach Sand Project EIR/EA99-69\SANDAG EIREA 4.1 to 4.13.wpd 7/17/00
to longer term effects of El Niño, but the fact that many variables are involved make future predictions
difficult.
One way to examine the potential impacts of preclusion to the local commercial fishery is to assess the
impact of previous similar projects in the same area, at least on a general level. Local commercial fishermen
have expressed concerns that previous beach replenishment operations have caused the loss of commercial
resources and created a “dead zone” off the beach, which has taken several years to return to normal. The
concern is that the proposed project will create similar impacts.
There have been numerous beach replenishment projects in the proposed project area that have been more
or less similar to the proposed project. For example, between 1954 and 1988 there were 37 major beach
replenishment projects for Oceanside and Carlsbad (mainly the beaches near Agua Hedionda Lagoon),
or an average of about one project per year. Average annual sand volumes for these projects were over
600,000 cy per year (USACOE 1991). Between 1981 and 1999, there have been over 28 major beach
replenishment projects for Oceanside and Carlsbad that have placed more than 9.8 million cy of sand on
the beach, which averages out to over 515,000 cy per year for these beaches (Coastal Environments 1998
and Appendix D). By way of contrast, Alternative 1 would deposit 760,000 cy on the beaches of
Oceanside and Carlsbad. This volume would exceed the annual average but is within the historical range
of previous projects. There have been seven other replenishment projects for Carlsbad and Oceanside that
were larger than 900,000 cy between 1954 and 1996 (USACOE 1991, Coastal Environments 1998).
To understand the relationship to previous projects and the performance of the local commercial fishery,
an evaluation was performed of landings reported and past replenishment projects. In 1995, over 2 million
cy was placed on the beaches at Carlsbad. Commercial lobster landings reported for the port of
Oceanside for the following year (1996) were at record levels for both volume and value, far outdistancing
any of the previous 15 years (see Figure 3.8-2). Landings of rock crab at Oceanside in 1996 were also
high. In fact, it was the best year for rock crab since 1981. During 1996, there was an additional 802,000
cy sand put on the beaches at Oceanside and Carlsbad. Following the large beach replenishment projects
of 1995 and 1996, the lobster catch in 1997 was the best year ever, surpassing the 1996 record year in
terms of volume and value of catch landed at Oceanside. The reported rock crab harvest for 1997 was
down from 1996 levels, but still accounted for the highest volume and value of landings for any other year
since 1981. Thus, based on the CDFG data for Oceanside landings, there is no evidence of local impacts
to the lobster or crab fisheries as a result sand replenishment projects in 1995 and 1996.

4.8 Socioeconomics
Regional Beach Sand Project EIR/EA Page 4.8-599-69\SANDAG EIREA 4.1 to 4.13.wpd 7/17/00
Generally, beach replenishment has occurred for decades and there still appears to be an abundance of
sensitive habitats, while the commercial catch reported for Oceanside remains high for most commercial
species. The catch trends for commercial species landed at the port of San Diego generally are similar to
the trends for landing at Oceanside (Figure 3.8-2), suggesting that area factors are much more important
than local factors in determining catch. This also suggests that the numerous beach replenishment projects
in the North County have had minimal effect on commercial resources. If beach replenishment does impact
commercial catch, then these impacts must be localized and fisherman make up deficits by fishing in other
areas. This would imply that resources are well distributed within each fish block so that localized impacts
have little effect overall.
It appears that declines in local fisheries may be more strongly linked to variables other than beach sand
replenishment. It is known that El Niño events and winter storms have significant impacts on commercial
fisheries. The 1997-98 El Niño has been followed by a precipitous drops in commercial catch for almost
every species for all of San Diego county. These regional trends in catch data are indicative of large scale
oceanographic events and not localized projects such as beach replenishment. The 1982-83 El Niño had
a much less measurable impact. Other factors include winter storms that cause loss of equipment and
hinder fisherman from working their traps.
Based on the available baseline fisheries data, there is likely to be no significant regional or localized impact
in the San Diego area or the North County subarea fisheries. Impacts may be felt at the individual fishing
operation level as a result of displacement from favored fishing locations; however, the individual
operational level impacts cannot be accurately quantified with the currently available data.
Alternative 1 would require approximately 147 days of dredging with an additional 30-40 days for
equipment movements. Even though the dredging duration will extend for months, only a small area of the
60 mile coastline would be affected at any one time. That is, with only one or (possibly) two dredges
operational for the project, the actual area that would be affected at any point in time would be localized
and not preclude other areas from being fished. Additionally as described in Section 2.4, SANDAG is
committed to coordinating dredge operations with the commercial fisherman so that, via timely notification,
areas can be fished the maximum amount of time and only the area of active dredge would be restricted.
Thus, there would be no significant long-term preclusion impacts as a result of the dredging operations.
4.8 Socioeconomics
Page 4.8-6 Regional Beach Sand Project EIR/EA99-69\SANDAG EIREA 4.1 to 4.13.wpd 7/17/00
Loss of Nursery Habitat
The nearshore trap fisheries most likely to be affected include lobster, crab, and fish (mainly sheephead).
While direct impacts of the proposed project can be evaluated relative to the commercial resources,
indirect effects cannot easily be predicted. There is essentially no available information upon which to
objectively evaluate the effects of turbidity and sand transport upon the recruitment, growth, and maturation
of juvenile lobster on the North County coast. NEPA Regulations promulgated by the Council on
Environmental Quality (CEQ) address the required approach where incomplete or unavailable information
is an issue (40 C.F.R. 1502.22). Generally, the fact that information is unavailable must be indicated and
existing, credible scientific evidence which is relevant must be summarized so that methods generally
accepted by the scientific community can be utilized. Section 3.8 summarizes the limited studies in New
Zealand on sediment/ turbidity and juvenile lobsters. This impact analysis uses that data as well as a focus
on the effects of the project on habitats which support lobster populations, specifically surfgrass for nursery
and hard bottom for shelter/foraging. Fish block data for Port of Oceanside landings indicate that 62
percent of the catch came from the Encinitas/Solana Beach fish block area, 29 percent for Oceanside, and
9 percent from Del Mar/Torrey Pines. These landings data tend to correlate with the amount of hard
bottom and surfgrass resources reported from within each of these areas. This general correlation tends
to support this approach of evaluating effects to lobster with effects to surfgrass or substrate.
Lobsters are creatures of the nearshore zone and are adapted to wave surge, turbidity, siltation and sand
burial of habitat. Juvenile lobsters spend one to two years in the nearshore area and are dependent upon
surfgrass and hard bottom reef habitats as a nursery area and a refuge from predators. The effects of the
beach replenishment and subsequent redistribution of the sands upon these habitats has the potential to
cause loss of commercial resources. The project has been designed to avoid indirect impacts to intertidal
surfgrass which would minimize potential impacts to lobster nursery areas (Section 4.4). However, some
nearshore low-lying reefs, including one with nearshore surfgrass, would be temporarily covered by sand
redistribution and this could cause a short-term loss of habitat for juvenile lobsters. The significance of this
effect upon juvenile lobsters is difficult to determine, but it is judged to be less than significant based upon
the small area of predicted reef burial compared to the total available reef habitat. As noted in Section 4.4,
three small reefs south of the North Carlsbad receiver site, with a total area of 0.24 acre has surfgrass
which may experience partial sedimentation. However, in relation to the approximately 40 acres of
observed intertidal zone surfgrass reefs from Oceanside to Torrey Pines, and the assumed presence of a
similar sized area in the nearshore area along this same stretch of coast, the area of surfgrass experiencing
partial sedimentation is insignificant. Under the worst-case assumption, partial sedimentation is predicted

4.8 Socioeconomics
Regional Beach Sand Project EIR/EA Page 4.8-799-69\SANDAG EIREA 4.1 to 4.13.wpd 7/17/00
on up to 3.2 acres of reefs that support some giant kelp at five locations and 0.3 acre of reef with feather
boa near the three receiver sites from North Carlsbad to Solana Beach. While increases in turbidity and
sand burial will occur from the proposed project, these effects are similar to those of beach replenishment
projects that have been ongoing for over four decades with no apparent effect on resources. Therefore,
the proposed projects may have an adverse impact on the area’s ability to function as juvenile lobster
habitat, but this effect is judged to be short-term and less than significant. Localized impacts are predicted
to occur over the combined 3.7 acres of reef areas supporting surfgrass, kelp, and feather boa that may
experience partial sedimentation under worst-case assumptions, and may be significant for small areas, but
are not expected to result in a significant impact to lobsters at the local population level.
Natural turbidity and silting of reefs from coastal lagoons and river discharges following winter storms does
not seem to produce the same effect as catch rates generally remained high in these areas (Guth 1999).
This suggests that it may not be strictly turbidity or siltation effects causing perceived resource loss off of
replenished beach sites, and other unmeasured or unknown factors may be responsible. These factors
could include sediment contaminants and pathogens that are exposed during dredging and redistributed
during beach replenishment. Testing of borrow site sediments found no evidence of chemical contamination
(Section 3.3). The closest wastewater outfall to any proposed borrow site is at SO-6 which is over 4,000
ft from the discharge area. The other borrow sites are in excess of two miles from wastewater outfalls.
Thus, there is little potential for the borrow site sediments to be a reservoir of pathogens.
Direct impacts from dredging the borrow sites would not cause significant impacts to the lobster fishery.
The area that would be affected by dredging the borrow sites represents from less than two percent of the
available nearshore habitat and the dredge activity at any one location would be limited. Turbidity and
siltation from dredging would also be localized and short-term (Section 4.3 and 4.4). After dredging,
borrow sites would be deeper than surrounding areas but these areas are not expected to affect lobster
movement or distribution. Therefore while increases in turbidity and siltation from dredging the borrow sites
would be considered adverse in the short-term, no long-term significant impacts are expected to
commercial species.
The second most important commercial fishing resource, on the San Diego county level, is red urchins. This
fishery, however, is highly concentrated outside of the North County area, with the La Jolla/Point Loma
fish block alone accounting for 99 percent of the catch. This part of the fishery would not be affected by
the proposed project. However, for a few fisherman in the North County, red urchins are an important
resource. Red urchins inhabit kelp beds and nearby hard bottom reefs. These habitats will not be affected
4.8 Socioeconomics
Page 4.8-8 Regional Beach Sand Project EIR/EA99-69\SANDAG EIREA 4.1 to 4.13.wpd 7/17/00
by dredging at the borrow sites. Sand redistribution from the beaches to nearshore low-lying reefs could
temporarily cover some potential urchin habitat, however, these low-lying reefs are not prime habitat for
red urchins who prefer higher reefs offering shelter from predation and increased potential to trap drift kelp,
the preferred food source for this species. As described in Section 4.4, sedimentation on high relief reefs
(over three feet) is not predicted. Partial sedimentation may occur on up to 3.2 acres of reefs which
support some giant kelp at three locations (0.73 acre, North Carlsbad; 1.46 acres, Batiquitos; and 1.05
acres, Solana Beach). Another 0.27 acre reef near Moonlight Beach with feather boa kelp would also
experience partial sedimentation. As the sedimentation impact to kelp is minimal, the movement of sand
into the subtidal from the beaches would not be significant.
Localized decreases in visibility due to turbidity from borrow site dredging or from the beaches could affect
diving conditions. This effect would be localized and of limited duration, and would not be significant.
The rock crab/live fish fishery is another locally important commercial fishery. Rock crab was the third
most valuable resource in the San Diego county. Landings for rock crab were highest for Point Loma/La
Jolla area (58 percent), followed by the North County areas which were about 6 percent for Del
Mar/Torrey Pines, 7 percent for Encinitas/Solana Beach, and about 29 percent for Oceanside. Within the
North County area, crab is second in importance only to lobster. The majority of the crab fishing is in
water depths greater than 90 feet. Proposed borrow sites are located at water depths from 50 to 80 feet,
so there would be no significant impacts from the project to these resources.
Sheephead is an important emerging fishery. Sheephead are inhabitants of kelp and rocky habitats. These
habitats will not be affected by the borrow site dredging and therefore no significant effects are predicted.
Redistribution of sand from the beaches would temporarily cover some low lying reef areas causing some
short-term loss of potential sheephead habitat. However, sheephead are highly mobile and the amount of
low-lying reef that will be affected is small and the loss is only temporary. As noted in Section 4.4, three
small reefs totaling 0.24 acre south of the North Carlsbad receiver site, with surfgrass, may experience
partial sedimentation. Similarly, under worst-case assumptions, 3.5 acres of reefs supporting kelp or
feather boa from North Carlsbad to Solana Beach would experience partial sedimentation. Therefore,
while some temporary impacts to low-lying reef may occur, this effect to sheephead would be considered
less than significant.
California halibut utilize the nearshore area and lagoons as feeding and nursery areas. Thus, the project
could potentially affect this species. The project has been designed to avoid significant long-term impacts

4.8 Socioeconomics
Regional Beach Sand Project EIR/EA Page 4.8-999-69\SANDAG EIREA 4.1 to 4.13.wpd 7/17/00
to the coastal lagoons so no impacts to the lagoon nursery areas are expected. Some areas of the
nearshore may temporarily be covered by sand moving off the beaches onto the subtidal area. This is not
significant to halibut as their habitat is the sand bottom and they are well adapted to changes in near shore
sand levels. Any dislocation of halibut due to turbidity or sand movement would be localized and
temporary. Any effects from the proposed project on halibut is considered less than significant.
Gear Loss
Vessel traffic and dredge operations have the potential to conflict with traps. To reduce the potential for
trap loss and conflict, and to minimize impacts associated with the incompatibility of dredge operations and
fishing activities, pipeline corridors and vessel traffic lanes have been selected to avoid areas of kelp and
hard bottom. As described in Section 2.4, SANDAG has committed to a protocol of coordination with
commercial fisherman and the dredge operator to minimize, to the extent possible, gear conflict and
disruption of fishing locations. As described in that text, transit corridors and the dredge locations for each
borrow site would be noticed well in advanced of activity and a third party observer would be aboard the
dredge to document any fishing gear in the noticed areas. Such gear, if damaged or destroyed, would not
require compensation. If gear outside the noticed areas is damaged or destroyed, compensation would
be the responsibility of the contractor. Significant potential impacts would be avoided by the process, or
compensation would be provided as appropriate.
Kelp Harvesting
The project has been designed to minimize effects on kelp and kelp habitat. Dredging of the borrow sites
would cause localized turbidity and siltation. However, the borrow sites have been designed to provide
a minimum 500-foot buffer zone from kelp beds and potential kelp habitat (Section 4.4). This buffer zone
is judged to be sufficient as the distances from the dredging will generally be much greater than 500 feet
from these resources, the duration of turbidity will be intermittent and reach potential resources for only a
few days at most. Therefore, the impact is considered less than significant. Turbidity from the beach sites
and subsequent redistribution of the beach sand to the nearshore area could have adverse effects. As
previously discussed, a total of 3.2 acres of reef with giant kelp may experience partial sedimentation under
worst-case model predicted assumptions, near three receiver sites from North Carlsbad to Solana Beach.
However, kelp habitat is generally not of high quality within the littoral cell (generally less than 30 ft depths)
and effects from the beach receiver sites beyond the littoral cell are highly localized and represent a very
small area.

4.8 Socioeconomics
Page 4.8-10 Regional Beach Sand Project EIR/EA99-69\SANDAG EIREA 4.1 to 4.13.wpd 7/17/00
Recreational Fishing and Diving
Impacts to the recreational fishing and diving include potential loss of resources, exclusion from
fishing/diving areas, and decreased visibility for divers due to turbidity plumes. Sport diving for lobster and
fishing for halibut in the nearshore area could be affected by the project as sand moves off of the receiver
sites. Turbidity from the beaches and presence of pipelines will preclude usage of small areas for short
periods. In the longer term, access for shore diving and surf fishing may improve with the placement of
sand on the beaches.
Because the borrow sites are located offshore of the beaches, surf fishing and beach diving most likely
would not be affected by dredging and therefore no impacts are predicted. However, as discussed in
Section 4.6, dredge area MB-1 is within the Mission Bay Artificial Reef (which includes Wreck Alley) and
is adjacent to the San Diego Underwater Recreation Area. Wreck Alley contains the most popular local
wrecks for dive charter businesses as well as recreational divers, but turbidity plumes are not projected to
reach the dive sites. Divers may experience increased underwater noise at nearby wrecks, and dive boats
and fishing vessels transiting between features may have to maneuver to avoid the dredge operations, but
these inconveniences will be of short duration as dredging operations are only anticipated to last 11 days
under Alternative 1a. Risk to the safety of divers from straying underwater into the dredge area is not
expected to be an issue, as the closest wreck/sunken structure artificial reef is approximately 1,000 feet
away from the dredge area. Further, divers typically descend to and ascent from the these offshore sites
using permanently attached buoy/mooring lines, and normally do not stray from the structures farther than
the limit of visibility. Therefore, these effects are considered less than significant.
Sport fishing boats could be affected by dredging operations and turbidity plumes from the beaches. Some
loss of sport fishing area would occur during actual dredge operations but this area would be substantially
less than the available nearshore areas for sport fishing and short-term in nature at individual dredge
locations. The impact would be less than significant.
Mitigation Measures for Alternative 1a
There would be no long-term significant impacts to commercial fisheries. As described in Section 2.4, a
coordinated protocol would be implemented to notice commercial fisherman of dredge areas and transit
locations and a gear compensation method is provided. This would provide fisherman the knowledge to
4.8 Socioeconomics
Regional Beach Sand Project EIR/EA Page 4.8-1199-69\SANDAG EIREA 4.1 to 4.13.wpd 7/17/00
schedule their activities around the short-term dredge and construction activities associated with the
project.
Impacts of Alternative 1b
The impacts of Alternative 1b would be similar to those identified for Alternative 1a, but they would be
proportionally less based on the lesser area of preclusion resulting from a lesser volume of sand placed on
the beaches.
Mitigation Measures for Alternative 1b
No significant impacts were identified; therefore, no mitigation measures are required. The protocol would
apply for coordination with commercial fisherman in Section 2.4.
4.8.2 Alternative 2
Impacts of Alternative 2a
The impacts of Alternative 2a would be similar to those identified for Alternative 1a, but somewhat smaller
in area and different in specific location. Under worst-case assumptions, partial sedimentation of less than
1.78 acres of reef that support some giant kelp is predicted. This partial sedimentation could occur near
two receiver sites (North Carlsbad, 0.73 acre; Solana Beach, 1.05 acres). Less than 0.24 acre of reef
area (to the south of the North Carlsbad receiver site) supporting surfgrass is predicted to experience
partial sedimentation under worst-case assumptions. While temporary adverse impacts to commercial
fisheries target species may occur on a localized basis, or at the individual fishing operation level due to
temporary displacement from favored fishing sites, no significant commercial fisheries impacts are identified
for Alternative 2a.
Mitigation Measures for Alternative 2a
No significant impacts were identified; therefore, no mitigation measures are required.
4.8 Socioeconomics
Page 4.8-12 Regional Beach Sand Project EIR/EA99-69\SANDAG EIREA 4.1 to 4.13.wpd 7/17/00
Impacts of Alternative 2b
The impacts of Alternative 2b would be similar to those identified for Alternative 2a, but they would be
proportionally less based on the lesser area preclusion resulting from a lesser volume of sand placed on the
beaches.
Mitigation Measures for Alternative 2b
No significant impacts were identified; therefore, no mitigation measures are required.
4.9 Public Health and Safety
Regional Beach Sand Project EIR/EA Page 4.9-199-69\SANDAG EIREA 4.1 to 4.13.wpd 7/17/00
4.9 PUBLIC HEALTH AND SAFETY
Public health and safety concerns are those that could have an impact on the welfare of the public affected
by the proposed action. The following specific safety issues are addressed: public access and safety during
project construction, lifeguard services, recreational safety, vessel traffic and safety, and potential public
health and safety impacts resulting from the formation of beach scarps (i.e., the cut in the beach berm face
caused by wave action). Potential impacts to the lifeguard towers (structures) on individual receiver sites
are addressed in Section 4.10. While there would be more people present at each receiver site during the R
summer period potentially effected by a spring construction schedule, but the overall impact conclusions R
would not change given the short-term nature of the activity at any individual beach. R
4.9.1 Significance Criteria
For this analysis, determination of significance of potential public health and safety impacts is based on the
level of safety precautions that would be implemented during replenishment activities. An impact to public
health and safety would be significant if it would:
• create a health hazard or potential health hazard;
• expose people to potential health hazards; or
• create navigation hazards or result in unsafe conditions for vessel traffic.
4.9.2 Alternative 1
Impacts of Alternative 1a
Receiver Sites
The following analysis is applicable to all 12 possible receiver sites.
Public Access and Safety
During the implementation of Alternative 1, the active construction zones at each receiver site would need
to be closed to public access to prevent an unsafe condition. This is due primarily to the amount of heavy
equipment that would be used to grade the beaches at these sites. Accordingly, during discharge

4.9 Public Health and Safety
Page 4.9-2 Regional Beach Sand Project EIR/EA99-69\SANDAG EIREA 4.1 to 4.13.wpd 7/17/00
operations, a portion of the beach would be closed at each site. This closure would affect the existing
beach and offshore areas between the dredge (and its pipeline) and the receiver site. For more information
on the closure at each receiver site, refer to Tables 2-2 and 2-4.
During beach replenishment operations, the contractor selected to perform the beach building operations
would provide all necessary safety measures in the vicinity of the receiver beaches, including fencing,
barricades, and flag personnel, as necessary. The portion of the beach receiving sand would be closed to
the public during the actual replenishment construction activities (Table 2-4). When all sand has been
discharged and spread out at the closed section of the receiver site, the operation would continue along the
receiver site to a new section of beach to be replenished. This would continue until the entire receiver site
has been replenished. During replenishment operations, the land pipeline would be covered with sand at
key access points. The sand covered parts of the pump line will create pedestrian bridges, at
approximately 300-foot intervals, to ensure sufficient public access. As such, no significant impacts to
public health or safety would result. This alternative would result in public health and safety benefits by
adding sand to the eroded areas adjacent fragile bluffs.
Lifeguard Services
During construction of Alternative 1, the pipeline would be buried in front of accessways and launches for
lifeguard boats and vehicles. A sand, cobble, or earthen ramp would allow for access from lifeguard
stations, over the pipeline, and to the ocean. Similar ramps would provide north-south access over the
discharge line for lifeguard vehicles and pedestrians. As such, lifeguard services would not be impeded with
implementation of Alternative 1.
The following receiver sites have temporary lifeguard towers in place during the summer months:
Batiquitos, Leucadia, Moonlight Beach, Cardiff, Solana Beach, Mission Beach, and Imperial Beach. If
sand replenishment occurs during the summer season when the temporary lifeguard towers are onsite,
SANDAG will coordinate with the respective jurisdiction to temporarily relocate the towers during
construction. Temporary relocation would not impair the ability of lifeguards to ensure public safety since
this portion of the beach would be closed to the public during construction activities. The towers would
be replaced after sand placement, before the beach is reopened for recreational uses. Near permanent
lifeguard towers, sand would be dug out where necessary to preserve the line-of-sight from tower viewing
platforms. As long-term beach safety would not be affected by implementation of the proposed action, no
significant impacts to lifeguard stations would occur.

4.9 Public Health and Safety
Regional Beach Sand Project EIR/EA Page 4.9-399-69\SANDAG EIREA 4.1 to 4.13.wpd 7/17/00
Recreational Safety
As described in Section 3.9, extensive sediment characterization analyses were conducted for the proposed
receiver sites as part of this project (Sea Surveyor 1999; FRH 1997). These analyses were conducted
in accordance with USACOE, USEPA, and RWQCB procedures for dredged sediment. Based on
sediment studies, it was determined that the dredged material from the offshore borrow sites is suitable for
beach replenishment and does not pose a threat to public health and safety. No impacts would occur with
implementation of this alternative.
Although not anticipated, the possibility exists that unforseen wastes and materials could be dredged from
the offshore borrow sites. Borrow sites have been tested for the suitability of the dredge materials to be
placed on the receiver beaches; nonetheless, illegal dumping activities do occur in offshore waters and the
proposed borrow sites might contain hazardous or dangerous materials. In the event that hazardous or
dangerous materials are found in dredge spoils, dredging and disposal activities would immediately stop.
An evaluation would be made to determine the extent of the contamination and most appropriate treatment
of the site.
Scarps
Scarp height is a function of the breaking wave height and the elevation of the existing beach berm. Scarps
develop naturally along the beach profile and vary in height due to significant changes in the beach profile
(i.e., a drastic drop in elevation).
Large scarps may result in safety hazards due to substantial changes in the beach profile (i.e., a drastic drop
in elevation). Because scarps are a function of beach berm height, placement of fill on the receiver sites
would not increase scarp height, provided fill is placed to the height of the existing beach berm (Department
of the Navy 1997b). The proposed action specifies that beach fill would not be placed above the height
of the existing beach berm. Therefore, safety impacts due to increased scarp heights would not occur upon
implementation of this alternative.
Borrow Sites (Vessel Safety)
The potential for a vessel to collide with a dredge or support vessel would be extremely remote. The
dredge would be equipped with markings and lights in accordance with U.S. Coast Guard regulations. The
4.9 Public Health and Safety
Page 4.9-4 Regional Beach Sand Project EIR/EA99-69\SANDAG EIREA 4.1 to 4.13.wpd 7/17/00
location and schedule of the dredge would be published in the U.S. Coast Guard Local Notice to Mariners.
Thus, local boaters should be aware of the location of the dredge. A hopper dredge would travel at
relatively slow speeds (approximately 1.7 knots) during actual dredging operations. The travel speed
would also be slow (approximately 5 knots) during the transport of sand from the borrow sites to the
receiver sites.
For vessel safety reasons, an approximate 500- by 500-foot buffer area would be maintained around the
dredge offshore waters, to allow proper anchoring and pump line operation. To ensure that no vessels
would enter the offshore restricted zone, the anchoring area would be included in the Notice to Mariners,
which is overseen by the U.S. Coast Guard. Also, any pump lines used during beach replenishment efforts,
whether they be floating or submerged, would be clearly marked as navigational hazards. This short-term
increase in vessel traffic would be negligible as compared to the total areal vessel traffic, and the limited
distance of travel to set and remove the pump line. Accordingly, significant impacts to public health and
safety would not result with implementation of this alternative.
Mitigation Measures for Alternative 1a
No significant impacts have been identified; accordingly, no mitigation measures would be necessary.
Impacts/Mitigation Measures for Alternative 1b
This alternative would differ from Alternative 1a in that construction of the proposed action would comply
with applicable jurisdictions’ noise ordinances (refer to Table 2-2). Because dredging and replenishment
activities would take a longer amount of time, public access to the actual zones of construction would be
closed for a longer period of time. Also, lifeguard towers would be moved for a longer period of time until
construction is completed. Although this alternative would take longer to implement, it would still be short-
term, and no significant impacts are anticipated. Accordingly, no mitigation measures would be necessary.
4.9.3 Alternative 2
Impacts of Alternative 2a
Public health and safety impacts under this alternative would be similar to those described for Alternative
1. The South Carlsbad South receiver site proposed under this alternative also has temporary lifeguard
4.9 Public Health and Safety
Regional Beach Sand Project EIR/EA Page 4.9-599-69\SANDAG EIREA 4.1 to 4.13.wpd 7/17/00
towers in place during summer months. If sand replenishment occurs during the summer season when the
temporary lifeguard towers are onsite, SANDAG will coordinate with the respective jurisdiction to
temporarily relocate the towers during construction. Temporary relocation would not impair the ability of
lifeguards to ensure public safety since this portion of the beach would be closed to the public during
construction activities. The towers would be replaced after sand placement, before the beach is reopened
for recreational uses. This alternative would benefit those areas threatened by bluff failure. However,
Encinitas beaches near fragile bluffs (i.e., Batiquitos, Leucadia, and Moonlight receiver sites) would not
receive this benefit under Alternative 2. No other differences exist between the alternatives that would
result in impacts to public health and safety. Accordingly, impacts would be less than significant.
Mitigation Measures for Alternative 2a
No mitigation measures would be necessary because no significant impacts have been identified.
Impacts/Mitigation Measures for Alternative 2b
This alternative would differ from Alternative 2a in that construction of the proposed action would comply
with applicable jurisdictions’ noise ordinances (refer to Table 2-6). Because dredging and replenishment
activities would take a longer amount of time, public access to the actual zones of construction would be
closed for a longer period of time. Also, lifeguard towers would be moved for a longer period of time until
construction is completed. Although this alternative would take longer to implement, it would still be short-
term, and no significant impacts are anticipated. Accordingly, no mitigation measures would be necessary.
4.9.4 No Action Alternative
Under the No Action Alternative, no dredging or replenishment activities would occur. At some receiver
beaches, waves would continue to erode fragile bluffs that support property and structures, including
housing. The erosion would continue unabated. Public health and safety would likely deteriorate without
sand replenishment activities.
4.10 Structures and Utilities
Regional Beach Sand Project EIR/EA Page 4.10-199-69\sect-04.10.wpd 7/19/00
4.10 STRUCTURES AND UTILITIES
This section addresses structures and utilities that could be affected by implementation of the proposed
action. The season of construction has no bearing on the impact analysis. R
4.10.1 Significance Criteria
Impacts to structures and utilities would be significant if they would (1) result in the need for new systems
or (2) result in substantial alterations to existing systems. Because an increase in service demand would
not occur with the proposed action, this analysis focuses on displacement or disruption of structures and
utilities.
4.10.2 Alternative 1
Impacts of Alternative 1a
Receiver Sites
South Oceanside
A buried sanitary sewer ocean outfall pipe located just north of Loma Alta Creek would not be impacted
by Alternative 1. The pipe would not be displaced and interruption in service would not occur because
the pipe is located beneath the surface. The proposed beach fill would be beneficial for this outfall structure
because the sand would serve as additional cover to protect the pipeline. The existing outlets for the storm
drains at the end of Marron Street, Tyson Street, and the pipe at Forster Street would be below the
proposed sand fill. As described in Section 2.4, sand placement around storm drain outlets would be dug
out to allow proper drainage. Accordingly, impacts would be less than significant.
The bottom of the public stairs at the end of Tyson Street, Ash Street, Marron Street, Cassidy Street, and
Vista Way may be covered by the fill, which would tend to stabilize the stairways. As public access to the
beach via these stairways would not be affected, significant impacts would not occur upon implementation
of Alternative 1. The public access ramps at Wisconsin Street, Forster Street, and just north of Loma Alta
Creek would not be affected. The access road at Oceanside Boulevard would also not be impacted
because sand placement would cover only the lower end of the road. A private stairway with access to

4.10 Structures and Utilities
Page 4.10-2 Regional Beach Sand Project EIR/EA99-69\sect-04.10.wpd 7/19/00
the beach is located north of the creek. No adverse impacts to this structure would occur as a result of
Alternative 1. Existing private stairways to the beach may be partially covered. No impacts would occur,
however, because the fill would provide additional protection to the stairway and would not impact access
to the beach.
Sand placement around stationary lifeguard towers within the replenishment footprint would be conducted
by placing sand around the towers without removing them. The proposed fill at Tower No. 9 would not
be higher than the lifeguard’s line-of-sight since the tower is raised atop the concrete/rip-rap structure. At
Tower No. 11, the proposed fill would be approximately 13 feet above MLLW compared to the
lifeguard’s platform just under 11 feet above MLLW. As described in Section 2.4, the portion of the
proposed fill that is higher than the viewing platform would be removed to preserve line-of-sight views for
lifeguards. The sand will provide additional protection against storm surge damage and would temporarily
benefit the lifeguard towers; no adverse impacts would occur.
North Carlsbad
The Buena Vista Lagoon Weir north of the receiver site would not be impacted by any sand placed within
the site boundaries. Its associated drainage outlet structure is located adjacent to the bottom of the public
access stairway off Ocean Street, with two storm drain outlets located approximately 8.5 feet above the
existing beach surface at the base of the stairs. The top of the proposed sand fill would lie approximately
9.6 feet above the existing surface. Potential impacts could occur if beach replenishment activities blocked
the opening of the drains and interrupted service. However, implementation of Alternative 1 would require
storm drain discharge flow paths to remain unobstructed; therefore, significant impacts to storm drains
would not occur.
As discussed in Section 3.10, public access stairs are located off Ocean Street, Beech Avenue, Grand
Avenue, and Carlsbad Village Drive. In addition, several residential properties have private stairways for
beach access, several of which reach the beach surface. Many private stairways end above the beach
surface. Although implementation of Alternative 1 would raise the beach surface and cover the bottom
portion of some of these stairways with sand, beach access would not be restricted. Some existing stairs
may reach the sand surface which would be a beneficial effect. Overall, adverse impacts to access stairs
would not occur upon implementation of Alternative 1. Beach access via the access road at Pine Avenue
would not be impacted, since sand placement would not extend past the base of the road.

4.10 Structures and Utilities
Regional Beach Sand Project EIR/EA Page 4.10-399-69\sect-04.10.wpd 7/19/00
Several properties along this stretch of beach have sea walls. Although weep holes (i.e., small holes
designed to drain accumulated water) would be covered upon implementation of the proposed project, the
majority of sea wall tops would not be covered. Several properties have terraced sea walls and
landscaping; the lower terraces of which would be covered by the sand fill. As additional sand fill would
stabilize the shoreline and protect against erosion, implementation of Alternative 1 would not significantly
impact sea walls in the vicinity of the North Carlsbad receiver site.
Lifeguard Tower No. 9, although a temporary structure, is surrounded by rocks for erosion protection, and
is not moved during the winter season. Sand would be placed as close to the tower as possible to provide
additional protection against damage. The viewing platform for this tower is approximately 18 feet above
MLLW, and the proposed beach fill would be approximately 12 feet above MLLW. As such, no viewing
interference would occur to this lifeguard tower. No negative impacts would occur to the tower with
implementation of the Alternative 1.
South Carlsbad North
The only structure located within the sand receiver site is Lifeguard Tower No. 13, which is located high
on the bluff above the sand. No impacts would occur to the tower with sand placement.
Batiquitos
The storm drain at Moorgate Road is approximately 4.9 feet above the sand, and the proposed fill at the
Batiquitos receiver site would be approximately 12 feet above MLLW. Measures to ensure continued flow
through the storm drain would be implemented to prevent impacts to the storm drain.
The lower portions of both the public and private access stairs may be covered with sand. This would have
the beneficial effect of stabilizing the structures. Sand placement would not extend past the sea wall,
although some weep holes may be covered during sand placement. Although portions of the vegetated
groundcover may be covered by fill, no impacts would occur because the fill would minimize erosion,
similar to the groundcover.
If placement occurs during the summer season, when the lifeguard towers are located on the beach,
SANDAG would coordinate with the State to temporarily relocate the towers from the site during

4.10 Structures and Utilities
Page 4.10-4 Regional Beach Sand Project EIR/EA99-69\sect-04.10.wpd 7/19/00
construction. For public health and safety issues related to lifeguard towers, refer to Section 4.9 (Public
Health and Safety).
Leucadia
Lower portions of the public access stairways, ramp, and seasonal lifeguard tower would not be covered
by fill during sand placement, as the receiver site does not encompass these structures. Beneficial impacts
would occur to the numerous private stairways that extend to the beach within the receiver site footprint,
as the proposed fill would provide additional support.
Moonlight Beach
Storm drain pipes are located at the end of B Street at Moonlight State Beach and include one 36-inch,
one 60-inch, and three 48-inch pipes. The invert elevations of these storm drain outlets are approximately
8 feet above MLLW, which is approximately 2 feet below the top of the proposed beach fill. Low
drainage flow typically seeps under any sand or cobble that has accrued over the outlet at these locations.
During heavy drainage discharge, the flow creates its own path to the ocean. Nonetheless, sand placed
at the receiver sites near the storm drain pipes would be excavated to allow proper drainage. Adverse
impacts to storm drain outlets would be consequently avoided.
Public access stairways are located within the vicinity of the proposed receiver site, with stairway base
elevations ranging from 1.6 to 11.5 feet. Alternative 1 would cover the bottom portion of the stairways
with fill, which would tend to stabilize the stairways and structures. Beach access would not be affected
by implementation of Alternative 1.
The lifeguard towers located at B and C Streets are not moved during the winter season. Sand would be
placed as close to the base of the towers as possible and would provide beneficial impacts to the towers
through stabilization and reduced erosion. Both towers’ platforms are approximately 18 feet above MLLW
because they are located on a berm. The proposed beach fill would be approximately 12 feet above
MLLW. As such, no viewing interference would occur to this lifeguard tower, and no impacts would
occur.
4.10 Structures and Utilities
Regional Beach Sand Project EIR/EA Page 4.10-599-69\sect-04.10.wpd 7/19/00
Cardiff
The proposed sand fill would provide additional protective covering for the sewer outfall pipe which would
be a beneficial effect.
Sand placement would not extend to the rip-rap protection surrounding the parking lot or restaurants,
therefore, no impacts would occur. Lower portions of the lifeguard access ramp may be covered with fill,
but this would not impact access to the beach. If placement occurs during the summer months when
Lifeguard Tower No. 6 is located on the beach, SANDAG would coordinate with the State to temporarily
relocate it from the beach until after construction is completed (see also Section 4.9, Public Health and
Safety). Sand would be placed as close as possible to Lifeguard Tower No. 5 in order to provide
additional protection against erosion and storm surge. The proposed fill would be approximately 12 feet
above MLLW, and the 15-foot viewing platform would not be affected. No viewing interference would
occur to this lifeguard tower. Beneficial impacts would therefore occur to this lifeguard tower.
Solana Beach
The proposed sand replenishment project would provide additional protective covering for the buried
sewer outfall pipe, which would be a beneficial effect. Drainage through the storm drain to the ocean would
be maintained by excavating a channel in the fill; therefore, no adverse impact is anticipated. The storm
drain outlet located at Seascape Surf is high enough (i.e., at least 18 feet above MLLW) to avoid impacts
by the 12 feet above MLLW beach fill proposed under Alternative 1. Therefore no significant impacts are
anticipated.
The public and private access ramp and stairs are located above the proposed fill area. Access to the
beach would not be impacted. If sand placement occurs during the summer months when the lifeguard
tower at Seascape Surf is located on the beach, SANDAG would coordinate with the City of Solana
Beach to temporarily relocate them until construction is completed. The Fletcher Cove lifeguard tower
would remain unaffected by beach replenishment activities. Refer to Section 4.9 for an evaluation of public
health and safety.
4.10 Structures and Utilities
Page 4.10-6 Regional Beach Sand Project EIR/EA99-69\sect-04.10.wpd 7/19/00
Del Mar
Sand would be placed in front of the 17th Street storm drain outlet, but would be excavated to allow proper
drainage. Other storm drain outlets are located in the bluffs and would not be impacted by the proposed
replenishment; no impacts would occur to storm drain outlets.
The two access ramps near Powerhouse Park would not be affected by this alternative. Access to the R
beach would not be impacted. R
The permanent lifeguard towers would not be affected or blocked by the proposed fill. The viewing
platforms are approximately 20 feet off the sand while the proposed beach fill would be approximately 11
feet above MLLW. No impacts are anticipated to result from implementation of Alternative 1.
Torrey Pines
The permanent lifeguard tower located at the public parking lot at the base of Torrey Pines Road is located
outside the proposed sand receiver site and would not be impacted by sand replenishment. No additional
access points or structures exist within the vicinity of the proposed receiver site, and no impacts would
occur upon implementation of Alternative 1.
Mission Beach
The access stairs are incorporated into the boardwalk and are landward of the proposed receiver site.
Beach access via these stairs would not be impacted, and access to the boardwalk itself would not be
affected.
Lifeguard Towers Nos.16 and 17 are seasonal towers that are removed from the beach the last weekend
in October. If replenishment occurs while the towers are in place, SANDAG would coordinate with the
City of San Diego to temporarily relocate them out of the receiver site until after replenishment is
completed. Refer to Section 4.9 for public health and safety issues.
4.10 Structures and Utilities
Regional Beach Sand Project EIR/EA Page 4.10-799-69\sect-04.10.wpd 7/19/00
Imperial Beach
The public access ramp and gated access road are located above the proposed fill area and would not be
impacted by sand replenishment. Emergency vehicle access at the ends of Admiralty Way and Descanso
Avenue would not be impacted. If sand replenishment occurs during the summer season when the lifeguard
tower is located within the receiver site, SANDAG would coordinate with the City of Imperial Beach to
temporarily relocate it during construction. Section 4.9 (Public Health and Safety) addresses the effects
of lifeguard tower relocation and beach usage.
Borrow Sites
Impacts to structures and utilities located within the proposed borrow sites are discussed in Section 4.6
(Land Use).
Mitigation Measures for Alternative 1a
No significant impacts to utilities or structures were identified; no mitigation measures are required.
Impacts/Mitigation Measures for Alternative 1b
This alternative would differ from Alternative 1a in that construction of the proposed action would comply
with applicable jurisdictions’ noise ordinances (refer to Table 2-2). Because dredging and replenishment
activities would take a longer amount of time, the receiver sites would be closed longer than under
Alternative 1a (refer to Table 2-2 and Table 2-4). Although this alternative would take longer to
implement, it would still be short-term.
As with Alternative 1a, replenishment would result in a beneficial impact to structures and utilities by
stabilizing them; no significant impacts to structures and utilities are anticipated. Accordingly, no mitigation
measures would be necessary.
4.10 Structures and Utilities
Page 4.10-8 Regional Beach Sand Project EIR/EA99-69\sect-04.10.wpd 7/19/00
4.10.3 Alternative 2
Impacts of Alternative 2a
Receiver Sites
Implementation of this alternative would result in similar effects to structures and utilities as analyzed for
Alternative 1. Sand placement is beneficial for structures since it provides additional support and protection
against erosion and storm damage during winter months.
At the South Carlsbad South receiver site, the bottom portion of the public access stairway located at the
State Beach may be covered by fill during sand placement. However, this action would tend to stabilize
the stairways and structures. In addition, two lifeguard towers are located onsite with base elevations
ranging from 6 feet to 12 feet. These towers are removed during the winter season and placed against the
bluff north of the receiver site. If sand placement occurs during the summer season when the towers are
within the site, SANDAG will coordinate with the City of Carlsbad to temporarily relocate the towers
during construction. For public health and safety issues related to lifeguard towers, refer to Section 4.9
(Public Health and Safety).
Borrow Sites
Impacts to structures and utilities located within the proposed borrow sites are discussed in Section 4.6
(Land Use).
Mitigation Measures for Alternative 2a
No significant impacts to utilities or structures were identified under this alternative. Therefore, no mitigation
measures are required with project implementation.
Impacts/Mitigation Measures for Alternative 2b
This alternative would differ from Alternative 2a in that construction of the proposed action would comply
with applicable jurisdictions’ noise ordinances (refer to Table 2-6). Because dredging and replenishment
activities would take a longer amount of time, the receiver sites would be closed longer than under
4.10 Structures and Utilities
Regional Beach Sand Project EIR/EA Page 4.10-999-69\sect-04.10.wpd 7/19/00
Alternative 2a (refer to Table 2-4 and Table 2-6). Although this alternative would take longer to
implement, it would still be short-term.
As with Alternative 2a, replenishment would result in a beneficial impact to structures and utilities by
stabilizing them; no significant impacts to structures and utilities are anticipated. Accordingly, no mitigation
measures would be necessary.
4.10.4 No Action Alternative
No dredging or beach replenishment activities would occur under the No Action Alternative. There would
be no impacts to structures and utilities under this alternative and no mitigation measures would be
necessary. The beneficial effect of stabilizing structures such as stairways and outfalls would not occur
under this alternative.
4.11 Traffic
Regional Beach Sand Project EIR/EA Page 4.11-199-69\sect-04.11.wpd 7/19/00
4.11 TRAFFIC
This traffic impact section addresses the potential for the various alternatives to impact existing vehicular
traffic and parking conditions in the vicinity of the receiver sites. It acknowledges the attractiveness of R
beaches during summer and potential parking conflicts. The analysis would not change given a spring R
construction start instead of late summer. Vessel traffic and safety concerns are discussed in Section 4.9 R
(Public Health and Safety).
4.11.1 Significance Criterion
Traffic and parking impacts would be significant if beach replenishment activities resulted in a long-term
impact to access routes, local streets, or parking areas in the vicinity of the receiver sites.
4.11.2 Alternative 1
Impacts of Alternative 1a
Implementation of Alternative 1 would require delivery of construction equipment and the commuting of
work crews to the receiver sites. Construction vehicles would be driven to and kept on site for the duration
of beach replenishment activities. At a maximum, 12 personnel would be working at a receiver site at any
one time. Beach replenishment activities associated with Alternative 1 would not significantly affect traffic,
as Alternative 1 would generate very few trips. The small increases in traffic volumes during replenishment
would be temporary; and no long-term impacts to existing traffic and circulation patterns would occur.
Replenishment personnel would park in public parking areas and would not create significant parking
impacts given the small number of spaces required at each site.
Subsequent to the completion of replenishment, some changes in traffic could also occur. The
replenishment of receiver sites where there is currently little sand, such as Moonlight and Cardiff, could
make these locations more attractive to both residents and tourists, and it is expected that traffic could
increase accordingly. The use of parking would also increase. Some of the increase would come from new
users, and some would come from users of adjacent, currently sandy, but less convenient beaches. In the
latter case, there would be some decrease in traffic at the adjacent beaches.

4.11 Traffic
Page 4.11-2 Regional Beach Sand Project EIR/EA99-69\sect-04.11.wpd 7/19/00
The replenishment of beaches with the most existing sand, such as Del Mar and Mission Beach, would also
increase the attractiveness of the beach. However, the increase in use is likely to be less pronounced than
at the currently rocky beaches, and increases in traffic and parking congestion would also be less.
The most severe traffic and parking congestion would continue to occur on warm summer weekends and
holidays, and the improvement of the beaches with sand replenishment may induce additional use that
would marginally increase the congestion. Traffic and parking congestion at beaches is an accepted
occurrence, and it is not common practice to design infrastructure to accommodate these peak loads.
Additionally, the relatively limited amount of sand placed at an individual receiver site is predicted to remain
noticeable at the beach for an average of two years (Table 4.1-1). This would reduce the long-term
attractiveness of a site relative to other nearby locations, or to its condition prior to project implementation.
The long-term impact of the proposed beach sand replenishment on traffic and parking would not be
significant.
Mitigation Measures for Alternative 1a
No mitigation would be required.
Impacts/Mitigation Measures for Alternative 1b
With implementation of the longer construction schedule proposed under Alternative 1b, construction
vehicles would require vicinity parking and access for a longer period of time, and more construction
vehicle trips would result. Impacts during replenishment activities would still be less than significant due to
the short-term nature of this alternative. No mitigation measures would be necessary.
The post-replenishment impacts would be the same as for Alternative 1a, and would not be significant. No
mitigation measures would be necessary.
4.11.3 Alternative 2
Impacts of Alternative 2a
Alternative 2 would result in similar impacts to those described for Alternative 1. Impacts would be less
than significant.
4.11 Traffic
Regional Beach Sand Project EIR/EA Page 4.11-399-69\sect-04.11.wpd 7/19/00
Mitigation Measures for Alternative 2a
No mitigation would be required.
Impacts/Mitigation Measures for Alternative 2b
This alternative would differ from Alternative 2a in that construction of the proposed action would comply
with applicable jurisdictions’ noise ordinances (refer to Table 2-6). Because dredging and replenishment
activities would take a longer amount of time, construction vehicles would require vicinity parking and
access to the receiver sites for a longer period of time. Also, more construction vehicle trips would result.
Impacts would still be less than significant due to the short-term nature of construction under this alternative.
No mitigation measures would be necessary.
4.11.4 No Action Alternative
As no beach replenishment activities would occur, no traffic impacts would result.

4.12 Air Quality
Regional Beach Sand Project EIR/EA Page 4.12-199-69\sect-04.12.wpd 7/19/00
4.12 AIR QUALITY
The principal sources of pollutant emissions for the proposed action include the following:
• Combustion emissions from diesel engines used in dredging operations;
• Combustion emissions from diesel engine driven booster pumps used for sand conveyance;
• Combustion emissions from construction equipment at receiver sites used to install, position and remove
conveyance piping and pumps, construct training berms, and distribute sand; and
• Fugitive dust from earth (sand) moving operations.
Generally, air quality is a regional issue, and potential impacts to air quality are evaluated on a regional
basis. Localized impacts may be considered in cases of potential severe traffic congestion or the release
of toxic air pollutants. Neither of these cases are applicable to the proposed action. Therefore, the air
quality impact analysis considers the project as a whole, and not by individual receiver and borrow sites.
Air quality impacts are also not dependent upon the season of construction. R
4.12.1 Significance Criteria
Air quality impacts would be considered significant if the action would
• violate any federal or state ambient air quality standard;
• contribute to an existing or projected air quality violation; or
• expose sensitive receptors to criteria or toxic pollutant concentration in violation of applicable health-
based legal limit.
As noted in Section 3.12, the SDAPCD does not have quantitative emissions limits for construction
activities. It may be reasonably assumed for nonattainment pollutants, that if the project conforms to the
SIP, then emissions would not violate any ambient air quality standard nor contribute to an existing or
projected air quality violation. It may also be assumed that if the standards for nonattainment pollutants are
applied to attainment pollutants, then conformance to these standards would result in emissions that would
be less than significant.

4.12 Air Quality
Page 4.12-2 Regional Beach Sand Project EIR/EA99-69\sect-04.12.wpd 7/19/00
Conformance to the SIP is demonstrated by obtaining of appropriate permits from the APCD, or by
demonstrating that emissions would be less than de minimis thresholds established by the EPA.
4.12.2 Alternative 1
Impacts of Alternative 1a
Dredge Operation Emissions
The principal source of emissions from the dredge would be the diesel engines used for dredge propulsion,
driving dredging pumps, and driving electric generators. These would be large diesel engines, and short-
term NOx emission rates would very likely exceed the APCD thresholds for daily emissions, for new and
modified sources. This would require the applicant to obtain an Authority to Construct and Permit to
Operate. As part of the permitting procedure, an Air Quality Impact Analysis would be performed, if
necessary, to provide data relative to the anticipated NOx emission rates, and to demonstrate that state and
federal air quality standards would not be violated, and there would be no significant impact. The air quality
impact analysis would examine the health risk of toxic pollutant emissions (if any), and the permit process
would assure avoidance of a significant impact. During the dredge operation in San Diego Bay for the
Homeporting project, the Navy obtained a Permit to Operate which specified various conditions regarding
fuel use, dredge limits, etc. A copy of the Permit to Operate for the dredge used on that project is included
in Appendix F. It should be noted that dredge activity for the Homeporting project was related to creating R
a boat basin for a new carrier in San Diego Bay with a much larger quantity of dredged material. The R
conditions in that permit were project-specific and would not necessarily be applicable to the proposed R
action. Alternatively, an individual dredging vessel may be Registered with the California ARB and not R
require a specific air quality permit for this project. R
A second important emissions source would be the smaller vessels supporting the dredge. These vessels
include an anchor scow, a survey boat, and a small boat that would shuttle the dredge crews to shore and
back. A tug would also be used for initial placement and removal of the dredge at each source site. The
support vessels would be powered by diesel or gasoline engines, and would have associated combustion
emissions. Estimated emissions based on very preliminary data were calculated using boat engine size and
emission factor data from a recent EIS analysis for dredging in San Diego Harbor (DON 1999).
Preliminary estimated emissions are shown in Table 4.12-1. These emissions will be finalized through the
permit process.

4.12 Air Quality
Regional Beach Sand Project EIR/EA Page 4.12-399-69\sect-04.12.wpd 7/19/00
Table 4.12-1Alternative 1a – Estimated Emissions
Emission Source
Total Emissions - tons
CO ROC NOx SOx PM10
Support Boats 2.08 0.44 4.07 0.50 0.17
Mobilization and Demobilization 0.15 0.05 0.51 0.05 0.04
Sand Placement 0.43 0.14 2.13 0.54 0.27
Total Emissions 2.7 0.6 6.7 1.1 0.5
General Conformity de minimis Thresholds(1) 100 50 50 100 100
Exceed threshold? No No No NA NA
SDAB forecast emissions for 2010(2) 317,550 65,700 54,750 4,380 54,750
Exceed ten percent of SDAB emissions? No No No NA NA
Permitted Emissions Sources
Dredge 3.06 43.97 223.48 13.47 14.41
Slurry Booster Pump Engine 0.95 0.13 4.32 0.07 – (3)
Total Emissions, including permitted sources 7 45 235 15 12(1) De minimis thresholds for SDAB nonattainment pollutants VOC and NOx, and maintenance pollutant CO.
The basin is in federal attainment for PM 10; de minimis thresholds for SOx and PM 10 nonattainment are usedfor NEPA and CEQA significance determinations.
(2) Forecast emissions from California ARB 2000. Forecast emissions for 2000-2001 would differ from those for
2010, but the differences would be small compared with the totals. The order of magnitude is satisfactory forcomparison with project emissions.
(3) Emission factor not provided in source document.
Pump Operation Emissions
As described in Section 2.4, booster pumps would be necessary where pipelines would convey sand, as
a slurry, to the receivers sites, and the conveyance distance would be approximately 10,000 feet or greater.
Booster pumps would be necessary along the length from the Oceanside to North Carlsbad receiver sites,
and to convey material to South Carlsbad North, Moonlight Beach, and Torrey Pines. The exact locations
of pumps is not known at this time. At some onshore locations, electric power may be available to drive
the pumps, and pollutant emissions would not be of concern. At other locations, including off shore, a
diesel engine would be required to drive the pump, and NOx emissions would an issue. If the pump engine R
is over 50 brake horsepower (bhp), an Authority to Construct and Permit to Operate would be required, R
as described above for the dredge engines. Dredge pumps may also be Registered with the California R
ARB as described for dredge vessels. R

4.12 Air Quality
Page 4.12-4 Regional Beach Sand Project EIR/EA99-69\sect-04.12.wpd 7/19/00
Construction Equipment Emissions
Construction equipment would be used at each receiver site to install equipment, distribute the sand
received from the dredge, and remove the equipment. It was assumed that a large forklift (or small crane)
and a wheeled bulldozer or loader would be used for equipment installation and removal. For sand
placement, two wheeled loaders would be used, with occasional support from the forklift. There might also
be a small engine-generator to provide light for night operations. For the duration of operations, the data
from Table 2-2 was used, with the assumption that mobilization and demobilization would each take three
days at each receiver site. The results of the calculations based on preliminary data are shown in Table
4.12-1. Emission factors are taken from EPA document AP-42 and the South Coast Air Quality
Management District CEQA Air Quality Handbook (1993). Spreadsheets showing the data and emission
factors used in the calculations are included in Appendix F.
Table 4.12-1 also contains an entry for estimated pump operations emissions. The data on this line shows
estimated emissions for a diesel engine operating at 500 horsepower for 20 hours per day for 78 days.
These quantities were used to analyze a case where a slurry pump engine would have emissions less than
the APCD permit thresholds.
Dust Emissions
Projects that include major earthmoving activities usually are analyzed for the impact of dust emissions. The
proposed action includes many sand conveyance and distribution activities. However, for these operations,
the sand would be quite moist, and the potential for dust generation would be very low. Activities on dry
sand would be limited to mobilization at each site (one to two days) and crew access, both would be of
relatively short duration. Therefore, impacts from dust generation resulting from earthmoving, and from the
movement of vehicles on the beaches, would be less than significant.
Applicability Analysis for General Conformity
In order to assess whether the proposed action is exempt from a General Conformity analysis, the total
construction equipment emissions are compared with the General Conformity de minimis thresholds in
Table 4.12-1. The emissions from dredging and pumping operations that would be allowed by a Permit R
to Operate (or ARB Registration) are not included in the comparison. The determination is in accordance R
with 40 C.F.R. §51.853(d)(1) and §93.153(d)(1) which states that a conformity determination is not
4.12 Air Quality
5 This evaluation does not address lead, hydrogen sulfide or vinyl chloride. Although these pollutants areregulated by the state or federal government, through ambient air quality standards, little to no emission of thesesubstances would result from implementation of the proposed action.
Regional Beach Sand Project EIR/EA Page 4.12-599-69\sect-04.12.wpd 7/19/00
required for the portions of the action that would be permitted by the San Diego APCD under the New
Source Review program. As seen in the table, the estimated emissions of CO, ROC and NOx would be
less than the threshold values. The emissions are also compared to the area’s annual emissions forecast,
and it is seen that the project-related emissions of these three pollutants would be much less than ten
percent of the area emissions. Therefore, the proposed action is presumed to conform to the SIP, and a
formal conformity determination is not required.
A Record of Non-Applicability (RONA) is a memorandum required by Department of Navy policy that
reflects the determination of an authorized official that a formal conformity analysis is not required. A draft
RONA is included in Appendix F.
NEPA and CEQA Significance
The NEPA and CEQA impact analysis differ from the General Conformity analysis in that emissions of SO2
and PM10, attainment pollutants, are considered, as well as the nonattainment pollutant emissions5.
Therefore, SO and PM10 are included in estimated emissions calculations of Table 4.12-1, as well as
threshold values.
As stated in Section 4.12-1, the emissions of the project would not be significant if they would conform to
the SIP, and they would not expose sensitive receptors to pollutant concentrations. The issuance of permits
for major emissions sources, and the comparison of estimated project emissions with threshold values for
other sources, as shown in Table 4.12-1, demonstrate conformance with the SIP. The project would not
cause a violation of the 1-hour or 8-hour CO standard, because the project would not produce severe
traffic congestion, toxic pollutants or extraordinary quantities of fugitive dust. Thus, no sensitive receptors
would be exposed to pollutant concentrations. The California Air Resources Board (ARB) has identified
particulate emissions from diesel engine exhaust as toxic air contaminants. The ARB is now conducting
studies to determine if further controls will be required. At this time, no methods have been promulgated
for evaluating the impact of diesel engine exhaust. The intensity of operations, one or two pieces of
equipment moving back and forth on the beach, would be small compared with uses such as heavy traffic
or industrial warehouse operations, and it may be assumed that the impact of diesel emissions on local
residents would be less than significant. As noted above, there would be no extraordinary quantities of
4.12 Air Quality
Page 4.12-6 Regional Beach Sand Project EIR/EA99-69\sect-04.12.wpd 7/19/00
fugitive dust. Thus, no sensitive receptors would be exposed to pollutant concentrations. It is concluded
that the air quality impacts of Alternative 1a would be less than significant.
For purposes of full disclosure, the estimated emissions from the dredge and slurry booster pump engine R
are provided in Table 4.12-1. These emissions are not compared to the General Conformity de minimis R
thresholds for determining significance because they are permitted. R
Mitigation Measures for Alternative 1a
No significant impacts have been identified; accordingly, no mitigation measures are necessary.
Impacts/Mitigation Measures for Alternative 1b
Under this alternative, the same receiver sites would receive sand and the same borrow sites would be
dredged for material, but operations would occur over a different schedule. It would be necessary to
obtain an Authority to Construct and a Permit to Operate from APCD for the dredge operation.
Dredge(s), support boats, booster pumps and construction equipment would generate emissions. While
the duration of construction would be longer overall, the total emissions would not increase because there
would be no emissions during the period when construction was not occurring. The estimated emissions
values in Table 4.12-1 would not be exceeded by this variation. The draft RONA in Appendix F would
apply to this alternative as well. The minimal amount of traffic and lack of fugitive dust, plus conformity with
the SIP would support the conclusion of no significant impact.
4.12.3 Alternative 2
Impacts of Alternative 2a
The dredge operations would be similar in nature to Alternative 1, although the amount of material from
each borrow site would vary. APCD would require an Authority to Construct and Permit to Operate
which would specify operational conditions for fuel type and amounts, specific vessels, etc. Estimated
construction emissions for equipment used to place sand at each receiver site and locate the pipelines are
provided in Table 4.12-2 and the supporting calculations are provided in Appendix F. These estimated
emissions are less than the threshold values and the proposed action is presumed to conform with the SIP.
There is a very low potential for dust generation because the material being moved is extremely wet.

4.12 Air Quality
Regional Beach Sand Project EIR/EA Page 4.12-799-69\sect-04.12.wpd 7/19/00
Therefore there would be no air quality impacts. Finally, the RONA for Alternative 1 would also apply
to this alternative.
Table 4.12-2Alternative 2a – Estimated Emissions
Emission Source
Total Emissions - tons
CO ROC NOx SOx PM10
Support Boats 1.96 0.42 3.94 0.49 0.16
Mobilization and Demobilization 0.11 0.04 0.39 0.04 0.03
Sand Placement 0.44 0.15 2.19 0.56 0.27
Total Construction Equipment Emissions 2.5 0.6 6.5 1.1 0.5
General Conformity de minimis Thresholds(1) 100 50 50 100 100
Exceed threshold? No No No NA NA
SDAB forecast emissions for 2010(2) 317,550 65,700 54,750 4,380 54,750
Exceed ten percent of SDAB emissions? No No No NA NA
Permitted Emissions Sources
Dredge 2.86 41.14 209.10 12.60 13.48
Slurry Booster Pump Engine 0.95 0.13 4.32 0.07 – (3)
Total Emissions, including permitted sources 6 42 220 14 11(1) De minimis thresholds for SDAB nonattainment pollutants VOC and NOx, and maintenance pollutant CO. The
basin is in federal attainment for PM 10; de minimis thresholds for SOx and PM 10 nonattainment are used forNEPA and CEQA significance determinations.
(2) Forecast emissions from California ARB 2000. Forecast emissions for 2000-2001 would differ from those for2010, but the differences would be small compared with the totals. The order of magnitude is satisfactory forcomparison with project emissions.
(3) Emission factor not provided in source document.
Mitigation Measures for Alternative 2a
Because there would be no significant impacts, no mitigation is required.
Impacts/Mitigation Measures for Alternative 2b
Under this alternative, construction would occur over a start-stop schedule instead of continuous. It would
be necessary to obtain an Authority to Construct and Permit to Operate from APCD for the dredge
operation. Dredge(s), support boats, booster pumps and construction equipment would generate
emissions. While the duration of construction would be longer overall, the total estimated emissions would
4.12 Air Quality
Page 4.12-8 Regional Beach Sand Project EIR/EA99-69\sect-04.12.wpd 7/19/00
not increase because there would be no emissions during the period when construction was not occurring.
The estimated emissions values in Table 4.12-2 would not be exceeded by this variation. The draft RONA
in Appendix F would apply to this alternative as well. The minimal amount of traffic and lack of fugitive
dust, plus conformity with the SIP would support the conclusion of no significant impact. No mitigation
would be necessary.
4.12.4 No Action Alternative
No air quality impacts would result since no construction would occur. No mitigation measures would be
necessary.

4.13 Noise
Regional Beach Sand Project EIR/EA Page 4.13-199-69\sect-04.13.wpd 7/19/00
4.13 NOISE
The principal noise sources attributable to the proposed action would be diesel engines on the dredge, on
construction equipment at the receiver sites, and at the booster pump sites. The noise sources would not
vary from site to site. Noise impacts are evaluated at sensitive receptors at, and near the receiver sites.
Some of the receiver sites are similar to each other in the relationships of the sensitive receptors to the
beach areas. For brevity, similar sites are grouped together. This analysis is also not dependent upon the R
season of project construction because it focuses on permanent receptors (residents) which would be R
present regardless. R
4.13.1 Significance Criteria
Noise impacts would be considered significant if the action would
C result in daytime noise levels at any sensitive receptor in excess of the applicable construction noise
limits, as listed in Table 3.13-2;
C carry out noise-generating activities during the hours prohibited by the applicable construction noise
ordinance, as specified in Table 3.13-2;
C result in average hourly nighttime noise levels greater than 45 dBA Leq, or 5 dBA above the ambient
noise level, whichever is greater, at any residence for more than three consecutive nights;
C result in average hourly nighttime noise levels greater than 45 dBA Leq, or 5 dBA above the ambient
noise level, whichever is greater, at any residence if there has been no notification to the resident; or
C result in noise levels to sensitive threatened or endangered species in excess of standards set by the
resource agency with jurisdiction over the species.
4.13.2 Alternative 1
Noise Sources
The dominant noise generated during dredging and placement of sand will be the noise from diesel engines
used to drive various pieces of equipment. On the dredge, the engines would be used for propulsion, to
power the dredge equipment, and to provide electric power. At the receiver sites, diesel engines would

4.13 Noise
Page 4.13-2 Regional Beach Sand Project EIR/EA99-69\sect-04.13.wpd 7/19/00
be used in bulldozers, loaders, forklifts, and cranes, as this equipment may be required. Diesel engines may
also be used to drive booster pumps when needed to convey the sand slurry over distances greater than
10,000 feet.
Diesel engine noise levels for construction equipment are quoted in the literature as 85-90 dBA at 50 feet
from the engine. These are noise levels that may occur when the engine is under a heavy load; that is the
equipment is pushing, lifting, etc. Noise levels from the engine are less than 85-90 dBA when the
equipment is moving from one location to another without working, or when the equipment is idling. A
typical duty cycle for a piece of construction equipment includes all three phases: working, moving and
idling. Therefore, the average noise levels over a period of time would be less than 85-90 dBA.
Beach maintenance was in progress when site visits were made to the Mission Beach and Imperial Beach
receiver sites in July 1999. In both cases, the equipment in use were Case 621B wheeled loaders. Two
of the machines were equipped with buckets, one with a rake. Working noise levels for this machine were
measured, and then ambient background noise was mathematically removed, to generate an estimated noise
level of 74-77 dBA at a distance of 50 feet. Idling noise levels are estimated at 65-68 dBA at 50 feet.
These may be considered typical noise levels for all beach equipment that may be used for the project.
It is also noted that construction equipment are equipped with mandatory backup alarms, and sand
distribution requires construction equipment to change direction frequently. Therefore, the diesel engine
noise would be accompanied at some times by the backup alarms.
The diesel engines used on the dredge would be much larger than those used in construction equipment,
and the noise generated would be greater. However, the engines would be housed in structures which
would reduce the noise, and noise levels exceeding 90 dBA at a distance of 50 feet would not be
anticipated.
The diesel engine used to drive a slurry pump would also be larger than one used in construction equipment.
These engines normally are provided in an enclosure that will provide noise reduction. A noise level of 70
dBA at 50 feet is assumed for purposes of noise analysis (Department of the Navy 1997b).
4.13 Noise
Regional Beach Sand Project EIR/EA Page 4.13-399-69\sect-04.13.wpd 7/19/00
Impacts of Alternative 1a
Alternative 1a specifies work 24 hours per day, 7 days per week. However, nighttime and weekend work
is prohibited by local ordinance at the South Oceanside, North Carlsbad, Solana Beach, Del Mar, Mission
Beach and Imperial Beach receiver sites. Night and weekend work at the Torrey Pines site might also be
limited if the Del Mar ordinance prevented the night and weekend operation of a booster pump conveying
sand to Torrey Pines. Implementation of Alternative 1a would be a potential significant impact. In order
to avoid a significant impact, SANDAG would obtain a variance, or equivalent, from each local authority
prior to the commencement of work at each site. As part of the previous sand replenishment project
initiated by the Navy, noise variances were granted, where applicable, to allow construction to proceed
under the 7/24 schedule (Department of Navy 1997a, 1997b). Under this alternative, the local jurisdiction
would issue a variance or construction would proceed under the schedule allowed by that locality, as
applicable (Alternative 1b or 2b). Therefore, there would be no situation where construction would
proceed under the 7/24 schedule but not allowed under special variance or exemption. There would be
no significant noise impact.
Receiver Sites
South Oceanside, North Carlsbad, Moonlight Beach, Cardiff, Del Mar, Mission Beach, and Imperial
Beach - Beach Front Receptors
At each of these receiver sites, except Cardiff, beachfront homes are at or near the same elevation as the
beach restoration area, and within 50 feet of the nearest points of planned sand distribution. At Cardiff,
the sensitive receptors adjacent to the beach are restaurants. The dominant existing noise at each of these
sites is the surf, and ambient surf noise levels range from 63-69 dBA Leq, as described in Section 3.13.
During beach restoration, the principal project noise at the beachfront homes and restaurants would be that
of the construction equipment. When working at that point of the beach closest to the homes, construction
noise levels at the homes would be anticipated to occasionally exceed 75 dBA. Maximum hourly average
noise levels, because of working cycles and changes of location, would be expected to be on the order of
65 dBA Leq. This noise level is of similar magnitude as the ambient surf noise. The peak construction noise
event would be a diesel engine under load, sounding the backup alarm close by a residence. This would
easily be heard by residents. The average noise change would be noticed because of a difference in

4.13 Noise
Page 4.13-4 Regional Beach Sand Project EIR/EA99-69\sect-04.13.wpd 7/19/00
character from the ambient surf noise, and because the overall average noise level would be anticipated to
increase 3-6 dBA.
As the work would move away from any individual receptor, the noise level would decrease, and at a
distance of 200 feet, a decrease of 10-12 dBA would be anticipated. At that distance, maximum
construction noise levels would be 65 dBA or less, and average noise levels on the order of 55 dBA Leq.
At nighttime, when work would occur within 200 feet of a residence, the change in noise environment could
be anticipated to disturb the sleep of some residents. While closing the windows would reduce the noise
level, the change in the volume and character of the noise, if one normally sleeps with windows open, may
disturb sleep as much as an increase in noise would. The nighttime construction noise would be an adverse
impact. However, the impact would be less than significant because residents would be notified at least
one week in advance of the work near their homes, and the work would last no longer than three
consecutive days within a distance where the noise might cause a sleep disturbance.
The approximate minimum distance from the dredge to beachfront receivers is 4,500 feet. This occurs at
the Cardiff and Del Mar receiver sites. Noise attenuation from a point source, at that distance, due to the
spreading of energy and atmospheric effects would be approximately 45 dBA. With a 90 dBA source
noise at the dredge, the resulting noise level at a beach front residence would be approximately 45 dBA.
With the normal prevailing onshore wind, noise levels may seem slightly greater. However, a noise level
of 45 dBA would be much less than the normal ambient noise level from wave activity on the beach, and
noise from the dredge would not be expected to be audible.
Booster pumps are anticipated be required for replenishment at the Oceanside, North Carlsbad and Torrey
Pines receiver sites. The pump for Torrey Pines would likely be located at or near the Del Mar receiver
site. If pump noise is 70 dBA Leq, and the pump can be located at least 250 feet from a sensitive receptor,
then the noise at the receptor would be 56 dBA Leq. This noise would be at least 5 dBA below the ambient
noise levels of 61-69 dBA, and would not be a significant impact. If a suitable location cannot be found
at a distance of 250 feet or greater, there is a choice of noise abatement measures to maintain less than
significant noise impacts: (1) A sand berm can be constructed around the pump to reduce noise; (2) it may
be possible to use an electric motor to drive the pump, rather than a diesel engine.

4.13 Noise
Regional Beach Sand Project EIR/EA Page 4.13-599-69\sect-04.13.wpd 7/19/00
South Carlsbad North
The closest residences to this receiver site are 550 to 750 feet from the beach area. Most of the beach
area where sand would be distributed is not directly visible because of the topography. Line of site
construction equipment noise would be more than 20 dBA less at the residences than at the beach, and
would not likely be discernable above the traffic noise from Carlsbad Boulevard. The noise impact would
not be significant. There is no potential impact at this site from dredge or booster pump noise.
Batiquitos, Leucadia, and Solana Beach - Bluff Receptors
Sensitive noise receptors at these three sites are residences located on bluffs above the receiver sites.
Ambient surf noise levels at these homes are estimated at 63-66 dBA Leq. The topography and slightly
greater distance from these homes to the sand replenishment area, when compared with the beach front
homes at South Oceanside, Moonlight Beach, etc., would maximum reduce noise levels to approximately
70 dBA for short peak noises, and 60 dBA Leq for an hourly average.
Impacts would be similar to those at the sites with beach front homes. The peak construction noise event
would be a diesel engine under load, sounding a backup alarm while close to a house. This event would
be heard by residents. The average noise change would be noticed because of a difference in character
from the ambient surf noise, and because the overall average noise level would be anticipated to increase
2 to 4 dBA. At nighttime, when work would occur within 200 feet of a residence, the change in noise
environment could be anticipated to disturb the sleep of some residents. While closing the windows would
reduce the noise level, the change in the volume and character of the noise may disturb sleep as much as
an increase in noise would. The nighttime construction noise would be an adverse impact. However, the
impact would be less than significant because residents would be notified at least one week in advance of
the work near their homes, and the work would last no longer than three consecutive days within a distance
where the noise might cause a sleep disturbance.
The approximate minimum distance from the dredge to bluff top sensitive receivers is 4,000 feet, which
would occur at the Batiquitos receiver site. At that distance, noise attenuation from a point source would
be approximately 43 dBA. With a 90 dBA source noise at the dredge, the resulting noise level at bluff top
residences would be approximately 47 dBA. With the normal prevailing onshore wind, noise levels may
seem slightly greater. However, a noise level of 47 dBA would be much less than the normal ambient noise
level from wave activity on the beach, and noise from the dredge would not be expected to be audible.
4.13 Noise
Page 4.13-6 Regional Beach Sand Project EIR/EA99-69\sect-04.13.wpd 7/19/00
Booster pumps are anticipated be required for replenishment at the Leucadia and Moonlight Beach receiver
sites. The pump would likely be located in the Batiquitos/Leucadia area. If pump noise is 70 dBA Leq, and
the pump can be located at least 250 feet from a sensitive receptor, then the noise at the receptor would
be 56 dBA Leq. This noise would be at least 5 dBA below the ambient noise levels, and would not be a
significant impact. If a suitable location cannot be found at a distance of 250 feet or greater, there is a
choice of noise abatement measures to maintain less than significant noise impacts: (1) A sand berm can
be constructed around the pump to reduce noise; (2) it may be possible to use an electric motor to drive
the pump, rather than a diesel engine.
Torrey Pines
The nearest residential receptors to this site are approximately 2,000 feet away, and are closer to major
roadways than the beach area. Under favorable atmospheric conditions, project related noise may be
faintly heard at these receptors. There would be no significant noise impact.
Sensitive Bird Species
There are no specific noise standards set by the USFWS for the California least tern or the western snowy
plover (Hays 2000). The noise standard set for nesting sites of other southern California threatened or
endangered species (i.e., California gnatcatcher, least Bell’s vireo) is 60 dBA (County of San Diego 1991).
Noise levels at 200 feet from the receiver beaches are projected to be, at peak, approximately 65 dBA
and on average approximately 55 dBA Leq. The distance from the receiver sites to the closest nesting
locations are shown in Table 4.13-1. Some nesting sites are shown to be in proximity to the receiver
beaches (i.e., just inland of Cardiff), they are all greater than 200 feet from the construction areas.
Therefore, due to the distance between the existing colonies and the proposed project sites (greater than
200 feet) and the high ambient surf noise levels (63 to 69 dBA Leq), construction activities would not be
expected to have a significant impact on the California least tern or western snowy plover colonies.
Mitigation Measures for Alternative 1a
No significant impacts have been identified; accordingly, no mitigation measures are necessary.

4.13 Noise
Regional Beach Sand Project EIR/EA Page 4.13-799-69\SANDAG EIREA 4.1 to 4.13.wpd 7/17/00
Table 4.13-1Potential Noise Levels at the Closest Sensitive Bird Locations
Noise Levels Construction
On Site within 50 feet at 200 feetAmbient Peak Average Peak Average
Receiver Site Bird Species Distance Closest Location (dBA Leq) (dBA)(dBALeq) (dBA)
(dBALeq)
South Oceanside California least tern 2-5 mi. north Santa Margarita River Camp Pendleton 62-65 75 65 65 55
western snowy plover 2-5 mi. north Santa Margarita River Camp Pendleton
North Carlsbad California least tern 2-5 mi. north Santa Margarita River Camp Pendleton 68-69 75 65 65 55
western snowy plover w/in 1 mi. south Agua Hedionda Lagoon
South Carlsbad California least tern approx. 1.8 mi. south Batiquitos Lagoon 52-62 75 65 65 55
western snowy plover approx. 1.8 mi. south Batiquitos LagoonBatiquitos California least tern approx. 0.25 mi. inland Batiquitos Lagoon 63-66 75 65 65 55
western snowy plover approx. 0.25 mi. inland Batiquitos Lagoon
Leucadia California least tern approx. 0.25 mi. inland Batiquitos Lagoon 65-66 75 65 65 55
western snowy plover approx. 0.25 mi. inland Batiquitos Lagoon
Moonlight Beach California least tern approx. 2.5 mi. inland Batiquitos Lagoon 67-68 75 65 65 55
western snowy plover approx. 2.5 mi. inland Batiquitos Lagoon
Cardiff California least tern just inland San Elijo Lagoon 64-68 75 65 65 55
western snowy plover just inland San Elijo LagoonSolana Beach California least tern less than 1 mi. San Dieguito Lagoon 63-66 75 65 65 55
western snowy plover less than 1 mi. San Dieguito Lagoon
Del Mar California least tern less than 1 mi. San Dieguito Lagoon 59-61 75 65 65 55
western snowy plover less than 1 mi. San Dieguito Lagoon
Torrey Pines California least tern less than 1 mi. Los Peñasquitos Lagoon nd 75 65 65 55
western snowy plover less than 1 mi. Los Peñasquitos Lagoon
Mission Beach California least tern less than 1 mi. Mission Beach 63-65 75 65 65 55
western snowy plover less than 0.5 mi. Mission Beach
Imperial Beach California least tern less than 1 mi. Tijuana Estuary 65-67 75 65 65 55western snowy plover less than 1 mi. Tijuana Estuary
nd = no data available

4.13 Noise
Page 4.13-8 Regional Beach Sand Project EIR/EA99-69\sect-04.13.wpd 7/19/00
Impacts of Alternative 1b
Under this alternative, the same receiver sites would receive sand and the same borrow sites would be
dredged for material, but operations would occur over a different schedule. At receiver sites where local
noise ordinances prohibit night and weekend work, the work schedule would be limited to comply with the
ordinances. There would be no potential significant impact related to violation of hours limitations, and no
variances would be required or obtained.
There would be adverse, but not significant nighttime noise impacts at the Batiquitos, Leucadia, Moonlight
Beach and Cardiff receiver sites as described for Alternative 1a. Residents near these sites would be
notified at least one week prior to the start of the work, and the period of nearest impact would not exceed
three consecutive days. The noise from dredge and booster pump operations would be the same as for
Alternative 1a.
Mitigation Measures for Alternative 1b
No significant impacts have been identified; accordingly, no mitigation measures are necessary.
4.13.3 Alternative 2
Impacts of Alternative 2a
Alternative 2a, like Alternative 1a, specifies work 24 hours per day, 7 days per week. Nighttime and
weekend work is prohibited by local ordinance at the South Oceanside, Solana Beach, Del Mar, Mission
Beach and Imperial Beach receiver sites. Night and weekend work at the Torrey Pines site might also be
limited if the Del Mar ordinance prevented the night and weekend operation of a booster pump conveying
sand to Torrey Pines. Implementation of Alternative 2a would be a potential significant impact. In order
to avoid a significant impact, SANDAG would obtain a variance, or equivalent, from each applicable local
authority prior to the commencement of work at each site. As described under Alternative 1a, construction
would only proceed under the schedule allowed by ordinance or variance; therefore, there would be no
significant noise impact.
Impacts at the sites with beach front or bluff top homes or businesses would be the same as those
described for Alternative 1a, with likely adverse, but not significant nighttime noise impacts. Residents near
4.13 Noise
Regional Beach Sand Project EIR/EA Page 4.13-999-69\sect-04.13.wpd 7/19/00
these sites would be notified at least one week prior to the start of the work, and the period of impact
would not exceed three consecutive days. There would be no potential impacts to residents near the North
Carlsbad, Batiquitos, Leucadia or Moonlight Beach sites, as these sites would not be used with Alternative
2.
The South Carlsbad South receiver site, not a part of Alternative 1, would be included in Alternative 2.
The sensitive receptor area at this site is the South Carlsbad State Beach Campground, located on the bluff
above the beach. Construction equipment generated noise levels at this site would be similar to those
described for bluff top sites in Alternative 1a, approximately 70 dBA for short peak noises, and 60 dBA
Leq for an hourly average. There would likely be some adverse, short-term, but not significant noise
impacts. The character of impact would be slightly different from that at the bluff top homes, as the
background ambient noise at the camp sites would have more traffic noises, and the residents tents would
provide less noise insulation than a normal home. Visitors to the campground would be notified at least one
week prior to the start of the work, or as soon as feasible, given the transient nature of campground
occupancy. The period of nearby impact would not exceed three consecutive days.
Sensitive bird species (California least tern or western snowy plover) would be located far enough away
that even peak noise levels would be lower than the ambient noise generated by wave action (Table 4.13-
1).
Mitigation Measures for Alternative 2a
No significant impacts have been identified; accordingly, no mitigation measures are necessary.
Impacts of Alternative 2b
Under this alternative, the same receiver sites would receive sand and the same borrow sites would be
dredged for material as for Alternative 2a, but operations would occur over a different schedule. At
receiver sites where local noise ordinances prohibit night and weekend work, the work schedule would be
limited to comply with the ordinances. There would be no potential significant impact related to violation
of hours limitations, and no variances would be required or obtained.
There would be adverse, but not significant nighttime noise impacts at the south Carlsbad South receiver
site as described for Alternative 2a and at the Cardiff receiver site as described for Alternative 1a.

4.13 Noise
Page 4.13-10 Regional Beach Sand Project EIR/EA99-69\sect-04.13.wpd 7/19/00
Residents near the Cardiff site would be notified at least one week prior to the start of the work; visitors
to the campground would be notified as soon as feasible. The period of impact would not exceed three
consecutive days. The noise from dredge and booster pump operations would be the same as for
Alternatives 1 and 2a.
Mitigation Measures for Alternative 2b
No significant impacts have been identified; accordingly, no mitigation measures are necessary.
4.13.4 No Action Alternative
Under this alternative, there would be no dredge activity, construction at receiver sites or pipeline pumps,
and there would be no noise levels above ambient conditions at any locations. There would be no noise
impacts.
5.0 Cumulative Projects and Impacts
Regional Beach Sand Project EIR/EA Page 5-199-69\SANDAG EIREA 5 to 10.wpd 7/17/00
CHAPTER 5.0CUMULATIVE PROJECTS AND IMPACTS
CEQA Guidelines require a discussion of significant environmental impacts that would result from project-
related actions in combination with “closely related past, present, and probable future projects” located in
the immediate vicinity (CEQA Guidelines, § 15130 [b][1][A]). These cumulative impacts are defined as
“two or more individual effects which, when considered together, are considerable or which compound or
increase other environmental impacts” (CEQA Guidelines, § 15355).
Federal regulations implementing NEPA (40 C.F.R. §§ 1500-1508) require that the cumulative impacts
of a proposed action be assessed. NEPA defines a cumulative impact as an “impact on the environment
which results from the incremental impact of the action when added to other past, present, and reasonably
foreseeable future actions” (40 C.F.R. § 1508.7).
In general, effects of a particular action or group of actions would be considered cumulative impacts under
the following conditions:
• effects of several actions occur in a common location;
• effects are not localized (i.e., can contribute to effects of an action in a different location);
• effects on a particular resource are similar in nature (i.e., affects the same specific element of a
resource); and
• effects are long-term (short-term impacts tend to dissipate over time and cease to contribute to
cumulative impacts).
5.1 DESCRIPTION OF CUMULATIVE PROJECTS
Cumulative projects considered in this analysis consist of other ongoing or proposed beach nourishment
projects adjacent to the receiver sites; capital improvement or development projects proposed adjacent
to receiver sites; and proposed actions adjacent to the borrow sites. The time frame for considering
cumulative future projects is from 2000 to 2005. This time frame is selected because the sand dispersion
model estimates that most sand placed at individual receiver sites will be redistributed within the littoral R
system within five years (Moffatt & Nichol 2000a). R
5.0 Cumulative Projects and Impacts
Page 5-2 Regional Beach Sand Project EIR/EA99-69\SANDAG EIREA 5 to 10.wpd 7/17/00
Potential cumulative projects for both project receiver and borrow sites are identified in Table 5-1. The
table identifies the project name, the jurisdiction within which the action will occur, a brief description and
the anticipated schedule. As noted, some projects will occur annually. Other pertinent, recently completed
beach nourishment projects are included as well, although this is not intended to be an exhaustive list of all
historical beach nourishment projects in the San Diego region. In fact, as described in Section 4.8, there
were over 35 major beach replenishment projects between Oceanside and Carlsbad between 1954 and
1988. Between 1981 and 1996, 18 replenishment projects placed more than 10.5 million cy in the same
area (Coastal Environments 1998).
As described in Section 1.1.1, SANDAG has prepared a Shoreline Preservation Strategy to address R
concerns about shoreline erosion along the San Diego region coastline. That document has a menu of R
possible solutions including beach replenishment, construction of retention structures such as groins, R
construction of property protection structures such as sea walls, and policies to regulate beach and bluff R
development such as building set-backs and irrigation control. At present, the Shoreline Preservation R
Strategy is a strategic planning document with no authority for implementation, no list of specific projects, R
no identified locations for features such as groins, berm, sea walls, and extremely limited funding for the R
estimated $150 million cost (beach building component only). As also noted in Sections 1.1.1 and 2.1.4, R
the $14.3 million dollar budget for the RBSP project is one-time-only funding and the local assessment to R
fund coastal monitoring is approximately $70,000. Therefore, the Shoreline Preservation Strategy is not R
considered a “reasonably foreseeable project.” R
5.2 ANALYSIS OF CUMULATIVE IMPACTS
5.2.1 Geology and Soils
The three littoral cells along the coast of the San Diego region have been experiencing a reduction of natural
sand sources for beach replenishment and the beaches fed by this process have been eroding over time.
Implementation of the proposed replenishment action would therefore be a beneficial impact and would
cumulatively contribute to the reduction of erosion at the identified beach sites. Over the long term, only
relatively minor increases in the thickness of sand on the beaches and offshore bars are anticipated, similar
to changes in thickness that should naturally occur seasonally. Past beach replenishment projects have
occurred in similar locations and have not changed the littoral processes off the coast. The projects listed
in Table 5-1 would not affect the transport of sediment off the coast, although they would provide
additional sand sources to sustain the littoral cells. Therefore, implementation of the proposed action would
be a cumulatively beneficial impact to geology and soils.

5.0 Cumulative Projects and Impacts
Regional Beach Sand Project EIR/EA Page 5-399-69\SANDAG EIREA 5 to 10.wpd 7/17/00
Table 5-1List of Cumulative Projects
Project Jurisdiction Description Schedule
Oceanside HarborMaintenanceDredging
Oceanside Oceanside Harbor is dredged annually by the USACOE to maintain sufficient depth for boat traffic. Dredgedmaterial is typically disposed of by placing it on Oceanside beaches south of Tyson Street. The averageamount of material placed on the beach is 175,000 cy. The most recent activity (February 2000) placed272,000 cubic yards.
Annually inthe spring
Oceanside HarborPrecise PlanAmendment
Oceanside This project includes proposals to expand the existing marina access and capacity, expand the existing boatlaunch, improve area beaches, and construct a marine research and interpretive center. The research centerand expanded boat launch ramp would be located in the eastern portion of the marina. The beachimprovement portions of the project would include constructing a boardwalk, picnic facilities, and concessionand public sanitation buildings on the Pacific Coast side of the marina. In addition, adequate additionalparking would be constructed as part of the amendment.
Fall 2001
ManchesterResort Project
Oceanside This proposed project is in the planning and engineering phase, and must complete the CEQA process. Itconsists of three hotel towers containing 150 time-share units on 10.3 acres. Construction is estimated at approximately 2 years. The project area extends from the eastern beach edge inland adjacent to the OceansidePier. During construction, it is anticipated that Pacific Street from Seagaze Drive to Civic Center Drive andPier View Way and Mission Avenue between Pacific Street and Myers Street would be closed to throughtraffic.
2001 to 2003
Buena Vista LagoonWeir ReplacementProject
Oceanside The City of Oceanside has proposed to replace the existing weir at the mouth of the Buena Vista Lagoonlocated at the border of the cities of Oceanside and Carlsbad. The project would replace the existing 50 footlong weir with an 80- by 10-foot weir. The new weir design would decrease beach erosion downstream and increase flows through the mouth of the lagoon during storm events while maintaining the freshwatercharacteristic of the lagoon.
Sept. 2000
The BandstandSewer Lift StationReplacement
Oceanside The proposed project would relocate the existing sewer lift station near the Oceanside Pier south to TysonPark. The project would involve lift station construction, as well as extensive construction along the Strandfor pipe installation.
Fall 2000
La Paz CountySand-for-TrashPilot Program
Oceanside This project involved an exchange of San Diego trash for Arizona sand. Solid waste was shipped to Arizonaand the sand displaced was used to replenish San Diego regional beaches. Approximately 1,000 cy of sandwere placed on the beach at the foot of Oceanside Boulevard. This project has been discontinued and noadditional phases are planned.
March 1997

5.0 Cumulative Projects and Impacts
Page 5-4 Regional Beach Sand Project EIR/EA99-69\SANDAG EIREA 5 to 10.wpd 7/17/00
Table 5-1. Continued
Project Jurisdiction Description Schedule
Pacific Street BridgeWidening
Oceanside The approved project involves widening the opening under the Pacific Street Bridge at Loma Alta Creek toallow improved movement of water both from the creek and tidal flushing in the lagoon and creek.
Fall 1999 toSpring 2000
Agua HediondaLagoonMaintenanceDredging
Carlsbad This lagoon has undergone maintenance dredging since 1955 and in that period, over 5.9 million cy may havebeen removed. This dredged material has been placed on adjacent beaches in Carlsbad. In 1998, over 59,000cy were dredged from the middle basin, and over 214,000 cy were dredged from the inner basin. In 1999, anestimated 155,000 cy were dredged from the outer basin.
Annualdredging,permit expiresin 2001
Bristol CoveDredging Project
Carlsbad Dredging of 20,000 cy of silt from the Bristol Cove boat channel at the intersection of Park Drive and CoverDrive to restore it to its original -9 MSL elevation. Although this dredged material was not directly placed onCarlsbad beaches, it was placed in a future borrow pit within the outer basin of the Agua Hedionda lagoonwhich displaced sand for placement onto nearby Carlsbad beaches.
May 1998
Batiquitos LagoonEnhancementProject
Carlsbad A phased project to restore Batiquitos Lagoon was initiated in 1995, which has resulted in the dredging of 1.8million cy of sediment from the lagoon. Dredged material was used as beach nourishment material forCarlsbad, both south of Agua Hedionda Lagoon and north of Batiquitos Lagoon. 1.6 million cy of sand wereplaced on Encinas Beach (near proposed South Carlsbad receiver sites) and 200,000 cy were placed adjacentto the lagoon inlet (proposed Batiquitos receiver site). Continued dredging and placement is planned tomaintain the lagoon, and may need to be conducted annually. Dredging and placement in May 1999 yielded10,000 cy; half of which were placed on Carlsbad beaches and the other half of which were placed in leasttern nesting areas in the lagoon. The most recent dredging (February 2000) anticipates placement of 50,000to 70,000 cy at Encinitas/South Ponto Beach.
Likelyannually
Carlsbad Boulevard/Descanso LotSubdivision
Carlsbad As a by-product of a condominium construction project, 20,000 cy of sand were placed at Ponto Beach (nearproposed South Carlsbad receiver sites).
July 1996
Moonlight Beach Encinitas The city sponsors yearly beach replenishment to place approximately 1,000 cy of sediment on MoonlightBeach. The sand is purchased and trucked to the site. The most recent replenishment with imported sandwas placement of 1,327 cy in Spring 1999.
Annually,prior toMemorial Day
San Elijo LagoonMouth Opening
Encinitas This project dredges the mouth of the San Elijo Lagoon to maintain the opening and places the cobble andsand material south of the mouth on Cardiff Beach. Dredging occurs on an as-needed basis. An average of 6,000 cy has been placed on the beach annually. The most recent maintenance dredging (May 1999) resultedin the placement of approximately 10,000-15,000 cy of sand. In 1999, the mouth was opened three times.
At a minimum,annually in thespring

5.0 Cumulative Projects and Impacts
Table 5-1. Continued
Project Jurisdiction Description Schedule
Regional Beach Sand Project EIR/EA Page 5-599-69\SANDAG EIREA 5 to 10.wpd 7/17/00
Lomas Santa FeDrive GradeSeparation
Solana Beach As a by-product of a roadway project, 51,000 cy of material were placed at Fletcher Cove and 3,000 cy wasplaced at Tide Beach Park.
February 1999
Presnell/Colton SeaCave
Solana Beach Construct one temporary geotube breakwater at the northern headland of Fletcher Cove and one 80-foot groinat the southern headland of Fletcher Cove to allow low volume beach fill in cove thereby providing access forseawall construction
Spring 2000
Fletcher CoveMaster Plan
Solana Beach Redevelopment of Fletcher Cove Beach Park and surrounding business district including construction of aparking garage, new lifeguard station, additional open space, pedestrian paths, and other upgrades.
2001-2002
Mission BeachBoardwalkWidening
San Diego This project would widen the existing Mission Beach Boardwalk by 12 feet (9 feet of concrete and 3 feet oflandscaped buffer). Construction of Phase 1 will include a 750-foot length of the boardwalk from Ventura toPacific Beach Drive. Funding for a portion of Phase I from Ventura Place to Santa Barbara Place is currentlyavailable. Phase II will include that portion from the South Mission Beach jetty to San Fernando Place. Phase III will include that portion from Pacific Beach Drive. to Oliver Avene and Phase IV would includeexpansion between Pacific Beach Drive and Thomas Avenue. All construction will be limited to the monthsbetween Labor Day and Memorial Day.
Phase I beganin early 2000
SD UnderwaterRecreation Area andHMCS Yukon
San Diego Creation of a 450-acre underwater recreation area, 1.85 miles from Mission Beach shoreline near borrow siteMB-1. Placement of a 360-foot-long sunken Canadian vessel, HMCS Yukon, to a depth of 100 feet to serveas diving and fishing area. Recreation area will serve as designated area for at least three more similar ships at3 to 5 year intervals.
Spring 2000
Global West FiberOptic Cable Project
San Diego This project involves the placement of a fiber optic cable that runs offshore and parallel to the coastlinebetween San Diego and San Francisco at 3 to 12 miles offshore. One onshore connection is proposed atMission Beach, near the terminus of Grand Avenue. The cable would lie approximately 3,000 feet north ofthe proposed MB-1 borrow site.
2001
U.S. Coast Guard’sBallast PointDredging
Imperial Beach Material from maintenance dredging for the Ballast Point berthing area resulted in placement of approximately51,000 cy of material in the nearshore area just south of the pier in 1995. Permits were issued in 1999 for anidentical project for up to 45,000 cy of sand in the same offshore area, which was implemented in early 2000.
February 2000

5.0 Cumulative Projects and Impacts
Table 5-1. Continued
Project Jurisdiction Description Schedule
Page 5-6 Regional Beach Sand Project EIR/EA99-69\SANDAG EIREA 5 to 10.wpd 7/17/00
U.S. NavyHomeportingProject
Oceanside, Del Marand San Diego
As part of a project to dredge the North Island berthing area and the main navigation channel into San DiegoHarbor, up to 5.5 million cy were permitted for beach nourishment at 11 receiver sites in the San Diegoregion. The project was discontinued in 1997 when munitions were found in the dredged material. Beforetermination, Oceanside received 102,000 cy of sand that was placed onshore. Approximately 170,00 cy wereplaced in the nearshore zone off Del Mar and 12,000 cy were placed in the nearshore off Mission Beach.
Ended October 1997
CDFG ArtificialReef Program
Various locationsoffshore of the SanDiego Region’sCoastline
CDFG has been permitted by the USACOE to place up to 22,000 tons of rubble at the kelp reef site nearMB-1. With an additional 22,000 tons of material, the total amount of rubble placed at the kelp reef sitewould be 35,000 tons. The purpose of the rubble is to create hard bottom surfaces so that kelp may attach.
Various
5.0 Cumulative Projects and Impacts
Regional Beach Sand Project EIR/EA Page 5-799-69\SANDAG EIREA 5 to 10.wpd 7/17/00
5.2.2 Coastal Wetlands
Dredge and discharge operations associated with the proposed action and other sand replenishment
projects in the area are being implemented for the purpose of beach enhancement and replenishment. No
cumulative impacts to coastal wetlands are expected beyond those discussed for the individual sites. Inlet
maintenance programs currently sustain Loma Alta Creek, Buena Vista Lagoon, Agua Hedionda Lagoon,
Encinas Creek, Batiquitos Lagoon, San Elijo Lagoon, San Dieguito Lagoon, and Los Peñasquitos Lagoon.
Also, as described in Section 2.5 of this document, SANDAG would participate in a four-year monitoring
effort to help determine potential impacts to lagoons associated with this specific project. These
maintenance programs ensure the continued value and function of the wetlands. Therefore, no significant
cumulative impacts to coastal wetland functioning would occur with implementation of the proposed action.
5.2.3 Water Resources
The proposed action would be implemented in accordance with RWQCB permit specifications and
monitoring per the framework described in Section 2.5. The proposed action incorporates training dikes
to reduce, as much as possible, water quality/hydrological impacts. All identified cumulative projects are
required to comply with permit guidelines as well. The proposed project would not produce long-term
turbidity at the borrow sites or receiver sites; as impacts would be temporary, no cumulative impacts would
result when considered in conjunction with other reasonably foreseeable projects. Cumulative impacts
would be less than significant.
5.2.4 Biological Resources
Implementation of the proposed action and other beach replenishment projects would be expected to cause
short-term cumulative impacts to nonsensitive species (mobile and nonmobile invertebrates) that inhabit the
intertidal and surf zone of the sandy beaches where replenishment activities would occur. However, upon
completion of replenishment activities, these nonsensitive species would repopulate the affected areas.
Strict engineering design of specific projects would ensure that beach replenishment is limited to areas that
would not have long-term impacts to sensitive habitats or species. No impacts to grunion would be
anticipated to occur, due to implementation of a monitoring programs that would halt replenishment
activities if grunion were observed spawning. In fact, creation of larger sandy beaches may benefit grunion
and other species such as shore birds. There is uncertainty in predicting long-term indirect impacts from
adding cumulative quantities of sand to this inherently dynamic ocean system. All the sand replenishment
5.0 Cumulative Projects and Impacts
Page 5-8 Regional Beach Sand Project EIR/EA99-69\SANDAG EIREA 5 to 10.wpd 7/17/00
projects listed in Table 5-1 represent a very small portion of the overall sand that used to enter these littoral
cells and the system will continue to lose sand to underwater canyons. No cumulative impacts are
predicted.
No other reasonably foreseeable projects would use the borrow sites proposed under the Regional Beach
Sand Project. Project-level impacts, as assessed in Section 4.4 of this document, would be less than
significant. Accordingly, no cumulatively significant impacts would occur at the borrow sites.
5.2.5 Cultural Resources
The proposed action is the only project that would have a potential effect to underwater archaeological sites
as none of the other projects involved offshore dredging at this depth. The project itself would have no
significant impacts, following implementation of measures to monitor for and avoid resources, and there
would be no cumulative impact.
5.2.6 Land and Water Use
As discussed in Section 4.6, beach replenishment activities would generally be compatible with existing land
and water uses. No inconsistencies with federal, state, or local land use plans have been identified and
most land use plans encourage beach replenishment. The reasonably foreseeable projects would start at
various times and would not create cumulatively significant impacts to land use. Given the various planned
start dates for the reasonably foreseeable projects, combined with the beneficial impacts to land use that
would occur with implementation of the proposed action, no significant cumulative land use impacts would
occur.
Recreational activities would be temporarily relocated to other local beaches and dive sites during dredging,
sand placement, and construction activities. It is unlikely that other replenishment activities or other
reasonably foreseeable projects in the same vicinity would occur concurrently, which would enable
surrounding beaches to accommodate additional recreational users. Because beach closure would only
occur on a short-term basis, and nearby recreational opportunities would be continued, no cumulative
recreation impacts would occur.
Beach replenishment activities are designed to increase and enhance recreational opportunities at beaches
for both residents and tourists. The implementation of this action would increase the width and quality of
5.0 Cumulative Projects and Impacts
Regional Beach Sand Project EIR/EA Page 5-999-69\SANDAG EIREA 5 to 10.wpd 7/17/00
the proposed receiver beaches, increasing the value of beach recreational activities for both the local and
regional tourist industry. Implementation of this project would therefore cumulatively benefit the
recreational value of San Diego regional beaches.
5.2.7 Aesthetics
Cumulative visual impacts are dependent on the scenic quality of the region and the type of proposed
project. The coastal region of San Diego County is considered to be highly scenic. Sand placement
activities and other reasonably foreseeable projects along the proposed receiver beach sites and adjacent
areas would result in short-term visual impacts that would cease at the end of construction activities. The
proposed action and other replenishment projects would be considered to have long-term beneficial visual
impacts, as beach replenishment would widen San Diego beaches currently affected by erosion and
improve coastal views. Therefore, implementation of these actions would have cumulatively beneficial
visual impacts along the coast.
5.2.8 Socioeconomics
Sand replenishment activities would occur in uninhabited areas reserved for recreational uses. There would
be no direct cumulative impacts to population or housing from this proposed action in conjunction with
other reasonably foreseeable projects. One element of the purpose and need of the project, and other
similar projects, is enhancement of this valuable resource which draws tourists and strengthens the
economy. Additionally, beach nourishment would protect residential structures. The proposed action and
others like it would result in beneficial impacts to the local and regional population and the economy.
Although temporary impacts to fishermen may occur due to restricted fishing areas during construction, no
cumulative impacts are expected to occur because this impact would be short-term. No cumulative impacts
are expected to occur to sensitive habitats (reefs), and therefore no cumulative impacts to the commercially
important species dependent upon those habitats are anticipated. Localized impacts may displace
fishermen from favored locations as the sand moves off the beaches and deposits on low relief hard
substrate and scattered reefs. As these areas are few, the aggregate size is small, other fishing areas will
remain available, and recent sand replenishment projects in the same area have not significantly impacted
North County commercial fisheries catch over the long-term, these impacts are not considered cumulatively
significant.
5.0 Cumulative Projects and Impacts
Page 5-10 Regional Beach Sand Project EIR/EA99-69\SANDAG EIREA 5 to 10.wpd 7/17/00
5.2.9 Public Health and Safety
Safety measures associated with the proposed action include onshore and offshore closure to public access,
safety buffer zones, onshore barricades, and safety personnel as necessary. Other beach nourishment
projects would institute the same type of buffer zones and barricades. These safety measures would only
be utilized on a short-term basis for the length of individual beach replenishment activities. Although
seasonal lifeguard towers may need to be temporarily relocated during replenishment activities, impacts
would not be significant. No cumulative impacts are expected to occur along the length of the pipeline since
the pipe would be buried or spanned by access ramps at critical public and lifeguard access points.
Navigational signage would be placed around a 500-foot buffer surrounding the borrow site, as well as
along floating or submerged sections of the sand transport pipe, to alert boats to remain outside of the
construction activities. Other proposed projects would not utilize a similar pipeline delivery system from
borrow sites. Therefore, no cumulative impacts to public health and safety are expected to occur.
5.2.10 Utilities and Structures
Regional demand for existing utility services such as water, sewer, gas and electric, solid waste, and
wastewater would not be incrementally increased by implementation of the proposed action. Short-term
cumulative interruption of services would be avoided by project-by-project monitoring efforts. It is not
anticipated that any long-term disruption impacts would occur. Therefore, no cumulative impacts to utilities
or structures are anticipated.
5.2.11 Traffic
As discussed in Section 4.11, there would not be long-term traffic impacts because only a minor increase
in vehicular activity to the receiver sites is anticipated and because construction would be temporary.
Cumulative impacts would not be significant when considering the other reasonably foreseeable projects,
since few projects would require the use of the same routes for construction vehicles at the same time of
the Regional Beach Sand Project’s construction activities.
5.2.12 Air Quality
The analysis of air pollutant emissions to determine conformance to ambient air quality standards is a
regional analysis that, by its nature, is cumulative. The state implementation plan (SIP) and 2010 emissions
5.0 Cumulative Projects and Impacts
Regional Beach Sand Project EIR/EA Page 5-1199-69\SANDAG EIREA 5 to 10.wpd 7/17/00
inventory consider foreseeable projects and cumulative growth. Section 4.12 demonstrates conformance
with the SIP. There would be no significant cumulative air quality impacts.
5.2.13 Noise
Construction activities associated with the proposed action would generate changes in noise levels in the
vicinity of the receiver beaches for the duration of the project. However, these noise changes would not
contribute to cumulative noise impacts due to the distance between the proposed receiver beaches. In
addition, beach replenishment activities would not likely occur concurrently with other projects similar in
nature. Increases in noise levels would only be short-term and noise levels would return to existing values
upon completion of beach replenishment activities. Therefore, no cumulative noise impacts would occur.
6.0 Other Considerations Required by CEQA/NEPA
Regional Beach Sand Project EIR/EA Page 6-199-69\SANDAG EIREA 5 to 10.wpd 7/17/00
CHAPTER 6.0OTHER CONSIDERATIONS REQUIRED BY CEQA/NEPA
This section addresses other topics required by CEQA and NEPA in an EIR/EA. These include: an
analysis of significant unavoidable adverse impacts to the environment (NEPA, 42 U.S.C. § 4321 et seq.;
and CEQA, Cal. Pub. Res. Code, § 21000 et seq., as amended); the relationship between local short-term
uses of the environment and long-term productivity (NEPA); the identification of any irreversible and
irretrievable commitments of resources (NEPA and CEQA); an analysis of growth-inducing impacts
(CEQA); a discussion of effects found not to be significant (CEQA); a discussion of Executive order 13045
(Environmental Health and Safety Risk to children, 62 Fed. Reg. 19885 (1997)); and a discussion of issues
related to Executive Order 12898 (Environmental Justice, 59 Fed. Reg. 7629 (1994)).
6.1 SIGNIFICANT UNAVOIDABLE ADVERSE EFFECTS
The EIR/EA evaluated the proposed alternatives with respect to numerous issues, including Geology and
Soils, Coastal Wetlands, Water Resources, Biological Resources, Cultural Resources, Land and Water
Use, Aesthetics, Socioeconomics, Public Health and Safety, Utilities, Traffic, Air Quality, and Noise and
Odor. All of the potential impacts associated with the proposed project will be mitigated to below levels
of significance and are not considered significant or unavoidable.
6.2 SHORT-TERM USES AND LONG-TERM PRODUCTIVITY
The objective of the proposed action is to replenish the San Diego region’s eroding beaches by dredging
material from offshore borrow sites and placing directly onshore. This action would widen existing beaches
in order to reduce erosion potential and thereby protect structures, as well as increase recreation
opportunities for long-term use. Disposal of beach-compatible dredged material on the receiver sites would
support SANDAG’s Shoreline Preservation Strategy; policies contained in the Oceanside, Carlsbad,
Encinitas, Solana Beach, Del Mar, Imperial Beach, and San Diego Coastal State Park System General
Plans; and the project objectives. Implementation of the proposed action would not result in any
environmental impacts that would significantly narrow the range of beneficial uses of the environment or
pose long-term risks to health, safety, or the general welfare of the public communities surrounding the
receiver sites. Rather, the project would provide for future beneficial beach resources (e.g., recreational
activities).
6.0 Other Considerations Required by CEQA/NEPA
Page 6-2 Regional Beach Sand Project EIR/EA99-69\SANDAG EIREA 5 to 10.wpd 7/17/00
6.3 IRREVERSIBLE/IRRETRIEVABLE COMMITMENTS OF RESOURCES
Resources which are irreversibly or irretrievably committed to a project are those that are typically used
on a long-term or permanent basis; however, some are considered short-term resources that cannot be
recovered and are thus considered irretrievable. These resources may include the use of non-renewable
resources such as fuel, wood, or other natural or cultural resources. Human labor is also considered a non-
retrievable resource because labor used for the proposed action would not be used for other purposes.
The unavoidable destruction of natural resources which limit the range of potential uses of that particular
environment would also be considered an irreversible or irretrievable commitment of resources.
The proposed beach replenishment activities in the cities of Oceanside, Carlsbad, Encinitas, Solana Beach,
Del Mar, San Diego, and Imperial Beach would result in the placement of approximately 2 million cubic
yards of dredged beach-compatible fill material. The project is necessary to protect the existing beaches,
which provide recreational opportunities not only for residents, but also contribute to the regional tourist
industry. The proposed action would result in the consumptive use of nonrenewable energy sources and
labor required to operate dredges, trucks, pumping equipment, and grading equipment. These
commitments of resources could have otherwise been applied to projects other than the proposed action.
However, the proposed action would not result in the use of a substantial amount of resources and would
be short-term in nature. Additionally, no natural resources would be permanently destroyed and beach
replenishment would be considered beneficial to the region.
6.4 GROWTH INDUCEMENT
Under CEQA, an EIR must discuss the ways in which the proposed action and alternatives could foster
economic or population growth or the construction of additional housing, either directly or indirectly, in the
area of population growth or the construction of additional housing, either directly or indirectly, in the area
surrounding the proposed action. Analysis of growth-inducing effects includes those characteristics of the
action that may encourage and facilitate activities that, either individually or cumulatively, would affect the
environment. Population increases, for example, may impose new burdens on existing community service
facilities. Similarly, improvement of access routes may encourage growth in previously undeveloped areas.
Growth may be considered beneficial, adverse, or of no significance environmentally, depending on its
actual impacts to the environmental resources present.
6.0 Other Considerations Required by CEQA/NEPA
Regional Beach Sand Project EIR/EA Page 6-399-69\SANDAG EIREA 5 to 10.wpd 7/17/00
The proposed action would result in temporary increase in a beach area and sand cover at each of the
receiver sites. A benefit of the project would be enhancement or continuation of the recreational usage of
each of the receiver sites. It must be emphasized, however, that such recreational benefits would be
temporary (a maximum lifespan of the project is approximately 5 years). For use in evaluating the growth
inducing impact of the proposed action, it is assumed that the level of beach use at each site would remain
near current levels or increase slightly. The resulting temporary recreational benefits derived from the
additional beach area would not be expected to increase the demand for public services and utilities, nor
create a need for additional recreational facilities above current projections.
6.5 EFFECTS FOUND NOT TO BE SIGNIFICANT
CEQA Guidelines Section 15128 requires that the environmental document include a brief discussion of
various environmental issues that were determined not to be significant. The Initial Study prepared for
project (contained in Appendix B) evaluated several issues found not to be significant, and were therefore
not analyzed in this EIR/EA. These issues were hazards and hazardous materials, mineral resources, public
services, agricultural resources, and population and housing.
The remainder of the issue areas found in the Initial Study was evaluated in detail in this document in
Chapter 4.0. Environmental effects have been identified as either significant or not significant. Impacts
identified as significant were determined to exceed some or all threshold values expressed in this document
as “Significance Criteria.” Effects found not to be significant did not exceed thresholds stated as
“Significance Criteria.”
This analysis determined that the proposed San Diego Regional Beach Sand Project would not have a
significant effect on any of the evaluated issue areas. Although no long-term significant impacts are
expected, a monitoring plan would be implemented during construction and for five years following
completion, to verify no significant impacts. If monitoring identifies significant impacts, mitigation would be
provided with the commitments in Section 2.5.
In other instances, consequences of the replenishment were found to be beneficial, such as the positive
effect of enhanced local recreational opportunities for both residents and tourists.

6.0 Other Considerations Required by CEQA/NEPA
Page 6-4 Regional Beach Sand Project EIR/EA99-69\SANDAG EIREA 5 to 10.wpd 7/17/00
6.6 PROTECTION OF CHILDREN FROM ENVIRONMENTAL HEALTH RISKS AND
SAFETY RISKS
On April 21, 1997 President Clinton signed Executive Order 13045, Protection of Children From
Environmental Health Risks and Safety Risks (62 Fed. Reg. 19885 (1997)). The policy of the Executive
Order states that:
A growing body of scientific knowledge demonstrates that children may sufferdisproportionately from environmental health risks and safety risks. These risks arisebecause: children’s neurological, immunological, digestive, and other bodily systems arestill developing; children eat more food, drink more fluids, and breathe more air inproportion to their body weights than adults; children’s size and weight may diminish theirprotection from standard safety features; and children’s behavior patterns may make themmore susceptible to accidents because they are less able to protect themselves. Therefore,to the extent permitted by law and appropriate, and consistent with the agency’s mission,each Federal agency:
(a) shall make it a high priority to identify and assess environmental health risks andsafety risks that may disproportionately affect children; and
(b) ensure that its policies, programs, activities, and standards address disproportionaterisks to children that result from environmental health risks or safety risks.
There would be no disproportionate impacts to children during implementation of the proposed sand
replenishment project. No significant impacts would occur and there is no indication that any impacts
would disproportionately accrue to children. Areas of replenishment would be restricted during project
implementation for safety reasons and no long-term effects would occur after the beach areas were
reopened for public use. Air quality impacts would be experienced on a regional basis rather than a
localized basis and no disproportionate impacts to children are anticipated. Short-term noise impacts
during construction are likely to extend into neighborhoods off-site (as discussed in Section 4.14), but there
is no evidence that children are likely to be subject to disproportionate impacts through learning disruption.
In summary, no disproportionate impacts to environmental health risks and/or safety risks to children are
likely to occur with project implementation.
6.0 Other Considerations Required by CEQA/NEPA
Regional Beach Sand Project EIR/EA Page 6-599-69\SANDAG EIREA 5 to 10.wpd 7/17/00
6.7 ENVIRONMENTAL JUSTICE
This section summarizes potential impacts from sand replenishment with respect to issues of environmental
justice, as mandated by Executive Order 12898. The “Executive Order on Federal Actions to Address
Environmental Justice in Minority Populations and Low-Income Populations,” issued on February 11,
1994, requires that the relative impacts of federal actions on minority populations and low-income
populations be addressed to avoid the placement of a disproportionate share of adverse impacts of these
actions on these groups. On April 21, 1995, the Secretary of Defense submitted a formal environmental
justice strategy and implementation plan to the USEPA.
In order to comply with the executive order, this EIR/EA process included gathering demographic and
income information from SANDAG and the 1990 census to identify areas of low-income and/or high
minority populations in the areas contiguous with the receiver sites that would potentially be exposed to
impacts. These receiver sites were then assessed for disproportionate impacts to low-income and minority
populations.
As discussed in Section 3.8, none of the areas adjacent to the project site(s) have minority populations
greater proportion than the San Diego Region as a whole. There are a few project census tracts which
have percent of minority populations higher than their jurisdictional city average, but the difference is not
substantial and the overall minority percentage remains lower than the County as a whole. Thus, in
comparison to the adjacent cities and the county, the census tracts contiguous with the sand replenishment
project area cannot be considered a high minority population area.
All but one project specific census tract (CT 102 in Imperial Beach) has a median income greater than the
County median ($35,028). However, even within the Imperial Beach tract, the median income is
substantially higher than that of the city ($30,029), indicating that this tract does not contain a
disproportionate number of low-income individuals.
The proposed sand replenishment project would not have a disproportionate impact on minority
populations or low-income populations because the areas encompassed by the replenishment sites do not
include disproportionately high minority populations or low-income populations compared to the contiguous
cities or the county.
6.0 Other Considerations Required by CEQA/NEPA
Page 6-6 Regional Beach Sand Project EIR/EA99-69\SANDAG EIREA 5 to 10.wpd 7/17/00
6.8 ESSENTIAL FISH HABITAT ASSESSMENT
This section provides an assessment of potential impacts to Essential Fish Habitat (EFH). The Magnuson-
Stevens Fishery Conservation and Management Act, as amended by the Sustainable Fisheries Act of 1996
(Public Law 104-267), sets forth a number of new mandates for the National Marine Fisheries Service
(NMFS), eight regional fishery management councils (Councils), and other federal agencies to identify and
protect important marine fish habitat. The Councils, with assistance from NMFS, are required to delineate
EFH for all managed species. Federal agencies which fund, permit or carry out activities that may
adversely impact EFH are required to consult with the NMFS and respond in writing to the Fisheries’
Services recommendations.
The Navy performed an EFH assessment of the Regional Beach Sand Replenishment Project. The
proposed action would involve dredging at six potential borrow sites and use of that material to replenish
beaches. The borrow sites would be located outside the littoral cells at water depths generally 40 to 80
feet (Table 2-3). The borrow sites would be located in an area designated as EFH in the Coastal Pelagics
Fisheries Management Plan (FMP) and the Pacific Groundfish FMP.
The Coastal Pelagics FMP includes four finfish (Pacific sardine, chub mackeral, northern anchovy, and jack
mackeral) as well as market squid. Coastal pelagic finfish are wide ranging species that generally inhabit
the upper portion of the water column and not found near the bottom. The Pacific Groundfish FMP
includes 83 species, generally having more restricted ranges with many of these species being found on or
near the bottom. Many of the Pacific groundfish are rockfish (Sebastes sp) typically found in association
with hard substrate habitats. Generally, the EFH for both plans is defined as the ocean area from the coastal
lagoons up to 200 miles offshore (Hoffman 2000).
The EFH source documents prepared by the Pacific Fishery Management Council (1998a and 1998b)
identify that dredging is a direct impact to benthic habitats but also has indirect effects to adjacent habitats
due to removal of prey, turbidity, etc. Conservation measures are recommended in the source documents.
Pertinent measures for type of dredging proposed include provision of the latitude and longitude coordinates
of the dredge site for Geographic Information System (GIS) tracking, sediment testing for contaminants,
avoidance of kelp beds and subaquatic vegetation in the placement of pipelines and accessory equipment,
and control measures to minimize turbidity.

6.0 Other Considerations Required by CEQA/NEPA
Regional Beach Sand Project EIR/EA Page 6-799-69\SANDAG EIREA 5 to 10.wpd 7/17/00
As addressed in Section 4.4, proposed dredging in the six borrow sites would result in impacts to
approximately 398 acres of surface area, representing less than two percent of the available shelf habitat.
All four of the Coastal Pelagic finfish species can be found in the borrow site areas as these nearshore
waters are productive and these species move through these areas while foraging. In contrast, only a
portion of the 83 species comprising the Pacific Groundfish FMP would be found in the borrow site habitat.
The following lists provides a summary of the FMP species and where they might be expected relative to
the borrow sites
Species that are commonly found in habitats typified by the borrow sites:
• California Skate
• Jack Mackerel
• California Scorpionfish
• Curlfin Sole
• English Sole
• Pacific Sanddab
• Petrale Sole
Species that may occasionally occur in habitats represented by the borrow sites, but generally are more
often associated with hard bottom habitats:
• Lingcod
• Cabezon
• Kelp Greenling
• Black-and-Yellow Rockfish
• Blue Rockfish
• Brown Rockfish
• Calico Rockfish
• Copper Rockfish
• Gopher Rockfish
• Grass Rockfish
• Kelp Rockfish
• Olive Rockfish
• Rosy Rockfish
• Squarespot Rockfish
• Starry Rockfish
• Treefish
• Vermilion Rockfish
• Window Rockfish
Species that may occasionally occur in habitats represented by the borrow sites, but generally found inshore
of these sites:
• Leopard Shark
• Spiny Dogfish
6.0 Other Considerations Required by CEQA/NEPA
Page 6-8 Regional Beach Sand Project EIR/EA99-69\SANDAG EIREA 5 to 10.wpd 7/17/00
Species that many occasionally occur in habitats represented by the borrow sites, but generally found
offshore of these sites:
• Soupfin Shark
• Big Skate
• Longnose Skate
• Ratfish
• Greenspotted Rockfish
Species not found in the San Diego area or deep water species include:
• Finescale Codling
• Pacfic Rattail
• Pacific Cod
• Pacific Whiting
• Sablefish
• Aurora Rockfish
• Bank Rockfish
• Black Rockfish
• Blackgill Rockfish
• Bocaccio
• Bronzespotted Rockfish
• Canary Rockfish
• Chilipepper
• China Rockfish
• Cowcod
• Darkblotched Rockfish
• Dusky Rockfish
• Flag Rockfish
• Greenstriped Rockfish
• Greenblotched Rockfish
• Harlequin Rockfish
• Longspine Thornyhead
• Mexican Rockfish
• Pacific Ocean Perch
• Pink Rockfish
• Quillback Rockfish
• Redbanded Rockfish
• Redstripe Rockfish
• Rosethorn Rockfish
• Rougheye Rockfish
• Sharpchin Rockfish
• Shortbelly Rockfish
• Shortraker Rockfish
• Shortspine Thornyhead
• Silvergray Rockfish
• Speckled Rockfish
• Splitnose Rockfish
• Stripetail Rockfish
• Tiger Rockfish
• Yelloweye Rockfish
• Yellowmouth Rockfish
• Yellowtail Rockfish
• Arrowtooth Flounder
• Butter Sole
• Dover Sole
• Flathead Sole
• Rex Sole
• Rock Sole
• Sand Sole
• Starry Flounder

6.0 Other Considerations Required by CEQA/NEPA
Regional Beach Sand Project EIR/EA Page 6-999-69\SANDAG EIREA 5 to 10.wpd 7/17/00
During dredging activities, fish would move from the area of active dredge, but these species would not be
lost to the ecosystem nor would migration patterns be affected. Fish that feed on benthic biota would
experience short-term loss of prey, but because the active area of dredge would be relatively small, the
affect would not be significant. A minimum 500-foot buffer has been established between the dredge area
and any kelp or reef (300 feet at SO-7 from the artificial reefs). Under average current conditions, turbidity
plumes from hopper dredge operations are anticipated to average approximately 260 feet, but range from
72 to 544 feet (Table 4.3-1). Any turbidity plumes that would extend to the reefs or kelp would be very
limited and within the range that these resources naturally experience from storms, rip currents, etc. All
dredging operations would be performed in conformance with the permit conditions established by the 401
permit issued by the Regional Water Quality Control Board. The proposed action would not result in long-
term or significant effects to sustainable fisheries present in the Coastal Pelagics or Pacific Groundfish
FMPs.
7.0 Consultation and Coordination
Regional Beach Sand Project EIR/EA Page 7-199-69\sect-07.wpd 7/19/00
CHAPTER 7.0CONSULTATION AND COORDINATION
7.1 AGENCY COORDINATION VIA SHORELINE EROSION COMMITTEE (SEC)
Close coordination has occurred between SANDAG, the Navy, local jurisdictions and regulatory agencies
since the inception of this project. SANDAG identified the need for beach sand replenishment in 1993 and
prepared its San Diego Regional Shoreline Preservation Strategy. Since that time the SEC has worked
to find sand sources and design beach nourishment projects to improve property protection, increase
recreational capacity and enhance tourism potential. The SEC is comprised of representatives from the
following agencies:
• City of Carlsbad
• City of Encinitas
• City of Del Mar
• City of Solana Beach
• City of Coronado
• City of San Diego
• City of Imperial Beach
• City of Oceanside
• County of San Diego
• San Diego Unified Port District
• U.S. Navy
Technical Advisors
• State Department of Fish & Game
• National Marine Fisheries Service
• U.S. Environmental Protection Agency
• State Department of Parks and Recreation
• California Coastal Commission
• State Lands Commission
• State Department of Boating & Waterways
7.0 Consultation and Coordination
Page 7-2 Regional Beach Sand Project EIR/EA99-69\sect-07.wpd 7/19/00
• U.S. Army Corps of Engineers
Community Advisors
• California Coastal Coalition (CalCoast)
• Economic Development Corporation
• Sportsfishing Association of California San Diego Chapter
• Surfrider Foundation
• California Lobster and Trap Fishermen’s Association
• Greater San Diego Chamber of Commerce
• San Diego Council of Divers, Inc.
• San Diego North County Convention and Visitors Bureau
• Sierra Club
The alternatives analyzed in this document are the result of an iterative process to present information to
the resource agencies, obtain their input, incorporate modifications into project design, and present the
revised plan. Seven interactive meetings were held between March 1999 and February 2000 to facilitate
this process as discussed below. The resource agencies listed below were participants in the process and
are also part of the larger SEC.
• U.S. Army Corps of Engineers
• U.S. Fish and Wildlife Service
• U.S. Department of the Navy
• National Marine Fisheries Service
• California Coastal Commission
• California Department of Fish and Game
• California Department of Parks and Recreation
• California Regional Water Quality Control Board (Region 9)
• California State Lands Commission
The first interactive working meeting occurred on March 25, 1999. At that meeting, anticipated project
schedule and project approach as well as the data sources available were presented. Resource agency
staff requested additional information on the borrow sites and some receiver sites, as well as a comparison
7.0 Consultation and Coordination
Regional Beach Sand Project EIR/EA Page 7-399-69\sect-07.wpd 7/19/00
between the Navy’s previously permitted project and the proposed action. Field surveys of the receiver
sites and bounce dives in the borrow sites were completed in May, June, and July 1999.
A meeting was held on May 6, 1999 to present results of monitoring data that had been made available
subsequent to the March meeting, describe in more detail the engineering modeling approach, and present
the comparison table (Regional Beach Sand Project and the Homeporting Project). The resource agencies
offered additional information regarding design constraints, e.g., artificial reefs.
On June 28, 1999 results of modeling were presented to the agencies. Based on the known resources, the
agencies directed modification of the project at the North Carlsbad, Leucadia, Solana Beach, and Torrey
Pines receiver sites. Those changes were made and the model re-run.
An overview of the impact methodology and preliminary impact conclusions were presented on August
6, 1999. The impact conclusions were provided for the modified action incorporating design changes
recommended in the June meeting. Consensus was reached on some issue areas and in some instances
further clarification was required. Based on that feedback, additional engineering was performed.
Discussion occurred regarding the appropriate criteria for use in determining locations of possible impacts
due to sediment transport.
The impact analysis continued based on modeling output. On November 29, 1999 another resource
agency meeting was held to present the results of the analysis to date, based on the three alternatives which
had been derived at that time. The framework for future monitoring was discussed primarily in terms of
the existing permit issued to the Navy.
In January 2000 the SEC authorized mapping of locations where the model predicted sand deposition, but
where no data was available to determine whether or not sensitive resources may be affected. A meeting
was held on January 14, 2000 to present the mapping methodology and gain consensus prior to
undertaking the mapping later in January. At that time, sensitivity of various reef types was discussed.
Consistent with the Navy analysis, potential areas of long-term effect would be related to sand deposition
at high value habitat, e.g., high relief reefs, vegetated low relief reefs or at kelp beds. A meeting to present
the preliminary results of the mapping effort was held on February 17, 2000.
Subsequent to the release of the Draft EIR/EA for public review, SANDAG met with agency staff to R
address responses to comment letters received. On May 10, 2000, SANDAG met with staff from CDFG R

7.0 Consultation and Coordination
Page 7-4 Regional Beach Sand Project EIR/EA99-69\sect-07.wpd 7/19/00
to discuss borrow sites and artificial reefs. On May 15, 2000, SANDAG staff met with USACOE, R
USFWS, CDFG, NMFS and the Navy to address lagoon monitoring, surfgrass significance criteria, R
project schedule, nesting season for federally listed bird species, and the Section 7 consultation process. R
Because of the aggressive project time line, local jurisdictions and state agencies have also been involved
in coordinating the permitting effort. A meeting was held on July 8, 1999 with representatives of the
California State Lands Commission, California Coastal Commission, the Port of San Diego, and all seven
local jurisdictions to clarify the permit needs of each agency and coordinate the process within the structure
of each entity. A subsequent meeting was held with the California Coastal Commission on December 28,
1999 regarding the permitting time line. The permits required to implement this action are identified in
Section 2.7.
7.2 PUBLIC COORDINATION
Extensive public coordination has occurred, and will continue to occur, as part of this proposed action.
Public involvement opportunities to date include the ongoing SEC meetings which are open to the public,
the EIR notification process via the Notice of Preparation (NOP), and other presentations to various
community groups and interested parties. When the EIR/EA is considered for certification by the
SANDAG Board there will be a public hearing on the document. Individual jurisdictions will likely have
public meetings and utilize the certified EIR/EA for local discretionary actions such as issuing coastal
permits or noise variances.
7.2.1 SEC Meetings
The SEC meets monthly generally on the first Thursday of every month. (The meeting is not scheduled in
August.) Meetings are open to the general public. Members of the print media are typically present and
subsequent to the meeting articles may appear in the Coast News, North County Times, San Diego
Union-Tribune, or other community papers.
7.2.2 Notice of Preparation to Prepare the Draft EIR
In conformance with CEQA, an NOP to prepare a Draft EIR was distributed by SANDAG to numerous
federal, state and local agencies involved with funding or approving the action, and to other interested
organizations and members of the public. A copy of the NOP, the NOP distribution list and copies of all

7.0 Consultation and Coordination
Regional Beach Sand Project EIR/EA Page 7-599-69\sect-07.wpd 7/19/00
letters received in response to the NOP are provided in Appendix B. Section 1.4 of this document
provides a summary of the comments received in response to the NOP.
7.2.3 Other Meetings With Interested Parties
In September and October 1999, SANDAG staff made public presentations regarding the Regional Beach
Sand Project at the cities of Oceanside, Carlsbad, Solana Beach, Encinitas, Del Mar, San Diego,
Coronado and Imperial Beach. All meetings were held at the local city hall. The City of San Diego
sponsored a second meeting at the Belmont Park Community Room, near the Mission Beach receiver site.
Throughout October and November 1999, SANDAG staff made presentations to staff members for
various state and federally elected officials, environmental groups such as the Sierra Club, Audubon
Society, Surfrider Foundation, and interested parties such as recreational divers and commercial fisherman.
The commercial fisherman interest group has participated in three meetings with SANDAG staff and
consultants from August to December 1999 to provide input on the biological analysis as well as the
process itself. Many of these same groups attend the monthly SEC meetings and participate in that forum
as well.
8.0 List of Preparers and Contributors
Regional Beach Sand Project EIR/EA Page 8-199-69\SANDAG EIREA 5 to 10.wpd 7/17/00
CHAPTER 8.0LIST OF PREPARERS AND CONTRIBUTORS
Personnel responsible for preparation of this EIR/EA include the following:
San Diego Association of Governments (SANDAG)
401 B Street, Suite 800
San Diego, CA 92101
Rob Rundle, Project ManagerSteve Sachs, Senior Planner
Greg Smith, Intern
United States Department of the Navy (DON)
Southwest Division Naval Facilities Engineering Command
1220 Pacific Highway
San Diego, CA 92132
Dan Muslin, Senior Environmental Planner
Mitch Perdue, Biologist
The prime contractor responsible for preparation of this EIR/EA is:
KEA Environmental, Inc. (KEA)
1420 Kettner Boulevard, Suite 620
San Diego, California 92101
The subcontractors responsible for preparation of this EIR/EA are:
Moffatt & Nichol Engineers
250 W. Wardlow Road
P.O. Box 7707
Long Beach, CA 90807

8.0 List of Preparers and Contributors
Page 8-2 Regional Beach Sand Project EIR/EA99-69\SANDAG EIREA 5 to 10.wpd 7/17/00
MEC Analytical
2433 Impala Drive
Carlsbad, CA 92008
GeoArch
P.O. Box 86068
San Diego, CA 92138
The following professional staff are the principal contributors from KEA and subcontractors:
Name and Expertise Applied to EIR/EA Professional Discipline and Expertise
Tom LarkinEnvironmental Analysis; 25 years of experience
Principal-in-Charge
Julie McCall (KEA) Environmental Analysis; 14 years of experience
Project Manager
Teri Fenner, MA (KEA) Environmental Analysis; 14 years of experience
Assistant Project Manager
Agency Coordination
Shawn Shamlou, MA (KEA) Environmental Analysis; 5 years of experience
CEQA and NEPA Analysis
Chris Webb, MA (Moffatt & Nichol) Project Engineer, 10 years of experience
Coastal Engineering and Permitting
Alan Alcorn, PE (Moffatt & Nichol) Engineering, 20 years of experience
Quality Control, Permitting
Seamus Innes (Moffatt & Nichol) Coastal modeling, 4 years of experience
Coastal Modeling
8.0 List of Preparers and Contributors
Regional Beach Sand Project EIR/EA Page 8-399-69\SANDAG EIREA 5 to 10.wpd 7/17/00
Susan Ming, PE (Moffatt & Nichol) Numerical modeling, 8 years of experience
Coastal Engineering
Karen Green (MEC) Marine Biology, 20 years of experience
Marine Resources, Permitting
Douglas Deiner, Ph.D. (MEC) Marine Biology, 24 years of experience
Marine Resources
Jim Kurtz (KEA) Environmental Engineering; 30 years of experience
Traffic, Air Quality, Noise
Mike Downs, Ph.D. (KEA) Anthropology; 18 years of experience
Socioeconomics
Rebecca Apple, M.A. (KEA) Anthropology; 17 years of experience
Cultural Resources
Roy Pettus (GeoArch) Marine Archaeology; 20 years of experience
Underwater Archaeological Resources
John Hildebrand, Ph.D. (GeoArch) Marine Geophysicist, 20 years of experience
Underwater Archaeological Resources
Angela Johnson (KEA) Graphics Coordinator; 7 years of experience
Graphic Design and GIS
Dan Brady (KEA) Graphic Designer; 5 years of experience
Graphics
Eric Coughlin (KEA) GIS Specialist; 3 years of experience
GIS

8.0 List of Preparers and Contributors
Page 8-4 Regional Beach Sand Project EIR/EA99-69\SANDAG EIREA 5 to 10.wpd 7/17/00
Debbie Surrell (KEA) Word Processor; 10 years of experience
Word Processing
Marisa Fabrigas (KEA) Word Processor; 16 years of experience
Word Processing
9.0 References and Persons Contacted
Regional Beach Sand Project EIR/EA Page 9-199-69\sect-09.wpd 7/19/00
CHAPTER 9.0REFERENCES AND PERSONS CONTACTED
9.1 REFERENCES
Allen, M.J., S.L. Moore, K.C. Schiff, S.B. Weisberg, D.R. Diener, J.K. Stull, A. Groce, J. Mubarak, C.L.
Tang, and R. Gartman
1998 Demersal Fishes and Megabenthic Invertebrates. SCCWRP.
Bedford, Dennis
1999 CDFG Marine Region, personal communication with Shawn Shamlou, KEA
Environmental. July 28.
Bergen, M., S.B. Weisberg, D. Cadien, A. Dalkey, D. Montagne, R.W. Smith, J.K. Stull, and R.G.
Velarde
1998 Assessment of Benthic Infauna on the Mainland Shelf of Southern California.
SCCWRP.
California Air Resources Board (CARB)
2000 Internet Site <<www.arb.ca.gov>>, provides data relative to federal and state air quality
standards, monitored data, and forecast regional emissions.
California Coastal Commission
1995 Coastal Development Permit from SDG&E for dredging at Agua Hedionda Lagoon.
August 30.
California Department of Fish and Game
1993 Final Supplemental Environmental Document Ocean Sport Fishing Regulations,
Spiny Lobster. State of California, the Resources Agency.
California Department of Parks and Recreation
1984 San Diego Coastal State Park System General Plan. Volume 3: South Carlsbad State
Beach. July.

9.0 References and Persons Contacted
Page 9-2 Regional Beach Sand Project EIR/EA99-69\sect-09.wpd 7/19/00
1997 Travel Release Information
1999 Home page. May 20, State Beach visitation data. <<http://www.cal-parks.ca.gov.>>
California Division of Mines and Geology R
n.d. Special Report 153 R
City of Carlsbad
1994 General Plan. Adopted September 6.
1996 Local Coastal Program. Certified by the California Coastal Commission on Octobe
r 9.
City of Del Mar
1976 Community Plan. March.
1993 Local Coastal Program Land Use Plan. Certified by the California Coastal Commission
March 18.
n.d. Municipal Code Chapter 9.20, Noise Regulations.
City of Encinitas
1989 General Plan. March 29.
City of Imperial Beach
1990 Municipal Code Section 9.32.020H, Prohibited Noises.
1994 General Plan and Coastal Plan. October.
City of Oceanside
1989 Land Use Element. Originally adopted July 7, 1986.
1992 Grading Ordinance, Section 515.

9.0 References and Persons Contacted
Regional Beach Sand Project EIR/EA Page 9-399-69\sect-09.wpd 7/19/00
1999a Final Environmental Impact Report for the Proposed Oceanside Harbor Precise
Plan Amendment. February 5.
1999b Buena Vista Lagoon Weir Replacement Project Negative Declaration. April.
City of San Diego
1969 The Ocean Edge of San Diego.
1974 Mission Beach Precise Plan and Local Coastal Program Addendum. April.
1984 Municipal Code Section 59.5.0404, Construction Noise. January 3.
1998 Mission Beach Boardwalk Widening Project Final Environmental Impact Report.
May.
City of Solana Beach
1992 Municipal Code, Section 7.34, Noise Abatement and Control, Adopted as Ordinance
No. 147. February 18.
1988 Solana Beach General Plan Noise Element. November 14.
Coastal Environments
1998 Bibliography of pertinent research on existing conditions and monitoring studies in the
vicinity of Aqua Hedionda Lagoon. Prepared for the California Coastal Commission,
SDG&E, and the City of Carlsbad.
County of San Diego
1980 San Diego County General Plan Noise Element. December 17.
County of San Diego, Air Pollution Control District
1998 Rules and Regulations. December.
1999 1994-1998 Summary of San Diego Air Basin Monitored Pollutant Data. August.
9.0 References and Persons Contacted
Page 9-4 Regional Beach Sand Project EIR/EA99-69\sect-09.wpd 7/19/00
Department of the Navy
1995 Final Environmental Impact Statement for the Development of Facilities in San
Diego/Coronado to Support the Homeporting on One NIMITZ Class Aircraft
Carrier. Southwest Division Naval Facilities Engineering Command. November.
1997a Environmental Assessment for Beach Replenishment at South Oceanside and
Cardiff/Solana Beach, California. Southwest Division Naval Facilities Engineering
Command. April.
1997b Environmental Assessment for Beach Replenishment at North Carlsbad, South
Carlsbad, Encinitas, and Torrey Pines. Southwest Division Naval Facilities Engineering
Command. May.
1997c Coastal Monitoring Plan P-706 and San Diego Bay Channel Dredge Project, Naval
Air Station North Island San Diego. Prepared by Southwest Division Naval Facilities
Engineering Command. August.
1999 Final Environmental Impact Statement for Developing Home Port Facilities for
Three NIMITZ-Class Aircraft Carriers in Support of the U.S. Pacific Fleet. July.
Frederic R. Harris, Inc. (FRH)
1997 Beach Sand Transport and Sedimentation Report, Phase I and II. Prepared for
Southwest Division Naval Facilities Engineering Command.
Glantz, Dale
1999 KELCO, personal communication with Mary Ann Irwin, MEC. June.
Guth, John
1999 Annotated maps identifying surfgrass, scattered rocks, and reefs, South Oceanside to
Torrey Pines. Annotations by John Guth, President, California Lobster and Trap
Fishermen's Association. August 20.
9.0 References and Persons Contacted
Regional Beach Sand Project EIR/EA Page 9-599-69\sect-09.wpd 7/19/00
Hales, L.Z.
1978 Coastal Processes Study of the Oceanside, California Littoral Cell, Final Report.
U.S. Army Corps of Engineers, Waterways Experiment Station, Misc. Paper H-78-8,
Vicksburg, MS.
1979 Mission Bay, California, Littoral Compartment Study, Final Report. U.S. Army Corps
of Engineers, Waterways Experiment Station, Misc. Paper H-78-8, Vicksburg, MS.
Hays, Loren
2000 Biologist, United States Fish and Wildlife Service, personal communication with Paul
Amberg, KEA Environmental. February 3.
Hoffman, Bob
2000 Biologist, National Marine Fisheries Services, personal communication with Teri Fenner,
KEA Environmental. February 1.
Inman, D.L. and S.A. Jenkins
1983 Oceanographic Report for Oceanside Beach Facilities. Prepared for the City of
Oceanside, CA.
King, Philip, Ph.D.
1999 The Fiscal Impact of Beaches in California. Prepared for the California Department
of Boating and Waterways. September.
Marine Advisors
1961 A Statistical Survey of Ocean Wave Characteristics in Southern California Waters.
Prepared for the U.S. Army Corps of Engineers, Los Angeles District.
MEC Analytical Systems, Inc. R
1997 Least Tern and Water Turbidity Monitoring Seal Beach Pier to Warner Avenue. R
Prepared for U.S. Army Corps of Engineers. November. R

9.0 References and Persons Contacted
Page 9-6 Regional Beach Sand Project EIR/EA99-69\sect-09.wpd 7/19/00
Mitchell, Darryl
1999 Planner for City of Solana Beach, personal communication with Shawn Shamlou, KEA
Environmental.
Moffatt & Nichol Engineers
1999 Memo regarding economic analysis of sand retention structures from Chris Webb to Steve
Sachs, SANDAG. February 25.
2000a Shoreline Morphology Study, San Diego Regional Beach Sand Project. Prepared for
KEA Environmental. January 14.
2000b Memo regarding North Carlsbad Empirical Data from Chris Webb, Moffatt & Nichol, to
Steve Sachs, SANDAG. March 2.
2000c Memo regarding overfill factor, from Chris Webb, Moffatt & Nichol, to Steve Sachs,
SANDAG. March 2.
2000d Personal communication between Chris Webb, Moffatt & Nichol, and Teri Fenner, KEA
Environmental, Inc. March 3.
National Marine Fisheries Service (NMFS)
1991 Results of Southern California Sportfish Economic Survey. August.
2000 Letter from Rodney McInnis, Acting Regional Administrator to J.C. Ruzicska, U.S. Navy
Environmental Program Manager, Re: NMFS Finding that U.S. Navy Southwest Division
Existing Environmental Review Procedures For Federal Projects Meet EFH Consultation
Requirements. April.
Pacific Fishery Management Council
1998a Essential Fish Habitat West Coast Groundfish, modified from the Final EIS for
Amendment 11 to the Pacific Groundfish Fishery Management Plan. October.
9.0 References and Persons Contacted
Regional Beach Sand Project EIR/EA Page 9-799-69\sect-09.wpd 7/19/00
1998b Essential Fish Habitat Coastal Pelagic Species, modified from the Coastal Pelagics
Species Fishery Management Plan, Amendment 8 to the Northern Anchovy Fishery
Management Plan. December.
Pettus, Roy E.
1995 Marine Cultural Resources Data Assessment for the Conceptual Design of the
Proposed South Bay Ocean Outfall, San Diego, California. Engineering-Science, Inc.,
San Diego, CA.
Pryde, Philip
1992 San Diego: An Introduction to the Region. Kendall/Hunt Publishing Company.
San Diego Association of Governments (SANDAG)
1993 Shoreline Preservation Strategy for the San Diego Region and Appendix 1. July.
1998 Regional Beach Monitoring Program, Fall Survey. Prepared by Coastal Frontiers
Corporation, Chatsworth, CA.
1999 Facsimile from Greg Smith, SANDAG, to KEA Environmental. August 6.
2000 Public Materials from Shoreline Erosion Committee Meeting. January 6.
San Diego Unified Port District
1998 San Diego Bay Market Fishing Fleet. Prepared by SDUPD Land Use Planning
Department, 27 pp. October.
SCCWRP
1992 SCCWRP Reference Study. Southern California Coastal Water Research Project Annual
Report, 1990-1991, 1991-1992.
Schiff, K. and R. Gossett
1998 The 1994 Southern California Bight Pilot Project: Sediment Chemistry. SCCWRP.
9.0 References and Persons Contacted
Page 9-8 Regional Beach Sand Project EIR/EA99-69\sect-09.wpd 7/19/00
Sea Surveyor, Inc.
1999 Final San Diego Regional Beach Sand Project Offshore Sand Investigations.
Prepared for San Diego Association of Governments. April.
Semple, Bob
1999 Solana Beach City Manager, personal communication with Shawn Shamlou, KEA
Environmental.
Sherman, Douglas J., Burton Jones, Eugene Farrell, Jinkang Wang, and Zhihong Zheng
1998 The Fate of Fine Sediments in a Suspension Plume: Ponto Beach, California. A
Report of Findings prepared for the California Department of Boating and Waterways.
Department of Geography, University of Southern California.
South Coast Air Quality Management District (SCAQMD)
1993 CEQA Air Quality Handbook. April. Revised November.
State Water Resources Control Board (SWRCB)
1997 California Ocean Plan. Water Quality Control Plan, Ocean Waters of California. July 23.
U.S. Army Corps of Engineers (USACOE)
1984 Shore Protection Manual, Volumes I and II. Coastal Engineering Research Center.
1991 Coast of California Storm and Tidal Waves Study (CCSTWS). Final State of the
Coast Report, San Diego Region.
1993 Final Report, Beach Nourishment Sources Along the Carlsbad/Oceanside Coast, San
Diego County, California. November
U.S. Environmental Protection Agency
n.d. Compilation of Air Pollution Emission Factors, AP-42. Now available at
http://wwww.epa.gov/ttnchie1/
9.0 References and Persons Contacted
Regional Beach Sand Project EIR/EA Page 9-999-69\sect-09.wpd 7/19/00
Wells, Mike
1999 Department of Parks and Recreation Resource Ecologist, personal communication with
Shawn Shamlou, Environmental Analyst, KEA Environmental. July 30.
2000 Department of Parks and Recreation Resource Ecologist, personal communication with
James Kurtz, Environmental Engineer, KEA Environmental. January 11.
9.2 PERSONS CONTACTED
California Coastal CommissionSherilyn Sarb, District Manager
Gary Cannon, Coastal Planner
Leslie Ewing, Planner
California Department of Fish and GameDennis Bedford, Fisheries Manager
California Department of Parks and RecreationDenny Stoufer, Lifeguards
Mike Wells, Resource Ecologist
Ed Navarro, Superintendent of Parks
California Lobster & Trap Fishermen’s AssociationJohn Guth
August Felando
California State Lands CommissionJane Smith, Public Land Management Specialist
Kirk Walker
City of CarlsbadStave Jantz, Engineer
Eric Munoz, Planner
9.0 References and Persons Contacted
Page 9-10 Regional Beach Sand Project EIR/EA99-69\sect-09.wpd 7/19/00
City of Del MarMonica Tuchscher, Planner
City of EncinitasKathy Stone, Planner
Phil Cotton, Community Services
Garrett Williams, Engineering Department
Tom Buckner
City of Imperial BeachMelanie Kush, Planner
City of OceansideRay Duncan, Lifeguard Manager
Jerry Hittleman, Planner
City of San DiegoAllison Rapp, PlannerLarry Kuzminski, Engineer
Terri Williams, Parks and Recreation Department
Linda Lechusa, Parks and Recreation Department
Frank Hofner, Noise Administrator
City of Solana BeachBob Semple, City Manager
Steve Apple, Planning Director
Darryl Mitchell, Planner
Lobster FishermenBruce Campbell
Tom Ptak
Rocky Corden
Robert Phillips
David Couch

9.0 References and Persons Contacted
Regional Beach Sand Project EIR/EA Page 9-1199-69\sect-09.wpd 7/19/00
Martin Kastlemger
Andres Saraspe
Port of San DiegoLarry Erye, Engineering Department
Bill Chopyk, Manager of Planning Services
San Elijo Lagoon FoundationDoug Gibson, Executive Director
Sea Urchin Harvesters’ Association, CaliforniaPeter Halmay
Sport Diver/FishermanLee Olsen
Urchin Producers Marketing AssociationMitch Hobron
U.S. Army Corps of EngineersRuss Kaiser, Senior Project Manager
10.0 EIR/EA Distribution List
Regional Beach Sand Project EIR/EA Page 10-199-69\SANDAG EIREA 5 to 10.wpd 7/17/00
CHAPTER 10.0EIR/EA DISTRIBUTION LIST
A copy of the Draft EIR/Review EA has been provided to the following:
Federal Agencies
National Marine Fisheries Service
U.S. Army Corps of Engineers, LA District, Regulatory Branch
U.S. Environmental Protection Agency, Region 9
U.S. Fish and Wildlife Service
State Agencies
California Air Resources Board
California Coastal Commission
California Department of Boating and Waterways
California Department of Fish and Game
California Department of Parks and Recreation
California State Coastal Conservancy
California State Lands Commission
State of California, Clearinghouse
Regional Agencies/Special Purpose Agencies
Air Pollution Control District
Regional Water Quality Control Board
Local Jurisdictions
City of Carlsbad
City of Coronado
City of Del Mar
10.0 EIR/EA Distribution List
Page 10-2 Regional Beach Sand Project EIR/EA99-69\SANDAG EIREA 5 to 10.wpd 7/17/00
City of Encinitas
City of Imperial Beach
City of Oceanside
City of San Diego
City of Solana Beach
County of San Diego
County of Orange
San Diego Unified Port District
Libraries
Carlsbad City Library
City of San Diego Public Library, Central/Government Documents
Coronado Public Library
County of San Diego, Library Coordinator
County of San Diego Library, Headquarters
County of San Diego, Serra Cooperative Library System
Del Mar Library
Encinitas Library
Imperial Beach Library
La Jolla Branch Public Library
Oceanside Public Library
Pacific Beach Branch Public Library
Solana Beach Library
University of San Diego Copley Library
Other Interested Parties
Audubon Society
Agua Hedionda Lagoon Foundation
NRG Cabrillo Power
California Lobster and Trap Fisherman Association
California Shore and Beach Preservation Association
Environmental Health Coalition

10.0 EIR/EA Distribution List
Regional Beach Sand Project EIR/EA Page 10-399-69\SANDAG EIREA 5 to 10.wpd 7/17/00
Mr. Gilbert Nares
San Diego Gas and Electric/Enova
San Diego Union-Tribune
San Dieguito Regional Open Space Park
Scripps Institute of Oceanography
Sea Urchin Harvesters’ Association
Sierra Club
Surfrider Foundation
University of San Diego, Legal Clinic
Urchin Producers Marketing Association
Mr. Tim Vasquez