regional and urban economics - frederic robert-nicoud …€¦ · · 2012-06-21regional and urban...
TRANSCRIPT
Frédéric Robert-Nicoud
Stylised facts about cities& some policy implications
Regional and Urban EconomicsUniversity of Geneva, 2012
2
2006—A major Landmark
• Over half of the world population is urbanised– World urban population growths by 100 million
annually
3
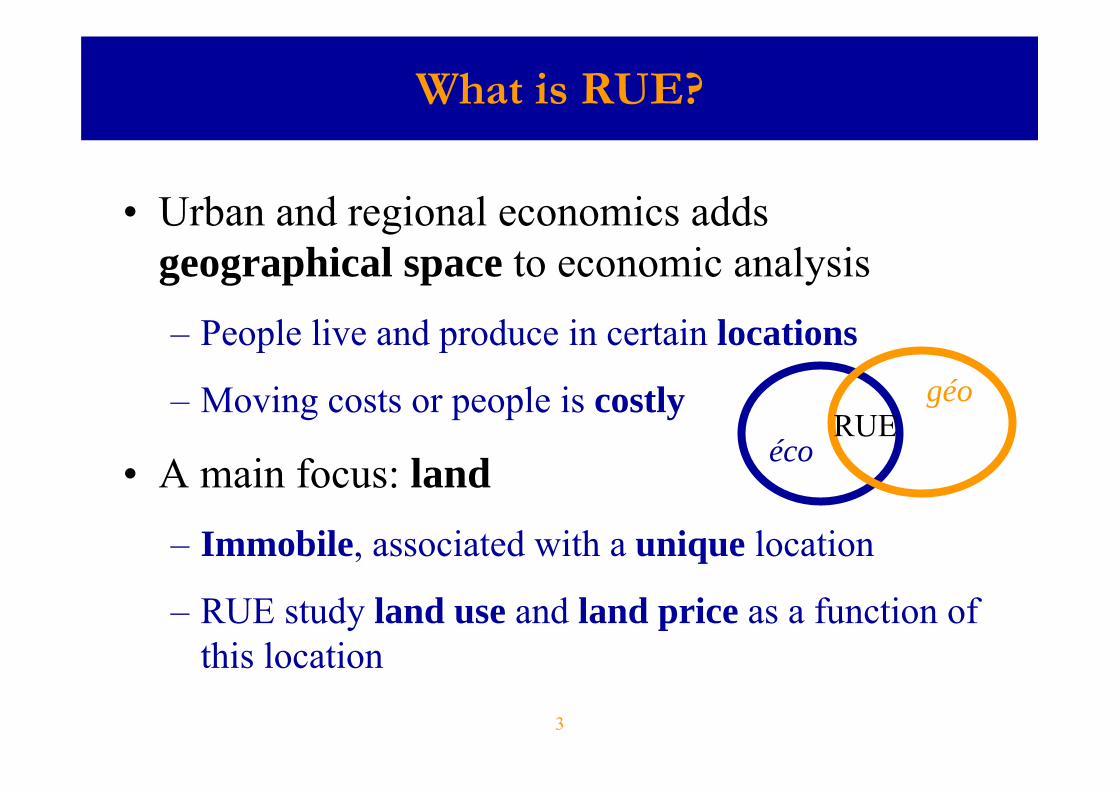
What is RUE?
• Urban and regional economics adds geographical space to economic analysis– People live and produce in certain locations
– Moving costs or people is costly
• A main focus: land– Immobile, associated with a unique location
– RUE study land use and land price as a function of this location
RUEgéo
éco
4
Contents
• Introduction– Core-Periphery patterns
– What is a city?
• Stylised facts 1-3– Broad regularities
• Stylised facts 4-6– Distribution of city sizes
• Stylised facts 7-12– Cities, Industries and Functions

5
Core-Periphery patterns

6
(Core-Periphery patterns)
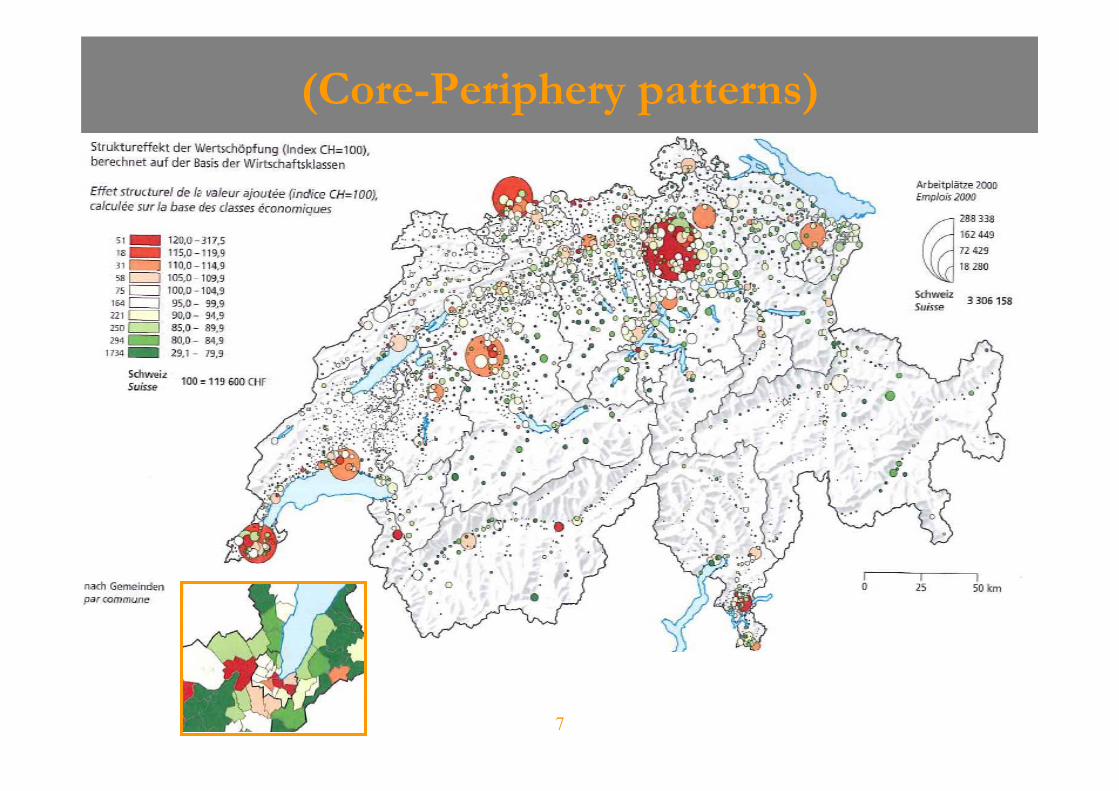
7
(Core-Periphery patterns)
8
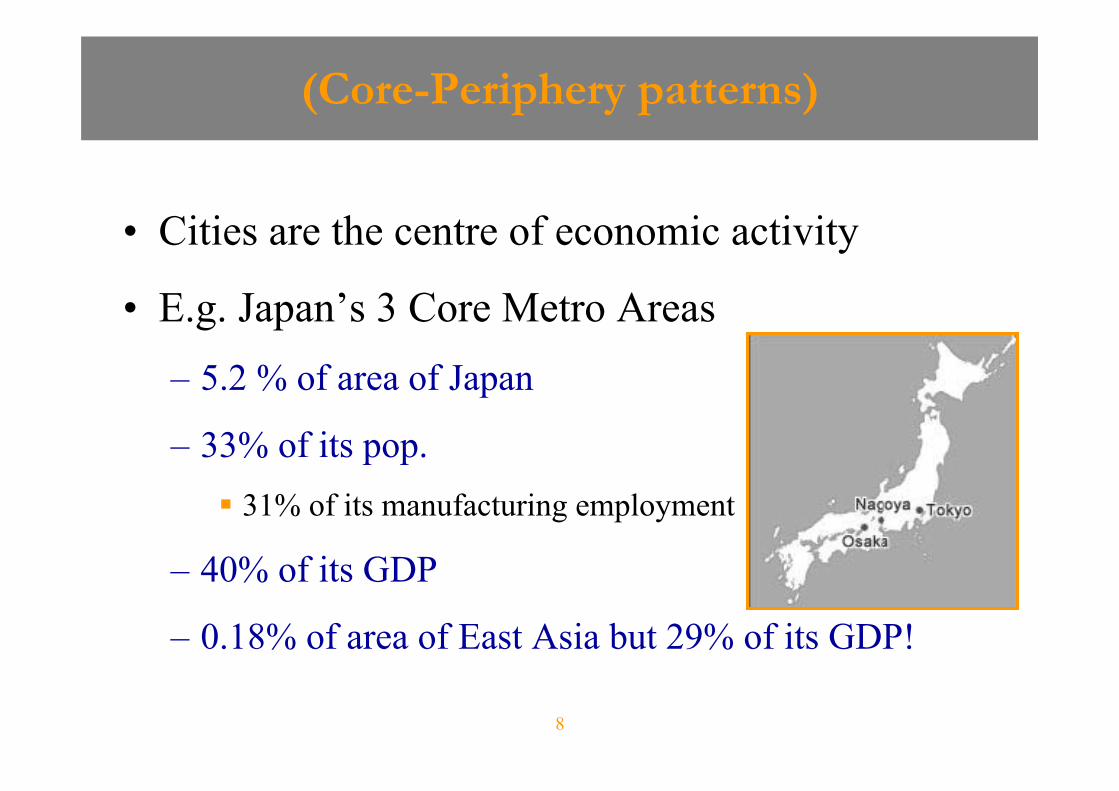
(Core-Periphery patterns)
• Cities are the centre of economic activity
• E.g. Japan’s 3 Core Metro Areas– 5.2 % of area of Japan
– 33% of its pop. 31% of its manufacturing employment
– 40% of its GDP
– 0.18% of area of East Asia but 29% of its GDP!
9
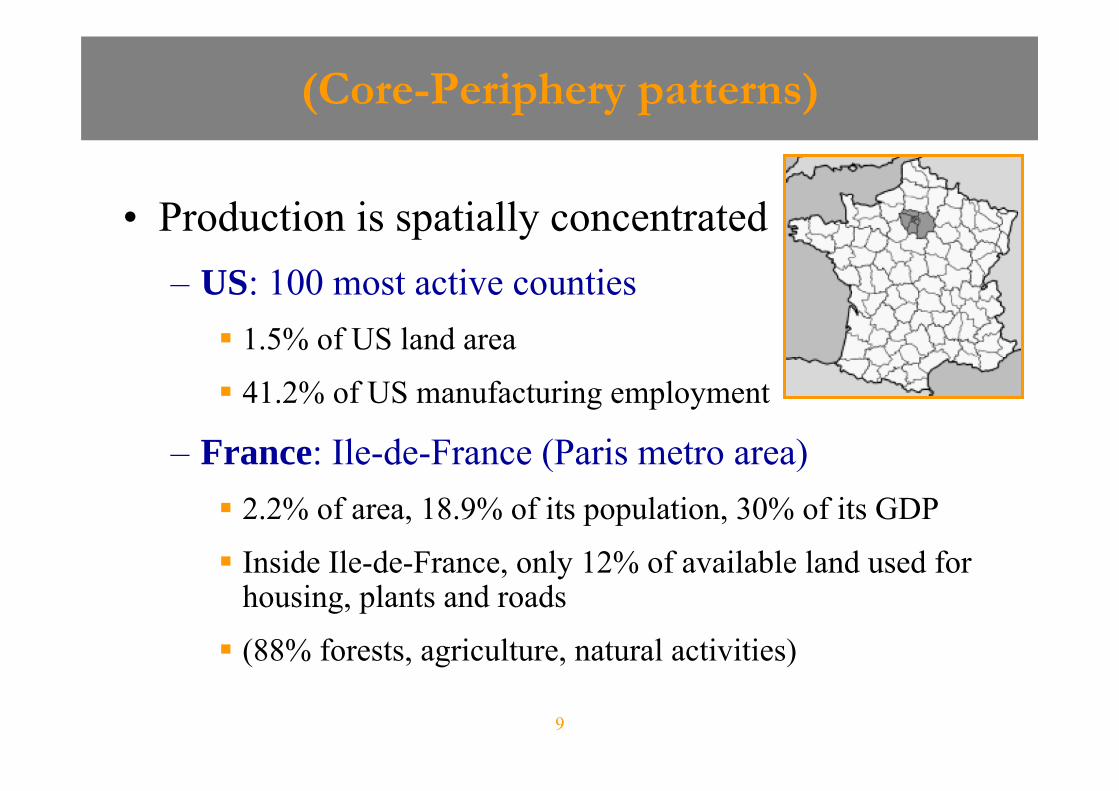
• Production is spatially concentrated– US: 100 most active counties 1.5% of US land area
41.2% of US manufacturing employment
– France: Ile-de-France (Paris metro area) 2.2% of area, 18.9% of its population, 30% of its GDP
Inside Ile-de-France, only 12% of available land used for housing, plants and roads
(88% forests, agriculture, natural activities)
(Core-Periphery patterns)
10
(Core-Periphery patterns)
11
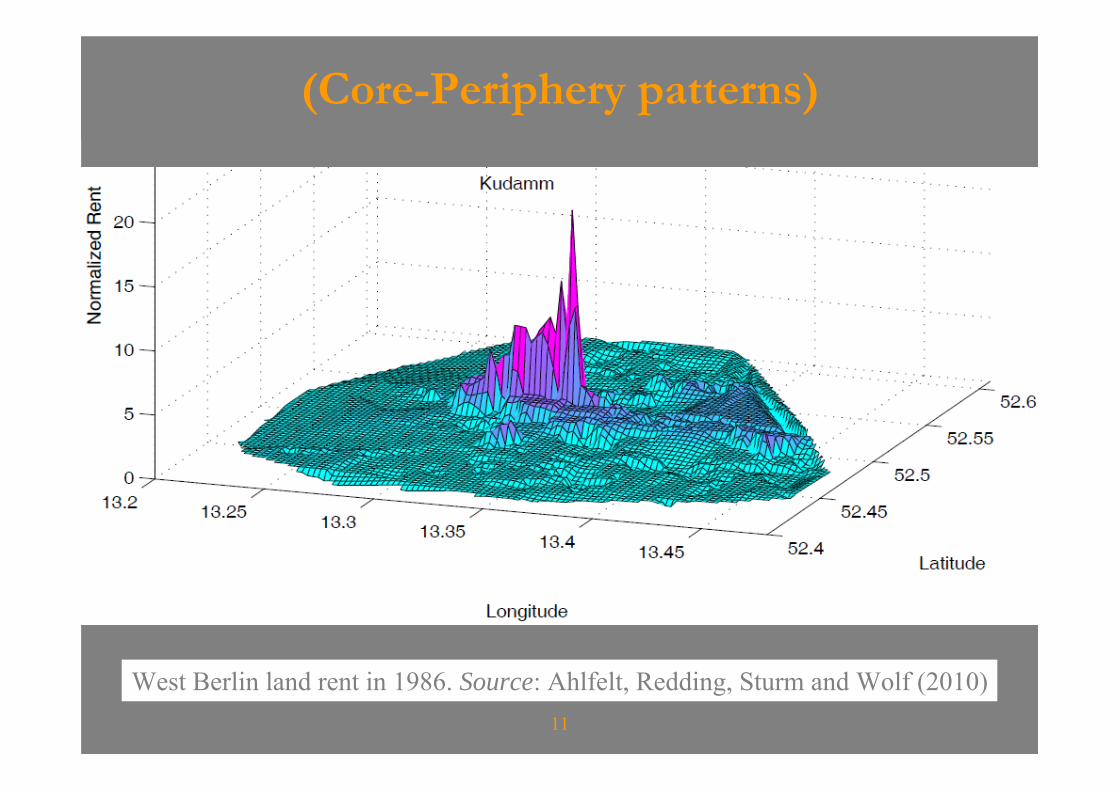
(Core-Periphery patterns)
West Berlin land rent in 1986. Source: Ahlfelt, Redding, Sturm and Wolf (2010)
12
Contents
• Introduction– Core-Periphery patterns
– What is a city?
• Stylised facts 1-3– Broad regularities
• Stylised facts 4-6– Distribution of city sizes
• Stylised facts 7-12– Cities, Industries and Functions

Stylised fact 1
• Urbanised areas are growing over timeUrban pop. by region, %
0
10
20
30
40
50
60
70
80
90
100
1950
1965
1980
1995
2010
2025
worldafricaasiaEuropeN. America
Source: UN World Urbanisation Prospects, 2005 revision
Click below to see the urbanisation rate of your
favourite country: http://www.nationmaster.com/red/graph/peo_urb-
people-urbanization&b_printabl
e=1
14
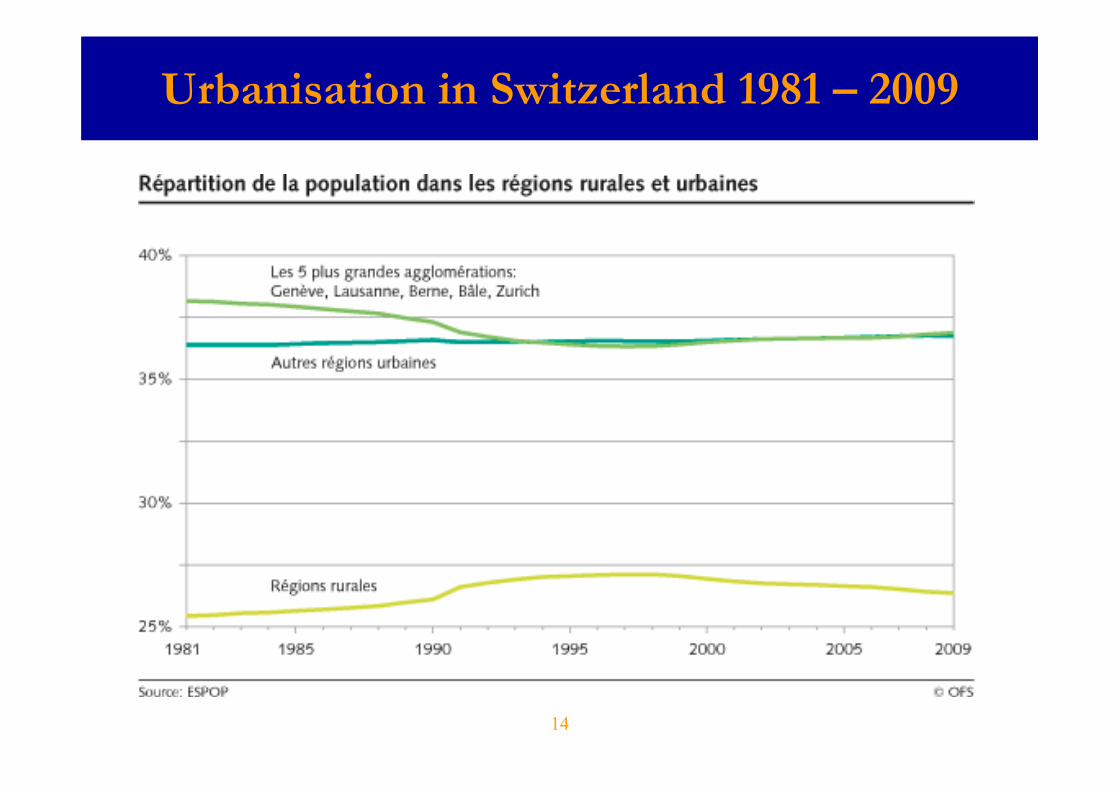
Urbanisation in Switzerland 1981 – 2009
15
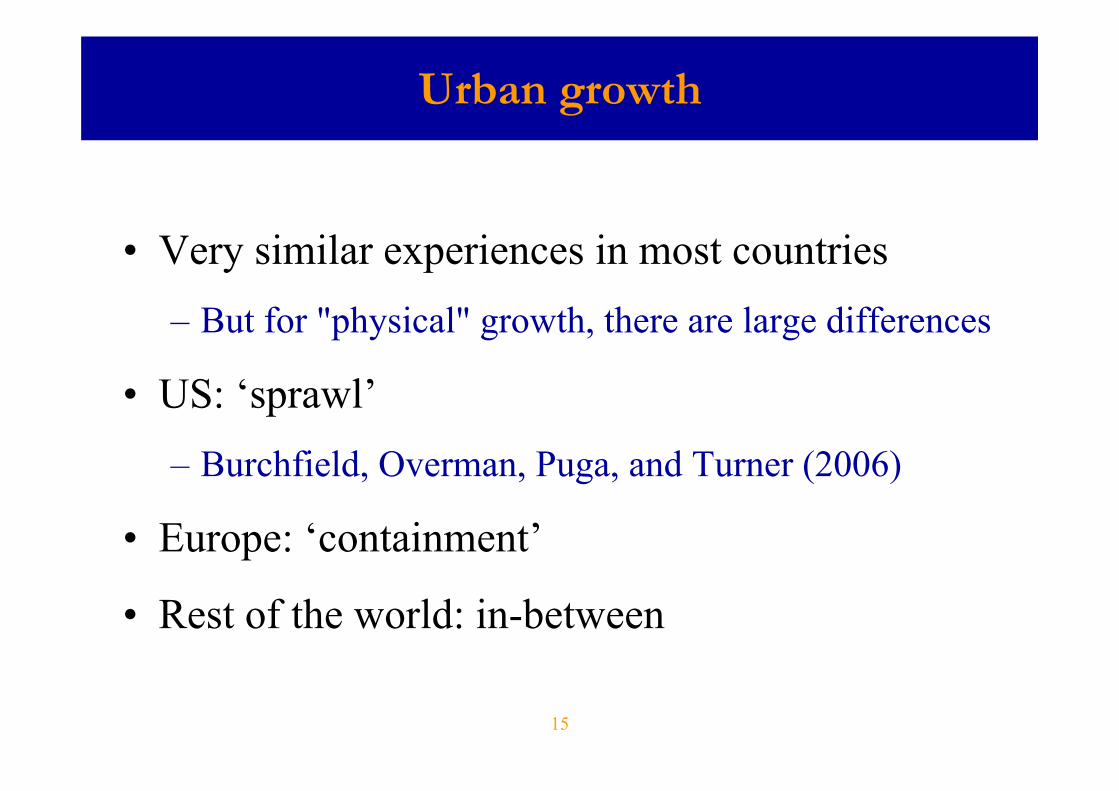
Urban growth
• Very similar experiences in most countries– But for "physical" growth, there are large differences
• US: ‘sprawl’– Burchfield, Overman, Puga, and Turner (2006)
• Europe: ‘containment’
• Rest of the world: in-between
16
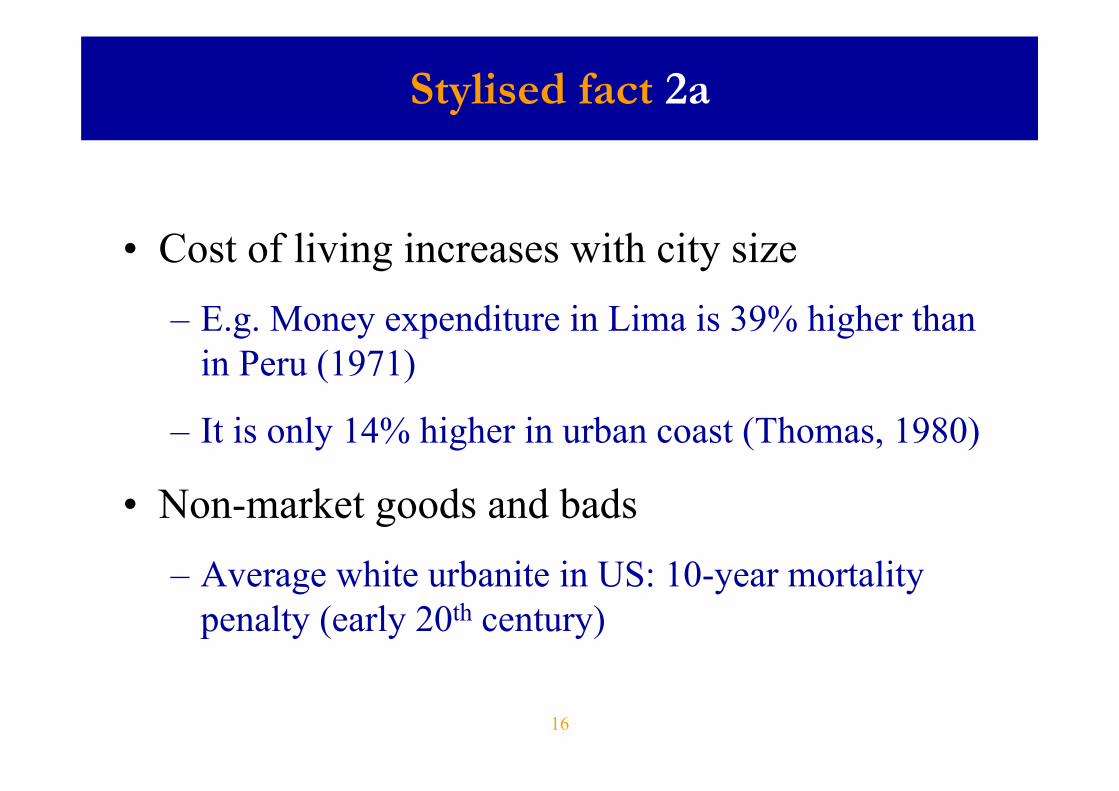
Stylised fact 2a
• Cost of living increases with city size– E.g. Money expenditure in Lima is 39% higher than
in Peru (1971)
– It is only 14% higher in urban coast (Thomas, 1980)
• Non-market goods and bads– Average white urbanite in US: 10-year mortality
penalty (early 20th century)

17
Cost of living & agglomeration size
Congestion
18
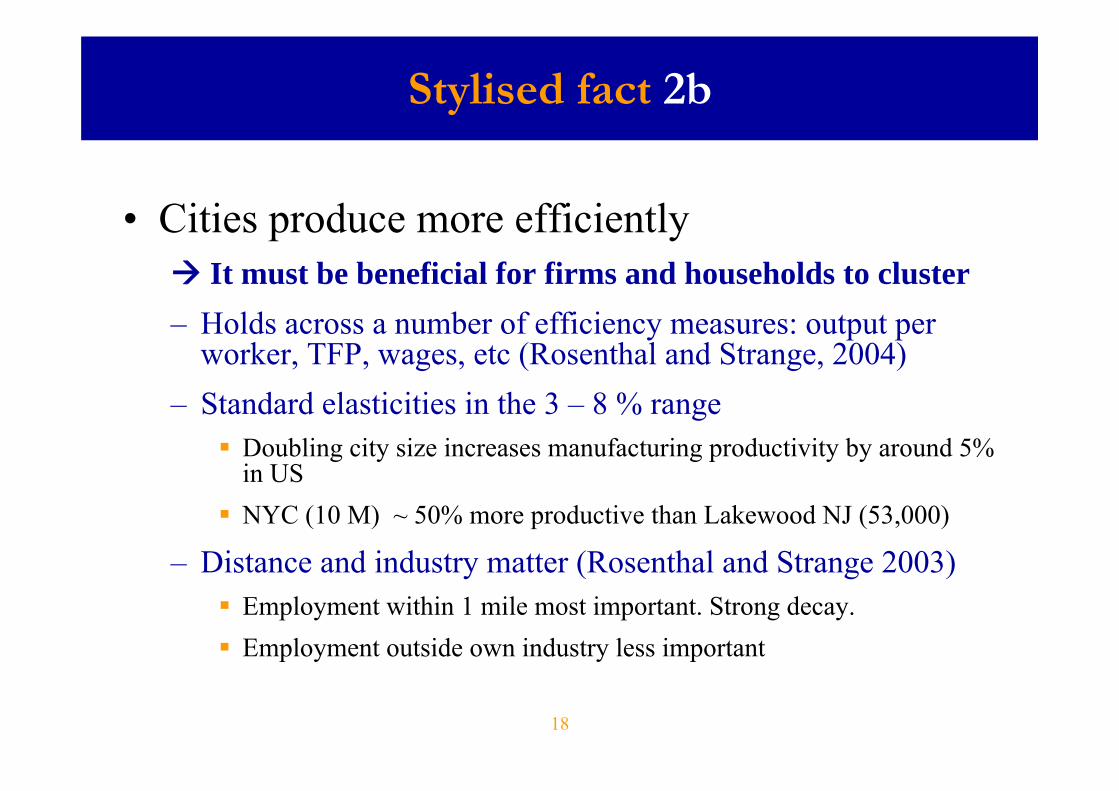
Stylised fact 2b
• Cities produce more efficiently It must be beneficial for firms and households to cluster– Holds across a number of efficiency measures: output per
worker, TFP, wages, etc (Rosenthal and Strange, 2004)– Standard elasticities in the 3 – 8 % range
Doubling city size increases manufacturing productivity by around 5% in US
NYC (10 M) ~ 50% more productive than Lakewood NJ (53,000)
– Distance and industry matter (Rosenthal and Strange 2003) Employment within 1 mile most important. Strong decay. Employment outside own industry less important

19
Cities produce more efficiently
20
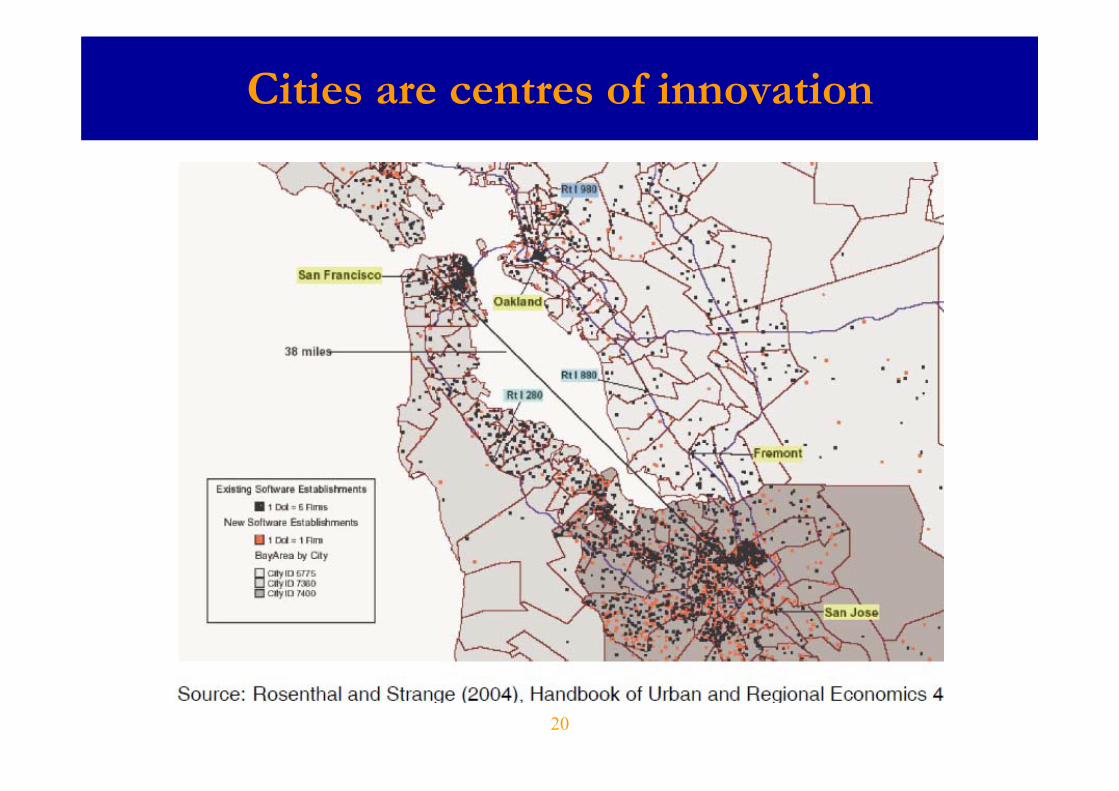
Cities are centres of innovation

21
Productivity & agglomeration size
MatchingLearningSharing

22
Second best optimum and Equilibrium
Constrained optimum Equilibrium city size

23
(Second best optimum and Equilibrium)
• City’s stock of roads and buses causes larger population and employment (U.S.)– Elasticities = 20% (roads) and 8% (buses) Duranton and Turner (2010)
– But increased provision of roads and public transit does not relieve congestion Duranton and Turner (2011)
24
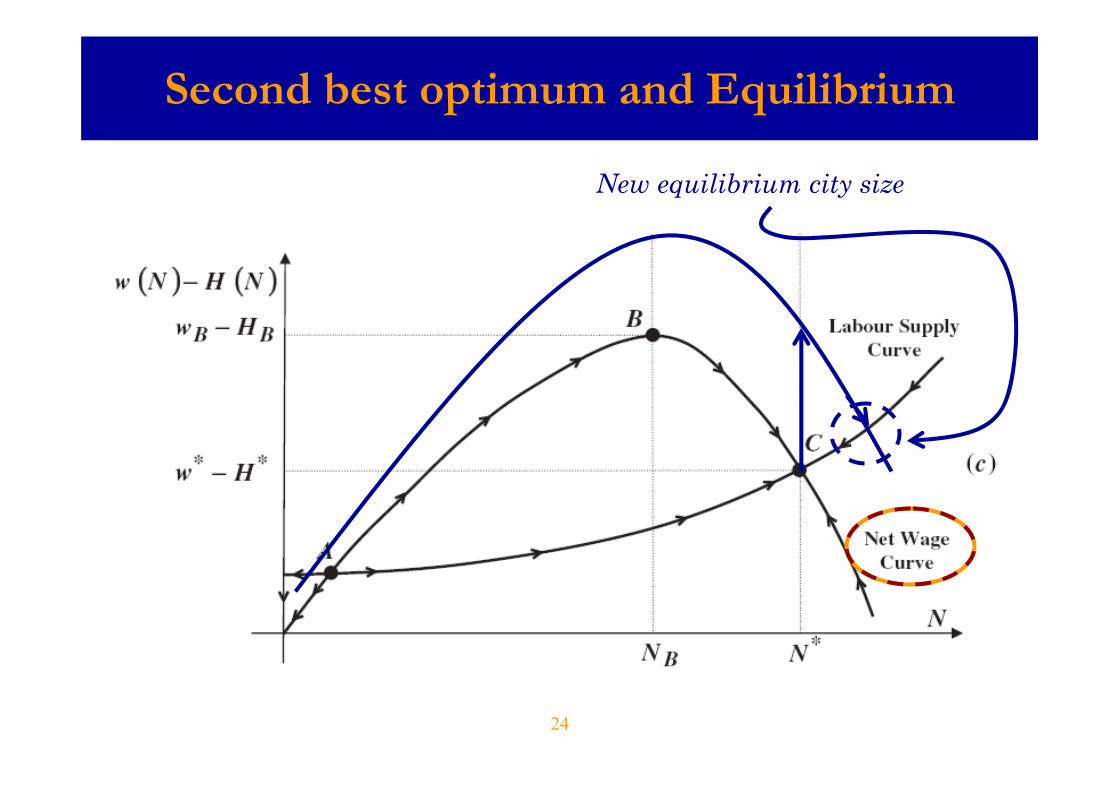
Second best optimum and Equilibrium
New equilibrium city size
25
(Second best optimum and Equilibrium)
• Migration restrictions (China)– Chinese cities are undersized Au and Henderson (2006a,b)
26
Stylised fact 2c
• Income inequalities are correlated with city size– Human capital composition
– Industrial structure
– Returns to skills (Behrens and Robert-Nicoud 2008)
27
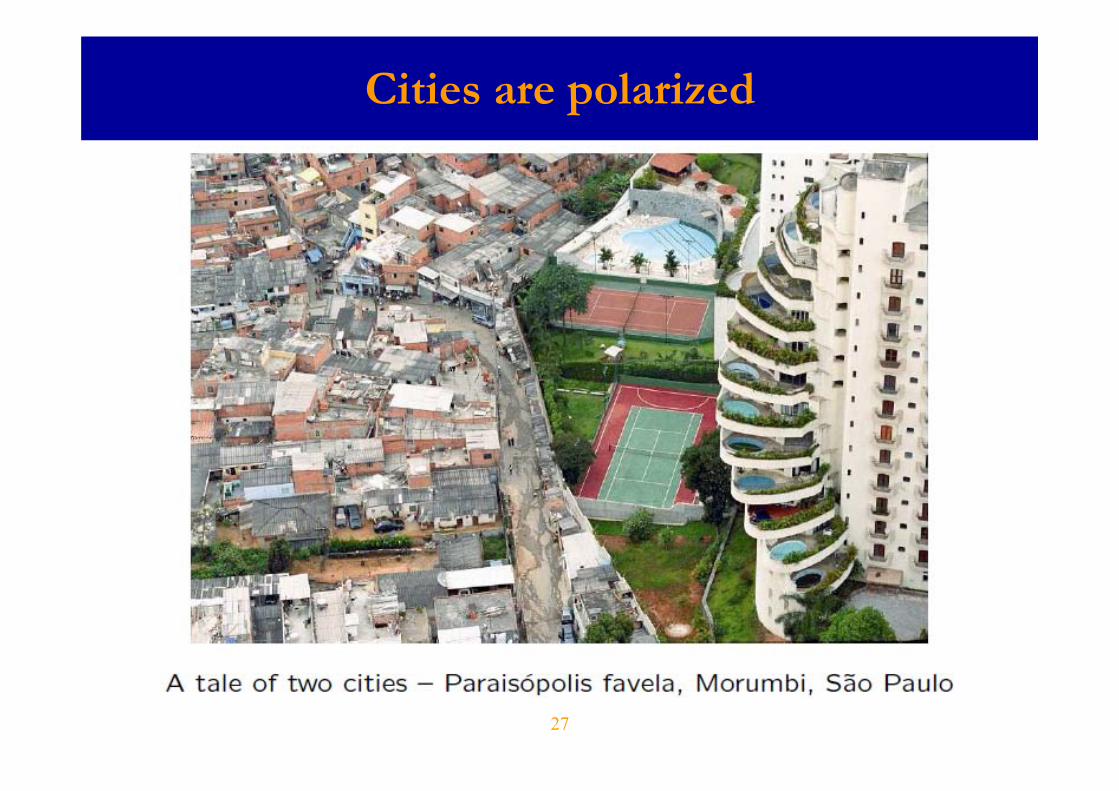
Cities are polarized

28
Cities are polarized
29
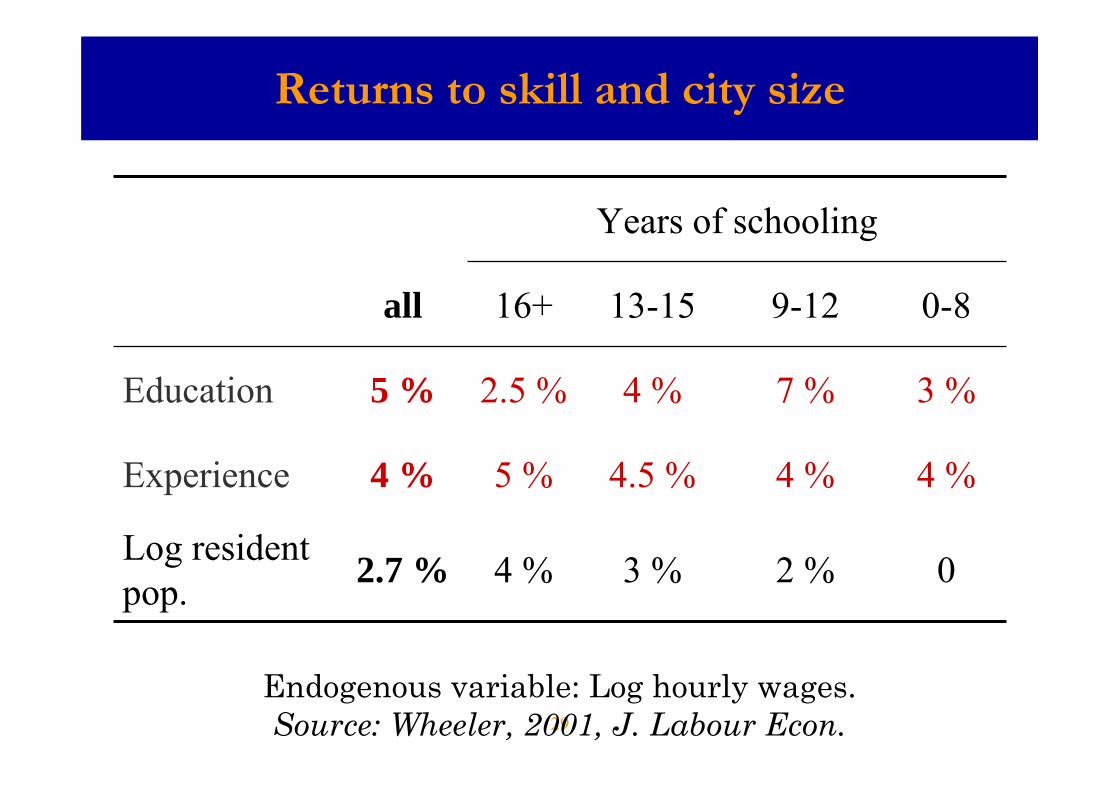
Returns to skill and city size
02 %3 %4 %2.7 %Log resident pop.
4 %4 %4.5 %5 %4 %Experience
3 %7 %4 %2.5 %5 %Education
0-89-1213-1516+all
Years of schooling
Endogenous variable: Log hourly wages.Source: Wheeler, 2001, J. Labour Econ.
30
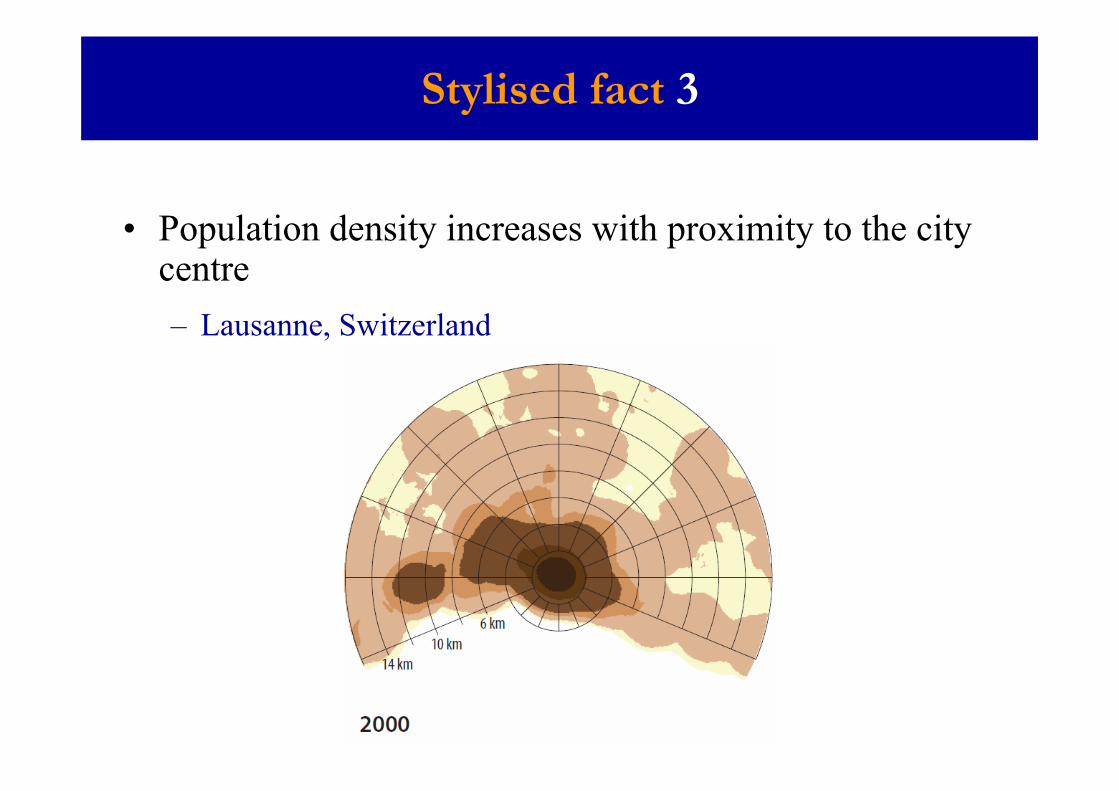
• Population density increases with proximity to the city centre– Lausanne, Switzerland
Stylised fact 3
31
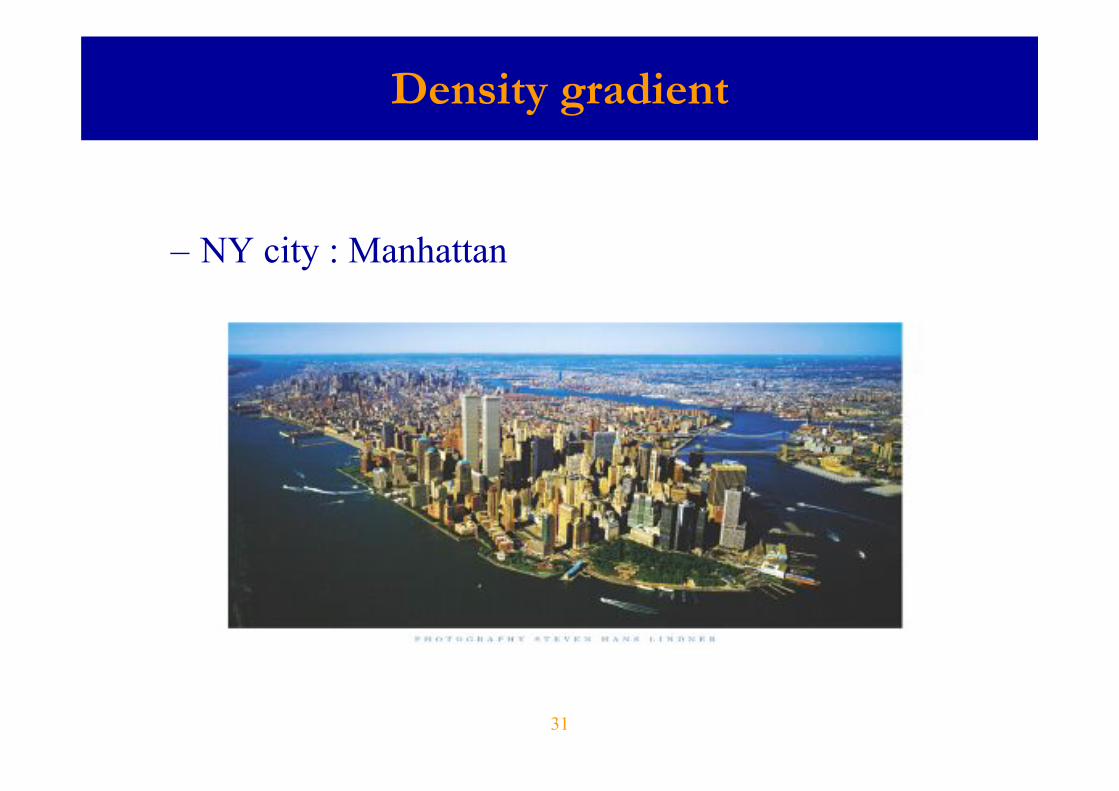
Density gradient
– NY city : Manhattan
32
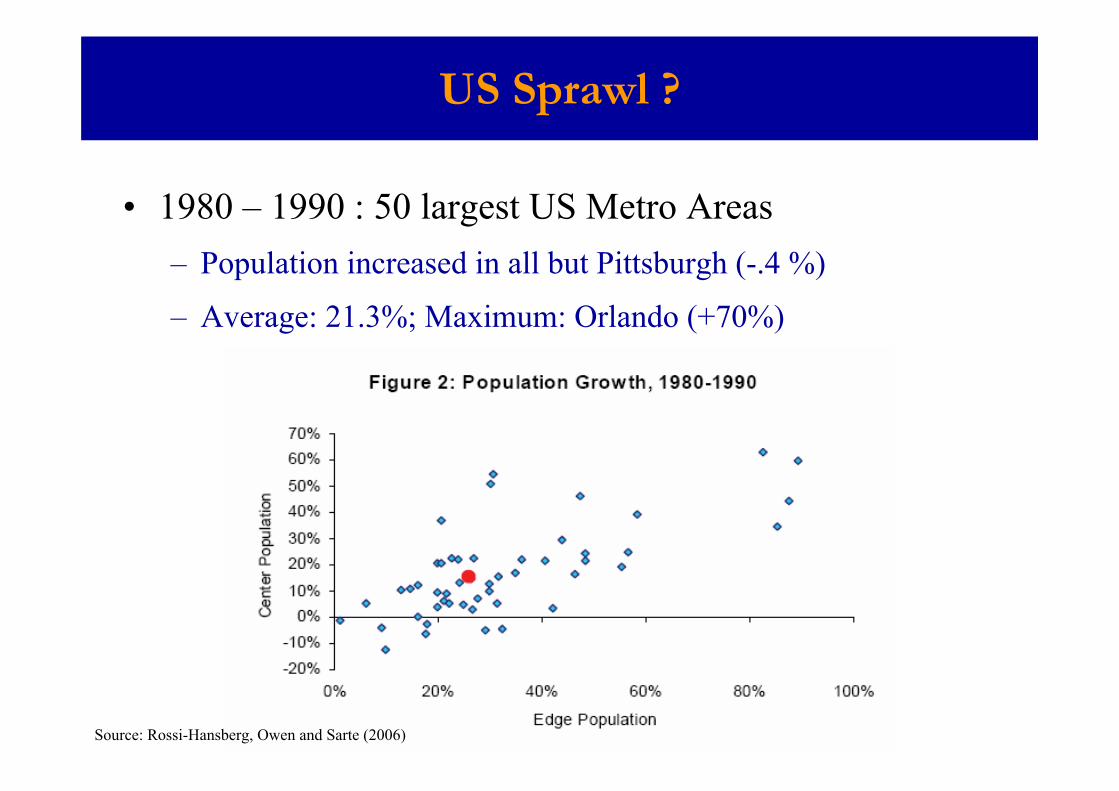
• 1980 – 1990 : 50 largest US Metro Areas– Population increased in all but Pittsburgh (-.4 %)
– Average: 21.3%; Maximum: Orlando (+70%)
US Sprawl ?
Source: Rossi-Hansberg, Owen and Sarte (2006)

33
(US Sprawl?)
• Population grew both at centres and edges– Las Vegas: +50% in the centre and +80% at edges
– Employment grew both at centre & in edge counties
Source: Rossi-Hansberg, Owen and Sarte (2006)

34
Contents
• Introduction– Core-Periphery patterns
– What is a city?
• Stylised facts 1-3– Broad regularities
• Stylised facts 4-6– Distribution of city sizes
• Stylised facts 7-12– Cities, Industries and Functions

35
• Cities vary considerably in terms of population size– In the US: NY: 18 million
Kansas City: 1.8 million
Lafayette (IN): 180,000
Los Alamos (NM): 18,000
Stylised fact 4
36
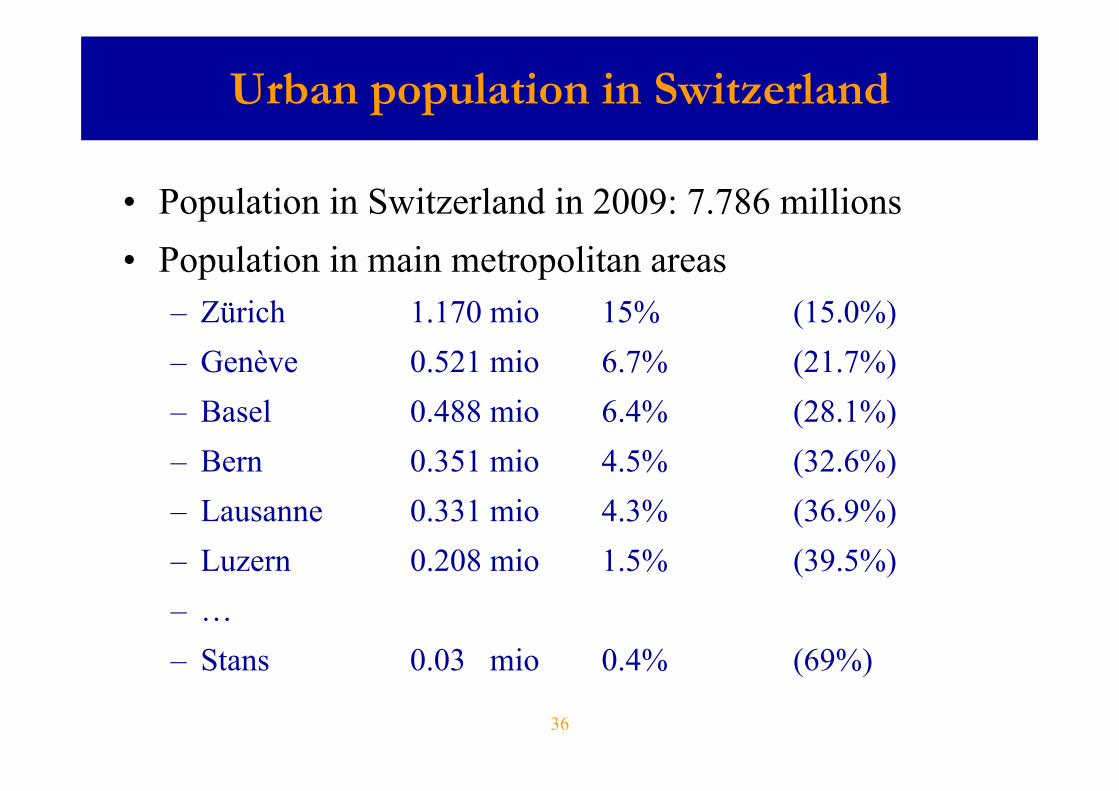
Urban population in Switzerland
• Population in Switzerland in 2009: 7.786 millions• Population in main metropolitan areas
– Zürich 1.170 mio 15% (15.0%)– Genève 0.521 mio 6.7% (21.7%)– Basel 0.488 mio 6.4% (28.1%)– Bern 0.351 mio 4.5% (32.6%)– Lausanne 0.331 mio 4.3% (36.9%)– Luzern 0.208 mio 1.5% (39.5%)– …– Stans 0.03 mio 0.4% (69%)

37
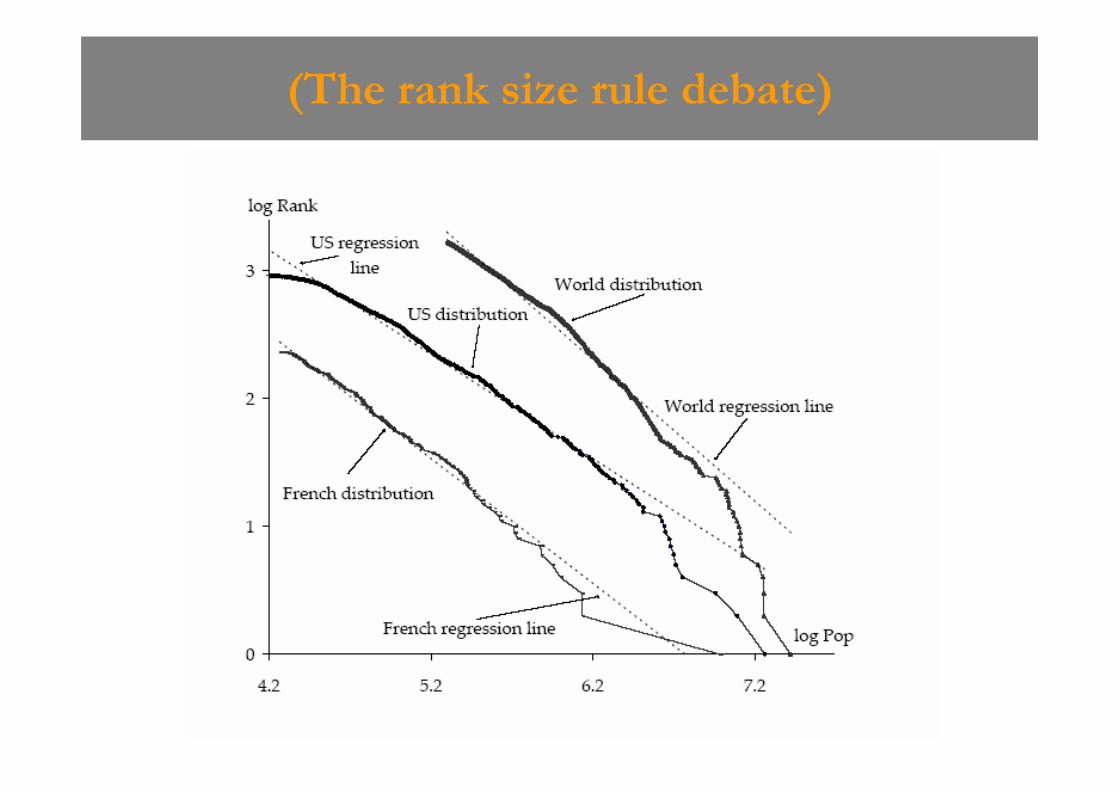
The rank size rule debate
• City size distribution is well approximated by the rank size rule [controversial]– Pareto distribution :
• Zip’s law:
max ( )( )( )
aSize iRank i
Size i
1a
38
(The rank size rule debate)
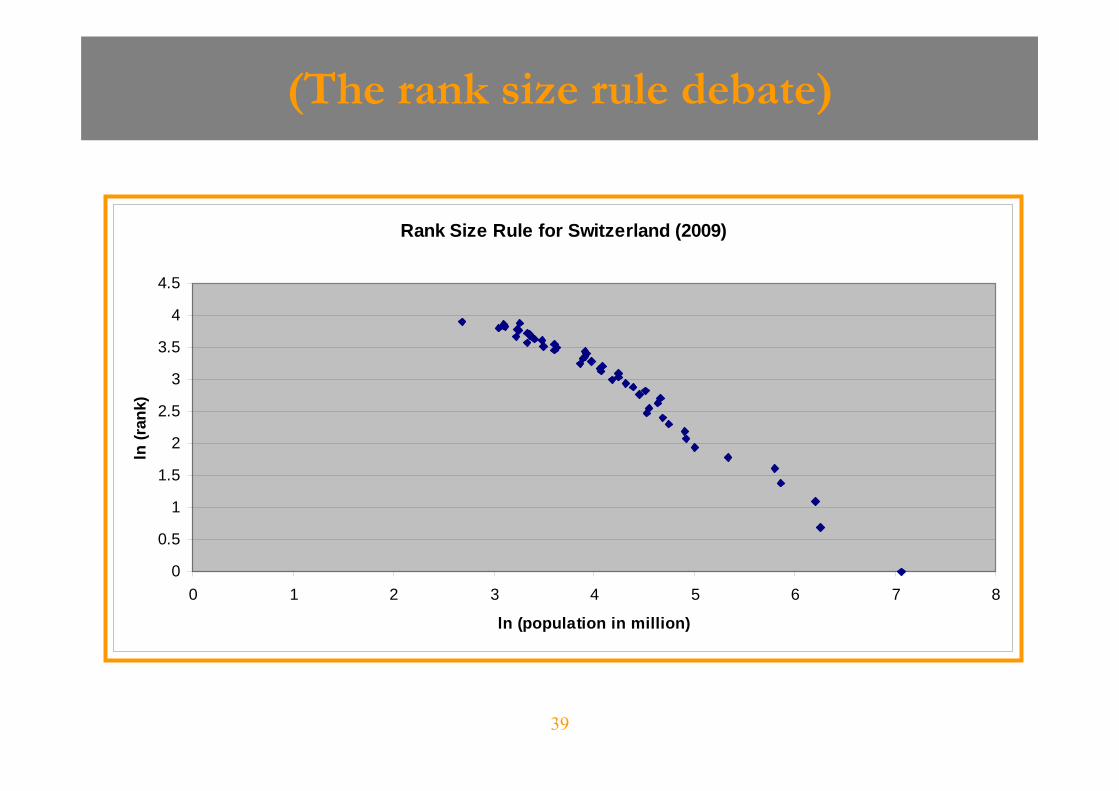
39
Rank Size Rule for Switzerland (2009)
0
0.5
1
1.5
2
2.5
3
3.5
4
4.5
0 1 2 3 4 5 6 7 8
ln (population in million)
ln (r
ank)
(The rank size rule debate)

40
(The rank size rule debate)
• Mixed evidence– Switzerland: a = .98
– France: a = .97 (Duranton) a = 1.02 (Soo)
– USA: a = .85
– World: a = 1.11
– 73 countries: See Soo (2005)
• Deviations from ‘rule’– Urban primacy
– Thick and thin lower tails
– Rotations over time Telephone & ICT revolutions
41
Stylised fact 5
• City rankings and relative city sizes change slowly over timeExceptions :
– Pittsburgh (demise of steel industry), Detroit Lost half of their population over 1950 – 1990
– San Jose (rise of internet-related industries)
– Phoenix’s population increased almost by a factor 10
• Changes in US metropolitan areas are mostly caused by local shocks at the industry level

42
Contents
• Introduction– Core-Periphery patterns
– What is a city?
• Stylised facts 1-3– Broad regularities
• Stylised facts 4-6– Distribution of city sizes
• Stylised facts 7-12– Cities, Industries and Functions
Stylised fact 7
• Specialised and diversified cities co-exist

44
Specialised and diversified cities
Source: Duranton and Puga (2000), using Black and Henderson’s dataset
45
Stylised fact 8
• Industries are mobile
• Evidence of ‘churning’ for France and US (Duranton 2005)– Changes in employment at the level of cities and
industries are about 10% per year
– whereas the growth rate of urban population is only about 3% per year
46
Stylised fact 9
• Larger cities tend to be more diversified
• Cities of similar diversification are of similar size– The relationship between size and diversity is not
very strong (partly because all cities have a large component of employment in non-tradeableactivities)
47
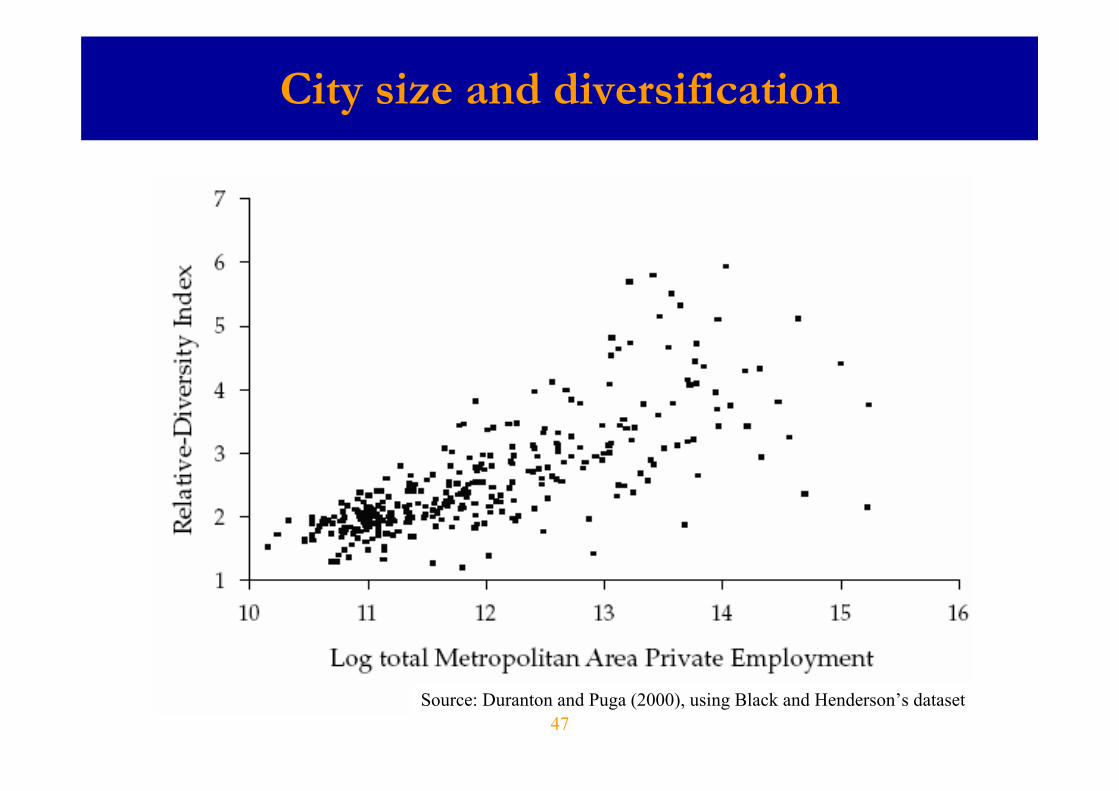
City size and diversification
Source: Duranton and Puga (2000), using Black and Henderson’s dataset
48
From sectoral to urban specialisation
• From sectoral to urban specialisation– Duranton and Puga (2005)
– Cities have gone from specialising mainly by sector to specialising mainly by function headquarters and business services disproportionately
clustered in larger cities
production plants clustered in smaller cities
49
• Most innovations take place in particularly diversified cities and most new plants are created there
• Most relocations are from diversified to specialised cities
Stylised fact 11

50
Nursery cities
• Jacobs (1969)
• Feldman and Audretsch (1999)– data set of 3969 U.S. product innovations in 1982
– 96% of the innovations in metropolitan areas (30% of population)
– Regress the number of innovations in sector-cities with diversity within underlying scientific base (++), specialisation (-) and size (+)
• Fujita and Ishii (1998)– Japanese electronics MNEs
• Duranton and Puga (2000, 2001)– on firm creation in France and firm relocation in France, respectively
51
Stylised fact 12
• More developed cities are more regulated– Hilber and Robert-Nicoud (2010) for the US Cities with nice amenities are more developed and more
regulated
Looks familiar?
– Regulation policies seem to be neither efficient nor democratic

52
Summary
• Cities are growing
• Cities are diverse
• Macro stability– E.g. distribution of city sizes is stable
• Micro dynamism– Individual cities grow at different rates and may
decline
– Creation and destruction in individual cities

53
Policy implications
• Localised agglomeration economies→ Improve urban efficiency
→ Free internal migration Let people and ideas move around
• Dynamic externalities and product cycle→ Free internal migration
→ Improve market access
→ Allow secondary cities to develop Especially in developing countries
54
References
Au, Chun-Chung and J. Vernon Henderson. 2007a. How migration restrictionslimit agglomeration and productivity in China. Journal of Development Economics 80(2):350-388.
Au, Chun-Chung and J. Vernon Henderson. 2007b. Are Chinese cities too small? Review of Economic Studies 73(3(:549-576.
Black, Duncan and J. Vernon Henderson. 2003. Urban evolution in the US. Journal of Economic Geography 3(4):343–372.
Black, Duncan and Vernon Henderson. 1999. Urban evolution of population and industry in the United States. American Economic Review Papers and Proceedings 89(2):321–327.
Behrens, Kristian and F. Robert-Nicoud. 2008. Survival of the fittest in cities. CEPR discussion paper.
Brezis, Elise S. and Paul R. Krugman. 1997. Technology and the life cycle of cities. Journal of Economic Growth 2(4):369–383.
Burchfield, Marcy, Henry G. Overman, Diego Puga, and Matthew A. Turner. 2006. Sprawl: A portrait from space. Quarterly Journal of Economics, in press.

(References)
Combes, Pierre-Philippe. 2000. Economic structure and local growth: France, 1984–1993. Journal of Urban Economics 47(3):329–355.
Combes, Pierre-Philippe and Henry G. Overman. 2004. The spatial distribution ofeconomic activities in the European Union. In Vernon Henderson and Jacques-François Thisse (eds.) Handbook of Regional and Urban Economics, volume 4. Amsterdam: North-Holland, 2485–2909.
Dobkins, Linda Harris and Yannis M. Ioannides. 2000. Dynamic evolution of the size distribution of US cities. In Jean-Marie Huriot and Jacques-François Thisse (eds.) Economics of Cities: Theoretical Perspectives. Cambridge: Cambridge University Press, 217–260.
Dumais, Guy, Glenn Ellison, and Edward L. Glaeser. 2002. Geographic concentration as a dynamic process. Review of Economics and Statistics 84(2):193–204.
Duranton, Gilles. 2007. Urban evolutions: The still, the slow, and the fast. American Economic Review 97(1): 197-221.
(References)
Duranton, Gilles. 2007. From cities to growth in developing countries. Mimeo, University of Toronto.
Duranton, Gilles and Henry G. Overman. 2005. Testing for localisation using micro-geographic data. Review of Economic Studies 72(4): 1077-1106.
Duranton, Gilles and Diego Puga. 2000. Diversity and specialisation in cities: Why, where and when does it matter? Urban Studies 37(3):533–555.
Duranton, Gilles and Diego Puga. 2001. Nursery cities: Urban diversity, process innovation, and the life cycle of products. American Economic Review 91(5):1454–1477.
Duranton, Gilles and Diego Puga. 2005. From sectoral to functional urban specialisation. Journal of Urban Economics 57(2):343–370.
Duranton, Gilles and Matthew Turner. 2007. Urban growth and transportation. Mimeo, University of Toronto.
57
Eaton, Jonathan and Zvi Eckstein. 1997. Cities and growth: Theory and evidence from France and Japan. Regional Science and Urban Economics 27(4–5):443–474.
Ellison, Glenn and Edward L. Glaeser. 1997. Geographic concentration in US manufacturing industries: A dartboard approach. Journal of Political Economy 105(5):889–927.
Ellison, Glenn and Edward L. Glaeser. 1999. The geographic concentration of industry: Does natural advantage explain agglomeration? American Economic Review Papers and Proceedings 89(2):311–316.
Feldman, Maryann P. and David B. Audretsch. 1999. Innovation in cities: Science-based diversity, specialization and localized competition. European Economic Review 43(2):409–429.
(References)
58
Fujita, Masahisa and Ryoichi Ishii. 1998. Global location behaviour and organizational dynamics of Japanese electronics firms and their impact on regional economies. In Alfred D. Chandler Jr., Peter
Glaeser, Edward L., Heidi Kallal, José A. Scheinkman, and Andrei Schleifer. 1992. Growth in cities. Journal of Political Economy 100(6):1126–1152.
Henderson, J. Vernon. 1997a. Externalities and industrial development. Journal of Urban Economics 42(3):449–470.
Henderson, J. Vernon. 1997b. Medium size cities. Regional Science and Urban Economics 27(6):583–612.
Henderson, J. Vernon. 2003. Marshall’s economies. Journal of Urban Economics 53(1):1–28.
(References)
59
Henderson, J. Vernon, Ari Kuncoro, and Matt Turner. 1995. Industrial development in cities. Journal of Political Economy 103(5):1067–1090.
Holmes, Thomas J. and John J. Stevens. 2004. Spatial distribution of economic activities in North America. In Vernon Henderson and Jacques-François Thisse (eds.) Handbook of Regional and Urban Economics, volume 4. Amsterdam: North-Holland, 2797–2843.
Jacobs, Jane. 1969. The Economy of Cities. New York: Random House.Overman, Henry G. and Yannis M. Ioannides. 2001. Cross-sectional evolution of
the US city size distribution. Journal of Urban Economics 49(3):543–566.
(References)

60
Rosenthal, Stuart S. andWilliam Strange. 2004. Evidence on the nature and sources of agglomeration economies. In Vernon Henderson and Jacques-François Thisse (eds.) Handbook of Regional and Urban Economics, volume 4. Amsterdam: North-Holland, 2119–2171.
Rossi-Hansberg, Esteban, Pierre-Daniel Sarte and Raymond Owen. 2006. Firm fragmentation and urban patterns. International Economic Review,forthcoming.
Soo, Kwok Tong. 2005. Zipf’s law for cities: A cross country investigation. Regional Science and Urban Economics 35(3): 239-263.
(References)