regime from international experimental and network … · study for industrial zones in north...
TRANSCRIPT

FRIEND‐Water 2014
7th Global FRIEND‐Water Conference
Extended abstracts
Montpellier, France
7‐10th October 2014
Hydrology in a Changing World:
Environmental and Human Dimensions
Flow Regime from International Experimental and Network Data
FRIEND‐Water
Editors
Henny A.J. van Lanen, Siegfried Demuth, Anne van der Heijden
Organized by:
UNESCO’s International Hydrological Programme (IHP)
Institut Montpelliérain de l’Eau et de l’Environnement (IM2E)
International Association of Hydrological Sciences (IAHS‐AISH)
IAHS‐AISH French Committee
German IHP/HWRP Hydrological Committee
Institut de Recherche pour le Développement (IRD)
Hydrosciences Montpellier (HSM)
Poster proceedings

Hydrology in a Changing World: Environmental and Human Dimensions Poster Proceedings of FRIEND-Water 2014, Montpellier, France, 7-10 October 2014
i
FRIEND‐Water 2014
7th Global FRIEND‐Water Conference
Extended abstracts
Montpellier, France
7‐10th October 2014
Hydrology in a Changing World:
Environmental and Human Dimensions
Editors
Henny A.J. van Lanen1), Siegfried Demuth2), Anne van der Heijden1)
1) Wageningen University, Wageningen, The Netherlands
2) UNESCO, Division of Water Sciences, Natural Sciences Sector, Paris, France
Poster proceedings
Flow Regime from International Experimental and Network Data
FRIEND‐Water
Wageningen/Paris
26 September 2014

Hydrology in a Changing World: Environmental and Human Dimensions Poster Proceedings of FRIEND-Water 2014, Montpellier, France, 7-10 October 2014
ii
Preface
The FRIEND‐Water programme is an international collaborative network of experts that aims to
generate new understanding about regional hydrology and multi—scale water cycle processes. The
programme contributes to the International Hydrological Programme (IHP) of UNESCO. The FRIEND‐
Water programme is a very important part of the new 8th Phase (2014‐2021) of IHP entitled “Water
Security: Responses to Local, Regional and Global Challenges”, which has started this year. There is no
other programme in UNESCO with such a long history, close to 30 years of international cooperation
and scientific networking. In UNESCO IHP the FRIEND‐Water programme is seen as the most successful
programme of UNESCO.
Over the years the FRIEND‐Water programme has attracted many scientists from around the world to
share experience, knowledge and best practice and has established a worldwide network of scientists
from universities and research institutes, including water managers and decision makers from different
agencies.
This publication demonstrates the significance of the programme through the contribution of a large
number of poster abstracts which have been submitted to the 7th Global FRIEND‐Water Conference.
The topic of the conference “Hydrology in a Changing World: Environmental and Human Dimensions”,
points to the new challenges ahead of us which is a water secure world. The conference takes place in
Montpellier, France, from 7 to 10 October 2014.
Due to the large number of abstracts received, over 230, the organizers have decided to prepare a
separate publication with extended abstracts that will support the poster presentation at the
conference. The publication will supplement the IAHS Red Book proceedings with the full papers and
the digital report of the different FRIEND‐Water groups, latter provides the reader with facts and
figures of the FRIEND‐Water programme over the period 2010‐2013.
The publication of the extended poster abstracts covers well the whole range of the scientific topics
which will be discussed during the conference. The authors of the posters will have the opportunity to
present their posters during the poster sessions. The editors would like to express their thanks to the
authors for their great efforts to contribute to the success of the 7th World FRIEND‐Water Conference.
II

3
Table of contents
Preface ..................................................................................................................................................... II
Table of contents .................................................................................................................................... III
Overview of extended abstracts ............................................................................................................. 1
Extended abstracts .................................................................................................................................. 4
III

1
Overview of extended abstracts
Nr Title of abstract First author Page
1 Trends in droughts during crop growing periods of Bangladesh Alamgir 4
2 Niger‐HYPE: How may climate change affect floods and droughts in the Niger River basin?
Andersson 6
3 The analysis of functioning the maximal and annual runoff in different climates
Asabina 8
4 Les modèles mathématiques: outils de gestion des systèmes aquifères. Application à la nappe alluviale de Maghnia (NW Algérie)
Baba‐Hamed 10
5 Reutilisation des bouteilles en plastique pour l’irrigation des palmiers dattiers
Benlarbi 12
6 Agricultural and water resources drought: differences De Boer 14
7 Recovery of different drought types Boleij 16
8 The analysis of the spatial and temporal changes in the low flow characteristics of the Volga Basin Rivers in a changing climate
Bolgov 18
9 Bayesian decision for runoff evaluation in non‐stationary conditions Bolgov 20
10 Estimation et modélisation des transports solides en suspension dans l’Oued Boumessaoud (Tafna‐ NW algérien)
Bouanani 22
11 Mekong‐HYCOS, an improvement of monitoring the Mekong River Briquet 24
12 Apport de la géochimie et des isotopes dans l'étude de nappes de vallée andine en zone anthropisée: vallée d'Aburrá ‐ Medellin (Colombie)
Campillo 26
13 Understanding climate changes in Southern Italy using the rainfall erosivity factor of the USLE
Capra 28
14 Using spot gauging data to estimate the annual minimum monthly flow with a return period of 5 years in France
Catalogne 30
15 Assessment of annual and monthly rainfall in semi‐arid region within the climatic change context (study case: Serrat basin, central Tunisia)
Chargui 32
16 Human‐induced alterations of extreme water level in the Pearl River Delta, South China
Chen 34
17 Which catchment characteristics influence the temporal dependence structure of daily river flows?
Chiverton 36
18 A web‐based information portal and (real time) decision support system for flood control and water resources management
Dahm 38
19 Natural and anthropogenic factors on the mechanical erosion in the Red River (Vietnam): temporal and spatial variability of sediment transport
Dang 40
20 Nitrate pollution risk of Quaternary groundwater in the southern part of Abidjan District (Côte d'Ivoire)
Douagui 42
21 Influence of drought conditions on aquatic habitat quality in the upper Nitra River Basin in Slovakia
Fendekova 44
22 The ‘streampower’ as predictor in assessing the sediment concentration in interrill overland flow
Gabriels 46
23 Analysis of daily and monthly rainfall in north Algeria Ghenim 48
24 Geophysical Techniques to Aquifer Locating and Monitoring, case study for Industrial Zones in North Hanoi, Vietnam
Giang 50
25 Mise en évidence de la dynamique des aquifères en zone montagneuse dans la région de Bucaramanga (Colombie) par l'usage de la géochimie isotopique
Gomez 52

Hydrology in a Changing World: Environmental and Human Dimensions Poster Proceedings of FRIEND-Water 2014, Montpellier, France, 7-10 October 2014
2
26 Statistical analysis for modeling the hydrological risks in Latin America and the Caribbean
Gutiérrez 54
27 Trend changes in extreme and monthly stream flow of the Vah River Halmova 56
28 Long‐term observation records on hydraulic head and groundwatertemperature in snowfall Northern Japan ‐ what is revealed
Hida 58
29 Estimation of Evapotranspiration from Pasoh Forest Reserve in Malaysia using Remote Sensing Data
Ibrahim 60
30 Bilan hydrologique du bassin versant de l’Agneby (Côte d’Ivoire): application du modèle hydrologique nTopAmma
Kamagaté 62
31 Hydrologie et hydrochimie des eaux dans la zone de construction du chenal du port de pêche de Grand‐Lahou, Côte d’Ivoire
Konan 64
32 Network of Russian and former Soviet research watersheds as a framework for comprehensive model evaluation and improvement
Lebedeva 66
33 Is the Cox‐Stuart test for trend really insensitive to autocorrelation? Ledvinka 68
34 Ecohydrology, sedimentation & sustainable sediment management options in inland water bodies in Ethiopia: A review
Ligdi 70
35 FRIEND‐Water Discharge Data at the WMO Global Runoff Data Centre (GRDC)
Looser 72
36 Water resources in the Red River Delta (Northern Vietnam) and prospective scenarios
Luu 74
37 Road sediment production and delivery: methods, processes, rates, and management guidelines
MacDonald 76
38 Quantifying payments for environmental services: land use differences in runoff and erosion, Lam Dong Province, Vietnam
MacDonald 78
39 The way we are heading in flood quantiles estimation Markiewicz 80
40 Near real‐time remotely sensed data for flood monitoring and forecasting
Mason 82
41 Characterization of sediment and physical chemistry of Ayame Lake Meledje N’Diaye 84
42 Probability distribution of rainfall in the Bia watershed: contribution of Markov chains
Meledje N’Diaye 86
43 Annual maximum stream flows of the Danube River in 1876–2005 Miklanek 88
44 Buffering Capacity of Constructed and Manipulated Wetland: Case Study Kirinya Wetland, northern Lake Victoria
Muyodi 90
45 Recorded changes over hydrological extremes of Oubangui at Bangui (Central African Republic): trends analysis
Nguimalet 92
46 Assessment of the environmental risk of glyphosate herbicide and its metabolite AMPA in the canals, surface water at Saigon ‐ Dong Nai and Mekong Delta
Nhu‐Trang 94
47 A framework for evaluating local climate impacts on the surface‐water balance and the hydrological regime in the Vu Gia‐Thu Bon basin in Central Vietnam
Nguyen 96
48 Changements climatiques et mutations agraires dans les paysanneries de l’Est ivoirien
Noufé 98
49 Analysis of climate variability in Enugu state Nigeria using 30 years rainfall and temperature data
Okorie 100
50 Trends in Rainfall and Rainfall Related Extremes in the East Coast of Malaysia
Olaniyan 102
51 Modélisation hydrologique dans un contexte de changement global en Afrique de l’Ouest
Paturel 104
52 Water sources and flow paths in a forested catchment of the East Asian monsoon region
Payeur‐Poirier 106
53 Spatio‐temporal analysis of monthly temperature in Peruvian mountainous areas. Validation of NCEP/NCAR and CRU data.
Rau 108

Hydrology in a Changing World: Environmental and Human Dimensions Poster Proceedings of FRIEND-Water 2014, Montpellier, France, 7-10 October 2014
3
54 Comparing a semi‐distributed and a global method for radar calibration
Raynaud 110
55 The evaporation reduction of Algerian open water storages by monolayers
Saggaï 112
56 Assessment of the hydrological regime in the Upper Don River Basin under a changing climate
Sentsova 114
57 Hydrological monitoring and the formation of hydrological data bases in the Republic of Belarus
Shevtsova 116
58 Flood Frequency Analysis supported by the largest historical flood Strupczewski 118
59 Model development for anaysis of nitrate leaching and its field application in a rural area
Suk 120
60 Flood Hazard Assessment in Kota Tinggi, Malaysia Tam 122
61 Nonuniform sediment transport and flow characteristics downstream of a hydraulic structure
Termini 124
62 Regulation effects of reservoir system on flow regime in Red River downstream
Thuy Ngo 126
63 Groundwater pollution and the safe water supply challenge in Cotonou coastal town, Benin (West Africa)
Totin 128
64 Application of a 3D numerical model for simulation of suspended sediment transport in Bach Dang – Cam estuary (Vietnam)
Vinh 130
65 Quantification et analyse multivariée de l’érosion hydrique en région méditerranéenne (cas du bassin versant Isser, Algérie)
Zegganze 132

Hydrology in a Changing World: Environmental and Human Dimensions Poster Proceedings of FRIEND-Water 2014, Montpellier, France, 7-10 October 2014
4
Trends in droughts during crop growing periods of Bangladesh MD. MAHIUDDIN ALAMGIR & SHAMSUDDIN SHAHID
Department of Hydraulics & Hydrology, Faculty of Civil Engineering Universiti Teknologi Malaysia (UTM), Johor Bahru, Malaysia [email protected]
INTRODUCTION Bangladesh is an agriculture-based country where about 80% of its 145 million people are directly or indirectly occupied in a wide range of agricultural activities. Rainfall is the most important natural factor to determine the crop production. Therefore, deficit of rainfall or drought in any cropping season cause huge loss of economy (Shahid, 2008). Though droughts are recurrent phenomena in Bangladesh, very little attention has been paid so far to the mitigation and preparedness of droughts. This study attempts to understand the spatial pattern of droughts during three major crop growing seasons of Bangladesh namely, Kharif season extends from May through October, Rabi season from November to April and Pre-Kharif season- extends from March to the end of May. It is expected that the study will help the stakeholders and policy makers to understand the changing pattern of droughts in Bangladesh during crops growing seasons. DATA AND METHODOLOGY Monthly rainfall records of 29 stations of Bangladesh for fifty years (1961–2010) are collected from Bangladesh Meteorological Department for the study. The stations are distributed over the country. As the topography of Bangladesh is very flat, it can be considered that those stations can represent the distribution of hydro-meteorological phenomena of Bangladesh.
Standardized Precipitation Index (SPI) (McKee et al., 1993) is used for restoration of droughts event from rainfall time series. SPI can characterize droughts by their duration, frequency and severity; and therefore, used in the present study for the reconstruction of drought events during different crop growing periods. In the present study drought events are reconstructed for Kharif (monsoon), Pre-Kharif (pre-monsoon) and Rabi (winter) seasons. The events are analyzed using non-parametric Mann-Kendall test to understand the long-term trends of droughts in different crop growing periods. Significance levels of 5% and 10% are taken as thresholds to classify the significance of positive and negative trends. Drought is a dynamic phenomenon, which changes over time and space. Therefore, complete analysis of drought requires study both of its spatial and temporal extents. GIS is used in the present study for spatial modeling of droughts of Bangladesh during various seasons. Trend at each station is interpolated using kriging method in a geographic information system (GIS) tools to show the spatial distribution of seasonal drought trends in Bangladesh.
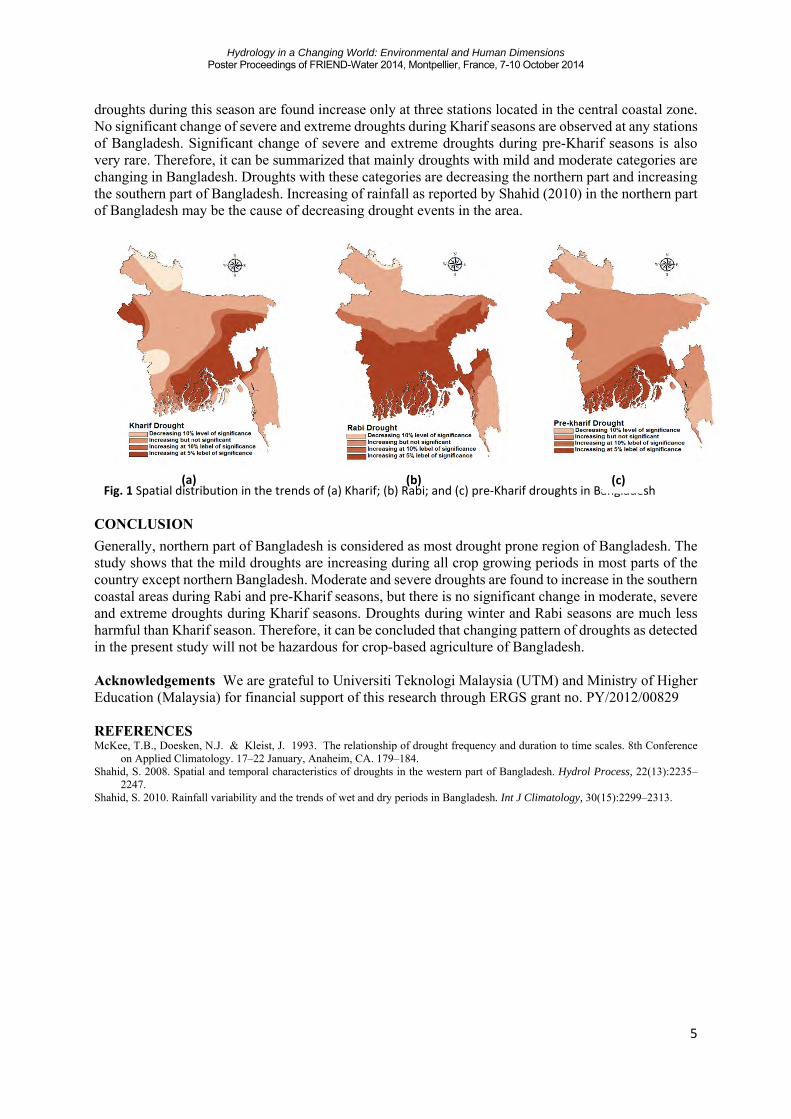
RESULT AND DISCUSSION Drought events during different crop growing seasons are categorized in mild (-1.0 ≤ SPI ≤ 0), moderate (-1.0 ≤ SPI ≤ -1.5), severe (-1.5 ≤ SPI ≤ 2.0) and extreme droughts (-2.0 ≤ SPI) following the classification proposed by McKee et al. (1993). Trend analysis is then carried out for different categories of droughts for different crop growing seasons. Spatial pattern of mild droughts during Kharif, Rabi and pre-Kharif seasons are shown in Figure 1. The figure shows droughts in all crop growing seasons are decreasing in north Bangladesh. Mild droughts during Kharif season are found to increase significantly in central west and central south parts, the Rabi droughts are found to increase in the south, central and west parts, and the pre-Kahrif droughts are found to increase in the coastal regions of Bangladesh. Very few significant trends are observed for other drought categories during major crop growing seasons of Bangladesh. Moderate droughts during Rabi seasons are found to increase increase in the south, central and west parts of the country as like the mild droughts. It is found to increase only in one station located in the north of Bangladesh. Moderate droughts during Kharif and pre-Kharif seasons are found to increase significantly only at two stations located in the central coastal part of the country. Severe droughts during Rabi seasons are found to increase along the coastal region of Bangladesh. Extreme
Hydrology in a Changing World: Environmental and Human Dimensions Poster Proceedings of FRIEND-Water 2014, Montpellier, France, 7-10 October 2014
5
droughts during this season are found increase only at three stations located in the central coastal zone. No significant change of severe and extreme droughts during Kharif seasons are observed at any stations of Bangladesh. Significant change of severe and extreme droughts during pre-Kharif seasons is also very rare. Therefore, it can be summarized that mainly droughts with mild and moderate categories are changing in Bangladesh. Droughts with these categories are decreasing the northern part and increasing the southern part of Bangladesh. Increasing of rainfall as reported by Shahid (2010) in the northern part of Bangladesh may be the cause of decreasing drought events in the area.
CONCLUSION
Generally, northern part of Bangladesh is considered as most drought prone region of Bangladesh. The study shows that the mild droughts are increasing during all crop growing periods in most parts of the country except northern Bangladesh. Moderate and severe droughts are found to increase in the southern coastal areas during Rabi and pre-Kharif seasons, but there is no significant change in moderate, severe and extreme droughts during Kharif seasons. Droughts during winter and Rabi seasons are much less harmful than Kharif season. Therefore, it can be concluded that changing pattern of droughts as detected in the present study will not be hazardous for crop-based agriculture of Bangladesh. Acknowledgements We are grateful to Universiti Teknologi Malaysia (UTM) and Ministry of Higher Education (Malaysia) for financial support of this research through ERGS grant no. PY/2012/00829 REFERENCES McKee, T.B., Doesken, N.J. & Kleist, J. 1993. The relationship of drought frequency and duration to time scales. 8th Conference on Applied Climatology. 17–22 January, Anaheim, CA. 179–184. Shahid, S. 2008. Spatial and temporal characteristics of droughts in the western part of Bangladesh. Hydrol Process, 22(13):2235– 2247. Shahid, S. 2010. Rainfall variability and the trends of wet and dry periods in Bangladesh. Int J Climatology, 30(15):2299–2313.
(a) Fig. 1 Spatial distribution in the trends of (a) Kharif; (b) Rabi; and (c) pre‐Kharif droughts in Bangladesh(c) (b)

Hydrology in a Changing World: Environmental and Human Dimensions Poster Proceedings of FRIEND-Water 2014, Montpellier, France, 7-10 October 2014
6
Niger-HYPE: How may climate change affect floods and droughts in the Niger River basin?
JAFET C. M. ANDERSSON1, ABDOU ALI2, BERIT ARHEIMER1 & FARID TRAORÉ2 1 Swedish Meteorological and Hydrological Institute (SMHI), 601 76 Norrköping, Sweden [email protected] 2 AGRHYMET Regional Centre, P.O. 1011, Niamey, Niger The Niger is West Africa’s largest river basin covering 2.1 million km2 in ten countries. The majority of the basin’s more than 100 million inhabitants live under the US$1.25 poverty line, and rely on rain-fed agriculture and livestock rearing for their livelihoods. The livelihoods are to a large extent dependent on the variable climate in the basin. Rainfall is erratic and seasonal, and follows a strong gradient from the moist south to the Sahara desert in the north. The sensitivity of the Sahel to rainfall fluctuations is well documented, particularly during the droughts and famine in the 1970s and 1980s, but also in the more recent flooding events of 2007, 2008, and 2009 (Descroix et al., 2009). A pertinent question is therefore what effect climate change may have on floods and droughts in the region. To investigate this question we use dynamically downscaled and bias-corrected climate model data together with a new application of the HYPE hydrological model (Lindström et al., 2010) in the Niger River basin. This new Niger-HYPE model was set-up and substantially refined through a collaborative effort integrating the process understanding and technical expertise of West African and Swedish hydrologists. We used the best available data at the basin scale on topography, land use, soil, lakes, reservoirs, and daily historic climate (1979-2009). We developed and successfully employed a custom-made routine for simulating the Inland Niger Delta wetland. The basin was divided into 803 linked sub-basins with average catchment size of 2500 km2. We calibrated and validated the model against 56 daily river discharge stations from the Niger-HYCOS database spread across the hydrologically active part of the basin (ABN, 2008, GRDC, 2012); and against monthly potential evapotranspiration from the MODIS satellite (Mu et al., 2007). A simultaneous multi-objective calibration approach was employed in order to obtain a balanced model for both river flow and evaporation across the basin (rather than optimized for a single location). Table 1 and Fig. 1a&b summarize and exemplify the model performance. Table 1 Summary of daily model performance criteria for the 56 river discharge stations during the calibration period (1994-2009). Criteria Minimum 1st quartile Median 3rd quartile Maximum Standard Deviation
RE (%) ‐45.7 ‐12 ‐1.8 7.3 31.3 18.7
abs(RE) (%) 0.2 4.7 10 23.8 45.7 12.3
NSE (‐) ‐17.9 0.13 0.41 0.60 0.88 2.47
RE is cumulative relative error in water volume, and NSE is Nash-Sutcliffe Efficiency To assess climate change we used precipitation and temperature data from an ensemble of CMIP5 global climate model projections representing two greenhouse gas concentration scenarios, dynamically downscaled with a regional climate model and bias-corrected with a quantile-mapping approach (Yang et al., 2010). We compared historic and future water fluxes resulting from transient runs of the Niger-HYPE model from 1971-01-01 to 2100-12-31. The historic reference period was 1971-2000, and the period for which each global climate model reaches +2°C in average temperature relative to pre-industrial conditions represented the future. We analyzed potential future changes in the mean annual cycle, flood indices (e.g. the mean annual high flow, the 90th percentile, and the flow with a 30-year return period), drought duration (days below the historic 10th percentile) and drought intensity (mean flow below the historic 10th percentile) for both discharge and root-zone soil moisture.

Hydrology in a Changing World: Environmental and Human Dimensions Poster Proceedings of FRIEND-Water 2014, Montpellier, France, 7-10 October 2014
7
Fig. 1 Examples of model input data, model performance, and projected impacts of climate change. (a, b) Model performance during 1979-2009 relative to observations at the Koulikoro and Onitsha stations. (c, d) Projected changes in mean monthly river flow at the same stations. The lines represent the median and the shades the range of the climate projections simulating RCP4.5 and RCP8.5. (e) Projected changes in duration and intensity of agricultural water stress across the basin. The simulations indicate that temperature is likely to increase steadily in the basin in the future. Precipitation is also projected to increase, but perhaps more significantly to become more severe at the extremes (wettest/driest years become even wetter/drier). Floods are expected to increase in magnitude for most parts of the basin and most projections (Fig. 1c&d). The central Benue valley, the southern Bani basin and parts of the Guinea highlands may experience longer and more severe hydrological droughts. Agricultural drought events are projected to become more intense and of longer duration in most locations (Fig. 1e), which may impact the livelihoods of many inhabitants. Substaintial uncertainties and spatio-temporal variability remain in these conclusions. This study highlights one pertinent application of the Niger-HYPE model. In addition to being a research tool, it has the potential to be used for education, water management and operational hydrological forecasting. Our aim is to explore this potential together with partners in the region. Acknowledgements We are grateful for the financial support of this research provided by Sida (“Building resilience to floods and droughts in the Niger River basin - hydrological predictions for sustainable water use and climate change adaptation”) and the EU (IMPACT2C). REFERENCES
ABN. (2008) Niger-HYCOS Hydrological Information System. Retrieved March 1, 2012, from http://nigerhycos.abn.ne/ Descroix, L., Mahé, G., Lebel, T., Favreau, G., Galle, S., Gautier, E., Olivry, J.-C., et al. (2009) Spatio-temporal variability of
hydrological regimes around the boundaries between Sahelian and Sudanian areas of West Africa: A synthesis. J. Hydrol. 375(1–2), 90–102. doi:10.1016/j.jhydrol.2008.12.012
GRDC. (2012) The GRDC world-wide repository of river discharge data and associated metadata. Glob. Runoff Data Cent. Fed. Inst. Hydrol. BfG Kobl. Ger. Retrieved February 1, 2012, from http://www.bafg.de/cln_031/nn_266934/GRDC/EN/Home/homepage__node.html?__nnn=true
Lindström, G., Pers, C., Rosberg, J., Strömqvist, J. & Arheimer, B. (2010) Development and testing of the HYPE (Hydrological Predictions for the Environment) water quality model for different spatial scales. Hydrol. Res. 41(3-4), 295–319. doi:10.2166/nh.2010.007
Mu, Q., Heinsch, F. A., Zhao, M. & Running, S. W. (2007) Development of a global evapotranspiration algorithm based on MODIS and global meteorology data. Remote Sens. Environ. 111(4), 519–536.
Yang, W., Andréasson, J., Phil Graham, L., Olsson, J., Rosberg, J. & Wetterhall, F. (2010) Distribution-based scaling to improve usability of regional climate model projections for hydrological climate change impacts studies. Hydrol. Res. 41(3-4), 211. doi:10.2166/nh.2010.004

Hydrology in a Changing World: Environmental and Human Dimensions Poster Proceedings of FRIEND-Water 2014, Montpellier, France, 7-10 October 2014
8
The analysis of functioning the maximal and annual runoff in different climates
ELENA ASABINA Ugra State University, 16, Chekhov str., 628012 Khanty-Mansiysk, Russia [email protected]
The joint analysis of maximal and annual runoff is directed at the identification trends in hydrological extremes according to climates. The catchments, which are being under the influence of four climatic zones with 10 subzones and with 8 natural zones, have been used. Hydrological parameters include maximal discharge, maximal specific discharge, annual discharge, annual specific discharge, annual depth of runoff, annual volume of runoff. The hydrological database has made by 8162 values for this research (Billon et al. 1974; Brunet-Moret et al., 1986; Olivry, 1986; State water cadastre, 1984).
This analysis is difficult because of the diversity of climatic, natural and hydrographic conditions on studied catchments. Criteria have been determined to overcome these difficulties. To reflect better the climatic influence on runoff criteria were flat rivers, gauge runoff, zonal type of runoff. To find out natural laws through multi-annual conditions criterion was an average year. To equalize the individual peculiarities of catchments criteria were similar areas for catchments, similar mean heights for catchments, similar mean slopes for catchments.
The period of the big maximal wave includes the meltwater period in the north or the rains season's period in the south. The analysis has revealed following spatial laws:
a) maximal specific discharges vary from 177 to 14 l/(skm2) and annual specific discharges vary
from 8 to 27 l/(skm2) with annual volume between 0.53 and 4.5 km3 in the climate "continental with excessive humidity and insufficient warming" and in the natural zone "forest-tundra" (68-67°N);
b) maximal specific discharges decrease from 14 to 8 l/(skm2) and annual specific discharges decrease from 0.57 to 1.2 l/(skm2) with annual volume between 0.12 and 0.28 km3 in the climate "semi-arid with Sudan-Sahara type" and in the natural zone "savanna" (16-13°N);
c) maximal specific discharges gradually increase from 16 to 26 l/(skm2) and annual specific discharges increase from 2.5 to 7.7 l/(skm2) with annual volume between 0.44 and 0.83 km3 in the climate "tropical with Sudan type" and in the natural zone "forest savanna" (13-6°N);
d) maximal specific discharges change from 28 to 174 l/(skm2) and annual specific discharges change from 9 to 49 l/(skm2) with annual volume between 1.1-3.6 km3 in the climate "equatorial with Cameroon type" and in the natural zone "equatorial forest" (6-2°N). The joint amplitude of values has made from 8 to 177 l/(skm2) for maximal specific
discharges with discharges from 52 to 1270 m3/s and has made from 0.57 to 49 l/(skm2) for annual specific discharges with discharges from 3.9 to 229 m3/s.
It is verify the conformity between the maximal specific discharges and the annual depths of runoff for all climatic subzones (Fig. 1). The greatest specific discharges of the maximum runoff (177 l/(skm2) and 174 l/(skm2)) are identical in a climate "continental with excessive humidity and insufficient warming" (68-67°N) and in a climate "equatorial with Cameroon type" (6-2°N). However, in latitude 6-2°N the annual depths of runoff are more in three times. It is caused by groundwater, which are included in annual depths of runoff (annual volume). Whereas, maximal specific discharges (maximal discharges) are formed by annual precipitation only. Besides, both climatic zones have the joint law − excessive humidity territories.

Hydrology in a Changing World: Environmental and Human Dimensions Poster Proceedings of FRIEND-Water 2014, Montpellier, France, 7-10 October 2014
9
Fig. 1 Changes of maximal specific discharges and annual depths of runoff in different latitudes.
Thus, the increase of annual depths of runoff is not realized through the peak of big water wave, i.e. maximal discharges and maximal specific discharges. This increase is realized through the dry weather flow. REFERENCES Billon, B., Guiscafre, J., Herbaud, J., Oberlin, G. (1974) Le Bassin du Fleuve Chari. Édition de l'ORSTOM, Paris, France. Brunet-Moret Y., Chaperon P., Lauragat J.P., Molinier M. (1986) Monographie Hydrologique du Fleuve Niger. Tome I, II. Édition de
l'ORSTOM, Paris, France. Olivry, J.C. (1986) Fleuves et Rivières du Cameroun. MESRES-ORSTOM, Paris, France. State water cadastre (1984). Long-term data about regimes and resources of surface water. Vol. I, Issue 10. Gidrometeoizdat,
Leningrad.
68-6
7 N
67-6
4 N
64-5
8 N
58 N
16-1
3 N
13-1
1 N
8-6
N
11-9
N
7-2
N
6-2
N
177
128
85
1614 26
18
87
60
174
70
101
25
148 20
16
52
28
112
0
20
40
60
80
100
120
140
160
180
max
imal
spe
cific
dis
char
ge l
/(s
km2)
latitude (degree)
я
68-6
7 N
67-6
4 N
64-5
8 N
58 N
16-1
3 N
13-1
1 N
8-6
N
11-9
N
7-2
N
6-2
N
541
373
273
7737 95 145
750
430
1544
269 338
119
3918 79
77
385
278
768
0
200
400
600
800
1000
1200
1400
1600
annu
al d
epth
of r
unof
f (m
m)
latitude (degree)
я
max
min
max
min

Hydrology in a Changing World: Environmental and Human Dimensions Poster Proceedings of FRIEND-Water 2014, Montpellier, France, 7-10 October 2014
10
Les modèles mathématiques: outils de gestion des systèmes aquifères. Application à la nappe alluviale de Maghnia
(NW Algérie)
BABA-HAMED KAMILA1, BOUANANI ABDERRAZAK 2, AZIZ HADJIRA3 ET MEGUENNI TANI MERIEM3
1 Laboratoire n°25, Département des Sciences de la Terre et de L’univers, FSNVSTU, Université de Tlemcen, BP 119, 13 000, Tlemcen, Algérie. [email protected] 2 Laboratoire n°25, Département d’Hydraulique, Faculté de Technologie, Université de Tlemcen, BP 119, 13 000, Tlemcen, Algérie. 3 Département des Sciences de la Terre et de L’univers, FSNVSTU, Université de Tlemcen, BP 119, 13 000, Tlemcen, Algérie
Resumé: Dans ce travail, nous présentons pour la première fois un modèle hydrodynamique de la nappe de Maghnia que nous avons réalisé en utilisant le code ASM.5 (Aquifère simulation model.5) (Kinzelbakh et Rausch 1995) basé sur la méthode des différences finies. Ceci, nous a conduit à l’identification de la structure du réservoir alluvionnaire, de sa géométrie et des paramètres hydrogéologiques qui gèrent ses comportements hydrodynamiques, lesquels n’ont fait jusqu’à présent l’objet d’aucune recherche sur l’intégralité de la nappe. Abstract: In this work, we present for the first time a hydrodynamic model of the aquifer of Maghnia we have achieved using the code ASM.5 (Aquifer simulation model.5) (Kinzelbakh and Rausch 1995) based on the finite differences method. This led us to the identification of the structure of the alluvial tank, its geometry and its parameters that hold hydrogeological hydrodynamic behavior, which so far have been no research on the entire the aquifer. Key words: Hydrogeology, alluvial, sheet, water resources, modeling, the finite difference method, Maghnia, Algeria. CADRE GENERAL
D’une superficie de 351 km2, la plaine de Maghnia est située au Nord-Ouest de l’Algérie à 400 m d’altitude en moyenne, entre les Monts de Tlemcen au Sud (Rhar-Roubane) et les Traras au Nord (Djebel Fillaoucène). La plaine de Maghnia est une cuvette allongée selon une direction ENE-WSW comblée par des dépôts d’érosion des montagnes bordières. Les reliefs de bordure sont très diversifiés allant du Paléozoïque (schistes et quartzites) au Cénozoïque. Le Miocène est formé à la lisière du bassin par une bande plus ou moins large de grés calcaires (d’âge Tortonien) qui s’appuie directement sur le Jurassique au Nord et au Sud de la plaine de Maghnia. La plaine de Maghnia reçoit en moyenne 293 mm de pluie par an. MODELISATION
Le modèle (ASM.5) (Aquifer Simulation Model) mis au point par Kinzelbach et Rausch en 1995, est utilisé en régime transitoire pour simuler les écoulements dans la nappe de l’aquifère alluvial de Maghnia.
Calage du modèle L’état de référence retenu pour caler le modèle en régime permanant est la piézométrie de Mai 1995, correspondant à une période de moyennes eaux. Les résultats calculés par le modèle révèlent une bonne reconstitution des niveaux piézométriques avec un écart absolu moyen de 0,5m (Fig. 1). Aussi, avec un critère de performance égal à 0,99, le calage peut être considéré comme très satisfaisant. Trois grands domaines de perméabilité ont été individualisés (Fig. 2).

Hydrology in a Changing World: Environmental and Human Dimensions Poster Proceedings of FRIEND-Water 2014, Montpellier, France, 7-10 October 2014
11
Fig. 1 Superposition de la piézométrie calculée Fig. 2 Carte de la perméabilité K(m/s) et mesurée en régime permanent pour le calage en régime permanent Le modèle calé par la suite en régime transitoire permet l’établissement d’une nouvelle répartition du coefficient d’emmagasinement (Fig. 3).
Exploitation du modèle mathématique Trois scénarii d’exploitation ont été proposés sur une échéance de 30 ans (surexploitation, Sècheresse et Recharge artificielle). Les résultats simulations montrent que: •Les parties nord et centrale sont les zones les plus influencées par la sècheresse et la surexploitation. •Possibilité de réapparition des sources dans le cas d’une recharge importante.
Fig. 3 Carte de la porosité efficace adoptée pour le calage du modèle en régime transitoire.
REFERENCES
Baba-Hamed, K. 2007. Hydrodynamique et modélisation d’une nappe alluviale, validation par l’approche géostatistique. application à la nappe de la plaine de Maghnia (NW Algérien). Thèse Doc. Univ., Tlemcen, 158 p.
Kinzelbach, W. et Rausch, R.,1995. Aquifer Simulation Model. International groudwater modelling center. Netherlands. 53p.
Maille à débit entrant
Maille à flux nul
Maille à débit sortant (puits)
Puits d ’observation
Iso-pièze mesurée
Iso-pièze calculée
N
0 1 2 3 4 5 Km

Hydrology in a Changing World: Environmental and Human Dimensions Poster Proceedings of FRIEND-Water 2014, Montpellier, France, 7-10 October 2014
12
Reutilisation des bouteilles en plastique pour l’irrigation des palmiers dattiers
BENLARBI DALILA, SAGGAÏ SOFIANE Laboratoire d’exploitation et de variation des ressources naturelles en zones arides Université de KASDI MERBAH- Ouargla, BP511, Ouargla 30000 Algérie [email protected]. FAX +21329715176 INTRODUCTION Les pratiques actuelles d’irrigation basées sur les méthodes traditionnelles à dominance superficielle (notamment par planche, par sillon, etc…) sont une véritable source de gaspillage de l’eau [F.A.O, 1995]. Pour maximiser l’efficacité de l’eau utilisée par les cultures il faut la conserver ce qui impose la minimisation des pertes dues au ruissellement, à l’infiltration, et à l’évaporation. Notre travail consiste à combiner l’irrigation localisée et l’irrigation par infiltration, en appliquant une des plus anciennes méthodes utilisée depuis le temps des romains dans toute l’Afrique du Nord et le Proche-Orient basée sur le déversement fréquent de l’eau dans des vases en poterie poreux enfouis dans le sol [Bagochvski 1987]. Mais la problématique est la détermination de cette périodicité et ce dosage d’arrosage.
MATERIELS ET METHODES Nous avons utilisé des bouteilles en plastique de capacité 1.5 litres remplies de pierre ponce noir basaltique (pour assurer la porosité et pour permettre aux bouteilles de se maintenir). [Salem Khater, 2009]. On perce les bouteilles de trous de 2 mm de diamètre espacés de 2cm dans les quatre directions, puis on enveloppe les bouteilles de tissu géotextile pour uniformiser l’humidité du sol autour des bouteilles d’une part et empêcher la pénétration des racines à l’intérieur des bouteilles d’autre part (Figure 1). On place les bouteilles espacées de 2 m dans des petites fosses peu profondes creusées à cet effet. Le sol est ensuite damé délicatement autour des cols des bouteilles de façon à ce que leurs bords dépassent à peine la surface du sol (Figure 2). L’eau arrive aux bouteilles au moyen d’un tuyau simple transparent (pour s’assurer que l’eau arrive bien aux bouteilles) de 43mm de diamètre relié au réservoir (une citerne en plastique de capacité 500 litres) alimenté d’un forage à proximité; à l’extrémité du tuyau soit à l’entrée de la bouteille on place un goutteur de débit 0,15L/mn (perfuseur utilisé dans les hôpitaux) pour régulariser l’écoulement. L’avantage de l’utilisation de la citerne est que nous pouvons injecter des nutriments solubles (engrais) avec la concentration nécessaire puisque le volume est connu. Nous avons utilisé huit (8) bouteilles.
RESULTATS ET DISCUSSION Pour mener à bien ce travail, nous avons fait varier le temps et la fréquence des arrosages. L’évaluation consistera à déterminer l’humidité dans le sol avant et après arrosage pour calculer la quantité d’eau reçue pendant l’arrosage et celle absorbée entre deux arrosage [Ollier.CH et Poirée.M, 1983 ], [Messahel El Mekki 1994]. Pour cela nous utilisons la formule suivante :
Dose= Da H (hmax –hmin) Da est la densité apparente du sol H est la profondeur de la couche explorée par les racines (m) hmax est l’humidité maximale c'est-à-dire après arrosage(%) hmin est l’humidité minimale c'est-à-dire avant arrosage(%)

Hydrology in a Changing World: Environmental and Human Dimensions Poster Proceedings of FRIEND-Water 2014, Montpellier, France, 7-10 October 2014
13
Tableau 1 Variation de l’humidité pour une heure d’irrigation Tempsd’arrosage (mn) 0 30 60 90 120 150 180 210 240 300 Humidité du sol(%) 10,9 15,1 20,6 25,6 19,1 16,1 13,4 12,1 11,7 10,4
Nous avons commencé l’arrosage le 30 Mai. L’humidité initiale dans le sol est en moyenne de 10,6%. Lorsque nous n irrigant pendant une heure avec un débit constant de 0.15l/mn, l’humidité atteint 20,6 et continue d’augmenter pendant 45minutes ; ensuite l’humidité décroit et atteint la valeur initiale deux(2) après, Nous concluons donc que la fréquence d’arrosage peut être trois heure (3). Le tableau suivant montre la croissance et décroissance de l’humidité pour une irrigation d’une heure. La vitesse d’infiltration et de la distribution à l’intérieur de la rhizosphère dépendent des propriétés du sol. [CIMA, InternationnaL/ ANPEIE/ABC ,2005].Dans les mêmes conditions avec le même débit en irrigant au goutte à goutte dés que nous arrêtons l’alimentation, l’humidité restante constante puis décroit. L’objectif de ce travail et de prouver que l’on peut diminuer le temps d’arrosage en irrigant avec le même débit en utilisant la bouteille au lieu du goutteur ce qui permettra une économie d’eau.
Fig. 1 Bouteille en plastique remplie pierre Fig 2. Bouteille enfouie dans le sol, alimentée ponce basaltique et enveloppée de tissu textile par un tuyau et munie d’un goutteur
Bien que préliminaire, cette étude montre indiscutablement une meilleur repartion de l’eau en profondeur, donc une économie de l’eau et par conséquent une réduction du cout énergétique avec l’utilisation de la bouteille. Logiquement ce système peu couteux basé sur l’application fréquente d’un faible volume devrait fournir l’eau à la demande, selon un dosage et une fréquence calculés pour satisfaire en permanence les besoins des plantes tout en évitant le gaspillage, la salinité et l’élévation de la nappe d’eau. Les résultats des expériences identiques en faisant varier le temps et la fréquence qui sont en cours de réalisation, ainsi que leur comparaison avec l’irrigation localisée seront récapitulés lors d’un prochain article.
REFERENCES [CIMA, InternationnaL/ ANPEIE/ABC ,2005] CIMA, InternationnaL/ ANPEIE/ABC (2005): « guide de bonne pratique d’irrigation et de drainage » : Ecologie [Bagochvski 1987] Bagochvski (1987): « Technology of irrigation » [F.A.O, 1995] F.A.O (1995): « petite irrigation dans les régions arides »: (principes et options) [Messahel El Mekki,1994] Messahel El Mekki (1994) : « Méthodes de travail et de calcul pour la détermination de la loi d’infiltration» : Institut génie rural : Université de Blida [Ollier.CH et Poirée.M, 1983 ]Ollier.CH et Poirée.M (1983) : « Irrigation : les réseaux d’irrigation, théorie, technique et économie des arrosages » Edition Eyrolles [Salem Khater, 2009] Salem Khater (2009) : « تطویر أنــظــمــة وشبكات الري » Université de Damas

Hydrology in a Changing World: Environmental and Human Dimensions Poster Proceedings of FRIEND-Water 2014, Montpellier, France, 7-10 October 2014
14
Agriculture and water resources drought: differences FROUKJE DE BOER & HENNY A.J. VAN LANEN Hydrology and Quantitative Water Management Group, Wageningen University, P.O. Box 47, 6700 AA Wageningen, The Netherlands [email protected] BACKGROUND
Drought has a wide range of socio-economic and environmental impacts. It affects many sectors. Impacts on agriculture (crop yields) and on water resources (groundwater, river flow, reservoir storage) belong to the most reported. Although sectors are different, people often assume that drought is a generic phenomenon and no distinction has to be made between different drought types (e.g. meteorological, hydrological drought) when investigating impacts. This is one of the reasons that there is still inconsistency in drought as a natural hazard and its impacts, as recently reported by IPCC SREX (Seneviratne et al., 2012). This study tries to prove that there are differences between agricultural and water resources droughts and aims to quantify the differences across the globe. It investigates if differences depend on climate. For more details, readers are referred to De Boer et al. (2013). APPROACH
Soil water drought was used as a proxy for agricultural drought and water resources drought was derived from hydrological drought, i.e. the drought in groundwater discharge. Time series of daily soil water storage and discharge were simulated with a combined soil water balance model and a conceptual hydrological model for the period 1958-2001 and a large number of cells across the globe representing the Köppen-Geiger climate types (Van Lanen et al., 2013). The model was forced with daily precipitation, temperature and potential evapotranspiration, which were derived from a gridded global dataset (WATCH Forcing Data). The model was applied to several soils and groundwater systems Droughts were derived from the time series by using the threshold approach. It was assumed that a fixed threshold (i.e. critical soil moisture storage) better reflects soil water drought than a variable threshold, which was used to identify drought in discharge (below normal discharge in the wet season is also relevant for water resources). RESULTS
The drought analysis showed that drought in soil moisture lasts longer than in discharge in almost all climate types. Especially the differences in the dry climates (B-climates) and some snow climates (D-climates) are large. Average drought duration of the soil water drought can be ten times larger than the discharge drought for one of the B-climates (Bsk). For some of the snow climates and another B-climate (BSh), it is about five times larger. For most of the equatorial climates (A-climates) and temperate climates (C-climates) a factor of about 2 applies. In Table 1 the ratio of the drought in soil moisture and the drought in discharge is presented for climates common in Europe. For fine-textured soils, the ratio varies between 1.6 and 2.9 for the C-climates. For the same soils, but under colder conditions (D and E-climates), the spread is larger (1.9-6.0). The coarse-textured soils show a different behaviour; the drought in soil moisture are shorter than in discharge, which is characterized by a ratio<1. Difference between climates in Europe are not large. The ratio varies between 0.23 and 0.39 (Table 1).
In addition to the duration, the onset of both drought types was investigated, which required a distinction to be made between the Northern and the Southern Hemisphere. Onsets were expressed as probabilities of occurrence over the year. Different patterns were identified. For example, (i) both drought types have a coinciding pattern in the probabilities, (ii) probability of groundwater discharge drought onset is equally distributed over the year, but the soil moisture drought onset

Hydrology in a Changing World: Environmental and Human Dimensions Poster Proceedings of FRIEND-Water 2014, Montpellier, France, 7-10 October 2014
15
Table 1: Ratio of the average duration of soil moisture drought and duration of discharge drought for European climates and three different soils and an intermediate responding groundwater system
probability shows a peak, and (iii) both drought types have a similar pattern, but the timing of the peak probabilities is different. Köppen-Geiger climate types were assigned to one of these patterns. For example, the humid, warm summer climate Cfb in Europe clearly belongs to pattern ii (Fig. 1). The drought in discharge can start every month of the year, whereas the drought in soil moisture is connected to the summer season and appeared to have a strong peak in June.
Fig. 1 Onset probability distributions of soil moisture drought and discharge drought in the Cfb-climate for the Northern Hemisphere, a light silty loam soil and an intermediate responding groundwater system.
CONCLUSIONS
The study shows that drought characteristics, such as duration or onset, of agricultural drought (soil moisture drought as proxy) are fundamentally different from water resources drought (approached by drought in groundwater discharge). This urges scientists and practitioners providing or using information on the drought hazard or its impacts not to use drought as a generic phenomenon rather to be more precise and to specify which drought is meant. REFERENCES De Boer, F., Van Lanen, H.A.J. & Torfs, P.J.J.F. (2013) Comparison of agricultural and water resources drought characteristics across the world. DROUGHT-R&SPI Technical Report No. 13, Wageningen, www.eu-drought.org/technicalreports/1 (accessed: 12 August 2014). Seneviratne, S.I., Nicholls, N., Easterling, D., Goodess, C.M., Kanae, S., Kossin, J., Luo, Y.,Marengo, J., McInnes, K., Rahimi, M.,
Reichstein, M., Sorteberg, A., Vera, C., and Zhang, X. (2012) Changes in climate extremes and their impacts on the natural physical environment, in: Managing the Risks of Extreme Events and Disasters to Advance Climate Change Adaptation, (ed. by: Field, C.B., Barros, V., Stocker, T.F., Qin, D., Dokken, D.J., Ebi, K.L., Mastrandrea, M.D., Mach, K.J., Plattner, G.-K., Allen, S.K., Tignor, M., and Midgley, P.M.), A Special Report of Working Groups I and II of the Intergovernmental Panel on Climate Change (IPCC), Cambridge University Press, Cambridge, UK, and New York, NY, USA, 109–230.
Van Lanen, H.A.J., Wanders, N., Tallaksen, L.M. & Loon, A.F. van (2013) Hydrological drought across the world: impact of climate and physical catchment structure. Hydrol. Earth Syst. Sci. 17: 1715–1732, doi:10.5194/hess-17-1715
Hydrology in a Changing World: Environmental and Human Dimensions Poster Proceedings of FRIEND-Water 2014, Montpellier, France, 7-10 October 2014
16
Recovery of different drought types JOHAN BOLEIJ1, GEORGE BIER2 & HENNY A.J. VAN LANEN1
1 Hydrology and Quantitative Water Management Group, Wageningen University, P.O. Box 47, 6700 AA Wageningen, The Netherlands [email protected] 2 Soil Physics and Land Management Group, Wageningen University, P.O. Box 47, 6700 AA Wageningen, The Netherlands BACKGROUND
Droughts are a worldwide reoccurring phenomenon with severe socio-economic and environmental impacts. Drought management aims to reduce these detrimental impacts. Usually management focusses on drought development, but attention fades away after the first rains providing relief. However, these first rains might end the meteorological drought, but likely not the soil water drought or the hydrological drought (groundwater and streamflow). Soil water drought, which impacts agricultural and terrestrial ecosystems, and hydrological drought that affects groundwater and surface water resources might recover more slowly. This study aims to investigate the spatio-temporal variability of drought recovery in a detailed catchment study. APPROACH
Drought recovery was studied in depth by developing a transient hydrological model for the Baakse Beek catchment (eastern part of the Netherlands) that combines a soil water balance model and a spatially-distributed saturated groundwater model. Maps of land cover, soils, water-table depth and precipitation stations were overlaid to identify over 100 different recharge types. Daily groundwater recharge was simulated over the period 1965-2010 for these recharge types using the soil water balance model. The time series of simulated recharge were fed into the saturated groundwater model that covered an area of 317 km2. The model had about 16 500 nodes and was subdivided in 30 sub-catchments. The model was calibrated and validated against time series of observed groundwater heads. This comprehensive modeling setup allowed a detailed analysis of drought in simulated soil moisture, in groundwater and streamflow (different drought types). The fixed threshold approach (80th percentile as threshold) was chosen to determine drought frequency, duration and severity. In addition, an areal drought analysis was carried out to obtain the temporal evolution of the area in drought, the catchment-averaged drought duration and the catchment- averaged deficit volume. RESULTS
The areal analysis in the Baakse Beek catchment showed that 94 streamflow droughts (one or more subcatchment in drought) occurred between 1965 and 2010. In the same period 70 groundwater droughts were identified. Some of these drought covered the whole catchment; on average the streamflow and groundwater droughts covered 53% and 44% of the total catchment. The drought deficit averaged over the whole catchment is given in Fig. 1 for the groundwater and streamflow drought. A few severe droughts were selected to study drought recovery. The most extreme event on the record in terms water deficit was the 1976 drought (Fig. 1) that was preceded by a rather dry 1975. Soil moisture drought recovered rather quickly in 1976 because of the rains in the early autumn, although there were differences between the land covers (Fig. 2, top). For example, soil moisture drought on agriculture land ended in September-October 1976, whereas in some areas with coniferous forest the drought recovered not earlier than December 1976 – January 1977.
Groundwater drought (Fig. 2, bottom) at some places recovered very quickly (e.g. near the streams), whereas at other places the drought still existed by the end of the hydrological year (March 1977). This indicates a high spatial variability in the recovery even within a rather small catchment and a large time lag (over 170 days) at some places between recovery of soil moisture and groundwater droughts. In particular areas with deep groundwater tables in between streams recovered slowly.

Hydrology in a Changing World: Environmental and Human Dimensions Poster Proceedings of FRIEND-Water 2014, Montpellier, France, 7-10 October 2014
17
Fig. 1 Catchment average drought deficit for the discharge drought and groundwater drought for the period 1965 – 2010.
Streamflow drought in the sub-catchments ended faster (not shown) than groundwater drought, which is associated with the shallow drainage system that quickly responded to recharge in the early autumn.
Fig. 2 Recovery of the 1976 drought in the Baakse Beek (the Netherlands). Top: development and recovery of the drought in soil moisture for different land uses, Bottom: development and recovery of the drought in groundwater.
CONCLUSIONS
This comprehensive study shows that even in a humid temperate climate, droughts in particular in groundwater still can last long after the first rains stopped the meteorological drought. The groundwater drought may continue in the next summer leading to a multiple year drought. The risk at slower drought recovery is even higher in dryer climates with a larger climate variability or in areas with deep groundwater tables which face large storage differences.

Hydrology in a Changing World: Environmental and Human Dimensions Poster Proceedings of FRIEND-Water 2014, Montpellier, France, 7-10 October 2014
18
The analysis of the spatial and temporal changes in the low flow characteristics of the Volga Basin Rivers in a changing climate
BOLGOV M.V., FILIPPOVA I.A., TRUBETSKOVA M.D. Water Problems Institute, Russian Academy of Sciences, Gubkina str., 3, GSP-1, 119333, Moscow, Russian Federation
[email protected] INTRODUCTION The uncertainty existing in the forecasting of both future climate conditions and watersheds characteristics makes the description of the runoff formation regularities in a changing climate especially actual for the regions significant for water economy. Volga is the largest river of the European Russia, its water resources being of great importance.
DATA The time-series of 30-days minimal runoff values for the winter period with the length of more than 50 years for the 122 rivers with a catchment area of 1,000 to 25,000 km ², as well as the observation data from 88 meteorological stations in the basin of the Volga River were used. The data cover observations until 2010.
RESULTS AND DISCUSSION
Non-stationarity of the runoff time-series
One of the main effects of climate instability is the violation of the runoff stationarity. The analysis of the difference-integral curves of the minimal winter runoff time series showed that all the investigated time-series can be divided into two periods: one with the lower water volume and the other one (contemporary) with the higher one. The date of stationarity violation is not the same for all the Volga basin rivers. This means that watersheds give response to changes in runoff formatting characteristics not simultaneously. Most of the dates of stationarity violation are found to be near either 1978 or 1985 (Fig.1).These two years were accepted as the date of division of the time-series into two tentatively-stationary periods.
Fig. 1 The dates of stationarity violation in minimal winter runoff time-series for the Volga basin We analyzed the minimal runoff time-series by different tests (such as Student’s, Fisher’s,
Dixon’s and Smirnov-Grabbs’ ones). Most of the time-series appeared to be non-stationary according to both average value and dispersion relative to the chosen partition date. All the time-series were divided into two parts: before and after that date, each of the parts being considered as a stationary one. The runoff parameters for these two periods were compared.
Fig.2 demonstrates the changes in the average minimal winter runoff on the Volga basin after the partition date. Throughout all the territory under investigation the increase of winter minimal runoff takes place, the most intensive growth being observed in the southern parts of the basin.

Hydrology in a Changing World: Environmental and Human Dimensions Poster Proceedings of FRIEND-Water 2014, Montpellier, France, 7-10 October 2014
19
Fig.2 The growth of the minimal winter runoff in the Volga basin. К is the relation of the average minimal runoff after the partition date (1978 or 1985) to that of the previous tentatively-stationary period
The dependence of the minimal runoff on the climatic changes
Changes in climatic factors influencing minimal runoff were analyzed. Autumn precipitation is the main source of river water during the winter low flow period. We found no significant changes in autumn precipitation (September – November) for the period from 1966 to 2011 on the Volga basin territory.
The main feature of the modern climate is temperature growth, mostly in winter period. For the Volga basin, this increase is most intensive in its western and central parts. Temperature growth causes: a) greater liquid portion of winter precipitation; b) more thaws; c) higher level of the underground waters. All this contribute to an increase of winter runoff.
Fig. 3 demonstrates the relationship between winter minimal runoff changes and the increment of winter air temperature for the selected tentatively-stationary periods. In general, we can assume the dependence to have a linear character.
Fig.3 The relationship between winter minimal runoff changes (K) and the increment of winter air temperature ∆t for the selected tentatively-stationary periods
On this basis, we decided to use winter air temperature averaged for the period from December to March as the main predictor in the hydrological forecasts of winter runoff characteristics.
CONCLUSIONS
The character of the minimal runoff fluctuations in the conditions of the changing climate can be considered as the tentatively-stationary periods change.
The analysis of the changes in hydrological and climatic characteristics occurred in the Volga basin during the latest decades leads to the conclusion that climate is the main purpose of the stationarity violation of the minimal runoff. Leading climatic factor of such changes is the increase in winter air temperatures, which allows using the average air temperature for the period from December to March.as a major predictor of hydrological characteristics for the winter flow calculations.
Acknowledgements The study is supported by the Russian foundation for basic research (project no. 12-05-01034).

Hydrology in a Changing World: Environmental and Human Dimensions Poster Proceedings of FRIEND-Water 2014, Montpellier, France, 7-10 October 2014
20
Bayesian decision for runoff evaluation in non-stationary conditions
BOLGOV MIKHAIL, KOROBKINA ELENA & FILIPPOVA IRINA Water Problems Institute, Russian Academy of Sciences, 119333, Moscow, Gubkin str., 3, IWP RAN [email protected] The substantial changes caused by climate variations are observed in the hydrological regime of rivers of Russian Federation as well in the Europe. Beginning from the 70th the significant growth of discharges of low flow period is noted. Hydrological time series become non-stationary. Application of Bayesian methods provides a possibility to obtain forecast for non-stationary case when the essentially different behaviour of river runoff process is predicted and the forecast is characterized by high uncertainty. Frequency distribution of runoff values is characterized, as a rule, by positive asymmetry that is why two-or three-parametrical Gamma-distribution for approximation of observed hydrological values is used. We shall limit our investigation to three-parametrical Log Pearson Type 3 distribution
),,,,( mbxP , where ,,, mb – parameters of distribution. Forecasting frequency distribution of probabilities of river runoff proposed to construct on the base of the formula of total probability. In this case forecasting frequency is estimated as follows:
dxpmbyPy )/(),,,,()( , (1)
where )/( xp – a posteriori frequency distribution of parameter . As a result of numerical integration (1) we shall obtain Bayesian forecasting frequency distribution of probabilities of investigated runoff characteristics. In our case three states of the runoff stochastic process are available (before and after beginning of 70th, and for period of forecast) and we can assume only, that the system can be in one of them with probabilities either Nn /1 or Nn /2 or Nn /3 . Here 321 nnnN , where N is the total number of events (the length of studied time series of river runoff and period of forecast). Concerning future fluctuations of river runoff we also only can approve, that with corresponding probabilities the system can be in one of two states. In this case it is possible to assume, that a posteriori distribution of the parameter is a combination of two distributions
)/(),(),()/( 33
22
11 xp
N
nx
N
nx
N
nxp (2)
where ),( xi – sample distribution of average value (average of distribution) for the i-st homogeneous
period with weight in , )/(3 xp – a posterior distribution of the parameter for the climate scenario. This approach was applied to the low flows prediction in the Volga river basin. Beginning 1979 a new relatively homogeneous period in flow regime of the rivers of Volga’s basin is observed. This period is characterized by rising runoff during both winter low flow and summer low flow periods. Analyse of the meteorological data showed significant increasing of winter temperature over Volga river basin. This fact allows us to consider climate change as predictor of minimal flow change in winter period. Changes of minimal runoff can be evaluated by coefficient K which is ratio of average annual 30-day minimal runoff for the period after 1979 to the same characteristic for the period before 1979. Spatial variation of coefficient K for the winter low flow period is demonstrated in fig.1 for the Volga river basin.

Hydrology in a Changing World: Environmental and Human Dimensions Poster Proceedings of FRIEND-Water 2014, Montpellier, France, 7-10 October 2014
21
Fig.1 Spatial variation of the coefficient K for the winter low flow period (Volga river basin). Forecasting cumulative distribution function of minimal 30-day runoff determined by numerical integration of equation (1) presented in figure 2 (curve 4). For comparison there are also presented cumulative distribution for two quasi-stationary periods (curve 1 and curve 2) and bayesian solution of equation (1) taking into account two first components in (2) only (curve 3).
Fig.2 Probabilistic forecast of the winter low flow under condition of climate change. As conclusion we recommend for practical application using Bayesian solution to predict runoff for non-stationary hydrological regime caused by climate change.
0.001 0.01 0.1 0.5 2 10 30 50 70 90 98 99.5 99.9 99.99
P, %
0
10
20
30
Q, ì 3/ñ
1
3
2
4

Hydrology in a Changing World: Environmental and Human Dimensions Poster Proceedings of FRIEND-Water 2014, Montpellier, France, 7-10 October 2014
22
Estimation et modélisation des transports solides en suspension dans l’Oued Boumessaoud (Tafna-NW algérien)
BOUANANI ABDERRAZAK, BOUGUERRA SID AHMED & BABA-HAMED KAMILA Laboratoire n°25, Université de Tlemcen, BP 119, 13000, Tlemcen Algérie [email protected] Résumé: L’objectif de cette contribution est la quantification spatio-temporelle des apports solides en suspension qui transitent le long de l’oued Boumessaoud. Cette étude a été entamée par une analyse détaillée de série de débits liquides et solides sur une durée de 20 ans. On s’est intéressé à établir un modèle statistique basé sur l’analyse de la variabilité de la charge en suspension par rapport aux fluctuations des débits d’écoulement suivant des échelles de temps différentes en particulier lors des événements de crues. Mots clés Érosion hydrique, transport solide, bassin versant, quantification, modèle statistique, débit liquide, débit solide, oued Boumessaoud, Algérie. Abstract The aim of this contribution is the spatio-temporal quantification of suspended sediment load that passes along the River Boumessaoud. This study was initiated by a series of detailed analysis of water and sediment discharges over a period of 20 years. We are interested to establish a statistical model based on an analysis of the variability of the suspended load compared to changes in flow rates according to different time especially during flood events. Key words water erosion, sediment transport, watershed, quantification, statistical model, fluid flow, solid flow, River Boumessaoud, Algeria.
DONNEES ET METHODES Le bassin de l’oued Boumessaoud fait partie du grand bassin versant de la Tafna qui s’étend au nord-ouest de l’Algérie. Géologiquement le bassin est occupé au sud et au centre par des formations carbonatés du Jurassiques (dolomies de Tlemcen, calcaires bleus et marnes et calcaires à Ptérocères), au Nord, une dépression remplie de sédiments tertiaires et quaternaires, forme le plateau de Zenata. Le bassin d’oued Bou Messaoud est caractérisé par un climat méditerranéen semi-aride où la moyenne des précipitations annuelles pour la période (73/10) est de (501.6 mm) avec un maximum de (813.5 mm) enregistré en 1973 à la station de Tlemcen. Le bassin d’oued Boumessaoud draine en moyenne 0.268 m3/s. Présentation des données L’étude est basée sur les valeurs instantanées des débits liquides (QL en m3/s), et des concentrations en matières en suspension (C en g/L), mesurés à la station d’Henaya (code ANRH 160509) située aux coordonnées Lambert (X= 125,5 km et Y= 188,1km) sur la carte au 1/50000 de Tlemcen à 10km de l’exutoire du bassin durant la période allant de septembre 1988 à août 2005. Modélisation Pour déterminer la relation débit solide – débit liquide, une approche à différentes échelles temporelles (instantanée et saisonnière), basée sur les modèles de régression Qs = a Ql
b (Cambell et al. (1940), Crawford (1991) , est adoptée. RESULTATS ET DISSCUSSIONS
Erosion et transport solide : La dégradation spécifique estimée pour le bassin contrôlé par la station de Jaugeage d’Henaya a été de 518.2 t/km2/an. A l’échelle saisonnière, les contributions enregistrées ont données (31%) pour l’automne, (25%) pour l’hiver et (43%) pour le printemps. A l’échelle événementielle, on montre que les crues représentent en moyenne 10% du temps annuel. Elles contribuent à 57% en apport en eau sur un apport annuel moyen estimé à 7.95 millions de m3. Alors que le flux des matières solides transportées en suspension par ces dernières constitue en moyenne la quasi-totalité, soit 90% du flux moyen annuel évalué à 23851 tonnes.

Hydrology in a Changing World: Environmental and Human Dimensions Poster Proceedings of FRIEND-Water 2014, Montpellier, France, 7-10 October 2014
23
EVOLUTION DES DEBITS SOLIDES EN FONCTION DES DEBITS LIQUIDES
Analyse des débits instantanés On trouve (figure 6) une bonne relation en puissance [Qs = 1.59QL 1.64]. On notera que les valeurs de l’exposant b, de nos modèles sont proches de celles trouvées par bon nombre de chercheurs ayant travaillé dans des régions semi-arides Bouanani & al. 2013.
Fig. 6 Relations entre les débits liquides et solides instantanés de l’oued Boumessaoud
Analyse saisonnière A l’échelle saisonnière (tableau 3), on observe un affaiblissement considérable du transport solide pendant l’été due simplement à l’absence de l’écoulement. Le paramètre (a) semble être le plus élevé en Automne, ceci peut expliquer l’importance de la dynamique érosive en cette saison. L’exposant (b) s’élève en Hiver par rapport aux autres saisons. Tableau 3 Paramètres du modèle saisonnier (Qs-QL) au niveau du bassin oued Boumessaoud
Station Henaya N a b R² modèle
Automne 263 2.95 1.62 0.84 Qs=2.95QL1.62
Hiver 547 1.60 1.72 0.83 Qs=1.60QL1.72
Printemps 469 1.27 1.57 0.85 Qs=1.27QL1.57
Eté 81 0.82 0.77 0.65 Qs=0.615QL0.77
a et b: paramètre du modèle en puissance; R2: coefficient de corrélation ; N: taille de
l’échantillon.
REFERENCES
Bouanani A., Baba-Hamed K., Fandi W. 2013. Production et transport des sédiments en suspension dans l’oued Sikkak (Tafna – Nord-Ouest Algérie). Revue des Sciences de l’Eau 26(2) (2013) 119-132. Campbell F.B. & Bauder H.A., 1940. A rating curve method for determining silt-discharge of streams, EOS Trans. Am. Geophys. Union, No21, 603─607 Crawford C.G. (1991). Estimation of suspended –sediment rating curves and mean suspended-sediment load. Journal of hydrology, 129, 331-348.

Hydrology in a Changing World: Environmental and Human Dimensions Poster Proceedings of FRIEND-Water 2014, Montpellier, France, 7-10 October 2014
24
Mekong-HYCOS, an improvement of monitoring the Mekong River
JP BRICQUET1 & S. KHEM2, F. SEEBACHER2, E. JENSEN2 1 IRD - HydroSciences Montpellier, IRD France Sud, 911 avenue Agropolis, B.P. 64501, 34394 MONTPELLIER Cedex 5, FRANCE [email protected] 2 Mekong River Commission, Information & Knowledege Management Programme, TSD, Office of Secretariat in Phnom Penh, 576 National Road #2, Chak Angre Krom, P.O. Box 623, Phnom Penh, CAMBODIA THE MEKONG-HYCOS PROJECT
Under the supervision of the World Meteorological Organization, the project was implemented between 2007 and 2012. One of the objectives was to establish a well-functioning, reliable and accurate real time hydro-meteorological data collection and transmission system at basin level. 51 hydrological stations along the main stream and major tributaries were rehabilitated with modern equipment and automatic transmission (see Fig. 1).
Fig. 1 Map of the Mekong-HYCOS monitoring network
Data are sent automatically every 15 minutes and concentrated into the FTP of MRCS, in Phnom Penh (see Fig. 2).
Fig. 2 Data flow of the Mekong-HYCOS program
Through various processes of quality control and quality assurance (see Fig. 3), the data are the stored in the Master Catalogue of MRCS and made available through the Portal of MRCS.

Hydrology in a Changing World: Environmental and Human Dimensions Poster Proceedings of FRIEND-Water 2014, Montpellier, France, 7-10 October 2014
25
Fig. 3 QC/QA data processing chart
In parallel to these processes, a simple Hydrological Information System was implemented to display the near real time values collected in the field. All stations are posted in this HIS available at http:\\monitoring.mrcmekong.org (see Fig. 4).
Fig. 4 Main page of monitoring.mrcmekong.org
For each station values of the rainfall and water level are presented for the last 24 hours and for the last 30 days. When the information is available, the flood level and warning level are also presented (see Fig. 5).
Fig.5 Specific page of Can Tho station (Vietnam)
This type of Information System, not directly connected to a data base, is extremely useful because it provides basic information, very often sufficient for local actions; it is relatively simple to implement and it contributes to a good management of a measuring network.

Hydrology in a Changing World: Environmental and Human Dimensions Poster Proceedings of FRIEND-Water 2014, Montpellier, France, 7-10 October 2014
26
Apport de la géochimie et des isotopes dans l'étude de nappes de vallée andine en zone anthropisée: vallée d'Aburrá - Medellin
(Colombie)
A.K. CAMPILLO1,2, J.D. TAUPIN1, N. PATRIS1, T. BETANCUR3 1 Hydrosciences UMR (IRD, UM1, UL2, CNRS), Maison des Sciences de l’Eau, 300 avenue Jeanbrau, 34000, Montpellier, France. [email protected] 2 IDEAM, Carrera 10 No. 20-30 Bogota, Colombie 3 GIGA, Universidad de Antioquia. Calle 67, # 53-108 Medellín-Colombie. INTRODUCTION La determination de l'origine et des processus de recharge d'un aquifère est un élément important dans la gestion de la ressource, surtout en zone urbanisée où la modification des sols entraîne des conséquences sur l'infiltration directe et sur la qualité des eaux. Ces aquifères peuvent bénéficier aussi d'une recharge artificielle liée aux fuites des réseaux d'adduction d'eau potable ou usées pouvant occasioner dans ce cas une altération chimique des eaux souterraines, ou d'une recharge naturelle à partir de rivière traversant la zone urbaine. L'étude hydrochimique et isotopique (18O y 2H) de l'hydrosystème permet de mettre en évidence de tels processus. ZONE D'ETUDE L'étude se situe au niveau de la zone urbaine de Medellin (1500 m d'altitude) dans la Vallée de Aburrá (département d'Antioquia-Colombie, 6°02'31.50'' - 6°28'39.64'' N et 75°19'29.79''-75°40'51.45'' W), traversé par le río Medellín. La précipitation (moyenne annuelle 1500 mm à Medellin) a un comportement bimodal en relation avec le passage de la ZCIT, avec deux époques pluvieuses (avril-juin, septembre-novembre) et deux époques relativement sèches (décembre-mars, juin-août). La température mensuelle durant l'année fluctue entre 16 et 29°C. Les aquifères étudiés sont composés de dépôts récents de pente et de dépôt alluviaux datés du fin du Terciaire à l'Holocène, reposant sur un substratum rocheux et métamorphique (AMVA, 2011). L'aquifère de vallée (A) est libre et est présent dans toute la zone d'étude avec une perméabilité entre 0.02-53.89 m/s. Au sud de la zone, SW de Medellín jusqu'à Sabaneta, l'aquifère est séparé en 2, A1 (libre) et A2 (semi captif), par une couche, B1, de perméabilité très faible. L'aquifère de pente, A3 (libre), s'étage jusqu' à 2000 m d'altitude et est en contact géologique avec l'aquifère de vallée. Enfin les saprolites des roches dures et fissurées constituent un dernier réservoir aquifère libre, dénommé C, non étudié ici (Fig. 1).
Fig 1 Distribution des aquifères de la Valle de Aburrá. Fig 2 Faciès chimiques des eaux de nappes A1 et A3.

Hydrology in a Changing World: Environmental and Human Dimensions Poster Proceedings of FRIEND-Water 2014, Montpellier, France, 7-10 October 2014
27
RESULTATS GEOCHIMIQUES En novembre 2010, 49 puits artisanaux et 3 forages, et en mars 2011, 29 puits artisanaux et 1 forage, ont été analysés. 3 faciès ont été déterminés: bicarbonaté calcique magnésique et sodique (83%-novembre et 93%-mars), chloruré sodique (15% et 7%) et bicarbonaté sulfaté calcique (2% en novembre). Les minéraux des formations géologiques environnantes expliquent la prédominance dans les eaux de HCO3
-, Ca2+, Mg2+, et en moindre importance, Na+. Les autres ions qui peuvent être
prépondérants (NO3-, Cl-) ou des eaux qui montrent de fortes conductivités (> à 400 µs/cm) sont le
résultat de contamination provenant des activités industrielles, domestiques, du río Medellín quand il recharge la nappe et/ou par l'infiltration des eaux résiduelles à partir du réseau d'eaux usées souterrain. Cette étude montre que près de la moitié des points d'eaux est affectée par un processus de contamination concernant principalement la nappe alluviale.
RESULTATS ISOTOPIQUES Un réseau mensuel de 5 stations de mesure isotopique des pluies, localisé entre 1500 et 2600 m d'altitude, a été mis en place en mars 2011, afin de déterminer le gradient isotopique pour définir les zone de recharge possible des eaux de nappes. De même le río Medellín, les lacs d'altitudes -entre 2100 et 2400 m-, La Fé, Piedras Blancas et Río Grande, alimentant le réseau d'eau potable de Medellín ainsi que les stations de traitement réceptionnant les eaux des lacs à Medellín ont été analysés mensuellement. Parallèlement, 29 analyses d'eaux souterraines ont été effectuées en mars 2011.
La précipitation présente une variation en 18O de -2,93 à -18,88‰ (vs VSMOW) (-13,0 y -139,6‰ en 2H vs VSMOW) en relation avec les deux passages de la ZCIT (effet de masse). L'effet altitudinal se caractérise par un gradient de 0,1‰ et la ligne météorique locale reste très proche de la droite météorique mondiale de pente 8 et d'intercepte 10. La composition isotopique des lacs d'altitude, varie entre -10,83 et -12,58‰ (18O) et entre -79,2 y -90,6‰ (2H), sur le même mode, mais atténué, que le signal isotopique des précipitations, on ne note aucune variation des teneurs entre lac et station de traitement. De même la composition isotopique mensuelle du río Medellín est entre -10,66 y -12,26‰ (18O) et -76,4 et -88,2‰ (2H) suivant également la variabilité du signal de la pluie.
Les eaux souterraines présentent des teneurs entre -8,36 y -13,30 ‰ (18O- moyenne -10,16‰) et entre -58,8 y -90,0‰ (2H- moyenne -73,1‰), sans grandes différences entre la nappe alluviale et celle de pente, mais il est à noter que les teneurs les plus appauvries se trouvent près du río Medellín ce qui permet de penser à une recharge de la nappe alluviale à partir du fleuve, du moins pendant les périodes de crues
En accord avec le gradient isotopique altitudinal et les teneurs isotopiques des eaux souterraines la recharge se ferait principalement entre 1450 et 1900 m dans la vallée comme sur les pentes. Aucune recharge conséquente ponctuellement à partir du réseau d'eau potable en provenance des lacs d'altitude n'a pu être mis en évidence.
CONCLUSIONS ET PERSPECTIVES L'aquifère alluvial de la Vallée d'Aburrá est affecté fortement par une contamination d'origines diverses, l'utilisation en complément de Br- permettrait une meilleure identification des sources de contamination (Katz et al., 2011). Les isotopes stables de l'eau ont permis de mettre en évidence les zones de recharge potentielle du système aquifère local situées entre 1450 et 1900 m d'altitude. Les teneurs plus négatives près du río Medellín indiquent une recharge de l'aquifère à partir du fleuve alimentait par les rivières d'altitude. Par contre la méthode isotopique n'a pas permis d'identifier une recharge possible à partir de fuite sur le réseau souterrain d'eau potable alimenté par les lacs d'altitude. En complément, pour estimer le temps de résidence des eaux des nappes quelques mesures de carbone 14 et CFC seraient nécessaires. REFERENCES Área Metropolitana del Valle de Aburrá (2011). Red de Monitoreo Ambiental en la Cuenca Hidrográfica del Río Aburrá en Jurisdicción
del Área Metropolitana-Fase III. Medellín. Katz, B., Eberts, S. & Kauffman, L. (2011). Using Cl/Br ratios and other indicators to assess potential impacts on groundwater quality
from septic systems: A review and examples from principal aquifers in the United States. Journal of Hydrology 397, 151-166.

Hydrology in a Changing World: Environmental and Human Dimensions Poster Proceedings of FRIEND-Water 2014, Montpellier, France, 7-10 October 2014
28
Understanding climate changes in Southern Italy using the rainfall erosivity factor of the USLE
ANTONINA CAPRA, VANESSA COGLIANDRO, DANIELE FOSCO, CARMELO LA SPADA & PAOLO PORTO Dipartimento di Agraria, Università degli Studi Mediterranea, Località Feo di Vito, Reggio Calabria, Italy [email protected] INTRODUCTION
In the last decades, significant climate changes have been observed in many countries of the world. These changes that concern mainly temperature and rainfall trends are really important in hydrological studies because they strongly affect streamflow records and sediment mobilization in catchments and river basins (Vandenberghe & Maddy, 2001). Recent studies carried out in Calabria (Southern Italy) and involving the analyses of long-term rainfall series documented a general decrease of the annual precipitation over this area (Capra & Scicolone, 2012; Capra et al., 2013). However, a more accurate inspection of rainfall records having very short duration suggests an opposite trend for rainfall intensity and requires further attention. In this paper, the temporal variability of different rainfall erosivity indices (R) has been investigated for 7 rainfall stations located in Calabria region (Southern Italy) and covering the period from 1925 to 2011. METHODS
Data were derived from the time series recorded by the Italian Hydrographic Service at seven raingauge stations selected on the basis of data set continuity, geographic and altitude (ranging between 15 and 1322 m a.s.l.) representativeness. The analysis has been carried out using both the values of the annual rainfall erosivity factor RW-M, calculated using the direct procedure suggested by Wischmeier and Smith (1978), the values of F (equation 1) based on the method proposed by Arnoldous (Arnoldous, 1980), and some regional models that requires monthly records (equation 2, space-invariant, and 3, space-dependent) (Capra et al., 2012):
12
1
2
P
PF i (1)
123.12865.4 FRFr (2)
lFR lFs (3)
where Pi = total precipitation of the month i (mm); P = annual precipitation (mm); and = coefficients estimated for each raingauge station l.
The trends of measured rainfall values having short duration and high intensity (1, 3, 6, 12, and 24 hours) were also checked and compared with the formers. All the series have been analysed for evidence of trend using both the non-parametric Mann-Kendall and the t-test on the correlation coefficients of the linear trends (Hirsch et al., 1993). Elaborations were performed using the software TREND (2012).
RESULTS AND CONCLUSIONS
Due to the lack of long series of data on rainfall intensity, the analysis of the temporal variability of rainfall erosivity is often based, in literature, on indirect approaches using standard precipitation variables (D’Asaro et al., 2007). The results of the research showed the existence of different trends, in many cases even of opposite direction, in the series of the different indices tested (example in Fig. 1). In particular, while the direct RW-M index showed increasing trend in most of the analyzed stations, those estimated with indirect procedures and precipitation of short duration showed positive trends in about half (F index) or more of

Hydrology in a Changing World: Environmental and Human Dimensions Poster Proceedings of FRIEND-Water 2014, Montpellier, France, 7-10 October 2014
29
the stations. This discrepancy is due to the already known decrease in monthly and short duration (equal to or greater than 1 h) precipitation in the area considered. The increasing trend of the index RW-M, with an expected overall increase of erosivity in Calabria, may be due to an increase, over time, of the energy of the very short duration precipitation (less than one hour).
Fig. 1 Percentage of raingauges showing increasing and decreasing trends in the erosivity indices (RW-M= Wischmeier & Smith; F= Fournier index modified by Arnoldous; RFr = space-invariant regional model, eq. 2; RFs = space-dependent regional models, eq. 3) and in short duration (1, 3, 6, 12 and 24 hours) and high intensity precipitation (P1, P3, P6, P12, P24) according to the non-parametric Mann-Kendall test. Furthermore, the results highlighted the importance to estimate erosivity index (R) using the direct method (RW-S). Estimates through indirect procedures dependent on precipitation at different time scales may in fact supply results not always in line with the actual variability of the erosivity. The results of the analysis confirmed, ultimately, that climate change can affect soil erosion. Some aspects of temporal variability of less than an hour duration precipitation should be deepened. REFERENCES Arnoldous, H.M.J. (1980) An approximation of the rainfall factor in the universal soil loss equation. In: Assessment of Erosion, 127-
132. J. Wiley. Capra, A. & Scicolone, B. (2012) Spatiotemporal variability of drought on a short-medium time scale in the Calabria region (Southern
Italy). Theoretical and applied Climatology 110 (3), 471-488. Capra, A., Porto, P.,& La Spada, C. (2012). Variabilità temporale dell’indice R di aggressività della pioggia in Calabria (Temporal
variability of the rainfall erosivity factor R in Calabria), in Italian, Quaderni di Idronomia Montana 30, 253-262, ISBN 978-88-97181-19-4
Capra, A., Consoli, S. & Scicolone, B. (2013) Long-term climatic variability in Calabria and effects on drought and agrometeorological parameters, Water Resour. Management 27 (2), 601-617.
D’Asaro, F., D’Agostino, L. & Bagarello, V. (2007) Assessing changes in rainfall erosivity in Sicily during the twentieth century, Hydrological Processes 21, 2862-2871.
Hirsch, R.M., Helsel, D.R., Cohn, T.A. & Gilroy, E.J. (1992) Statistical analysis of hydrologic data, In: Handbook of Hydrology (ed. by Maidment, D.R.), 17.1-17.55. McGraw-Hill.
TREND, Available from: http://toolkit.ewater.com.au/Tools/TREND (June 2012).
Vandenberghe, J. & Maddy, D. (2001) The response of river systems to climate change. Quaternary International 79, 1–3.
Wischmeier, W.H. & Smith D.D. (1978) Predicting Rainfall Erosion Losses: a Guide to Conservation Planning. USDA, Agriculture Handbook, 537 , Government Printing Office, Washington, DC
020406080100
Percentage
of
raingauges
(%)
RW‐M F
RFrRFs P1 P3 P6 P1
2P24
Indices
Increasing Decreasing

Hydrology in a Changing World: Environmental and Human Dimensions Poster Proceedings of FRIEND-Water 2014, Montpellier, France, 7-10 October 2014
30
Using spot gauging data to estimate the annual minimum monthly flow with a return period of 5 years in France
CLOTAIRE CATALOGNE1,2, ERIC SAUQUET1 & MICHEL LANG1 1 Irstea, Hydrology-Hydraulics Research Unit, 5 rue de la Doua, CS70077, 69626 Villeurbanne cedex, France [email protected] 2 Irstea, Freshwater Systems, Ecology and Pollution Research Unit, 5 rue de la Doua, CS70077, 69626 Villeurbanne cedex, France INTRODUCTION
The annual minimum monthly flow with a return period of 5 years (i.e with an exceedance probability of 0.80), named thereafter QMNA5, is one of the most important descriptors of low flow regime in France. Indeed QMNA5 is officially a reference threshold mentioned in the regulations on water management to limit abstractions in rivers. QMNA5 is also frequently considered by default as “environmental flow” to meet ecological objectives. At ungauged locations, reliable estimations are therefore required for water management issues and, despite recent improvements in regionalisation methods, providing accurate low flow quantiles is still not an easy task (Laaha et al., 2013). An alternative method that uses spot gauging data as complement to the more traditional regionalisation methods is presented here (Catalogne 2012; Catalogne et al., 2013). The proposed developments are in line with previous works achieved in France (Oberlin et al., 1973; Chopart and Sauquet, 2008) and the baseflow correlation method applied in the United States (Stedinger and Thomas, 1985; Reilly and Kroll, 2003; Zhang and Kroll, 2007). DATA
The dataset used for this study consists of 632 gauging stations obtained from the French database HYDRO. The selected time series have both no significant human influence on flow and high quality of measurements. A constraint of record availability (more than 26 years during the period 1970–2005) is imposed to ensure reliable statistics computation at each gauged site. The Gamma distribution was fitted to the samples of annual minimum monthly flow to derive thereafter the QMNA5 values. METHOD
A specific framework was used to assess by cross-validation on simulated data the performances of a correlation model for QMNA5 prediction at ungauged sites. It is established by Monte Carlo simulation using the 632 gauging stations considered one-by-one as a poorly gauged location. Simulated gauging dates were randomly selected in the time series during low flow period, which is assumed to correspond to the months with the three lowest mean monthly discharges. A minimum of 15 days between two consecutive dates is imposed to ensure near independence between selected values. The following framework was finally adopted: - The estimate for QMNA5pg at the poorly gauged location is derived from the value of QMNA5ref
observed at one reference nearby site with both extended time series and high quality records. The relation between QMNA5pg and QMNA5ref is supposed to be valid for N concomitant observed discharges at the two sites, qpg(t) and qref(t), t=1, …, N (Fig. 1(a)). Several empirical formulations were tested and the power law relationship obtained by linear regression fitted to the logarithm of qpg(t) and qref(t), t=1, …, N was finally selected:
krefpg QMNAQMNA 55
(1) - A large set of 50 nearby gauged stations in terms of distance to the poorly gauged site is pre-selected.
The reference station is the one among these 50 sites with the highest correlation coefficient r between qpg(t) and qref(t), t=1, …, N.
- The differences between the observed QMNA5 value derived from the whole time series and QMNA5pg expressed in l/s/km² are used in the uncertainty analysis to quantify the bias.

Hydrology in a Changing World: Environmental and Human Dimensions Poster Proceedings of FRIEND-Water 2014, Montpellier, France, 7-10 October 2014
31
RESULTS
The simulation of poorly gauged conditions allows to assess the sensitivity of the data collection strategy and to derive bias and standard error models - µ and , respectively - as functions of the correlation coefficient r, the total number N and the frequency F of spot gauging data during the low flow period (Fig. 1(b)):
)()(),,( FFFNr rµ (2)
)()()(),,( )1()ln( FFFFNr crbNa (3)
where a, b, c, and are parameters to be fitted for each frequency F. Assuming Gaussian distribution for the estimation error, confidence intervals on estimated QMNA5pg are fully described by the two parameters µ and for any combination of F, N and r. The results show that: 1/ Increasing the number of spot gauging data N leads to a significant increase in reliability until approximately 20 gauging data; 2/ For a given number of measurements N, gauging more than three times a year is not an effective strategy probably because of the intra-annual correlation between sampled records; 3/ The method is able to handle with other low flow statistics; 4/ Using spot gauging data may yield more accurate predictions of QMNA5 than interpolation methods particularly in heterogeneous and complex areas.
(a) (b) Fig. 1 (a) Principles of the method using spot gauging data. (b) Standard deviation as function of the correlation coefficient r and the total number of spot gauging data N for two frequencies of measurement F. REFERENCES Catalogne C. (2012). Amélioration des méthodes de prédétermination des débits de référence d'étiage en sites peu ou pas jaugés. Thèse
Univ. Grenoble, Irstea Lyon, 243 p. Catalogne C., Sauquet E., Lang M. (2013). Valorisation des données de jaugeages épisodiques pour l’estimation du débit de référence
d’étiage QMNA5. La Houille Blanche. Submitted Chopart S., Sauquet E. (2008). Usage des jaugeages volants en régionalisation des débits d’étiage. Revue des Sciences de l’Eau, 21(3):
267-281. Laaha G. et al. (2013). Prediction of low flows in ungauged basins. In « Runoff Prediction in Ungauged Basins - Synthesis across
Processes, Places and Scales », (Blöschl G., Sivapalan M., Wagener T., Viglione A. & Savenije H., eds.), Chap 8., 163-188, Cambridge University Press, Cambridge, UK.
Oberlin G. et al. (1973). Intérêt des jaugeages épisodiques pour l’estimation des étiages de petits bassins non équipés. Cahiers de l’ORSTOM, sér. Hydrol., X(4) : 349-368.
Reilly C.F., Kroll C.N. (2003). Estimation of low streamflow statistics using baseflow correlation. Water Resour. Res., 39(9), 1236, doi:10.1029/2002WR001740, 2003.
Stedinger J.R., Thomas W.O. (1985). Low-flow frequency estimation using base-flow measurements. USGS Scientific Investigations, Report 85-95.
Zhang Z., Kroll C. (2007). The baseflow correlation method with multiple gauged sites. Journal of Hydrology, 347 : 371-380.
F = 1
0.4 0.5 0.6 0.7 0.8 0.9 1.00
.00
.51
.01
.5Correlation r
(l/
s/km
²)
N = 4
N = 8
N = 16
SimulatedFitted equation (3)
F = 1
0.4 0.5 0.6 0.7 0.8 0.9 1.00
.00
.51
.01
.5Correlation r
(l/
s/km
²)
N = 4
N = 8
N = 16
SimulatedFitted equation (3)
F = 4
0.4 0.5 0.6 0.7 0.8 0.9 1.0
0.0
0.5
1.0
1.5
Correlation r
N = 8
N = 16N = 32N = 64
Simulated Fitted equation (3)
(l/
s/km
²)
F = 4
0.4 0.5 0.6 0.7 0.8 0.9 1.0
0.0
0.5
1.0
1.5
Correlation r
N = 8
N = 16N = 32N = 64
Simulated Fitted equation (3)
(l/
s/km
²)

Hydrology in a Changing World: Environmental and Human Dimensions Poster Proceedings of FRIEND-Water 2014, Montpellier, France, 7-10 October 2014
32
Assessment of annual and monthly rainfall in semi-arid region within the climatic change context (study case: Serrat basin,
central Tunisia)
SAMEH CHARGUI1,2, HANA GHARBI2 ,MOUHAMED ABIDI2, AMMAR MLAYAH1, FETHI LACHAAL1, SAMIA KHADHAR1& MOHAMED. SLIMANI2 1Georesources Laboratory, Water Research and Technology Centre, Borj Cedria Ecopark, PO Box 273 Soliman 8020, Tunisia [email protected] 2Water Sciences and Technique Laboratory, National Agronomic Institute of Tunisia. 43 Avenue Charles Nicolle 1082 -Tunis- Mahrajène, Tunisia
Abstract: One of the questions posed by climate change is identification and quantification of rainfall variability. Rainfall variability is an important element of semi-arid climates, and climate change is likely to increase that variability in many of these regions. As consequent, an understanding of rainfall trends and breakpoints is needed. The goal of this work is to examine the rainfall trend in semi arid region (Serrat watershed in central Tunisia), to consider these results for marks of climate change. An effort has been made to analyze long-term rainfall data obtained from four rain gauges (El Kef, Djebel boulahnech, Kalaa khesba and Djerissa delegation). To reach these goals, the paper determines rainfall variability (by means of statistical coefficients) and annual trends (test Mann-Kendall). Also, the study is based on a set of test concerning detection of breaks in time series. We deal with annual and monthly precipitation level as observed in Serrat watershed, mainly during 1960 to 2011. The results underline the existence of alternating dry and wet periods. These methods reveal the variability of rainfall regimes in the semi arid region; they permitted the description of climatic change and have interpreted it on a local level. Key words: Semi-arid region, Rainfall variability, trends, climatic change, breaks detection. METHODS In order to determine the discontinuities in Serrat precipitation series different tests has been performed:
Mann Kendall test (Kendall, 1975; Mann, 1945): Pettitt test (Pettitt, 1979) Hubert’s segmentation procedure (Hubert et al. 1989; Hubert and Carbonnel, 1993) Buishand U statistic (Buishand, 1982; Buishand, 1984) Lee Heghinian’s Bayesian procedure
RESULTS
Statistical break detection methods Pettitt test, Hubert’s segmentation test, Lee Heghinian’s Bayesian method and Statistic U of Buishand lead to conclude a precise change occurred in monthly rainfall series.
Table 1 Date of break in time series (Jrissa station) Test Jan Feb Mar Apr May Juin Juil Aug Sep Oct Nov Dec Statistic U of Buishand - - - 2003/2008 - - - 1994 - - - Pettitt - - - - - - - - 1994 - - - Lee Heghinian’s Bayesian 2002 2010 2011 2008 1984 1987 - - 1994 1983 1983 2001Hubert’s segmentation - 2010 - 2008 - - - - 1994 1983 - -

Hydrology in a Changing World: Environmental and Human Dimensions Poster Proceedings of FRIEND-Water 2014, Montpellier, France, 7-10 October 2014
33
Fig. 1 Result of Statistic U of Buishand (Jrissa station). Rainfall trend The annual rainfall has shown increasing trends depending on all studied station. The trend line fitted to each station rainfall observations can serve to identify the general characteristics of each season as well as inter annual variability of rainfall. Fig. 1 illustrates the trend lines for all studied stations.
Fig. 2 Result of Kendall test for Serrat series (Kalaa khesba (a) and Boulahnech(b) station).
CONCLUSION The present study deals with an assessment of trends and rupture detection of annual and monthly rainfall for Serrat basin, central Tunisia. The statistical analysis showed an irregular space time distribution of rainfall and an inter-annual variability was marked by wet and dry year’s fluctuations. Annual rainfall at the four stations, namely El Kef, Jrissa, Kalaa Khesba and Boulahnech, was found to be variable: The stations showed similar trends (increasing rainfall) during their observation period. Four methods to detect change in time series (Pettitt test, Hubert’s segmentation test, Lee Heghinian’s Bayesian method and Statistic U of Buishand) lead to conclude a precise change occurred in monthly rainfall series: the use of different methods led to different results within one same series. But a precise break is identified at september 1994.
REFERENCES
Buishand T.A. (1982) Some methods for testing the homogeneity of rainfall records. IAHS Publication 333, 76–83. Buishand T.A .(1984) Tests for detecting a shift in the mean of hydrological time séries. Journal of Hydrology 58: 51–69. Hubert P., Carbonnel J.P & Chaouche A. (1989) Segmentation des séries hydrométéorologiques - Application à des séries de
précipitations et de débits de l’Afrique de l’Ouest. Journal of Hydrology 110: 349–367. Hubert P & Carbonnel J.P. (1993) Approche statistique de l’aridification de l’Afrique de l’Ouest. Journal of Hydrology 95: 165–183. Kendall M.G. (1975) Rank Correlation Measures. Charles Griffin. pp 202. Lee A.F.S & Heghinian S.M. (1977) A shift of the mean level in sequence of independent normal random variables: a Bayesian
approach. Teehnometries 19(4): 503–506. Mann H. B. (1945) Non-parametric tests against trend. Econometrica. 13: 245–259. Pettitt A.N. (1979) A non-parametric approach to the change-point problem. Appl Stat 28(2): 126–135.
(a) (b)

Hydrology in a Changing World: Environmental and Human Dimensions Poster Proceedings of FRIEND-Water 2014, Montpellier, France, 7-10 October 2014
34
Human-induced alterations of extreme water level in the Pearl River Delta, South China
YONGQIN DAVID CHEN1 & QIANG ZHANG2 1 Dept. of Geography and Resource Management, The Chinese University of Hong Kong, Shatin, Hong Kong, China [email protected] 2 Dept. of Water Resources and Environment, Zhongshan University, Guangzhou 510275, China Abstract: Trends and variations of the extreme water levels defined as exceeding/falling below certain thresholds (mean±std) across the Pearl River Delta (PRD) in South China are systematically evaluated using the linear regression method. Research results indicate that: (1) The upper PRD is dominated by the significant decreasing low water level, and significant increasing low water level can be identified in the lower PRD. The variations of the relative frequency of the high water level are characterized by the decreasing variability in the middle PRD. However more stations show significant changes of the relative frequency of the low water level across the PRD. No confirmative changing patterns of the relative frequency of the low water level can be detected in the middle PRD; (2) When it comes to the seasonal variations of the high/low water level in June-July-August (high flow periods), stations located closer to the estuary tend to exhibit increasing high/low water level. However stations located closer to the upper PRD tend to show decreasing high/low water level. Similar patterns can be identified in the high/low water level in December-January-February (low flow periods); and (3) The changes of the water level in the PRD are heavily affected by human interferences, e.g. in-channel dredging, sand mining and the construction of levees. The stations dominated by decreasing water level are mostly located along the river channels featured by highly-intensive dredging. The stations along the coastal regions show significant increasing extreme high/low water level. The coastal regions are not influenced by in-channel dredging, and furthermore, sediment loads from upper and middle PRD are deposited in the river mouths and which will tend to raise the water level in the estuary of the PRD. The findings of this paper may be helpful for local water resource management. Key words: water levels; human activities; peak over threshold; Pearl River Delta INTRODUCTION The crisscross river network (density: 0.68-1.07 km/km2) in the Pearl River Delta (PRD) IN South China is one of the most complicated deltaic drainage systems in the world (Chen and Chen, 2002). With a highly dense agglomeration of over 100 towns and cities, the PRD region has been the fastest developing region in China since the country adopted the “open door and reform” policy in the late 1970s. Increasingly intensified human activities have resulted in considerable hydrological alterations in the PRD. Since the early 1980s, human interferences and impacts of sea-level variations on hydrological processes in the PRD are: (1) intensive in-channel dredging and sand mining, which caused significant in-channel geomorphological alterations and breaks the natural balance of the filling-scouring process within the river channels; (2) re-allocation of the streamflow and sediment loads within the river channels of the Pearl River Delta because of construction of levees and sand dredging; and (3) increasing sea level in the estuary leading to the backwater effect, which further intensifies the prevalent sediment deposition in the river mouths and results in the salinity intrusion in the PRD. The salinity intrusion, frequent floods, water logging, and typhoon are the key factors negatively influencing the sustainable development of the local social economy and ecological environment in the PRD. The objectives of this paper are: (1) to detect trends and variations of the frequency extreme water levels over certain time intervals (relative frequency); and (2) to evaluate the spatial patterns of the relative frequency trends of extreme water levels and possible underlying causes. STUDY REGION AND DATA The Pearl River Delta is the integrated delta composed of West River delta, North River delta and East River delta. The monthly data of the extreme water level covering 1958-2005 were collected from 23 gauging stations in the upper, middle and lower parts of the delta region.

Hydrology in a Changing World: Environmental and Human Dimensions Poster Proceedings of FRIEND-Water 2014, Montpellier, France, 7-10 October 2014
35
METHODS The extreme water levels are defined as those exceeding/falling below a given threshold (known as partial duration series). We applied the Peaks over Threshold (POT) analysis which considers all the values of the variable exceeding or falling below an a priori determined threshold (Bordi, et al., 2006). The trends of the observed number of occurrences of extreme water levels exceeding/ falling below certain thresholds spanning a certain time interval (refers to one year in this paper) were detected using the simple linear regression method which is a parametric T-test method requiring the data to be normally distributed. The normality of the data series was first tested using the Kolmogorov-Smirnov test (Xu, 2001). The changing patterns of the frequency of the extreme water levels at certain time intervals were identified by the moving average method. SUMMARY OF RESULTS AND DISCUSSIONS The upper PRD is dominated by the significant decreasing trend of the lower water level, and significant increasing low water level can be identified in the lower PRD. No confirmative changing patterns of the relative frequency of the low water level can be detected in the middle PRD. As for the high water level and lower water level in June-July-August (JJA, high flow periods, stations located closer to the estuary tend to show increasing high/low water level. However, stations located closer to the upper PRD tend to show decreasing high/low water level. Moreover, more stations exhibit significant changes of the low water level than those show significant changes of the high water level, which may indicate that low water level may be more sensitive to human interference and to impacts from climate changes, e.g. precipitation changes. Similar patterns can be identified in the high/low water level in December-January-February (DJF, low flow periods). More stations show significant changes of low water level when compared to those stations show significant changes of the low water level in DJF. In addition, the spatial patterns of the changes of the water level in DJF seem to be complicated when compared to those of water level in JJA, which also indicates that changes of the low water level may be more sensitive to human interferences and climate changes when compared to the changes of the high water level The water level in the PRD influenced by both streamflow and tidal levels demonstrates fairly complicated changing characteristics. The stations along the coastal regions show significant increasing extreme high/low water level. The coastal regions are not influenced by sand dredging, and furthermore, sediment loads from upper and middle PRD are deposited in the river mouth and which will be beneficial for rise of the water level in the estuary of the PRD. Study results suggest that the responses of the low water level to external interferences are more distinct and sensitive when compared to those of high water level, because more stations are with significant changes of low water level than those with significant changes of the high water level. Changes of the water level across the PRD are heavily influenced by human activities, especially by the in-channel sand dredging. The construction of the levee may aggregate streamflow in the channel which may cause water level rise. This study shows that rising water level is usually identified in the channel featured by moderate and low intensity of the dredging. River channels featured by high intensity in-channel dredging are usually dominated by significant decreasing water levels. Decreasing trends and smaller variability range are identified in the water levels in the middle PRD and increasing trends of water level are detected in the lower PRD. REFERENCES
Bordi, I., Fraedrich, K., Petitta, M. & Sutera, A. (2006) Extreme value analysis of wet and dry periods in Sicily. Theor. Appl. Climatol., doi: 10.1007/s00704-005 -0195-3.
Chen, X.H. & Chen, Y.D. (2002) Hydrological change and its causes in the river network of the Pearl River Delta. Acta Geographica Sinica 57(4), 430-436. (in Chinese)
Xu, C. Y. (2001) Statistical analysis of a conceptual water balance model, methodology and case study. Water Resources Management 15, 75–92.

Hydrology in a Changing World: Environmental and Human Dimensions Poster Proceedings of FRIEND-Water 2014, Montpellier, France, 7-10 October 2014
36
Which catchment characteristics influence the temporal dependence structure of daily river flows?
A. CHIVERTON,2,3, J. HANNAFORD1, I. HOLMAN2, R. CORSTANJE2, C. PRUDHOMME1, J. BLOOMFIELD3, T. M. HESS2 1 Centre for Ecology and Hydrology, Wallingford, Maclean building, Crowmarsh Gifford, OX10 8BB, UK [email protected] 2 Department of Environmental Science and Technology, Cranfield University, Cranfield, MK43 0AL, UK 3 British Geological Survey, Wallingford, Maclean building, Crowmarsh Gifford, OX10 8BB, UK
MOTIVATION Hydrology has yet to achieve a widely agreed-upon system which classifies catchments based on the movement and storage of water within the catchment (Wagener et al., 2007). Even though internal complexity will remain within each class as every catchment is unique; (Beven, 2000), a broad classification process should be possible, based on the general assumption that some level of organisation and therefore predictability in catchment functions exists (Gunter et al., 2013). This poster demonstrates a novel classification approach based on the temporal dependence exhibited in daily river flow data.
Temporal dependence represents the similarity between the river flow on a given day and river flow on the preceding days. The temporal dependence structure can be represented by a one dimensional semi-variogram. Temporal dependence, calculated from the semi-variogram, is likely to be influenced by catchment characteristics; classifying catchments via semi-variograms therefore allows an exploration of the catchment properties that influence the precipitation-to-flow relationship. This understanding will be beneficial for improving regionalisation techniques and developing methods for indexing the sensitivity of different catchment types to historical and future climate changes. DATA To mitigate against the impact from artificial influences 116 near-natural benchmark catchments spread throughout the UK were analysed, along with 49 ‘validation’ catchments. The influence of different catchment characteristics was investigated using a wide range of catchment characteristics: elevation, land cover, physiographic characteristics, soil type and geology. Clustering The benchmark catchments were clustered on the basis of their semi-variograms using Ward’s method of hierarchical clustering, resulting in four clusters (Figures 1 and 2). Cluster 1 is comprised of catchments with small lag times and low storage (i.e. steep topography, peat soils and rock with essentially no groundwater). The opposite is seen in cluster 4 where the majority of catchments overlay highly productive fractured aquifers. Predicting the shape of the variogram based on catchment characteristics Quadratic discriminant analysis was used to independently investigate how accurately catchment characteristics can be used to predict the membership of the clusters (Table 1). This demonstrates that
Fig. 1 Location of the catchments in the four clusters.
Fig. 2 Semi-variograms for the four identified clusters with the mean of each cluster (line) and the 95 % confidence intervals (shaded area).

Hydrology in a Changing World: Environmental and Human Dimensions Poster Proceedings of FRIEND-Water 2014, Montpellier, France, 7-10 October 2014
37
using a combination of catchment characteristics enables the shape of the variogram to be estimated for an un-gauged catchment. Model 5 was deemed the best model.
CONCLUSION The results showed that clustering the catchments based on the semi-variogram is an effective way to obtain separate groups of catchments based on the temporal dependence, and that these clusters can be explained with catchment characteristics that moderate the precipitation to flow relationship. Catchments with characteristics indicative of fast flow paths and low storage (i.e. upland catchments) resulted in semi-variograms with a large gradient, levelling off after a few weeks; whereas catchments with characteristics which enable water to infiltrate deep into the soil / rock have a small gradient and do not level off within 90 days. The catchment characteristics able to best discriminate between catchments were found to be: percentage of arable land, depth to gleyed layer in soils, slope and elevation. It is likely that arable land is not a driver behind the different clusters, but a surrogate for a combination of other characteristics which drive infiltration and hence the precipitation to flow relationship. This methodology will be developed further to examine non-stationarity in precipitation-to-flow relationships; it could also be expanded on to transfer information about the precipitation to flow relationship from gauged to un-gauged catchments.
REFERENCES Beven, K. (2000). Uniqueness of place and process representations in hydrological modelling. Hydrology and Earth System Sciences, 4, 203-213. Gunter, B., Murugesu, S., Wagener, T., Viglione, A. & H, S. (2013). Runoff Prediction in Ungauged Basins: Synthesis across Processes, Places and Scales, Cambridge University Press. Wagener, T., Sivapalan, M., Troch, P. & Woods, R. (2007). Catchment Classification and Hydrologic Similarity. Geography Compass, 1, 30.
Mod
el n
um
ber
(num
ber
of v
aria
bles
)
% c
lass
ifie
d co
rrec
tly
(b
ench
mar
k)
% v
alid
ated
cor
rect
ly
% w
oodl
and
Ave
rage
dr
aina
ge
path
le
ngth
Are
a
% g
rass
land
Ele
vati
on 1
0*
Lon
gest
dra
inag
e pa
th
Flo
odpl
ain
exte
nt**
Dra
inag
e pa
th s
lope
Gle
yed
less
than
40c
m
Gle
yed
betw
een
40 a
nd
100c
m
No
gley
ed s
oil
% A
rabl
e la
nd
12 89.7 32.7
11 89.7 30.6
10 87.9 57.1
9 86.2 63.3
8 81.9 53.1
7 80.1 57.1
6 75.9 63.2
5 72.4 71.4
4 70.7 71.4
3 68.1 73.4
2 67.2 75.5
1 54.3 55.1
* Height at which 10% of the catchment is below
**Proportion of the floodplain which would be covered by the 1 in 100 year flood event.
Table 1 Discriminant models and the percentage of catchments which were correctly clustered by using the shaded catchment characteristics.
* Height at which 10% of the catchment is below
**Proportion of the floodplain which would be covered by the 1 in 100 year flood event.

Hydrology in a Changing World: Environmental and Human Dimensions Poster Proceedings of FRIEND-Water 2014, Montpellier, France, 7-10 October 2014
38
A web-based information portal and (real time) decision support system for flood control and water resources management
R.J. DAHM1, A. VAN LOENEN1, A. LESKENS2,3 1. Deltares. Rotterdamseweg 185, P.O. Box 177, 2600 MH, Delft, The Netherlands. E-mail: [email protected] 2. Nelen & Schuurmans. Zakkendragershof 34-44, P.O. Box 1219, 3500 BE Utrecht, The Netherlands 3. University of Twente. Drienerlolaan 5, P.O. Box 217, 7500 AE Enschede, The Netherlands. WEB-BASED INFORMATION PORTAL
We present a case study of a web-based information portal to support decision making in water management in the Mekong Delta of Southern Viet Nam. The delta faces major challenges, such as floods, drought, and salinity. Although research and the development of integrated plans are on-going, data remains difficult to access which can hamper progress. The necessary hydrological data are available, however, a unique database system to access this data is lacking. Standardization could improve inter-departmental data exchange, necessary to formulate sustainable integrated solutions to water management. The challenge is to collect and integrate available information and monitoring data from different sources and departments. We designed a web-based portal which comprises a wide variety of applications and enables the user to access specific data and model systems. The portal integrates scattered data on floods, droughts, land-use, remote sensing data and other relevant data and information into one platform. Because of its online access and real-time modelling possibilities, it is not only supporting water management policy, but it can also be used as a valuable decision support system for calamity management. A flood disaster is one of the calamities during which a data portal will prove useful. The portal gives access to systems that are based on state-of-the art techniques for flood modelling like the advanced modelling tool 3Di (Stelling, 2012) and forecasting systems like Delft-FEWS (Werner et al. 2013, www.delft-fews.eu). In this way, the system support Vietnamese governments towards a flood resilient environment. This information portal should be internet based, fast enough to process high amounts of data, flexible enough to open up different services on water management, agriculture, and needs to be a proven technology. In The Netherlands, the portal has already proven its usability. It has been operational for five years in national and regional governments in the Netherlands and is used as the information platform for the Dutch Delta Programme (www.deltaportaal.nl). In Nepal, the portal framework is used for a Water Resources Information System commissioned by the Water and Energy Commission Secretariat (www.wecs-wrkb.gov.np/home/map). The web portal is designed to be used by a broad range of users, varying from specialists to managers. CASE STUDY: MEKONG DELTA PORTAL
We demonstrate the broad potential of the portal and how to make effective use of common input data. This data is turned into information through different applications, so-called ‘apps’ in the homepage of the portal structure. The Mekong Delta Portal includes a Flood Risk App, Drought Risk App and a Dam Monitoring App. The Flood Risk App shows a selection of the results of the Ho Chi Minh City Integrated Flood Risk Management project (Dahm et al, 2013). Also the result of a flood hazard simulation for the Mekong Delta is presented. It is being used to assess flood propagation in these scenarios.

Hydrology in a Changing World: Environmental and Human Dimensions Poster Proceedings of FRIEND-Water 2014, Montpellier, France, 7-10 October 2014
39
Fig. 1 Left: Screenshot of the web-based information portal. Centre: The ‘Flood risk’ app and its two components. Right: Example of a flood map in the ‘Scenario’ app. The Drought Risk App integrates the Drought Risk Monitoring and Impact Toolbox (DMIAT) in the portal (Terink et al. 2011). This toolbox can assess four types of drought: meteorological drought, agricultural drought, hydrological drought, and socio-economic impacts. The DMIAT is a combination of remote sensing, models, and decision trees. The results of a Mekong River Basin assessment using DMIAT are accessible through the portal.
Fig. 2 Real-time overview of the drought vulnerability index of the Mekong River Basin The Dam and Dike Monitoring App is currently in development and shows the results of an on-going pilot project regarding the monitoring of the Phu Ninh Dam near Tam Ky, located in central Viet Nam, by using satellite imaging. The portal could be used for collecting this data, analysing and, if necessary, to warn the local authorities about dam or dike instability. REFERENCES
Dahm, R.J., Diermanse, F.H.M., Ho, L.P. (2013). On the flood and inundation management of Ho Chi Minh City, Viet Nam. International Conference on Flood Resilience. Exeter, United Kingdom.
Terink, W., Immerzeel, W.W., Droogers, P. (2011). Drought Monitoring and Impact Assessment in the Mekong River Basin. FutureWater Report 104.
Stelling, G.S. (2012). Quadtree flood simulations with sub-grid digital elevation models. Proceedings of the Institute of Civil Engineers. http://dx.doi.org/10.1680/wama.12.00018
Werner, M., Schellekens, J., Gijsbers, P., van Dijk, M., van den Akker, O., Heynert, K. (2013). The Delft-FEWS flow forecasting system. Environmental Modelling and Software http://dx.doi.org/10.1016/j.envsoft.2012.07.010.
www.delft-fews.eu (accessed date: August 19, 2013) www.deltaportaal.nl (accessed date: July 29, 2013) www.wecs-wrkb.gov.np/home/map (accessed date: August 19, 2013)

Hydrology in a Changing World: Environmental and Human Dimensions Poster Proceedings of FRIEND-Water 2014, Montpellier, France, 7-10 October 2014
40
Natural and anthropogenic factors on the mechanical erosion in the Red River (Vietnam): temporal and spatial variability of
sediment transport THI HA DANG1,2, ALEXANDRA COYNEL1,*, DIDIER ORANGE3, ANTOINE MARACHE4 & HENRI ETCHEBER1 1: Univ. Bordeaux, EPOC, UMR 5805, F-33405 Talence, France, 2: Faculty of chemistry, BaRia – VungTau University Vietnam, 3: IRD, BIOEMCO, 35 DienBienPhu, BaDinh, Hanoï, Vietnam, 4: Univ. Bordeaux, I2M, UMR 5295, F-33405 Talence, France. *corresponding author: [email protected]
INTRODUCTION The sediment transport from the continent to the ocean is controlled by a combination of natural parameters related to geomorphic, tectonic, and climatic influences as well as land cover (Milliman & Syvitski, 1992). Additionally, human disturbances may strongly affect mechanical erosion and suspended particulate matter (SPM) supply to estuaries, deltas or coastal zones (Farnsworth & Milliman, 2003).
The Red River (China/Vietnam, 169 000 km², Fig. 1) is a typical tropical humid river coming from the Himalaya Mountains into South-East Asia. Based on the extensive dataset of daily water discharges and SPM concentrations provided between 1960 and 2008 at the outlet of the Red River system (ST) and at the four major sampling site (LC, PT, Da and Lo; Fig. 1) for the period 2003-2008 with the IMHE collaboration, the general aim of this study was to characterize the temporal and spatial variability of water and sediment fluxes carried in the Red River System and outline natural and anthropogenic sources/processes.
Fig. 1 Map of the Red River and its tributaries: location of the permanent observation sites (black circles: LaoCai (LC), PhuTho (PT), SonTay (ST), Da River (Da) and Lo River (Lo)); and description of monthly averages of rainfall and water discharge corresponding (data from 2003-2008; IMHE).
RESULTS AND DISCUSSION The mean annual SPM flux (FSPM) at the outlet of the Red River was estimated at 90 Mt/yr (i.e. 600 t/km²/yr). The temporal variability of annual SPM fluxes (ranging from 24 to 200 Mt/yr) is strongly related to the interannual hydrological conditions. However, some years of high water flow were not associated with high FSPM, especially after 1989 when the HoaBinh dam came into operation. Therefore, the median discharge pre- (3389 m3/s) and post 1989 (3495 m3/s) are similar indicating there was little or no change between both periods. The analysis of the double-mass plots of annual FSPM as a function of annual water volume shows a slope change around 1989-1990 suggesting a decrease in annual FSPM after this period (Fig. 2A).
A single sediment rating curve derived from 1960-1989 data was used to simulate the annual variability of former sediment delivery, generating excellent cumulative FSPM estimates (error ~1%). In contrast, applying the same rating curve to the 1990-2008 data resulted in systematic and substantial (up to 109%) overestimation. This suggests that the HoaBinh dam reduces annual FSPM to the delta by half (Fig. 2B; Dang et al., 2010).

Hydrology in a Changing World: Environmental and Human Dimensions Poster Proceedings of FRIEND-Water 2014, Montpellier, France, 7-10 October 2014
41
Fig. 2 (A) Double-mass plots of annual SPM flux and annual water flux for the Red River at the ST site during the 1960-2008 period. The arrow shows a slope change around 1989-1990; (B) Analysis of the water and SPM transport regime: the difference “" between the schematic curves corresponding to the sum of daily SPM fluxes for the 1960-1978 and the 1990-2008 periods illustrates the significant reduction of SPM load after the commissioning of the HoaBinh dam.
The spatial variability of FSPM, defined by analyzing 5 key sites between 2003 and 2008, suggests that most SPM were eroded from the upstream watershed located in China (80%). The mean inter-annual FSPM was 30 Mt/yr (i.e. 741 t/km²/yr), 38 Mt/yr (792 t/km²/yr) and 29 Mt/yr (193 t/km²/yr) at the LC, PT and ST sites, respectively. These values were 4.1 Mt/yr (80 t/km²/yr) and 6.6 Mt/yr (191 t/km²/yr) for the Da and Lo rivers, respectively. We have highlighted complex processes of erosion, transport and sedimentation which occurred in the middle Red River watershed between the LC and PT sites, depending strongly on the annual water discharge (Fig. 3). Additionally, an important sedimentation (~11-12 Mt) was observed at the entry point of the Red River (sum of PT+Da+Lo) to the Delta (ST) in both cases. A conceptual model of sediment transport is proposed.
Fig. 3 Model of Water discharge (Qa in m3/s) and SPM flux transported by the Red River between LC and PT, showing (A) the deposition case during 2003-2004 ( ) or (B) the erosion case during 2005-2006 ( ). (*Dang et al., 2010)
CONCLUSION
As demonstrated with the assessment of the trap efficiency of the HoaBinh dam (~88%), reservoir construction is one of the greatest changes that have affected continental aquatic systems in the past 100 years. This information is needed for future management because these sediments may have multiple environmental impacts like temporary sinks for sediment and river-borne pollutants. In addition, the FSPM measured along the Red River and at the outlet of the Da and Lo Rivers proved the complex processes of transport/erosion/sedimentation occurring in the watershed and strongly depending on the hydrological condition. We highlighted that further erosion studies (quantification and modelling) should analyse recent FSPM with a long-term observation covering a high spatial resolution to better understand SPM transport dynamic.
REFERENCES
Dang, T.H., Coynel, A., Orange, D., Blanc, G., Etcheber, H., Le, L.A. (2010) Long-term monitoring (1960-2008) of the river-sediment transport in the Red River Watershed (Vietnam): Temporal variability and dam-reservoir impact. Science of the Total Environment 408, 4654-4664.
Farnsworth, K.L. & Milliman, J.D. (2003) Effects of climatic and anthropogenic change on small mountainous rivers The Salinas River example. Global and Planetary Change 39, 53-64.
Milliman, J.D. & Syvitski, J.P.M. (1992) Geomorphic/tectonic control of sediment discharge to the ocean the importance of small mountainous rivers. Journal of Geology 100, 525–544.
0
2000
4000
6000
0 1000 2000 3000 4000 5000 6000
Cumulative Water flux (km3)
Cu
mu
lati
ve S
PM
flu
x (1
06 t)
1989-1990
0
20
40
60
80
0
3000
6000
9000
1200
0
1500
0
1800
0
2100
0
2400
0
2700
0
3000
0
3300
0
Discharge (m3/s)
FS
PM
(1
06 t)
C
1960-1978
1990-2008
σ
A B
Red River Delta
LC
Red River
PTDa Lo
HoaBinhReservoir
Case 1: Qa LC ~ Qa PT (Example 2003-2004)
Qa=620 FSPMa=32 Mt
ST
Qa=620 FSPMa=26 Mt
∆FSPMa= -6 Mt
Qa=2840 FSPMa=30 Mt
Qa=821 FSPMa=9.3Mt
Qa=1692 FSPMa=5.4 Mt
Case 2: Qa LC < Qa PT(Example 2005-2006)
Qa=1590 FSPMa=2.7 Mt
Qa=606 FSPMa=4.5 Mt
Qa=2974 FSPMa=25 Mt
∆FSPMa= 8 Mt
∆FSPMa=-11 Mt
FSPMa= 45 Mt*
A B
Red River Delta
LC
Red River
PTDa Lo
HoaBinhReservoir
ST
Qa=618FSPMa=30 Mt
∆FSPMa=-12 Mt
Qa=392 FSPMa=22 Mt
FSPMa= 22.5 Mt*

Hydrology in a Changing World: Environmental and Human Dimensions Poster Proceedings of FRIEND-Water 2014, Montpellier, France, 7-10 October 2014
42
Nitrate pollution risk of Quaternary groundwater in the southern part of Abidjan District (Côte d'Ivoire)
ARISTIDE GOUNTOH DOUAGUI, ISSIAKA SAVANE & INNOCENT KOUASSI KOUAME Laboratoire de Géoscience et Environnement, UFR-SGE, Université Nangui Abrogoua, 02 BP 801 Abidjan 02, Côte d’Ivoire [email protected] Abstract: In this study, groundwater nitrate concentration were monitored at 127 groundwater sampling points located in the southern part of Abidjan District. Each water sampling location was sampled in March 2007, representing the long dry season. Geostatistical methods were used to analyze the spatial variability of nitrates and the groundwater nitrate pollution risk. Groundwater nitrate concentrations ranged from 4 to 198 mg.L-1 and were log-normally distributed in the study area. The groundwater contamination risk map indicated that the strongly urbanized west side of the site presented a high probability of exceeding the WHO drinking water standard (50 mg.L-1N03
-). Key words: Quaternary groundwater, Nitrates, Pollution risk, Abidjan. INTRODUCTION
In recent years, nitrate contamination of Quaternary groundwater has become a growing concern for a large percentage of suburban and rural populations in the southern part of Abidjan District where groundwater is used as drinking water. This raises public health concerns about groundwater quality because excessive nitrate in the groundwater could induce infant methemoglobinemia and possibly human gastric and esophageal cancer (Ohou et al., 2008). Previous case studies (Issiaka et al., 2006; Ahoussi et al. 2008) have shown high levels of nitrate in some wells in the southern area of Abidjan district. However, these studies did not include assessment of groundwater pollution risk. Thus, there is a need to conduct this type of study to assist local authorities in developing plans and regulations and in implementing actions to reduce human health and environmental risks. This work gives a perspective of how Abidjan District quaternary groundwater quality is influenced by nitrate pollution.
MATERIAL AND METHODS The study area is located in the South of Côte d'Ivoire. It is divided into five communal zones
(Treichville, Marcory, Koumassi, Port-Bouët and Grand-Bassam) (Fig.1). Groundwater was sampled from 125 wells and 2 boreholes during the long dry season of 2007
(March). The sampling points were selected based on the geographic location of wells and boreholes and the use of the wells and boreholes as sources of drinking water. Nitrates were analyzed according to AFNOR standards NFT 90-013. The regional distribution of nitrate concentrations in each location of the study area is characterized by the variogram (Assaf and Saadeh, 2009). To estimate nitrate values at unobserved locations using ordinary kriging (OK) and generate nitrate contours, a theoretical model must be fitted to the experimental data variogram. The kriging indicator method is used to assess the risk of nitrate contamination as described by Antonakos and Lambrakis, (2007) and Lamotte and Greene (2007). In this study, 50 mg.L-1 was used as the NO3
- pollution threshold. The NO3- raw data were
standardized into 0 or 1 according to whether they were above or below the threshold, and then the indicator variogram of the threshold was calculated.
RESULTS Nitrate concentrations ranged from 4 to 198 mg.L-1. The NO3
- variable had a mean (44.95 mg.L-1) that was much greater than the median (28 mg.L-1). Therefore the NO3
- pattern was skewed towards smaller values and does not fit a normal distribution (Fig. 2a). The omnidirectional experimental variogram was calculated and the scatter plot of versus h was generated. The theoretical model chosen for the transformed nitrate concentrations, based on the smallest minimized weighted sum of square values (1.21), was the spherical model (range = 10.522 Km and sill = 0.166) with a nugget effect of 0.036, as shown in Fig. 3.

Hydrology in a Changing World: Environmental and Human Dimensions Poster Proceedings of FRIEND-Water 2014, Montpellier, France, 7-10 October 2014
43
The conditional probability of groundwater nitrate concentrations exceeding 50 mg.L-1 (threshold value), was higher in the western part of the study area (particularly in Treichville, Marcory, Koumassi, Vridi, Jean-Folly, Warf) than in the other areas. In these localities, the probability was evaluated at over 50%. (Fig. 4). In these localities, the probability was evaluated at over 50 mg.L-1. In Grand-Bassam, the Port-Bouët areas (Adjouffou, Jean Folly, Gonzaqueville and Anani) and Moossou, the probability ranged from 25 to 50%. In the rural areas such as Abouabou, Maffiblé, Lomé, Modeste, Vitré 1 and Vitré 2, this probability was weaker and lower than or equal to 25%.
CONCLUSION
The need for guidelines to protect groundwater quality in the southern part of Abidjan District is imperative. The risk assessment of NO3 pollution is useful for better developing plans and regulations and in implementing actions to reduce human health and environmental risks.
REFERENCES
Assaf, H., & Saadeh, M. (2009) Geostatistical Assessment of Groundwater Nitrate Contamination with Reflection on DRASTIC Vulnerability Assessment: The Case of the Upper Litani Basin, Lebanon. Water Resour. Manage. 23, 775-796.
Benson, V.S., Vanleeuwen, J.A., Stryhn, H. & Somers, G.H. (2007) Temporal analysis of groundwater nitrate concentrations from wells in Prince Edward Island, Canada: application of a linear mixed effects model. Hydrogeol. J. 15(5), 1009-1019.
Hu, K., Huang, Y., Li, H., Li, B., Chen, D. & White, R.E. (2005) Spatial variability of shallow groundwater level, electrical conductivity and nitrate concentration, and risk assessment of nitrate contamination in the North China Plain. Environ. Int. 31(6), 896-903.
Issiaka, S., Albert, G.B.T., Aristide, D.G., Innocent, K.K. (2006) Vulnerability assessment of Abidjan Quaternary Aquifer using the DRASTIC method, in: Groundwater pollution in Africa. (Ed. by Xu, Y., & Usher, B.),115-124. Taylor § Francis/Balkema, Leiden.
Ohou, M.J.A., Mambo, V., Yapo, B.O., Seka, M.A., Tidou, A.S., Kamagaté, B. & Houenou, P.V. (2008) Temporal and spatial variations of nitrate levels in traditional water supply wells in the area of Buyo, Côte d’Ivoire. J. Applied Sci. 8, 3096-3107.
Fig. 2 Histograms of the raw nitrate concentrations data (a) and the log-transformed data (b). Raw NO3
- pattern was skewed towards smaller values and does not fit a normal distribution, while the log-transformed nitrate concentrations are normally
Fig. 3 Log N03- experimental variogram
fitted with spherical model.
Fig. 1 Study area.
Fig. 4 Probability map of groundwater nitrate exceeding 50 mg. L-1 in the southern area of Abidjan

Hydrology in a Changing World: Environmental and Human Dimensions Poster Proceedings of FRIEND-Water 2014, Montpellier, France, 7-10 October 2014
44
Influence of drought conditions on aquatic habitat quality in the upper Nitra River Basin in Slovakia
MIRIAM FENDEKOVA1, MARIAN FENDEK1, VILIAM MACURA2 & JANA KRALOVA2 1 Dept. of Hydrogeology PRIF UK, Mlynska dolina, 842 15 Bratislava, Slovak Republic Email: [email protected] 2 Dept. of Land and Water Resources Management, Slovak University of Technology, Bratislava, Slovakia INTRODUCTION
Drought affects water availability for the human society needs, but primarily for natural ecosystems. Drought can be identified within the low flow phase of the flow regime which is considered for one of the most important conditions influencing quality of the river ecosystems. It is necessary to take into account the surface water quality and quantity parameters when estimating the ecological status of surface water bodies. Such an approach is fully compatible with the requirements of the Directive 2000/60/EC and with the integrated water resources management. INPUT DATA AND METHODS
Hydrological drought occurrence was studied in the upper part of Nitra River Basin, Slovakia at gauging profile Nedozery (No. 6540) and in the groundwater monitoring well No. 251 in Nedozery, located app. 600 m downstream the discharge gauging profile. The threshold level method and the method of sequent peak algorithm were used for drought analysis. Data on daily discharges for the period 1941-2006 and on the daily groundwater levels for the period 1975-2006 were used as the input data, processed by HydroOffice 2010 program package (Gregor, 2013) for calculation of streamflow and groundwater level duration curve (FDC, GWLDC) parameters. The 95th percentile values of the FDC curves were applied as the threshold level values for streamflow and groundwater level drought periods estimation. The basic information on both gauging points is in Table 1. Table 1. Basic data on evaluated gauging profiles
Gauging profile Area [km2]
Altitude [m a.s.l.]
Q95 [m3.s-1] BF95
[m3.s-1] Period
considered GWL95
[m a.s.l.]
Nitra-Nedozery Well No. 251
181.57 -
287.00 287.32
0.536 -
0.468 -
1941-2006 1975-2006
- 283.31
Aquatic habitat quality was studied using the habitat suitability curves derived according to IFIM methodology. Habitat suitability curves were modeled by the RHABMSIM model. Curves were constructed for different fish species at Nedozery profile, and hydraulic modeling of fish species presence at different discharges was performed. Field measurements allowed obtaining the topographic and morphological parameters of four evaluated sections of the stream (Macura et al., 2012) at Nedozery, as well as the ichthyologic data. Surface water levels at different discharges (0.6; 1.852 m3.s-
1) were used in verification of the hydraulic model. The ichthyologic survey was aimed to determine the habitat suitability curves of particular fish species. Electro-fishing using the Hans-Grassl ELT-62II HI device was applied. Minnow, gudgeon, groundl, spirlin, brown trout, chub, barbel, grayling, roach and merlin were the most abundant fish species. Hydraulic modelling of fish species presence was done for discharges of 0.30 and 0.15 m3.s-1. Surface water quality was also checked, using surface water chemical analyses in the quality monitoring profile Nedozery No. N393000D in the period 1975-2006. The monitoring is performed by Slovak Hydrometeorological Institute in Bratislava in a monthly period.

Hydrology in a Changing World: Environmental and Human Dimensions Poster Proceedings of FRIEND-Water 2014, Montpellier, France, 7-10 October 2014
45
RESULTS
The streamflow drought at Nedozery was estimated on 0.536 m3.s-1 and the groundwater drought on 283.31 m a.s.l. (Table 1) which means 3.21 m bellow surface. The number of drought periods estimated is in Table 2. The streamflow drought occurred with the frequency more than two times higher than the groundwater drought. The total duration of the streamflow drought was app. two times longer that the groundwater drought. As discussed by Fendekova and Fendek (2012), streamflow drought starts mostly in summer and lasts during the summer and autumn months. Groundwater level drought is delayed and starts mostly during the autumn months lasting till winter or even spring months of the next year. Table 2. Number of estimated drought periods in streamflow (Q) and groundwater level (GWL) in the common period 1975-2006
Object No. of drought
periods D1: 10-49 days
No. of drought periods
D2: 50-99 days
No. of drought periods
D3: ≥ 100 days
Total number (D1+D2+D3)
Total duration [days]
Nedozery discharge 22 5 5 32 1788 Nedozery well No. 251 2 7 3 12 938
The hydraulic modeling of the ecological habitat quality showed, that the minimum discharge of 0.3 m3.s-1 is the lower limit for suitable ecological habitat quality at the Nedozery profile. Discharges lower than 0.3 m3.s-1 occurred in 1946-47, 1973, 1992, 2000 and 2003 drought periods, as followed from the drought periods occurrence analysis. Decrease of the discharge below 0.3 m3.s-1 is followed by the flow velocity decrease, number of adult larger fish species decreases, number of smaller juvenile species increases. Discharges below 0.15 m3.s-1 endanger the ichthyofauna as a whole. They occurred only in 1992 drought period (Fig. 1) and were near to this limit value during the 2003 drought.
Fig. 1 Streamflow drought periods occurrence at Nedozery gauging profile. What the surface body ecological status is concerned, parameters of dissolved oxygen, BOD, N-NH4, N-NO2 and PO4
-3 did not fulfill the limits occasionally, mostly during the summer periods. Both, surface water quantity and quality must be taken into account when assessing the ecological status of the surface water body and fish habitat suitability.
Acknowledgement The research supports the work of the UNESCO-IHP VII FRIEND-Water programme, paper was prepared within the VEGA grant No. 1/1327/12 and FP6 Watch project (contract No.036946). REFERENCES Gregor, M. (2013) Surface- and groundwater quality changes in periods of water scarcity. Springer-Verlag Berlin, Heidelberg, 2013,
230 p. Fendeková, M. & Fendek, M. (2012) Drought in surface and groundwater in the Upper Nitra depression. Podzemna voda 18(1), 65–
74. Macura, V., Škrinár, A., Kaluz, K., Jalčovíková, M. & Škrovinová, M. (2012) Influence of the morphological and hydraulic
characteristics of mountain streams on fish habitat suitability curves. River Res. Applic.28 (8), 1161–1178.

Hydrology in a Changing World: Environmental and Human Dimensions Poster Proceedings of FRIEND-Water 2014, Montpellier, France, 7-10 October 2014
46
The ‘streampower’ as predictor in assessing the sediment concentration in interrill overland flow
D. GABRIELS1, D. LOBO1,2
1. UNESCO Chair on Eremology, Department of Soil Management, Ghent University, Belgium, [email protected]
2. Faculty of Agronomy, Universidad Central de Venezuela, Maracay, Venezuela ABSTRACT
For assessing sediment concentration in interrill overland flow, the streampower concept can be used in the transport function based on the slope and on the discharge per unit width of the flow. Laboratory rainfall simulation tests were performed on a large number of inclined soil pans packed with sandy, loamy and silty soils of loess origin and subjected to different rainfall intensities. This resulted in several hundreds of observations of discharge (runoff) and sediment (soil loss) in the runoff water. It was found that the streampower ω (g s-³) was the best predictor of the unit sediment load qs (g s-1 cm-1). A power function fitted the data best. The relationship was also function of the clay content. The higher the clay content, the lower the unit sediment load. Key words: streampower, sediment transport, rainfall simulation, loess soils, overland flow. INTRODUCTION
Given the fundamental principle that rainfall erosion occurs when the acting forces (raindrop impact and runoff) exceed the cohesion of the soil particles and the fact that different soil types erode at different rates, many authors searched for threshold driven detachment and transport equations. The most determining parameters in the equations are: the critical momentum flux (Schmidt, 1992), the mean runoff velocity, the unit stream power (Morgan et al., 1998) or the critical shear strength (Nearing et al., 1997). However, the parameters as critical momentum flux and critical shear strength are difficult to measure and good relationships with the measured soil physical properties are lacking. This imposes problems when applying those detachment and transport equations in erosion modeling studies on a regional scale. Fox and Bryan (2000) also indicated that the Manning equation is not suitable to calculate the velocity of overland flow during the interrill erosion process. Therefore it is better to apply relationships using the discharge instead of the velocity parameter. Since discharges are easily measured at stream outlets, this parameter can also be used to perform inverse modeling and calibration, increasing the accuracy of the erosion model equipped with such equations.
For the erosion process in rills and gullies, Nearing et al. (1997) reported a simple but very accurate transport function using the stream power (ω) concept as function of the slope inclination S and the unit discharge q, with ρ the fluid density and g the gravitational constant.
ω = ρ g S q (Eq.1) In our study a sediment transport model was developed based on small scale laboratory rainfall tests to simulate for the sheet erosion process in which the sediment is delivered towards a rilling system. The objective of this study was therefore to find a relationship between runoff discharge and sediment concentration under interrill conditions.
MATERIALS AND METHODS
Since the early 1970's laboratory rainfall simulations were carried out at the International Center for Eremology, Department of Soil Management, Ghent University, Belgium, to assess the parameter values of the USLE topographic factor and the soil susceptibility to runoff and erosion. This resulted in 133 experiments carried out on sandy, loamy and silty soils, mainly of loess origin. Biesemans (2000) carried out 7 additional rainfall simulator experiments on an alluvial clay soil (42% clay).
All laboratory experiments were performed on a smoothed, aggregate fractioned soil surface, set between 4% and 33% inclination. A broad sheet flow was ensured during the simulated rain. Hence the

Hydrology in a Changing World: Environmental and Human Dimensions Poster Proceedings of FRIEND-Water 2014, Montpellier, France, 7-10 October 2014
47
width of the flow equaled the sample width and the volumetric water flux q per unit of surface width could be derived directly. This resulted in 672 observations of discharge (runoff) and soil loss (in the runoff water).
RESULTS AND DISCUSSION
The laboratory experiments resulted in unit discharges in the range of 0.01 to 0.27 cm2 s-1. It was found that the stream power ω (kg s-³) was the best predictor of the unit sediment load qs (kg s-1 m-1).
If the measured unit sediment load qs is log-log plotted against the stream power ω of the overland flow, a linear relationship can be identified in the data. Hence a power function fitted the data best (Eq. 2).
qs = 0.00015 ω1.33 r² = 0.86 (Eq. 2) The unit sediment load is between 1 and 3 log cycles higher for the laboratory rainfall experiments than for the flume experiments of Nearing et al. (1997).
Many other authors have posted that stream power (g s-3) is the best predictor for soil detachment (Dc) and transport in either rills or by shallow flow. Hence a power function is most commonly applied.
The relationship between the unit sediment load and the stream power is also function of the clay content The higher the clay content, the lower the unit sediment load. The parameters of the regression power equations, qs = a ωb with the corresponding correlation coefficients are given in Table 1.
Table 1. Parameters of power functions between the unit sediment load (g s-1 cm-1) and the stream power (g s-3) for laboratory rainfall simulations
% clay a (10-4) b r²
6.9 2.61 1.30 0.49 12.5 1.64 1.29 0.89 17.9 2.06 1.28 0.87 24.0 6.03 1.70 0.97 41.0 3.30 1.31 0.98
The exponents b of the regression equations are all around 1.3, except one. The intercept of the regression equations is a measure of the erodibility of the soil. In general, the higher the clay content, the higher the cohesion and the lower the erodibility. Without the data set for the soil with 24% clay, the overall correlation has increased. qs = 0.000018 ω1.29 r² = 0.89 (Eq. 3) This relationship can be used to describe the erosion process in interrill overland flow areas.
REFERENCES Biesemans, J., (2000). Erosion modeling as support for land management in the loess belt of Flanders, Belgium. Ph.D. Thesis, Ghent v University, Belgium. Fox, D.M., and Bryan, R.B. (2000). The relationship of soil loss by interrill erosion to slope gradient. Catena 38: 211-222.
Morgan, R.P.C., Quinton, J.N., Smith, R.E., Govers, G., Poesen, J.W.A., Auerswald, K., Chisci, G., Torri, D., and Styczen, M.E., (1998). The European soil erosion model (EUROSEM): a dynamic approach for predicting sediment transport from fields and vsmall catchments. Earth Surface Processes and Landforms 23: 527-544.
Nearing, M.A., Norton, L.D., Bulgakov, D.A., Larionov, G.A., West, L.T., and Dontsova, K.M., (1997). Hydraulics and erosion in v eroding rills. Water Resources Research 33(4): 865-876. Schmidt, J., (1992). Modeling long-term soil loss and landform change. In: Parsons, A.J., and Abrahams, A.D. (Eds.), Overland flow, hydraulics and erosion mechanics, UCL Press, University College London. pp 409-433.

Hydrology in a Changing World: Environmental and Human Dimensions Poster Proceedings of FRIEND-Water 2014, Montpellier, France, 7-10 October 2014
48
Analysis of daily and monthly rainfall in north Algeria ABDERRAHMANE NEKKACHE GHENIM & ABDESSELAM MEGNOUNIF Water Resources Research Group, laboratory "Eau et Ouvrage dans Leur Environnement" Tlemcen University, BP 230, 13000 Algeria [email protected] INTRODUCTION
Rainfall distribution during the hydrological year influences her concentration and aggressiveness. Thus, when the major part of the total annual rainfall occurs in some very rainy days, the potential of these heavy rains can cause rapid changes in river regimes and soil structures. Droughts, floods, erosion, siltation of dams, decline of agriculture and ecosystem changes are some of the adverse consequences of this phenomenon. For these reasons, it is important to analyze the statistical structure of precipitation rates based on daily and monthly data set. To do this, data from 26 rainfall stations between 1982 and 2012 were used. The analysis concerns: DCI (Daily Concentration Index) PCI (Precipitation Concentration Index) and MFI (Modified Fournier Index) with the intent to understand the possible causes behind the aggressiveness and the changes between humidity and drought experienced by the region.
MATERIAL AND METHODS
Study Area
The climate in the north of Algeria is Mediterranean where the summer is hot and dry and the winter mild and wet. Rainfall generally ranges between 400 and 1000 mm.year-1. 26 stations in the north of the country were selected. The average annual rainfall varies between 1982 and 2012 from 428 to 742 mm.year-1. It should be noted that during the study period, the country undergoes one of the longest dry periods in its history. Methodology
DCI, PCI and MFI indexes evaluation for the various stations is realized according to the methodologies recorded respectively in the works of Martin-Vide, 2004; Oliver, 1980 and Arnoldus, 1977 and 1980. The rating scale values of PCI and MFI is given in Table 1 Table 1 Rating scale values of PCI and MFI
RESULTS
The results show that the daily concentration generally ranges between 0.50 and 0.70 (Fig. 1) and does seem to depend neither precipitation amounts nor station location. PCI values ranging from 9 to 17 with an average of 11 showing the distribution of precipitation in northern Algeria is moderately seasonal. For MFI, it varies between 16 and 115 with an average value of 49. Thus, the aggressiveness of rainfall is low with the existence of moderate values. Unlike the DCI values, those of the monthly concentration (PCI) and aggression are proportional to the precipitation amounts. Relatively strong relationships are given in Fig. 2, where aggressiveness increases from south to north. It should be noted that Ghenim and Megnounif (2013) showed that rainfall aggressiveness decreased with reduced rainfall during the drought.
IFM Agressivité PCI Concentration 0-60
60-90 90-120
120-160 >160
very Low Low Moderate Strong Very strong
8.3-10 10-15 15-20 20-50
50-100
Uniform Moderately seasonal Seasonal highly seasonal Irregular
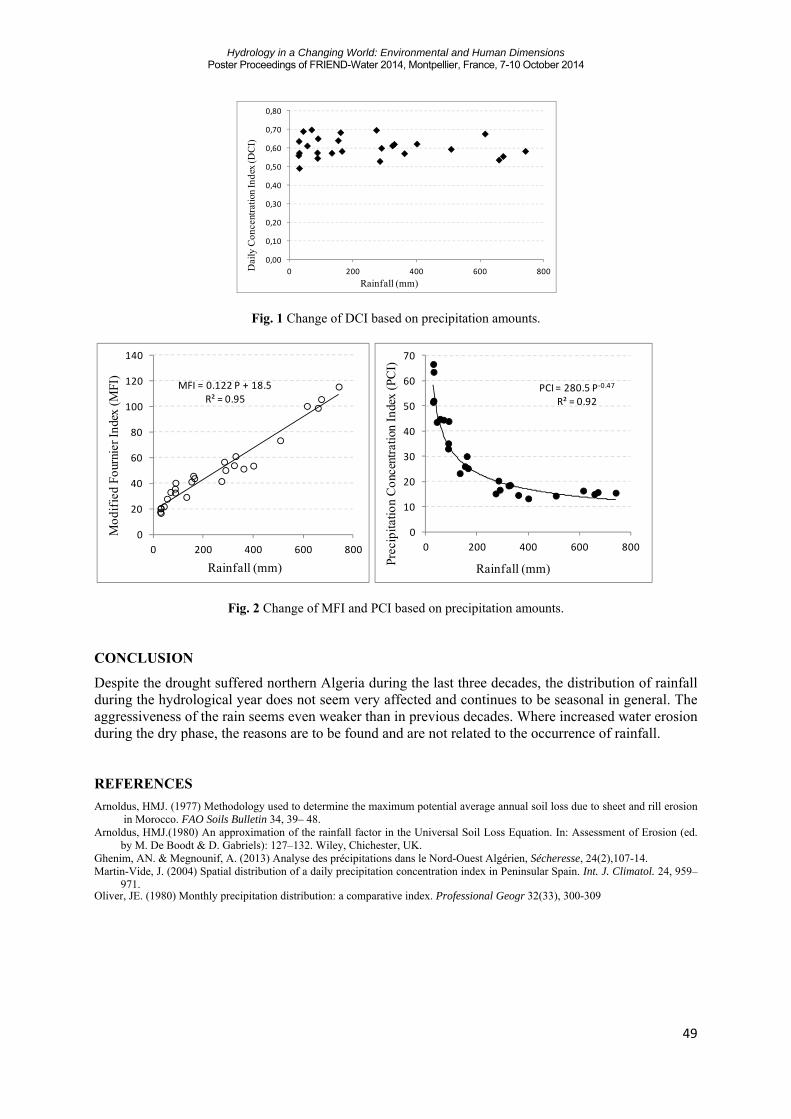
Hydrology in a Changing World: Environmental and Human Dimensions Poster Proceedings of FRIEND-Water 2014, Montpellier, France, 7-10 October 2014
49
Fig. 1 Change of DCI based on precipitation amounts.
Fig. 2 Change of MFI and PCI based on precipitation amounts. CONCLUSION
Despite the drought suffered northern Algeria during the last three decades, the distribution of rainfall during the hydrological year does not seem very affected and continues to be seasonal in general. The aggressiveness of the rain seems even weaker than in previous decades. Where increased water erosion during the dry phase, the reasons are to be found and are not related to the occurrence of rainfall. REFERENCES
Arnoldus, HMJ. (1977) Methodology used to determine the maximum potential average annual soil loss due to sheet and rill erosion in Morocco. FAO Soils Bulletin 34, 39– 48. Arnoldus, HMJ.(1980) An approximation of the rainfall factor in the Universal Soil Loss Equation. In: Assessment of Erosion (ed. by M. De Boodt & D. Gabriels): 127–132. Wiley, Chichester, UK. Ghenim, AN. & Megnounif, A. (2013) Analyse des précipitations dans le Nord-Ouest Algérien, Sécheresse, 24(2),107-14. Martin-Vide, J. (2004) Spatial distribution of a daily precipitation concentration index in Peninsular Spain. Int. J. Climatol. 24, 959– 971. Oliver, JE. (1980) Monthly precipitation distribution: a comparative index. Professional Geogr 32(33), 300-309
0,00
0,10
0,20
0,30
0,40
0,50
0,60
0,70
0,80
0 200 400 600 800Dai
ly C
once
ntra
tion
Inde
x (D
CI)
Rainfall (mm)
PCI = 280.5 P‐0.47
R² = 0.92
0
10
20
30
40
50
60
70
0 200 400 600 800
Prec
ipita
tion
Con
cent
ratio
n In
dex
(PC
I)
Rainfall (mm)
MFI = 0.122 P + 18.5R² = 0.95
0
20
40
60
80
100
120
140
0 200 400 600 800
Mod
ifie
d Fo
urni
er In
dex
(MFI
)
Rainfall (mm)

Hydrology in a Changing World: Environmental and Human Dimensions Poster Proceedings of FRIEND-Water 2014, Montpellier, France, 7-10 October 2014
50
Geophysical Techniques to Aquifer Locating and Monitoring, case study for Industrial Zones in North Hanoi, Vietnam
N.V.GIANG1, N.B.DUAN1, L.N.THANH2, N.HIDA3 1 Institute of Geophysics-VAST, Hanoi, Vietnam [email protected]; [email protected] 2 HCMC Institute of Resources Geography-VAST, HCMC, Vietnam 3 Akita University, Japan
INTRODUCTION The superficies of water from the lakes, rivers, streams, ponds are on the decrease and the quality of surface-water is polluted step by step, because of urbanization and industrialization rapidly in Vietnam. Groundwater supplying for socio-economic needs is increasing time by time in study area. The most wells are exploiting from 50 to 70 m of depths for two water purification plants and from 8 to 25 m of depths for upper aquifer by 12,000 families (65,000 residents) living there. The questions are: What is distribution of aquifers there? What is the quality of shallow Holocene aquifer and deeper Pleistocene aquifer? Is there connection between aquifers and interaction between two rivers? How is trend of changing for groundwater quality and quantity in this area by time? The above mentioned goals of this study are solved inexpensively by resistivity, electromagnetic, seismic techniques and hydrological analysis data. OVERVIEW OF RELIEF AND GEOLOGY OF THE STUDY AREA The study area is about 50 km2 and located on northern part of Hanoi, Vietnam. The area covers a segment of Red river in south and a segment of Ca Lo river in north with three monitoring wells. The climate of area is humid tropical monsoon with hot and wet summer and cold and dry winter. The area is elevated of 5-10m above sea level. During the Quaternary period the land of study area has been created through transgressions and regressions of the sea in 5 depositional cycles: (1) Early Pleistocene; (2) Middle-late Pleistocene (Q1
2-
3hn); (3) Late Pleistocene (Q13vp); (4) The end of Pleistocene and beginning of Holocene and (5) Late
Holocene. GEOPHYSICAL MEASUREMENTS AND INTERPRETATION DC Resistivity Technique DC resistivity techniques were used for study area include vertical electric sounding (VES) and electrical resistivity imaging (ERI) which measure earth resistivity by driving a direct current (DC) signal into the ground and measuring the resulting potentials (voltages) created in the earth. From that data the electrical properties of the earth (the geoelectrical section) can be derived and thereby the geologic properties inferred. Depth of investigation is a function of the electrode spacing. Vertical Electrical Sounding In the study area, 28 VES stations were carried out along 4 profiles by south-north direction. The SUPERSTING R1/IP + 4 electrodes made in AGI Geometrics (Agi, 2003) was used for VES measurements in the field by Schlumberger array with a maximum distance between the current electrodes C1C2 = 1000m and P1P2 = 100m. The pragmatic approach was used as modelling to interpreter VES data in which a starting model of the electrical resistivity distribution is constructed and updated after comparison of its calculated response with the observations. The criterion for geoelectrical interpretation is based on the range of resistivity values for different kind of sedimentary materials. The measured resistivity of samples are: Dry sand (1000-1200 m); Moistured sand (200-300 m); Saturated sand (50-80 m); Dry soil (120-140 m); Wet soil (20-30 m); Moistured clay (20-40 m); Saturated clay (10-20 m); Silt (12-15 m). The result of VES interpretation give useful information regarding two aquifers at -10 to -24m for shallow water table (Qh) by 15-50 m and at -30 to -60m for deeper water table (Qp) by 30-60 m. Groundwater in both aquifers is fresh because the values of resistivity calculated by geoelectrical data are in the range 15-60 .m. 2D Resistivity Imaging The 2D electrical resistivity imaging (ERI) bases on multi-electrode resistivity imaging (MRI) which is very popular and widely used in the survey to high resolution for hydrogeological investigations. Essentially, MRI is the method combines the traditional vertical electrical sounding and profiling and it therefore studied the changes in resistivity of the environment in both vertical and horizontal that allows solving the problem in 2D and 3D geological problems complexity. Equipment used in this case is SUPERSTING R1/IP + 56 electrodes. The measured data are processed by the 2D Earth-Imager software. The result of this process is inverted resistivity section. Then pseudo-section for line DM0412 (OW1) is established by measurement data and comparison with stratigraphy of monitoring borehole nearby which shows quite good correlation by 4 layers structure.

Hydrology in a Changing World: Environmental and Human Dimensions Poster Proceedings of FRIEND-Water 2014, Montpellier, France, 7-10 October 2014
51
There are two important layers from 13-25 m and 33-60 m of depth which correspond with aquifers Holocene Qh and Pleistocene Qp on location OW1. The same MRI technique was used to the location OW2 and OW3 of the study area. Seismic Refraction Technique The purpose of seismic refraction investigations is mapping bedrock, fracture zones, and delineation of geologic boundaries to constrain hydrogeologic model. Two seismic refraction profiles OW1 and OW2 were carried out at study area on the same line as ERI survey by MRI with the length of 560 m for each profile. Terraloc MK6 by 24 channels is used for collecting data. The result of seismic refraction by two profiles (OW1 and OW2) on the study area shows clearly interfaces for geological formation by seismic velocity values in the range of 500-2500 m/sec. There are 4 layers from surface to basement: First is a surface layer with seismic velocity in the range 500-1000 m/sec. Second is a subsurface layer with seismic velocity from 1000-1500 m/sec and the depth of layer is 12-25 m for profile OW1 and 8-20 m for profile OW2. This layer corresponds to shallow aquifer (Qh). Third is also a subsurface layer with seismic velocity from 1500-2000 m/sec, and the fourth is a deeper aquifer (Qp) with seismic velocity in the range 2000-2500 m/sec and the depth is on the range 37-57 m for profile OW1 and 32-46 m for profile OW2. The basement layer (bedrock) is 57 m deep for profile OW1 and 46 m for profile OW2 with seismic velocity over 2500 m/sec. Very Low Frequency Technique The Very Low Frequency (VLF) technique was used for assessment of environmental conductive of study area by Wadi instrument (ABEM) with 15-30 kHz frequency. In this case study, the geological formation is horizontally layered (by MRI data), but we expect to find weakness zones which correspond to hydraulic windows from surface to Qh and Qp. The results of geophysical application for groundwater to north Hanoi industrial zones show that complex geophysical techniques include electrical resistivity, seismic refraction and VLF can be very effective in the search for groundwater resources. The synthesis section of geophysical application for location OW1 on study area is shown in Fig.7 where the geological structure is delineated by 4 layers on the basis of the 2D MRI section and seismic velocity section. The current density section is identifying conductive zones. The geophysical boundaries can be used to estimate the depth of basement, geometry of aquifers or aquitards, geologic features for hydrogeological models. HYDROGEOLOGICAL FEATURE There are two aquifers. Holocene aquifer (Qh) is exposed to the surface, widely and continuously distributed from Red river to Ca Lo river. The depth to the groundwater level is 8-10m below the surface. It does mean that mainly rainwater, irrigation water and river water recharge to the aquifer during the rainy season. But, during the dry season, groundwater from this aquifer will be discharged to the river and to the underlying aquifers. Pleistocene aquifer (Qp) is the lower aquifer which distributed all over studying area. The depth to the top of the aquifer is 32-37 m and the bottom reach to bedrock basement about 50m. The groundwater in the Qp aquifer is fresh, with TDS 0.3g/l, mainly of calcium-bicarbonate type. CONCLUSIONS Geophysical methods as well as DC resistivity sounding/ 2D resistivity imaging, seismic refraction and VLF were effectively applied for location aquifers include mapping the depth and thickness of aquifer, mapping aquitards/confining units, locating conductive zones and assessment of hydrogeological conditions successfully for the study area. There are confirmed two aquifers on the basis of aggregate geophysical investigations and stratification of three monitoring wells. Holocene aquifer (Qh) is shallow and highly polluted but Pleistocene aquifer can be considered as potential groundwater aquifer. They are connecting by hydraulic windows. The groundwater potential reserve of two aquifers for study area is 17,800 + 38,700 = 56,500 m3/day and the safe amount of groundwater abstraction is 32,000 m3/day by steady state model estimation, amounts that can be considered as average for many years. Nowadays the water supply is 20,000 m3/day for industrial and about 12,000 m3/day for domestic use and the state model shows that the groundwater potential reserve is in the safe range of the dry season. However, with careful use and by reducing sources of pollution, groundwater here can continue to be an important natural resource in the future. Acknowledgments: This research is funded by Vietnam National Foundation for Science and Technology Development (NAFOSTED) under grant number 105.04-2011.05.

Hydrology in a Changing World: Environmental and Human Dimensions Poster Proceedings of FRIEND-Water 2014, Montpellier, France, 7-10 October 2014
52
Mise en évidence de la dynamique des aquifères en zone montagneuse dans la région de Bucaramanga (Colombie) par
l'usage de la géochimie isotopique
SULLY GOMEZ1, JEAN DENIS TAUPIN2, JOSE ALFREDO RUEDA1
1 Grupo en Predicción y Modelamiento Hidroclimatico, GPH, Universidad Industrial de Santander. Calle 9 carrera 27. Bucaramanga. Colombia. 2 UMR Hydrosciences (IRD, UM1, UM2, CNRS), Maison des Sciences de l’Eau, 300 avenue Jeanbrau, 34000, Montpellier, France. [email protected] INTRODUCTION Les conditions de circulation de l'eau dans les aquifères fracturés de montagne à forte pente sont souvent complexes et les études hydrogéologiques sont basées principalement sur la seule observation des résurgences en l'absence de forages. Les relations hydrodynamiques avec les aquifères sédimentaires des vallées sont aussi à quantifier car ces aquifères fracturés peuvent constituer une part de recharge non négligeable. Pour améliorer la compréhension de ce type d'hydrosystème compartimenté et les relations avec les aquifères des vallées, l'hydrochimie et l'isotopie (18O, 2H, 3H, 14C) s'avèrent des outils précieux dans la modélisation conceptuelle de la circulation de l'eau. ZONE D'ETUDE La région de Bucaramanga (département de Santander-Colombie- 520 000 habitants) se situe dans la partie haute du bassin versant du Rio Lebrija (800-3500 m d'altitude) sur la face ouest de la cordillère orientale. La zone d'étude (1280 km2), présente 80% de sa surface en zone de montagne à pentes fortes (Massif de Santander, 1000-3500 m) et 20% dans la partie basse correspondant a une zone urbanisée ondulée à plane (La Meseta). La zone est traversée par 4 rivières (Surata, Frio, Tona et rio de Oro) prenant naissance dans le massif. La précipitation (moyenne annuelle de 700 à 900 mm en plaine et jusqu'à 2000 m en altitude) a un comportement bimodal en relation avec le passage de la ZCIT, avec deux époques pluvieuses (mars‐mai, septembre‐novembre) et deux époques sèches dont celle de décembre à mars est la plus marquée. Le massif de Santander est constitué principalement de roches ignées et métamorphiques hautement fracturées et météorisées d'âge précambrien à paléozoïque et la Meseta par des dépôts alluviaux d'âge quaternaire (Formation Bucaramanga, Qbo-Qblr) surmontant le socle précambrien et primaire et des dépôts sédimentaires d'âge jurassique (Fig. 1). Les deux entités sont séparées par la faille régionale NW-SE de Bucaramanga. Les aquifères étudiés sont d'une part ceux compartimentés du massif de Santander (transmissivité entre 10-4 et 10-5 m2/s) et d'autre part ceux de la formation alluviale de Bucaramanga (2 niveaux aquifères d'épaisseur maximale 40 m et 180m séparés par un niveau fin de 20 m, direction de flux E-W avec une transmissivité moyenne de 3,1. 10-4 m2/s). L'étude hydrodynamique et géophysique dans le massif de Santander (Rueda, 2013) montre que la circulation de l'eau est contrôlée par le système de faille (circulation profonde) et les limites de partage des eaux (circulation superficielle dans la zone météorisée jusqu’à une profondeur de 40 m). RESULTATS La chimie effectuée sur 49 sources dans le massif de Santander montre un facies bicarbonaté calcique et sodique, identique à celle des roches environnantes avec une augmentation de la conductivité vers la zone basse. Deux points montrent des anomalies en sulfates que l'on peut relier à la présence de niveau de gypse dans certaines formations limitées de dépôts sédimentaires du secondaire ou éventuellement se rajoute une contamination agricole locale. La chimie des eaux de la Meseta montre des signes évidents de contamination dans l'aquifère superficiel avec des teneurs en Cl- et SO4
2- prédominantes que l'on ne
retrouve pas dans le niveau profond qui présente un facies normal HCO3--Ca2+/Na+. Cette
contamination peut être due soit à l'infiltration directe sur la zone urbaine de Bucaramanga soit aux fuites dans le réseau d'eaux usées sous la ville.

Hydrology in a Changing World: Environmental and Human Dimensions Poster Proceedings of FRIEND-Water 2014, Montpellier, France, 7-10 October 2014
53
Fig. 1 Géologie de la Meseta. Fig. 2 Composition en oxygène 18 des différents réservoirs.
Le signal isotopique mensuel des précipitations a été déterminé à partir d'un réseau altitudinal de stations situées entre 1000 et 3214 m d'altitude au cours des années 2004 à 2006. L'effet de masse en relation avec le passage de la ZCIT est fortement marqué (10‰ en 18O sur l'année). L'effet d'altitude sur la période montre un gradient pour 18O de -0,16‰ par 100 m. La droite météorique locale est marquée par un léger excès en deutérium 2H = 8,15 18O + 12,8, en relation avec l'effet d'altitude et le recyclage continental. La composition isotopique des sources et des forages s'aligne parfaitement sur la droite météorique locale. Les différentes sources échantillonnées dans le massif de Santander reproduisent assez parfaitement la droite orographique (Fig. 2) observée sur les précipitations, ce qui sous-entend que ces sources sont alimentées localement, circulant dans la zone météorisée et donc ont des temps de résidence probablement assez courts de l'ordre de l'année à quelques années. Trois points de source échantillonnés en 2011 présentent des teneurs plus enrichies qu'attendu qui pourrait être liées à une vitesse de transfert beaucoup plus courte que l'année et donc présentées une forte variation isotopique annuelle en fonction des caractéristiques du signal isotopique des pluies antérieures, l'échantillonnage a été fait au mois de février en fin de saison sèche correspondant ainsi a des teneurs isotopiques plus enrichies dans la pluie. Pour les forages échantillonnés sur la Meseta ou sur la faille de Bucaramanga, les teneurs en 18O apparaissent plus appauvries par rapport à leur altitude, ce qui signifie que cette eau s'est infiltrée à des altitudes plus élevées. Les forages de Pan de Azucar situés dans la zone de la faille dans les roches ignées et métamorphiques météorisées et fracturées, sont alimentés par des eaux dont l'altitude d'infiltration moyenne est autour de 2500 mètres d'altitude pour la partie profonde (prof. 50-80 m) et par des eaux dont l'altitude d'infiltration est de 2000 mètres pour la partie superficielle (prof. 20 m). Les deux forages captant les aquifères alluviaux superficiel et profond (zone de La Flora), sont rechargées respectivement à 1400 et 1900 m. d’altitude. En terme de circulation de flux, ces zones de recharge définissent une circulation profonde et lente a partir d'un système de failles qui affectent le massif de Santander et qui va recharger les aquifères les plus profonds dans la zone de la Meseta et une circulation plus superficielle et rapide dans la partie météorisée du massif rechargeant l'aquifère superficiel dans la zone basse. Les isotopes radioactifs du 3H et 14C le confirme bien, 9 3H (2003) et 2 14C (2011) ont été analysés dans les aquifères de la meseta. Les eaux de la nappe superficielle présentent des teneurs en 3H entre 1,9 et 2,7 UT et une activité en 14C de 92,7% ceux qui correspond à un renouvellement actuel des eaux. Au contraire les eaux de l'aquifère profond n'ont pas de 3H et le 14C a une activité de 62,4 %, donnant un taux de renouvellement supérieur à 2000 ans.
REFERENCES Rueda, J. A. (2013). Modelo hidrogeológico conceptual y revisión de la vulnerabilidad, amenaza y peligro a la contaminación del agua subterránea en la CSRL. Maestría en Ingeniería Civil. UIS.

Hydrology in a Changing World: Environmental and Human Dimensions Poster Proceedings of FRIEND-Water 2014, Montpellier, France, 7-10 October 2014
54
Statistical analysis for modeling the hydrological risk in Latin America and the Caribbean
ALFONSO GUTIÉRREZ1 & EDUARDO PLANOS 2
1 IFI Regional Coordinator. Queretaro University, Mexico
2 FRIEND Regional Coordinator. Institute of Meteorlogy, Cuba. Abstract: Latin America and the Caribbean is characterized both by the frequent occurrence of extreme rainfall, causing floods and severe damages to growing and by long periods of drought. It is therefore crucial, from a risk analysis point of view, to obtain a regional view of the probability of such events. This paper presents a stochastic model of rainfall distribution and its regionalization, taking into account the seasonal cycle. The work is bases in the modeling of 46 stations in México.
Key words: precipitation; rain intensity; maximum precipitation; i-f-d curves; enveloped curves, regionalization.
RAINFALL DISTRIBUTION MODEL The model is a Poisson white noise model, because it assumes that the length of the dry periods follows an exponential distribution and the rain depth of the wet periods (or rain events) is also exponentially distributed:
TT
TT
T
R
TTR
R
eRfT
T
2
),,(1
for all RT >0 (1)
where I1 is the modified first order Bessel function, is the mean event rain depth, and T is the mean
number of wet spells (or rain events) over the period T. This pdf is also known as the law of leaks. The parameter is a scaling parameter since it is invariant in time. In case of a stationary process, it is
possible to deduce easily the rain distribution for a period of length kTT ' , from the distribution of
the period of length T, using the following relationships: ' and TTk ' (2).
In the case of non stationarity, it is shown that: T
T dttT
0
)(1 . (3)
REGIONALISATION OF PARAMETERS Using a moving window algorithm developed by Le Barbé and Lebel (1997), daily estimates were computed over the rainy season (May to October), showing the seasonal cycle of the two parameters. While this cycle is relatively smooth for , allowing assuming stationarity between mid-July and beginning of September and slow trends outside of this period, the pattern is different for .The spatial pattern of is strongly commanded by the topography and remains similar all along the seasonal cycle.
Interestingly, a very different pattern is observed for . The maximum values of at the daily scale are located close to the coast indicating a stronger probability of heavy rain on the coastal hills rather than on the higher inland relief. The different spatial patterns displayed by the mapping of the two parameters has great implications in term of risk management since is a measure of the probability of heavy event rainfall –when it rains– while is a measure of the probability of occurrence of rain.

Hydrology in a Changing World: Environmental and Human Dimensions Poster Proceedings of FRIEND-Water 2014, Montpellier, France, 7-10 October 2014
55
Measure and mapping of the hydrological risk When the parent distribution is a leak distribution, then the distribution of the extreme values is exactly truncated Gumbel. As a matter of fact, if 21 jjMX is the maximal depth of the events observed between
day J1 and day J2, )( 21 yXP jjM can be computed as:
i
yi
jjM ei
eyXP
1!
)(0
21 (9)
which leads to: )/(
)( 21
yejjM eyXP
(10) 0)0( 21 jjMXP (11)
Expression (10) is the Gumbel distribution. The scale parameter of a leak distribution is thus
equal to the scale parameter of a Gumbel distribution, which means that mapping provides a useful representation of the risk of extreme rainfall over a given region.
CONCLUSION Regional modeling of the rainfall regime is the basic requirement in any attempt at evaluating these two risks of opposite nature. Mapping the two parameters of a simple alternating renewal model and studying their spatial pattern in relation with the topography of the region provides a useful characterization of the rainfall regime of Latin America and the Caribbean. It was first shown that the time-scaling properties of the model were verified for most of the 46 series used in the study. This allowed for characterizing the rainfall seasonal cycle, which varies from South to North and depending on the location of the station considered with respect to the coast and the topography. At the end of the rainy season (from mid-September to mid-October) it is clearly seen that the probability of rain diminishes drastically, while the probability of getting a heavy rainfall increases. This feature is typical of the hurricane regime prevailing at this period of the year. In average the wettest area are located near the coast in the south, and closer to the crests in the north, as a result of the transition from a humid tropical climate in the South to a semi-arid climate in the North with a proportionally higher influence of the topography. A comparative study showed that the estimate of the risk factor obtained from the model and from the direct fitting of a Gumbel distribution to a series of monthly maxima were consistent. However, since the model makes use of a larger set of data than the fitting of the Gumbel distribution a greater confidence is attached to the former.
REFERENCES Bo, Z., S. Islam, and E. A. B. Eltahir, 1994: Aggregation-Disaggregation Properties of a Stochastic Rainfall Model, Water
Resour. Res., 30(12), 3423-3435. Foufoula Georgiou, E., and K. P. Georgakakos. 1991. Hydrologic advances in space-time precipitation modeling and
forecasting. in D. S. B. a. P. E. Connell, editor. Recent Advances in the Modeling of Hydrological Systems. Kluwer Academic Publishers. P 47-65Foufoula Georgiou, E., and D.P.
Lettenmaier 1987. A markov renewal model for rainfall occurrences, Water Resour. Res., 23(5), 875-844 Kite G. W., (1988) “Frequency & risk analyses in hydr.” Water Resources Public. USA, 257p Le Barbé, L., T. Lebel, and D. Tapsoba, 2001. Rainfall variability in West Africa during the years 1950-1990. J. Climate, 15(2),
187-202 Le Barbé L., and Lebel, T., (1997) “Rainfall climatology of the HAPEX-Sahel region during the years 1950-1990” J. of
Hydrology 188-189, 43-73 Restrepo-Posada, J.-P. and P.E. Eagleson, 1982 “Identification of independent rainstorms”, J. of Hydrology, 55, 303-319 Rodriguez Iturbe, I., V. K. Gupta, and E. Waymire. 1984. Scale considerations in the modeling of temporal rainfall. Water
Resou.Res. 20:1611-1619. Thom, H.G., 1958. A note on the gamma distribution, Monthly Weath. Rev., 86(4), 117-12

Hydrology in a Changing World: Environmental and Human Dimensions Poster Proceedings of FRIEND-Water 2014, Montpellier, France, 7-10 October 2014
56
Trend changes in extreme and monthly stream flow of the Vah River
HALMOVA D., PEKAROVA P. & MIKLANEK P. Institute of Hydrology Slovak Academy of Science, Racianska 75, 831 02 Bratislava, Slovakia [email protected] STUDY AREA AND DATA
River Vah is the biggest left-side Danube River tributary and the second biggest river in Slovakia (Fig. 1a). The Bela River, tributary of the Vah River, is situated in the High Tatra Mountains with the highest degree of protection and it can be considered as the basin unaffected by human activity (Fig. 1b). Gauging station Vah-Liptovsky Mikulas is the final profile above the water reservoir Liptovska Mara, one of the largest reservoirs in Slovakia (Fig. 1b). Also for that reasons, it is useful to know the hydrological changes in the flow profiles.
a)
Bela
B. Vah
C. Vah
Boc
a
L. MARA
L. Mikulas
StrbskePleso
Podbanske
L.Hradok
10 km
Vah
Kasprowywierch
P O L A N D
S L O V A K I A
b)
Fig. 1 a) Map of Slovakia and river system in Slovakia; b) Scheme of the Vah River Basin up to Liptovsky Mikulas.
The contribution deals with the analysis of monthly and extreme flows regime at gauging stations Bela-Podbanske and Vah-Liptovsky Mikulas for the selected time periods. One of the extremes is the minimum flow tied with the hydrological drought. Analysis of the trends of minimum flows can predict its occurrence and minimize its negative impacts on society and the environment.
TREND CHANGES IN MONTHLY AND EXTREME STREAM FLOW
We quantify the variation in average monthly flows from long-term point of view. We may identify water or dry months during both measured periods and assessed whether the discharges with similar characteristics has occurred or not. For example, February (profile Bela-Podbanske) in the years 1929–1944 can be characterized as moderately dry to very dry. Period with similar characteristics have not occurred later. February of the years 1949 and 1997 we consider, on the basis of such criteria, for most aqueous month. We analyzed the monthly flows regime at both stations for the selected time periods. Four shorter periods 1929–1948, 1949–1968, 1969–1988 and 1989–2011 were subsequently analysed, too. The results show that the maximum monthly flow rate in each period occurred in May at both river basins. Minimum flows occurred in February and March at Bela-Podbanske and in January and February at Vah-Liptovsky Mikulas. This mode of maximum and minimum flows coincides with the regime flows in these altitudes.
Analysis of the monthly trend changes for two different periods gives us different results. Directive of trend lines for individual months for the period 1929–2011 and 1960–2011 suggest that a change in trend occurs in the months of November, December, July, September and October at Bela-Podbanske. Changes occur in the winter months (November, December and January) and the summer months (July, August and September) at Vah-Liptovsky Mikulas. Conversely, in the month of May,

Hydrology in a Changing World: Environmental and Human Dimensions Poster Proceedings of FRIEND-Water 2014, Montpellier, France, 7-10 October 2014
57
when occurring in those watersheds maximum flow rates, the trend does not change, remains growing for both periods at the Bela River Basin but on the contrary at the Vah River Basin trend remains downward.
Nowadays, we are more frequently faced to the information about the floods and their catastrophic consequences. At the same time, there is the general idea about the longer and more extreme droughts. Because of this, the first aim of hydrologists should be to verify these hypotheses and identify sources of mentioned changes. Rating extreme discharges is very important for example for assessing the impact of air temperature on the flow. The upper part of the Bela River Basin is particularly suitable for studying the effect of potential climate change or increased air temperature on drainage conditions in the basin. Analysis of trends in minimum flows can predict its development and minimize its negative impacts on society and the environment. It is important to note that the minimum flow is one of the characteristics that can define hydrological drought. Results of the trend analysis of extreme flows (Qmin, Q7 and Q30) are different. If we take into account the period of 83 years, we talked about upward trend, while the trend analysis of shorter observation period (52 years) suggests that individual extreme flow rates remain unchanged or very slightly sloping at Bela-Podbanske. At Vah-Liptovsky Mikulas there are no substantial or significant changes in trends in minimum flows, whether we analyzed period of 83 years or period of 52 years.
MANN-KENDALL NONPARAMETRIC TEST
The Mann-Kendall nonparametric test (M-K test) is one of the most widely used non-parametric tests for significant trends detection in time series. The nonparametric tests are more suitable for the detection of trends in hydrological time series, which are usually irregular, with many extremes. The M-K test detects trends at four levels of significance: α = 0.001, 0.01, 0.05 and α = 0.1. The results for the Bela River Basin (profile Bela-Podbanske) indicate trends at α=0.05 level of significance in February and November, and trends at α=0.1 level of significance in March and August for the time period 1929–2011. Guest shorter period 1960–2011 showed only the trend at α=0.1 level of significance in May. The trend at α=0.05 level of significance in November was established for the Vah River Basin (profile Vah-Liptovsky Mikulas) for the evaluation period 1929–2011. When evaluating a shorter time period 1960–2011 no significant trend was detected.
CONCLUSIONS
It is necessary to examine and evaluate trends in hydrological parameters of the longest series of observations. Then we can evaluate the trend changes in the event of changes in the basin (climate change, water management construction, vegetation changes, etc.). Trend analysis of hydrological drought is needed to estimate its impact in the future. It is also essential for the correct design of engineering structures (dams, weirs, flow adjustment and others) that should ensure the sustainable development of water management in the area of interest or mitigate the effects of potential drought periods. Acknowledgement: This work was supported by the Slovak Research and Development Agency under the contract No. APVV-0496-10 and the Research & Development Operational Programme funded by the ERDF under the project implementation: 26240120004 ITMS.

Hydrology in a Changing World: Environmental and Human Dimensions Poster Proceedings of FRIEND-Water 2014, Montpellier, France, 7-10 October 2014
58
Long-term observation records on hydraulic head and groundwater temperature in snowfall Northern Japan - what is
revealed NOBORU HIDA1 & NGUYEN VAN GIANG2 1 Akita University, Professor Emeritus, 247-0051 Kamakura-Shi, Iwase 1-8-3-723, Japan [email protected] 2 Vietnam Academy of Science and Technology, Institute of Geophysics, A8, 18 Hoang Quoc Viet, Cau Giay, Hanoi, Vietnam
INTRODUCTION Rokugo alluvial fan spreads about 4km east-west and about 5km north-south and lies in northern Japan. Inclined toward the west, the fan comprises the proximal site at 95m above sea level and the distal site at 45m above sea level. Made up of unconfined aquifer consisting of gravel-sand, it has 1,700mm annual mean precipitation and 130-150cm snowfall in January-February.
Piezometer nests were constructed at Nonaka (39º 25´ 02˝ N, 140º 33´ 55˝ E and Elv. of 64.19m) in the center of the fan and at Umamachi (39º 25´ 18˝ N, 140º 33´ 03˝ E and Elv. of 48.37m) in the distal fan. The wells at both sites were 20, 50, and 100m in depth. With screens set at the bottoms of respective wells, hydraulic heads and groundwater temperatures have been recorded every 10 minutes by using loggers for more than 20 years.
The purpose of this poster is to show some unique findings based on the records obtained by the piezometer nests. In addition, subtropical characteristics on hydraulic heads and groundwater temperatures which were recorded in the left bank of the Red River, Hanoi, are provided for comparison.
FINDINGS Hydraulic head at Nonaka Piezometer 1. Throughout the year, hydraulic heads get higher in the order of well depth with the 100m-deep well as the lowest. The differences of hydraulic heads between 20m and 50m are smaller than between 50m and 100m. 2. A rhythm is detected in annual changes of hydraulic heads. At depths of 20m and 50m, hydraulic heads are higher during the period for irrigating paddy rice fields and the snow-thawing season, whereas they are lower in the non-irrigation period, especially in midwinter, namely January-February. As to annual performance of the 100m-deep well, hydraulic heads are lower in February-March and higher in August. 3. A daily precipitation of 30mm or more temporarily raises hydraulic heads at 20m and 50m. An artificial recharge basin operated about 270m east of Nonaka piezometer causes a rise of hydraulic heads at 20m and 50m (Hida & Kagabu, 2009). Groundwater temperature at Nonaka Piezometer 1. Certain changes occur annually in groundwater temperatures at depths of 20m, 30m, 40m and 50m. Groundwater temperatures at 20m are the lowest in early summer, namely around July, and the highest in winter, especially in January-February. The difference between the lowest and the highest reaches 4℃. Groundwater temperatures at 30m are the lowest in summer, namely around June, and the highest in November-December. The difference between the lowest and the highest at 30m is also 4℃. 2. Groundwater temperatures in summer change vertically, and the water gets warmer as the wells get deeper. On the other hand in winter, temperatures are higher at 20 and 30m than at 40 and 50m. 3. It can be considered as a tendency that groundwater temperatures at 100m have been rising.
Hydraulic head at Umamachi Piezometer 1. Hydraulic heads both at 20m and 50m indicate almost the same value during the period of low water

Hydrology in a Changing World: Environmental and Human Dimensions Poster Proceedings of FRIEND-Water 2014, Montpellier, France, 7-10 October 2014
59
levels. At 50m, however, hydraulic heads are sometimes higher than those at 20m. This is the result that groundwater around 50m is confined in the distal fan. 2. The differences of hydraulic heads between 20m and 50m are smaller than between 50m and 100m also at Umamachi. 3. As Nonaka, a rhythm is also found in annual changes of hydraulic heads. At depths of 20m and 50m, hydraulic heads are high in the irrigation period and the snow-thawing season, and low in the non-irrigation peirod and midwinter. Hydraulic heads at a depth of 100m shows higher in August-September and lower in February. 4. Hydraulic heads at 20 and 50m decline rapidly in every January-February. This is due to a pumping well used for melting snow on the roads during the winter. The pumping well, of which screen is installed at a depth of 50m, is located about 100m away from Umamachi piezometer. Groundwater temperature at Umamachi Piezometer 1. Annual changes of groundwater temperatures are repeated at 20m and 50m. At 20m, the temperatures are the lowest in June (in May for some years), and the highest is recorded around December. The difference between the lowest and the highest is 2-3℃. Residents using a water spring in the distal fan say, “The groundwater becomes colder in summer and warmer in winter.” 2. Groundwater temperatures at 20m and 50m fluctuate only in winter because of the pumping well used for melting snow on the roads. 3. As a long-term tendency, groundwater temperatures have been rising. In the left bank of the Red River, Hanoi A piezometer of 60m in depth, which was constructed in the left bank of the Red Rover, Hanoi (Giang & Hida, 2009), recorded the following phenomena: Hydraulic heads decline due to the increase of pumping amount (Hida & Giang, 2012). Annual changes of the Red River’s water levels affect annual changes of hydraulic heads. Groundwater temperatures stabilize to be 26-27℃ throughout the year. These numeric values show one of the characteristics of groundwater temperatures in subtropical Southeast Asia. CONCLUDING REMARKS This poster demonstrates that long-term hydrological data collected is essential to the basic understanding of hydrological processes. Modeling, in particular, should be performed based on steady field observations. Acknowledgement This study was supported by JSPS KAKENHI: Grant-in-Aid for Challenging Exploratory Research, No.23650578 in 2011-2013. REFERENCES Giang, N.V. & Hida, N. (2009): Study of hydrological characteristics and hydrogeological conditions for management of
aquifer recharge in NW Hanoi area. Journal. of Geologia, Uczelniane wyd. Naukowo-dydaktyczne AGH, Krakow Tom 35(2/1), 463-472.
Hida, N. & Kagabu, M. (2009): Managed aquifer recharge (MAR): the relationship between surface water temperature in recharge basin and groundwater temperature-The case of the Rokugo alluvial fan, in northern Japan. Journal of Japanese Association of Hydrological Sciences .38(3), 117-122.
Hida, N. & Giang. N. V. (2012): Decline in groundwater levels in Thang Long Industrial Park within the area of Northwest Hanoi, Vietnam. Journal of Japanese Association of Hydrological Sciences 42(4), 167-172.

Hydrology in a Changing World: Environmental and Human Dimensions Poster Proceedings of FRIEND-Water 2014, Montpellier, France, 7-10 October 2014
60
Estimation of Evapotranspiration from Pasoh Forest Reserve in Malaysia using Remote Sensing Data
Ab. L. IBRAHIM, M. H. P. RAMLI, T. H. TAM Institute of Geospatial Science and Technology (INSTeG), Universiti Teknologi Malaysia, MALAYSIA [email protected] INTRODUCTION The rate of evapotranspiration (ET) is one of the important components in hydrological cycle. Knowledge regarding ET is very useful in understanding the rate of water consumption by plants or vegetation and can be used to assist water resources management for agricultural activities. The value of ET can be obtained using direct measurement with an installation of a lysimeter and also using empirical formulas (Thornthwaite, 1948; Penman, 1948; Monteith; 1973; Priestley and Taylor, 1972). All these empirical formulas required meteorological data such as temperature, relative humanity, wind speed, solar radiation as input for the calculation of ET. These parameters are sometimes quite difficult to obtain particularly in most of the catchment areas in tropical regions. These problems have cause some errors or inaccuracy. The advancement of remote sensing technology enable that extraction of evapotranspiration values using various kind of remote sensing satellite images. The main objective of this study is to estimate the rate of ET using remote sensing data. STUDY AREA The study was carried out in the Triang watershed, Peninsular Malaysia (Figure 1).
Fig. 1 Location of study area (Green box shown the location of Kota Tinggi city).
MATERIALS AND METHODS The main data used in this study is Landsat ETM+ data. Surface Energy Balance Algorithm for Land (SEBAL) model was used to extract various parameters required for the calculation of ET. According Irwandee Reduan (2004), SEBAL Model is a mathematical processing involving 20 levels to get the value of ET. The main parameters in this model is the relative humidity, temperature, radiation, energy balance, aerodynamic roughness length and wind speed. Most studies using this model are only applied in agricultural areas which have the form of a flat area. λEt24 = Et024 x ^ (mm/day) (1)

Hydrology in a Changing World: Environmental and Human Dimensions Poster Proceedings of FRIEND-Water 2014, Montpellier, France, 7-10 October 2014
61
λEt24 = actual evapotranspiration for 24 hours Et024 = potential evaportanspiration for 24 hours ^ = evaporative fraction RESULTS AND DISCUSSIONS Parameters extracted from remote sensing data included albedo, Normalized Differentiate Vegetation Index (NDVI), surface emissivity, surface temperature, reflected short-wave radiation, emitted long-wave radiation, radiation budget and soil heat flux are shown Figure 2. All these information is then input into the SEBAL model for the calculation of ET.
(a) (b) (c)
(d) (e) (f)
(g) (h) (i)
Fig. 2 (a) albedo, (b) NDVI, (c) surface emissivity, (d) surface temperature, (e) reflected short-wave radiation, (f) emitted long-wave radiation, (g) radiation budget, (h) soil heat flux and (i) ET. CONCLUSION Remote sensing data can be used to extract information required by SEBAL model to calculate ET. Acknowledgements We would like to acknowledge Universiti Teknologi Malaysia for providing financial assistant to carry out this research project. REFERENCES Monteith, J.L., 1973. Principles of Environmental Physics. Elsevier, New York, New York, 241 pp. Penman, H.L., 1948. Natural Evaporation From Open Water, Bare Soil and Grass. Proc. Roy. Soc. London, A193:120-146. Priestley, C.H.B. and R.J. Taylor, 1972. On the Assessm Priestley, C.H.B. and R.J. Taylor, 1972. On the Assessment of Surface Heat Flux and Evaporation Using Large Scale Parameters.
Mon. Weath. Rev. 100:81-92. Thornthwaite, C.W., 1948. An Approach Toward a Rational Classification of Climate. Geograph. Rev. 38 (1):55-94

Hydrology in a Changing World: Environmental and Human Dimensions Poster Proceedings of FRIEND-Water 2014, Montpellier, France, 7-10 October 2014
62
Bilan hydrologique du bassin versant de l’Agneby (Côte d’Ivoire): application du modèle hydrologique nTopAmma
BAMORY KAMAGATE1, LUC SEGUIS2, ZILE ALEX KOUADIO, CHRISTOPHE PEUGEOT2, ISSIAKA SAVANE1 & TIE ALBERT GOULA BI1 1. Laboratoire de GéoSciences et Environnement, Université Nangui Abrogoua, 02 BP 801 Abidjan 01, Côte d’ivoire, [email protected] 2. HydroSciences Montpellier, Université de Montpellier 2, 34095 Montpellier cedex 5, France INTRODUCTION
Depuis trois décennies, l’Afrique de l’Ouest sous régime de mousson est perturbée par une péjoration climatique plus ou moins sévère (Mahé et al., 2000, Lebel & Vischel, 2005) qui se caractérise par une diminution de la pluviométrie et une baisse encore plus importante du débit des cours d’eau. Dans ce contexte, le bassin versant de l’Agneby a connu pendant les 30 dernières années, un déficit pluviométrique de l’ordre de 10%. Tributaires de la pluviométrie, les écoulements y ont enregistré un déficit hydrométrique de près de 46%. Outre le déficit hydro-pluviométrique, ce bassin a subit un taux de dégradation de son couvert végétal de l’ordre de 2,01% sur la période 1990-2001 (Kouadio, 2011) qui devra affecter le régime des écoulements.
Dans la Haute Vallée de l’Ouémé au Bénin, plusieurs travaux (Kamagaté, 2006 ; Séguis et al., 2011) ont établi que l’écoulement provient majoritairement de la vidange de nappes perchées superficielles. Ces nappes saisonnières alimentant les rivières de par leurs superficialités et leurs faibles capacités sont très sensibles à toute modification de la distribution des précipitations. Ces résultats viennent éclairer le schéma de formation des écoulements en Afrique de l’Ouest humide. La question est de vérifier si le fonctionnement établi sur l’Ouémé est une singularité ou s’il peut être généralisé à l’ensemble des cours d’eau soudaniens sur socle. L’objectif principal de ce travail est de modéliser la variabilité des composantes du cycle de l’eau sur le bassin versant de l’Agneby.
MATERIEL ET METHODE Le bassin de l’Agneby, situé au sud-est de la Côte d’Ivoire couvre une superficie d’environ
8490 km² (Fig. 1).
Fig. 1 Localisation du bassin versant de l’Agneby.
Le Lay et al. (2008) ont mis au point le modèle nTopAmma caractérisé par 2 réservoirs dont seul le superficiel draine vers les rivières. L’état hydrique du bassin repose sur le déficit à saturation qui représente la quantité d’eau qu’il faudrait infiltrer pour faire affleurer la nappe à l’échelle d’un versant. Les données journalières de pluies, de débits, d’évapotranspiration et de MNT sont nécessaires à la mise en œuvre du modèle calé sur la période 1980-2000. Les paramètres du calage sont : M, le paramètre de décroissance de la transmissivité qui donne un indice sur l'épaisseur efficace de sol où ont lieu la majorité des écoulements ; do est le déficit maximal à saturation qui représente la quantité d’eau maximale qu’il faudrait infiltrer pour faire affleurer la nappe à l’échelle d’un versant ; Ko, la conductivité latérale quand le sol est saturé ; le rapport do/M (doRatio) et Vriver, la vitesse en rivière.

Hydrology in a Changing World: Environmental and Human Dimensions Poster Proceedings of FRIEND-Water 2014, Montpellier, France, 7-10 October 2014
63
RESULTATS Les dix meilleurs jeux de paramètres correspondant aux meilleures valeurs de Nash sont indiqués dans le tableau 1 ci-dessous. Les hydrogrammes observé et calculé correspondants à la plus forte valeur de Nash (0.62) sont indiqués dans la figure 2 ci-dessous. Les débits de base semblent être mieux simulés tandis que les pics de crue restent à améliorer.
Tableau 1 Les dix meilleurs jeux de paramètres issus du calage du modèle
Fig. 2 Débits calculés et débits simulés pour un Nash de 0.62. CONCLUSION A ce stade de la mise en œuvre du modèle, le Nash maximum obtenu est de 0.62. Cette valeur reste à améliorer pour une meilleure représentation des pics de crue. Les différents termes du bilan hydrologique feront l’objet d’une autre étude. REFERENCES Beven, K. (1989) Changing ideas in hydrology:the case of physically-based models. Journal of Hydrology 105, 157-172. Kamagaté B. (2006) Fonctionnement hydrologique et origines des écoulements sur un bassin versant de milieu tropical de socle au
Bénin : bassin versant de la Donga (haute vallée de l’Ouémé). Thèse de Doctorat, Université de Montpellier II, France. Le Lay M., Saulnier G.-M., Galle S., Séguis L., Métadier M. & Peugeot C. (2008) Model representation of the Sudanian hydrological
processes: application on the Donga catchment (Benin). Journal of Hydrology, 363, 32–41. Lebel T. & Vischel T. (2005) Climat et cycle de l’eau en zone tropicale : un problème d’échelle. Compte Rendu Geosciences, 337,
29-38. Mahé G., Olivry J-C., Dessouassi R., Orange D., Bamba F. & Servat E (2000) Relation eaux de surface – eaux souterraines d’une
rivière tropicale au Mali. Compte Rendu Académie des Sciences, 330, 689-692. Séguis L., Kamagaté B., Favreau G., Descloitres M., Seidel J.-L., Galle S., Gosset M., Le Barbé L., Malinur F., Van Exter S., Arjounin
M., Bubkraoui S. & Wubda M (2011) Origins of streamflow in a crystalline basement catchment in a sub-humid Sudanian zone: The Donga basin (Benin), West Africa. Journal of Hydrology 402, 1-13.
M Ko doRatio Vriver Nash
0.10 25 6.0 0.100 0.57 0.15 15 5.5 0.100 0.58 0.10 25 6.0 0.075 0.60 0.10 20 5.5 0.075 0.55 0.15 20 6.0 0.100 0.59 0.15 15 5.5 0.075 0.61 0.20 15 5.5 0.100 0.55 0.15 20 6.0 0.075 0.62 0.10 15 5.5 0.075 0.60 0.15 25 6.0 0.075 0.54

Hydrology in a Changing World: Environmental and Human Dimensions Poster Proceedings of FRIEND-Water 2014, Montpellier, France, 7-10 October 2014
64
Groguida
Station
Bac Sicor
Station
Braffedo
n
Kpanda
Station
Atlantic Ocean
Grand‐Lahou Lagoon
system
Mouth of
Boubo River
Mouth of
Bandama River
Hydrology and hydrochemistry of the waters in the construction area of the fishing port canal of Grand-Lahou, Côte d'Ivoire
KOUAKOU SERAPHIN KONAN1,3, KOUAKOU LAZARE KOUASSI1, KOUASSI INNOCENT KOUAME2, AKA MARCEL KOUASSI3, DAGO GNAKRI1 1 Université Jean Lorougon Guédé, BP 150 Daloa, Côte d’Ivoire [email protected] 2 Université Nangui Abrogoua, 01 BP 10588 Abidjan 01, Côte d’Ivoire 3 Centre de Recherches Océanologiques, BP V18 Abidjan, Côte d’Ivoire CONTEXT AND PROBLEMATIC In order to develop fishing activities and generate revenues for local population of Grand-Lahou (Côte d’Ivoire), the Ivorian government built a fishing school with a small harbor for practical activities in the lagoon and in the sea. But, the boats of the fishing school cannot sail to the Atlantic Ocean because the depth of the estuary is shallow for the mouth of Bandama River. The river is affected by a continuously accentuated dynamism which generally results in displacements of the point of junction river-sea (Wognin et al., 2007; Konan et al., 2009). Sediment dynamics is even more spectacular as a consequence of the successive deposits of sediments creating sandy banks which render sailing difficult and dangerous. To allow boats to sail from the harbor to the sea, the construction of a canal is planned and the project must start very soon. This study aims to characterize the current state of the Grand-Lahou lagoon system and make proposals for the preservation of the ecosystem. METHODOLOGICAL APPROACH The physico-chemical characteristics of the lagoon were studied through twelve (12) measurement campaigns conducted monthly from January 2010 to December 2010. These series of measurements and sampling were carried out in four (4) stations where transfers are made of different water masses that feed the estuary area of Grand-Lahou (Figure 1). The samples were carefully stored at low temperature (T ≤ 4 °C), in a cooler and were analyzed in the laboratory.
Fig. 1 Location of the estuary of Grand-Lahou

Hydrology in a Changing World: Environmental and Human Dimensions Poster Proceedings of FRIEND-Water 2014, Montpellier, France, 7-10 October 2014
65
RESULTS
Hydrological characteristics of the estuary of Grand-Lahou
Fig. 2 Variation of the average monthly precipitation (a) and average monthly values of flow: (b) Bandama River and (c) Boubo River from 2000 to 2010
Table 1. Physico-chemical characteristics of the estuary waters of Grand-Lahou
Stations
Temp. (°C)
Sal. (‰)
O2 (mg/L)
pH
Turb. (NTU)
PO43-
(mg/L) NO3
- (mg/L)
NO2-
(mg/L)
Bac
Sic
or Minimum 20,73 1,19 2,3 6,62 39,35 0,05 0,05 0,06
Maximum 30,84 23,44 25,87 8,39 53,3 0,25 0,26 0,62
Moyenne 27,50 12,87 7,08 7,75 44,26 0,16 0,13 0,38
Ecart Type 2,83 8,85 6,23 0,60 5,02 0,08 0,09 0,27 CV (%) 10 69 88 8 11 51 68 73
Gro
guid
a Minimum 25,72 10,23 0,7 6,58 34,8 0,05 0,01 0,03
Maximum 30,16 24,75 19,77 8,33 39,4 0,40 0,12 0,52
Moyenne 28,32 18,95 5,75 7,74 36,51 0,17 0,07 0,25
Ecart Type 1,29 5,66 4,83 0,66 1,39 0,16 0,05 0,21 CV (%) 5 30 84 9 4 96 73 84
Kp
anda
Minimum 17,36 0,95 0,9 6,63 32,20 0,14 0,00 0,12
Maximum 28,14 32,70 7,275 8,49 107,3 0,40 0,52 0,79
Moyenne 28,32 18,95 5,75 7,74 36,51 0,25 0,23 0,32
Ecart Type 2,87 11,36 1,90 0,61 21,22 0,12 0,22 0,31 CV (%) 10 60 33 8 58 49 96 99
Bra
ffed
on Minimum 26,30 0,05 0,20 6,6 36,4 0,13 0,00 0,04
Maximum 27,68 29,71 6,73 8,28 120,70 0,35 0,83 0,68
Moyenne 28,32 18,95 5,75 7,74 36,51 0,27 0,35 0,37
Ecart Type 0,74 11,29 1,95 0,62 24,52 0,10 0,35 0,35
CV (%) 3 60 34 8 67 35 101 96
REFERENCES Konan KS, Kouassi AM, Adingra AA, Gnakri D. 2009. Spatial and temporal variation of fecal contamination indicators in Graand- Lahou lagoon, Côte d’Ivoire. Journal of Applied Biosciences, 23: 1422-1435. Wognin V, Monde S, Coulibaly A, Kouassi KL, Adopo L, Affian K and Aka K. 2008. Waters Model Circulation in the Estuary of Bandama. Rivers Flows and Tide condition’s Incidence. European Journal of Scientific Research, 19 (2): 304-314.
0
100
200
300
400
500
J F M AM J Jt A S O N D
Pluiviométrie (m
m)
a b

Hydrology in a Changing World: Environmental and Human Dimensions Poster Proceedings of FRIEND-Water 2014, Montpellier, France, 7-10 October 2014
66
Network of Russian and former Soviet research watersheds as a framework for comprehensive model evaluation and improvement LYUDMILA LEBEDEVA1,4 & OLGA SEMENOVA2,3,4 1 Nansen Environmental and Remote Sensing Centre, 14 Line VO, 7, 199034 St. Petersburg, Russia [email protected] 2 Gidrotehproekt Ltd., Toreza pr. 44, St. Petersburg, Russia 3 St. Petersburg State University, Universitetskaya nab. 7-9, St. Petersburg, Russia 4 Hydrograph model Research Group, St. Petersburg, Russia, URL: www.hydrograph-model.ru INTRODUCTION
Within current advancement state of hydrological modelling there are often reported extensive calibration of parameters and model structures, using runoff as the only metrics for model evaluation, application of inappropriate algorithms, concentration on catchment specific models and parameter sets, neglecting a single physical basis of hydrological processes (Beven, 2001; Vinogradov & Vinogradova, 2010; Semenova et al., 2013). Lack of observational data is one of the widely discussed reasons of the listed obstacles. Remote sensing data, digital elevation models, natural tracers, pedotransfer functions, biological indicators, ‘soft’ or ‘fuzzy’ data, and ‘secondary data’ are widely used in hydrological modelling, but can hardly lead to better understanding of hydrological processes and their proper representation (Sidle, 2010). Our research goal was to introduce a dataset of 19 long-term research watersheds in Russia and former Soviet Union for comprehensive evaluation and improvement of model structures and parameter sets. DATASET
The proposed dataset includes observational data from the 19 research watersheds in Russia and former Soviet Union (so called water-balance stations) with an area ranging from 4.9 to 1930 km2 (Fig. 1). This set of research basins can be considered as unique for the task of hydrological models evaluation and improvement due to the following reasons: A. extensive hydrometeorological and associated observations were conducted in each station
according to single program with identical equipment (as far as possible); B. period of observation varies from 10 to 50 years. The first observations were started in 1929,
majority of the watersheds operating from 1930th-1950th to late 1980th. Observations in 4 out of 19 stations have been conducted up to now;
C. research watersheds were selected to be representative for the surrounding territories in terms of the climates, landscapes and dominant hydrological processes;
D. network covers major climatic and landscape zones of Russia and former Soviet Union, including taiga, forest-steppe, steppe, desert, permafrost areas and mountainous regions;
E. observational data are accompanied by detailed description of relief, soil, vegetation, climate, geology, measuring techniques and supportive maps, that allow linking the hydrometeorological processes to the natural conditions.
The observational program of water balance stations included meteorological measurements, runoff, overland and subsurface flow, network of precipitation gauges, snow point observations and snow surveys, snow sublimation, evaporation from land and water surfaces, soil moisture and soil temperature at different depths, freeze-thaw depths, groundwater levels, streamflow turbidity, suspended material and chemical composition. The temporal resolution varied from minutes to decades. All of the observations were conducted continuously throughout a number of years. For a long time these data were available in hard copies and in Russian language only. It’s a reason that the proposed dataset is still studied fragmentarily. We have been digitizing main part of it and making it freely available on our website: http://hydrograph-model.ru/. Our idea is to initiate a comparison of different modelling approaches under the challenging conditions of multiple Russian research watersheds. Some of the latter were already used for hydrological model development and

Hydrology in a Changing World: Environmental and Human Dimensions Poster Proceedings of FRIEND-Water 2014, Montpellier, France, 7-10 October 2014
67
validation that confirmed the high degree of data relevance (Kuchment et al., 2000; Gusev et al., 2006; Semenova et al., 2013; Lebedeva & Semenova, 2013).
Fig. 1 Scheme of the water-balance stations location (marked as stars)
CONCLUSION
The developed dataset of 19 research watersheds in Russia and former Soviet Union is supposed to be of high importance to hydrological modelling community since the long-term detailed observations can be used to:
(a) analyze the hydrological processes in different geographic conditions; (b) validate the hydrological, environmental or land surface models; (c) assess the model parameters a-priori and avoid the calibration procedure in model
development and implementation; (d) evaluate the performance of the various internal blocks of hydrological models (soil
moisture and temperature, overland and subsurface flow, snow distribution, groundwater levels, etc.);
(e) compare different modelling approaches and parameterizations.
Acknowledgements The reported study was partially supported by RFBR, research project No. 12-05-92607. REFERENCES Beven, K. J. (2001) Dalton Medal Lecture: How far can we go in distributed hydrological modelling? Hydrology and Earth System
Sciences, 5 (1), 1-12. Gusev Y., Nasonova O. & Dzhogan L. (2006) The simulation of runoff from small catchments in the permafrost zone by the SWAP
model (in Russian). Water Resources 33(2),133–145. Kuchment L.S., Gelfan A.N. & Demidov V.N. (2000) A distributed model of runoff generation in the permafrost regions. J. Hydrology,
240(1-2), 1-22 Lebedeva L. & Semenova O. (2013) Coupled modelling of soil thaw/freeze dynamics and runoff generation in permafrost landscapes,
Upper Kolyma, Russia. IAHS Publ. 360. Cold and Mountain Region Hydrological Systems Under Climate Change: Towards Improved Projections. IAHS Press, 118-124
Semenova O., Lebedeva L. & Vinogradov Yu. (2013) Simulation of subsurface heat and water dynamics, and runoff generation in mountainous permafrost conditions, in the Upper Kolyma River basin, Russia. Hydrogeology J. 21(1), 107 – 119.
Sidle, R. C. (2006) Field observations and process understanding in hydrology: essential components in scaling. Hydrol. Process., 20: 1439–1445. doi: 10.1002/hyp.6191
Vinogradov Yu. & Vinogradova T. (2010) Mathematical modelling in hydrology (in Russian). Academia, Moscow.
Hydrology in a Changing World: Environmental and Human Dimensions Poster Proceedings of FRIEND-Water 2014, Montpellier, France, 7-10 October 2014
68
Is the Cox-Stuart test for trend really insensitive to autocorrelation?
ONDREJ LEDVINKA Hydrological Database & Water Balance, Czech Hydrometeorological Institute, Na Sabatce 2050/17, 143 06 Prague 412 – Komorany, Czechia [email protected]
Key words Cox-Stuart test; trend analysis; time series; serial correlation; Monte Carlo simulation; statistical hydrology
INTRODUCTION
During past decades, both scientist and engineers have been interested in climate change and its reflectance in various climatological and hydrological variables. Without a doubt, one of the most studied components of time series has been trend. In hydrology, especially nonparametric tests such as the Spearman’s rho test or the Mann-Kendall test have been used widely. They power may be almost equal to the power of parametric ones, but the main reason why hydrologists employ them lies in the fact that they do not require Gaussian-distributed data, that the data need not be complete or that the trends need not be linear. Especially, the theory of the Mann-Kendall test has developed essentially, and many of its modifications for hydrological purposes have emerged in literature (Hamed & Rao, 1998; Hamed, 2008, 2009; Yue et al., 2002; Yue & Wang, 2004). Since the second half of 2000s, some investigators have recommended another nonparametric test that is capable to detect linear and nonlinear trends in geophysical time series – the Cox-Stuart (CS) test (e.g. Niedzielski & Sen, 2010; Fatichi et al., 2009). Sen & Niedzielski (2010) even state that this test is advantageous in that it, unlike the Mann-Kendall test, is insensitive to autocorrelation (serial correlation) possibly present in hydrological series. However, other statistical literature suggests independent data before applying the CS test (e.g. Sprent & Smeeton, 2007). The scope of current investigation was therefore to find out how and to what extent the autocorrelation influences the results brought by the CS test and if the dependence among data could be really neglected. This was done through Monte Carlo experiments. METHODS
Cox & Stuart (1955) proposed several nonparametric tests whose power should be similar to other nonparametric counterparts. At the same time it was intended to acquire such a test whose statistic would be computationally simpler. For trend detection a test that considers signs instead of ranks was suggested.
First, the series },...,,{ 21 nt xxxX need to be divided into two halves )1(
iX and )2(
iX , each of which
has a length of 0n . If n is odd number, the 2/)1( n -th element is deleted. The test statistic is defined as follows (Niedzielski & Sen, 2010):
0
1
n
iiYT (1)
where
otherwise0
if1 )2()1(ii
i
XXY (2)
The statistic obeys a binomial distribution ),(~ pLBT with 5.0p and L denoting the number of
nonzero iY . If 20L , the decision on the rejection of null hypothesis of no trend should be made based
on the binomial distribution. For large L values (e.g. 20L ) an approximation by a Gaussian distribution may be utilized. In this case, for instance, the statistic Z defined as:
2
2
L
LTZ
(3)
obeys the standard Gaussian distribution (Luo, 2013).

Hydrology in a Changing World: Environmental and Human Dimensions Poster Proceedings of FRIEND-Water 2014, Montpellier, France, 7-10 October 2014
69
Monte Carlo simulations were conducted in similar spirit as in Yue et al. (2002). In essence, pure white noise εt mixed with lag-one autoregressive process, AR(1), was repeatedly generated as follows: ))1(,0(~,)( 2
12
11 XttXtXt NXX (4)
To be close to unitized average annual discharges, the series Xt had mean 1X and variance 5.02 X. The analysis using the CS test was then done separately for samples of length n = 20, 50, 100, 150 with autocorrelation coefficient ρ1 ranging from –0.9 to 0.9 (by the step of 0.1). Subsequently, for each set of simulated samples, the rejection rate (ERI), representing the type I error of the test, was computed according to: NN rejERI (5)
where Nrej was the number of statistics T falling in the critical regions and N was the total number of simulations (N = 1000 here). RESULTS AND DISCUSSION
If the autocorrelation had no influence on findings obtained by the CS test, ERI should correspond to the nominal level of significance α (ordinary set to 0.05). It was found, however, that this situation occurs only when time series are correlated with certain value of ρ1. Even in case, when the series comprises of white noise only (ρ1 = 0), and one would expect abovementioned, it does not apply. There is also strong dependence on sample size. For example for n = 20, ERI would be equal to α if the series was contaminated by AR(1) with ρ1 = 0.3. This indicates that the autocorrelation may sometimes be beneficial when detecting trends by means of the CS test. In general, ERI decreases with decreasing ρ1, no matter how long the series is. The autocorrelation acts in similar way as in case of the Mann-Kendall test (see Yue et al., 2002), viz. it alters the variance of the statistic T. This was also apparent from comparison of normal curves approximating the distribution of T computed for different coefficients ρ1. CONCLUSION
Although some literature devoted to detecting trends recommends the Cox-Stuart test as being insensitive to autocorrelation, the opposite is true. Similarly as in case of the Mann-Kendall test, the dependence among data alters variance of the test statistic, which influences the type I error. REFERENCES Cox, D. R. & Stuart, A. (1955) Some quick sign tests for trend in location and dispersion. Biometrika 42(1/2), 80–95. Fatichi, S., Barbosa, S. M., Caporali, E. & Silva, M. E. (2009) Deterministic versus stochastic trends: Detection and challenges. Journal
of Geophysical Research 114(D18). doi:10.1029/2009JD011960 Hamed, K. H. & Rao, A. R. (1998) A modified Mann-Kendall trend test for autocorrelated data. Journal of Hydrology 204(1-4), 182–
196. doi:10.1016/S0022-1694(97)00125-X Hamed, K. H. (2008) Trend detection in hydrologic data: The Mann–Kendall trend test under the scaling hypothesis. Journal of
Hydrology 349(3-4), 350–363. doi:10.1016/j.jhydrol.2007.11.009 Hamed, K. H. (2009) Enhancing the effectiveness of prewhitening in trend analysis of hydrologic data. Journal of Hydrology 368(1-
4), 143–155. doi:10.1016/j.jhydrol.2009.01.040 Luo, X. (2013) GPS Stochastic Modelling: Signal Quality Measures and ARMA Process. Springer Theses. Berlin; Heidelberg:
Springer-Verlag. Yue, S., Pilon, P., Phinney, B. & Cavadias, G. (2002) The influence of autocorrelation on the ability to detect trend in hydrological
series. Hydrological Processes 16(9), 1807–1829. doi:10.1002/hyp.1095 Yue, S. & Wang, C. (2004) The Mann-Kendall test modified by effective sample size to detect trend in serially correlated hydrological
series. Water Resources Management 18(3), 201–218. doi:10.1023/B:WARM.0000043140.61082.60 Sen, A. K. & Niedzielski, T. (2010) Statistical characteristics of riverflow variability in the Odra River basin, southwestern Poland.
Polish Journal of Environmental Studies 19(2), 387–396. Sprent, P. & Smeeton, N. C. (2007) Applied Nonparametric Statistical Methods. Texts in statistical science, 4th ed. Boca Raton:
Chapman & Hall/CRC.

Hydrology in a Changing World: Environmental and Human Dimensions Poster Proceedings of FRIEND-Water 2014, Montpellier, France, 7-10 October 2014
70
Ecohydrology, sedimentation & sustainable sediment management options in inland water bodies in Ethiopia: A review
ETAFA EMAMA LIGDI1 & MOHSSINE EL KAHLOUN2 1 Researcher & Freelance Consultant; P.O.Box:28182; Addis Ababa, Ethiopia. [email protected] 2 University of Antwerp, Belgium. Abstract Ethiopia suffers, among others, from a persistent land, water and environmental degradation resulting in periodic droughts and famine with severe food shortages It exhibits threats such as soil erosion, reservoir sedimentation, and flood hazards, resulting in significant negative impacts including ecosystem deterioration in the form of water and land degradation, reduction in biological diversity, and loss of important hydrological and ecological functions.Hence, the integration and harmonization of the interactions of hydrological and ecological processes that support the health and integrity of the water ecosystems and striking the balance, is the key for any future sustainable development. Key words FRIEND/Nile II, reservoir sedimentation, anthropogenic effects, sediment loads, controlling sediment yield, ecohydrological system solutions, knowledge gaps.
INTRODUCTION The paper forms part of an UNESCO-IHP’s FRIEND/ Nile-phase II Project with an overall aim of using eco-hydrology as an important tool for integrated water resource management, IWRM in improving the sustainability of freshwater resources in the Nile basin. With a case study site at Lake Tana in Northwestern Ethiopia, the main objective of the study was to conduct a background preliminary review and investigate the sedimentation status of the lake and 15 reservoirs (in 6 river basins) in Ethiopia to recognize prospects and explore the possibility for sustainable sediment management in inland water bodies in the country. Following the three steps proposed (Zalewski, Wagner 2004) to optimize the evaluation procedure for pollution risk assessment at a catchment scale, the methodology employed here-in were initial screening; direct assessment of impacts; and quantification of problems.In this study, therefore, experimental and research study data from the available literature was utilized to the maximum as an alternative source for the requisite and crucial direct assessment of impacts, and quantification of problems which was vital.
The preliminary results of 22 years of hydrologic data used to investigate the status of Lake Tana demonstrated that reduced lake water level with its annual fluctuations and seasonal floods associated with high flows are becoming amplified and frequent, and a 12 years data of the total average annual sediment load of the four major tributaries shows an increasing trend. The Abbay (Blue Nile) basin is exhibiting alarming degradation of biota with reductions in grass (88.7%), shrub (52.9%), forest (15.5%), wetland (24.9%) and riparian vegetation (60.4%) crucial for maintaining the resilience of the ecosystem to extreme events; whilst revealing an increase in crop (7.2%), bush (63.3%), and outcrop areas (500.1%). Similarly, fish production levels and stocks are decreasing in recent years. Further investigations into the ecohydrological status of this highland shallow lake showed interrelationships and strong association between sedimentation, biota degradation and lake level fluctuations and habitat and species degradation in the Lake Tana sub basin.
The recent trends in the inland water bodies (mainly Lakes) in Ethiopia showed contrasting
variation. The major emerging changes are that lakes show contrasting temporal variations in stage and size, where some are expanding (Lake Beseka (area), Lake Finca’a(area), Lake Hawassa (rising levels)); and some are shrinking (e.g. Abiata and Ziway). Additional trends observed include complete drying up of lakes.( Lange , Kersa, and recently Adele and Haromaya Lakes in the Eastern Hararghe highlands); disappearance of springs and swamps connected to the lakes (wetland degradation around Hawasa and Tana lake); change in the biodiversity (biota degradation, decline in fishery stocks in Lake Tana, Hawassa, Ziway); and Change in constituents and water quality deterioration (sedimentation,

Hydrology in a Changing World: Environmental and Human Dimensions Poster Proceedings of FRIEND-Water 2014, Montpellier, France, 7-10 October 2014
71
eutrophication, and signs of cynobacterial toxicity in Lake Koka, Aba Samuel dam, Gilgel Gibe I, Gefersa and Lake Tana).
In an overall conclusion, the study demonstrated that several of the inland water bodies considered
here-in exhibit extremely high values of catchment sediment yield (incoming sediment loads) and sedimentation rates resulting in severe economic, social, and environmental concerns. It also revealed that most of the artificial storage facilities (reservoirs) exhibit physical limitations hampering the use of hydrologic sediment management techniques such as flushing and sluicing. The study further implicated that sedimentation was only an aspect of the anthropogenic effects/threats to the water ecosystems, and it is usually linked up with other correlated/associated adverse ecological and hydrological effects. Besides, emerging new and /or exacerbated ecological and hydrological conditions previously unaccounted for are resulting in deterioration of quantity and quality of water, loss of ecosystem services and eutrophication of water bodies. Hence, the study verified that most of the storages facilities in the country generally require separate and /or additional complementary sediment management options. As a consequence, it was deduced that eco-hydrology and phyto-technology, in complement to the conventional hydro technical technologies, has the potential to address the problems of sedimentation and the associated adverse effects.In general, even though the magnitude and rates differ, the situation in both the artificial and natural water bodies in relation to sedimentation and related environmental resource degradation and loss of livelihoods is very much similar as demonstrated by this study.
REDUCTION OF SEDIMENT AND CONTAMINANT YIELD The preventative sustainable sediment control strategy should focus on (a) controlling excessive sediment yield and input of nutrients and micro pollutant through prevention of sediment generations/ sediment yield initiations at the source and/or impeding their transport capacity down slope. (b) control of sediment and pollutant contaminants inflow by regulating the sediment and nutrients and micro pollutant carrying tributaries.(c) retention, filtering, and biodegradation of sediment, nutrients and micro pollutants before entering into the water bodies by one means or another. Such prevention, regulation, and retention may be affected by riparian vegetation, buffer strips, ecotones, and wetlands; and development of vegetative screens in the reservoir area and by installation of structures and land-treatment measures in the watershed. MAKING BETTER USE OF ECOSYSTEM FUNCTIONS The study identified ecosystem functions as Lake water level regulation; habitat regulation; species regulation; control of eutrophication and cyanobacterial toxicity; restraining of erosion, sediment transport and sedimentation; improve water quality (reduce pollutant load); provisions for support of livelihoods etc. Hence, the use and integration of the low cost-high technology principles and practices of ecohydrology in augmenting conventional practices of engineering hydrology based on ecohydrological concepts, principles and methodology was suggested.
Finally, the summary of the identified eco-hydrological issues of the case study area, and the existing literature was analyzed and synthesized to come up with a prospect of a strategic shift from sediment control to control of sediment and pollutant contaminants in the form of input of nutrients and micro pollutant which was required.As a result, a sequential 3-tier multidisciplinary and transdisciplinary comprehensive catchment scale sustainable sediment management strategy framework for reducing siltation and reversing water body pollution in rural catchments is proposed.

Hydrology in a Changing World: Environmental and Human Dimensions Poster Proceedings of FRIEND-Water 2014, Montpellier, France, 7-10 October 2014
72
FRIEND-Water Discharge Data at the WMO Global Runoff Data Centre (GRDC)
U. LOOSER & I. DORNBLUT Am Mainzer Tor 1, 56068 Koblenz, Germany [email protected] THE GLOBAL RUNOFF DATA CENTRE: FACILITATOR BETWEEN DATA PROVIDERS AND DATA USERS
The Global Runoff Data Centre (GRDC) was established in 1988 at the Federal Institute for Hydrology (BfG) under the auspices of the World Meteorological Organization (WMO). It is a contribution of the Federal Republic of Germany to the World Climate Programme of the WMO. The WMO mandates and directly supports the GRDC through its Resolution 21 (Cg XII, 1995: Request to the member states to provide GRDC with river discharge data) and Resolution 25 (Cg XIII, 1999: Free and unrestricted exchange of hydrological data). The Global Runoff Database at GRDC is a unique collection of river discharge data collected at daily or monthly intervals from more than 9000 stations in 158 countries. This adds up to around 360.000 station-years with an average record length of 41 years. The GRDC archives international data of up to 200 years old, and fosters multinational and global long-term hydrological studies. The aim of the GRDC is to help earth scientists analyse global climate trends and assess environmental impacts and risks. SPECIAL DATA SETS IN SUPPORT OF FRIEND-WATER AND UNESCO-IHP AND WMO-HWRP The GRDC maintains a number of specialised data sets in support of the UNESCO-International Hydrological Programme (IHP) and the WMO-Hydrology and Water Resources Programme (HWRP). Internationally a number of established and recently developed initiatives support cooperation in the field of water data. A long-standing initiative is the UNESCO-FRIEND-Water (Flow Regimes from International Experimental and Network Data) Programme, an international collaborative study in regional hydrology. One of the most successful initiatives developed by UNESCO’s IHP, FRIEND has grown from relatively modest beginnings in 1985 with scientists from 7 European Countries to encompass 162 countries in 2010. The Programme supports a diverse body of hydrological research around the globe, bringing up a new generation of scientists working together and sharing data, scientific knowledge and techniques across political borders and enhancing benefits of establishing cross-disciplinary networks. A central feature of much of FRIEND-Water’s activities is scientific cooperation and to share hydrological data for research purposes. Through its regional groups, the Programme has established regional databases which have grown over the years and are regularly updated in order to meet new research challenges. A hydrological data base is one of the cornerstones for the research activities of each of the eight regional FRIEND-Water groups.

Hydrology in a Changing World: Environmental and Human Dimensions Poster Proceedings of FRIEND-Water 2014, Montpellier, France, 7-10 October 2014
73
The European Water Archive of EURO-FRIEND-Water
The European Water Archive (EWA) represents the central database for the EURO-FRIEND-Water group and contains river flow records from over 4000 monitoring stations across 30 countries. Since 1985 the EWA has grown into one of the most comprehensive hydrological archives in Europe. Hosted, until 2003, by the Centre for Ecology & Hydrology in the UK, five regional data centres were established across Europe to assist in the acquisition of data for the FRIEND-Water project. In 2004, maintenance of the EWA was passed to the Global Runoff Data Centre at the Federal Institute of Hydrology in Germany. Data archived in the EWA have been supplied on a voluntary basis and free of charge by hydrometric agencies across Europe. The EWA is made freely available for use by FRIEND-Water group members for research purposes and now supports international research in, amongst others, the fields of low flow and drought, large-scale hydrological variations, techniques for extreme rainfall and flood runoff estimation and catchment hydrological and biogeochemical processes. Such research contributes to FRIEND-Water’s overarching objective to improve the scientific understanding of hydrological processes at a regional to global scale and it aims to foster and consolidate cross-disciplinary networks that facilitate cooperation within research and capacity building, development of analytical tools and data sharing, primarily across national boundaries. The Southern Africa Flow Database of SA FRIEND-Water
The Southern Africa Flow Database, established between 1992 and 1997 to support rainfall-runoff modelling, contains flow time series data from about 850 stations across Southern Africa (SA). Initially hosted at the University of Dar es Salaam during the SA FRIEND Phase I and maintained by the CEH in Wallingford in Phase II, the SA Flow Database is operated by the GRDC since November 2010. The data archived in the SA Flow Database have been supplied on a voluntary basis and free of charge by various data providers. Since 2013, the SA Flow Database is fully integrated into the Global Runoff Database. Access to data follows the GRDC data policy of free and unrestricted but identified access and is limited to non-commercial applications.

Hydrology in a Changing World: Environmental and Human Dimensions Poster Proceedings of FRIEND-Water 2014, Montpellier, France, 7-10 October 2014
74
Water resources in the Red River Delta (Northern Vietnam) and prospective scenarios
LUU THI NGUYET MINH1, DIDIER ORANGE2, JULIEN NEMERY3, LE THI PHUONG QUYNH4, TRINH ANH DUC1, LE LAN ANH1, JOSETTE GARNIER5 1 Institute of Chemistry, Vietnam Academy of Science and Technology, 18 Hoang Quoc Viet, Cau Giay, Hanoi, Vietnam Email: [email protected] 2 IRD, UMR211-BIOEMCO, University Paris 6, France 3 UMR-LTHE, University of Grenoble, Grenoble, France 4 Insitute of Natural Product Chemistry, Academy of Science and Technology, 18 Hoang Quoc Viet, Cau Giay, Hanoi, Vietnam 5 CNRS, UMR 7619- Sisysphe, University Paris 6, France INTRODUCTION
The Red River Delta (RRD) (Figure 1), which is located in the northern part of Vietnam, is a very complex hydrological network that has been heavily impacted by human activity. The river water quality has been dramatically deteriorated due to rapid population growth, industrialization and economic development in the recent years (Luu et al., 2010), a model has been built for assessing the significance of the complex and inter-related processes and understanding how river water quality and ecological functioning reflect the land-use and human activities in the watershed. The aim was to develop some scenarios based on expected demographic and land use changes in order to evaluate the resulting changes in water quality and nutrient loading delivered to the coastal zone at the horizon 2050 (Seitzinger et al., 2010).
Fig. 1 The Red River Delta in Northern Vietnam.
Fig. 2 The Riverstrahler model.
METHODOLOGY
Approaches The approach used in this study is based on the adaptation of the Riverstrahler model (Figure 2) (Billen et al., 1997; Le et al., 2010) to relate the ecological and biogeochemical functioning of the whole drainage network of a large river system to the constraints set by the climate, the river system morphology and the human activities within its watershed. Trends at 2050 horizon ‐ The Vietnamese population is predicted to reach 112 million in 2050 with 57% that live in urban
area. ‐ The amount of wastewater expressed in kg of suspended matter, N and P per inhabitant per day is
estimated to decrease by about 10% in 2050 compared with current values. ‐ The wastewater discharge should increase twice, i.e. to 200 l/inhabitant/day. ‐ If the agricultural productivity is to be nearly doubled in the future, this would likely result in a N
surplus of about 150 kgN/ha/yr on the agricultural soils. Assuming the same leached fraction as currently observed, this would imply a mean leaching rate of 15 kgN/ha/yr, i.e. 3 times the present level.

Hydrology in a Changing World: Environmental and Human Dimensions Poster Proceedings of FRIEND-Water 2014, Montpellier, France, 7-10 October 2014
75
RESULTS
Simulation results A very important increase of nitrate is predicted only on the upper part of the Day River, while the other elements (ammonium and phosphorus) remain at the same concentration value. However, these last elements increase largely on the down part of the Day River and on the Nhue River. These simulations demonstrate that the current river system has already lost its capacity to purify the wastewaters. Nutrients budget and ICEP values The flux of nitrogen at the outlet of the basin is predicted to increase 3 or 2 fold according to the scenarios. The flux of phosphorus would increase by a lower rate, while the flux of silica would hardly change. At the outlet of the Day River basin, the calculated N-ICEP (Indicator indicator of coastal eutrophication potential) (Billen et al., 2007) shows increasing positive values, indicating that the amount of nitrogen already is, and will be more and more, in excess over the Si requirements for diatom growth, possibly leading to the development of non-siliceous, often harmful algal blooms. The P-ICEP is however negative in all scenarios, showing that there is no potential eutrophication concerning phosphorus.
Table 1 Budget of N, P, Si for three different scenarios (2006 as reference, 2050 with domestic wastewater treatment and 2050 without domestic wastewater treatment) and values of N- ICEP and P-ICEP at the outlets of the Day River Basin for these respective scenarios
2006 2050 - Without treatment 2050 - With treatment
N
(Kton/yr) P
(Kton/yr) Si
(Kton/yr) N
(Kton/yr) P
(Kton/yr) Si
(Kton/yr) N
(Kton/yr) P
(Kton/yr) Si
(Kton/yr) Non-point sources 22.56 0.80 12.45 48.67 0.98 12.45 48.67 0.98 12.45
Point sources 23.62 6.09 43.68 12.07 39.62 10.86
Entrance from Red River 2.40 0.68 9.79 3.37 0.83 9.89 3.37 0.83 9.89
Total inlet 48.58 7.57 22.24 95.72 13.90 22.34 91.66 12.69 22.34
Outlet 16.16 4.03 21.13 35.08 6.82 22.08 31.78 6.24 22.08
N-ICEP, gC/km²/yr 14.03 60.27 51.99
P-ICEP, gC/km²/yr -16.38 -10.58 -12.03
CONCLUSIONS
The model has been used to simulate a prospective scenario of the future state of the Day river system in 2050, as well as its future nutrient delivery to the coastal zone of the South China Sea The ICEP calculated at the outlet of the basin highlights an increased risk for eutrophication in 2050 in spite of the implementation of urban wastewater treatment. Indeed the different simulations highlighted the Day River System is already at the threshold limit of its capacity to be able to accept the least increase of nitrogen (nitrate or ammonium) and phosphorus.
REFERENCES
Billen G., Garnier J., 1997. The Phison River Plume: coastal eutrophication in reponse to changes in land use and water management in the watershed. Aquat Mircob Ecol 13:3-17 Billen G., Garnier J., 2007. River basin nutrient delivery to the coastal sea: assessing its potential to sustain new production of non siliceous algae. Mar. Chem 106:148-160 Le T.P.Q., Billen G, Garnier J, Théry S, Ruelland D, Nghiem X.A., Chau V.M., 2010. Nutrient (N, P, Si) transfers in the subtropical Red River system (China and Vietnam) : Modelling and budget of nutrient sources and sinks. Asian Earth Sciences 37(3):259- 274 Luu T.N.M., Garnier J., Billen G., Le T.P.Q., Némery J., Orange D., Le L.A., 2010, N, P, Si budgets for the Red River Delta (Northern Vietnam): How the delta affects river nutrient deliveries to the sea. Biogeochemistry Seitzinger S.P., Mayorga E., Bouwman A.F., Kroeze C., Beusen A.H.W., Billen G., Van Drecht G., Dumont E., Fekete B.M., Garnier J., Harrison J.A., 2010. Global river nutrient export: A scenario analysis of past and future trends. Global Biogeochemical Cycles 24, GB0A08, doi:10.1029/2009GB00358

Hydrology in a Changing World: Environmental and Human Dimensions Poster Proceedings of FRIEND-Water 2014, Montpellier, France, 7-10 October 2014
76
Road sediment production and delivery: methods, processes, rates, and management guidelines
LEE MACDONALD1, CARLOS RAMOS-SCHARRÓN2, DREW COE3, AL STAFFORD4, MATTHEW WELSH5, ZAMIR LIBOHOVA6 & ETHAN BROWN7 1 Dept. of Ecosystem Science & Sustainability, Colorado State U, Fort Collins, CO, USA 80523. [email protected] 2 Dept. of Geography & the Environment, U. of Texas, Austin, TX, USA; 3California Regional Water Quality Control Board, Redding, CA, USA; 4Colorado Dept. of Public Health, Denver, CO, USA; 5Headwaters Corp., Denver, CO, USA; 6Natural Resource Conservation Service, Lincoln, NE, USA; 7NEON, Boulder, CO, USA
Abstract Unpaved forest roads have been shown to impair water resources in the U.S., the Caribbean, Southeast Asia, New Zealand, and Europe, among many other locations. Here we provide a brief summary of the current knowledge on road erosion, road connectivity with the stream network, and their role in watershed-scale sediment yields. We also list the key factors that control erosion and sediment delivery, and discuss how this knowledge is useful in the implementation of best management practices. Key words unpaved roads, erosion, sediment delivery, best management practices
ROAD SEDIMENT PRODUCTION AND CONNECTIVITY Documented road sediment production rates range from less than 0.1 kg m-2 yr-1 in snow-dominated areas in California’s Sierra Nevada to more than 10 kg m-2 yr-1 for high rainfall areas in western Washington (USA) and high rainfall intensity areas in the Caribbean and Malaysia (Fig. 1). Key factors controlling road sediment production include road segment area, precipitation amount and intensity, road segment slope, and surface cover (Table 1), as these control the amount, depth, and velocity of runoff and the rainfall energy. Other key controls include soil texture, the type and amount of traffic, and time since grading or construction, as these control road surface erodibility and the supply of sediment (Table 1). Table 1 Controlling factors and their effects
on road sediment production.
Fig.1 Road sediment production rates. The proportion of road segments delivering runoff or sediment to the fluvial network (i.e., degree of connectivity) is highly variable. A meta-analysis of published data indicates that road connectivity is closely related to mean annual rainfall and the presence/absence of road drainage structures (Figure 2; Table 2). Road-stream crossings are very effective in delivering runoff and sediment to the streams, particularly in the absence of adequately-spaced road drainage structures. WATERSHED-SCALE EFFECTS OF ROAD NETWORKS Unpaved road networks contributed 20% of the total sediment yield in western Washington (Reid and Dunne, 1984) and 40% in Indonesia (Rijsdikj et al., 2007). In Colorado the long-term, chronic sediment
Control Effect Road segment area Amount and depth of runoff Precipitation Total rainfall and intensity control runoff rate Slope Erosive energy of surface runoff Surface cover Rainsplash and particle detachment Soil texture Abundance of easily erodible fine particles Traffic Availability of fine particles; vegetative cover
and infiltration Grading/time since construction
Abundance of fine particles
0,01
0,1
1
10
100
Sedim
ent production
(kg m
‐2yr
‐1)
410 mm rainfall yr‐1 3900 mm rainfall yr‐1

Hydrology in a Changing World: Environmental and Human Dimensions Poster Proceedings of FRIEND-Water 2014, Montpellier, France, 7-10 October 2014
77
Table 2 Controlling factors and their effects on road sediment delivery.
Fig. 2 Percent road connectedness vs. mean annual precipitation. production from roads was estimated to be about 1 Mg km-2 yr-1, or similar to the amount from high severity fires. In northern California, roads were estimated to contribute 1.4 Mg yr-1 per kilometer of road (Coe, 2006). In St. John (U.S. Virgin Islands), roads were estimated to increase watershed-scale sediment production by 3-9 times, indicating that sediment from roads was a major threat to near-shore coral reefs (Ramos-Scharron and MacDonald, 2007). ROAD SEDIMENT PRODUCTION AND DELIVERY MANAGEMENT PRACTICES Key practices to reduce road surface erosion include reducing the spacing between road drainage points. This is achieved by installing waterbars and cross-drains, or by crowning or outsloping the roadbed. Traffic restrictions during wet weather reduce rutting and prevent rilling. Placing rock or gravel on the road surface reduces rainsplash and runoff velocity, which then reduces erosion by 2-10 times (Coe, 2006) or 75-97% (Swift, 1984; Ziegler and Sutherland, 2006). Improved drainage can reduce erosion to one-third of pre-treatment rates (Ramos-Scharrón, 2012). Grading can increase sediment production by 2-5 times for up to two years (Ramos-Scharron and MacDonald, 2007), so reducing the frequency of maintenance can also reduce sediment production. Key practices to reduce road sediment delivery include: 1) decreasing spacing between drainage structures to minimize runoff concentration; 2) draining roads prior to a stream crossing; and 3) locating roads away from the valley bottom. Typically only a few road segments produce and deliver most of the sediment, so by understanding the controlling processes and site conditions management efforts can be highly focused and sediment delivery rates can usually be reduced by at least a factor of two. REFERENCES Reid, LM, Dunne, T., and Cederholm, CJ. (1981) Application of sediment budget studies to the evaluation of logging road impact. J.
Hydrology (New Zealand) 20:(1)49-62. Ramos-Scharrón, CE. (2012) Effectiveness of drainage improvements in reducing sediment production rates from an unpaved road.
Journal of Soil and Water Conservation 67(2): 87-100. Ramos-Scharrón, CE, and MacDonald, LH. (2007) Development and application of a GIS-based sediment budget model. Journal of
Environmental Management 84: 157-172. Rijsdijk, A., Bruijnzeel, LA., and Kukuh Sutoto, C., (2007) Runoff and sediment yield from rural roads, trails and settlements in the
upper Konto catchment, East Java, Indonesia. Geomorphology 87:28–37. Swift, L. (1984) Gravel and grass surfacing reduces soil loss. Forest Science 30(3): 657-670. Ziegler, AD., and Sutherland RA. (2006) Effectiveness of a coral-derived surfacing material for reducing sediment production on
unpaved roads. Environmental Management 37(1): 98-110. Coe, DBR. (2006) Sediment production and delivery from forest roads in the Sierra Nevada, California. MS thesis, Colorado State
University, 110 pp.
Control Effect Precipitation Annual precipitation and intensity
control stream density and total runoff
Road segment area and drainage design
Controls the amount of runoff and the location of delivery points
Road location Valley bottom roads most likely to be connected at road crossings
Hillslope steepness and roughness
Transport and sediment retention capacity

Hydrology in a Changing World: Environmental and Human Dimensions Poster Proceedings of FRIEND-Water 2014, Montpellier, France, 7-10 October 2014
78
Quantifying payments for environmental services: land use differences in runoff and erosion, Lam Dong Province, Vietnam
LEE MACDONALD Department of Ecosystem Science and Sustainability, Colorado State University, Fort Collins, CO, USA 80523-1476. [email protected]
Abstract Payments for environmental services are often based on only crude estimates of the provided benefits. The primary goal of this project was to quantify runoff and sediment yields from four small watersheds with different land uses in the central highlands of Vietnam. Land uses varied from a highly protected broadleaved forest to entirely agriculture. Although there were substantial problems with data quality and completeness, the results suggest that land use had relatively little effect on runoff, while agriculture caused a 40-fold increase in sediment yields. Quantifying watershed-scale runoff and sediment yields is a very challenging task, and sediment fences may provide a more direct and useful method for measuring sediment yields from different land uses. Key words payment for environmental services, runoff, erosion, forests, agriculture, land use change
INTRODUCTION AND OBJECTIVES
There is an urgent need to quantify the environmental benefits of forest protection. The effects of deforestation and climate change on the amount and timing of runoff is a critical concern for reservoir operators and downstream water users, particularly in a highly seasonal environment like Vietnam. Any reduction in streamflow during the dry season due to land use will have immediate effects in terms of reducing the amount of water available for irrigation and hydroelectric generation. A potentially greater concern is the large potential increase in sediment yields from converting forests to agriculture or other land uses, as the increased sediment load can greatly reduce reservoir storage capacity, increase flooding, and degrade water quality and other aquatic resources. Most efforts to quantify payments for environmental services (PES) use only a very simple land-use classification scheme, such a binomial classification into forest or non-forest, but more accurate data are needed to quantify payments according to the specific changes in runoff and erosion from different land uses.
The primary objective of this project was to more rigorously quantify PES for different land uses by measuring the differences in runoff and sediment yields from four watersheds with widely varying vegetation or land use. A second objective was to provide the technical capability to allow this project to continue, or expand to other watersheds. The four study watersheds were all located above Da Nhim Reservoir in the central highlands of Vietnam because this reservoir is such an important source of hydroelectric power and water supply. The environmental services of primary concerns were: 1) the potential changes in dry season flows with land use change from forest to agriculture; and 2) the changes in sediment yield that will reduce reservoir storage capacity. The project was conducted in close collaboration with Lam Dong province, the US Geological Survey, and support from USAID.
METHODS The four watersheds were chosen to represent the dominant land uses: 1) broadleaved
evergreen forest; 2) pine forest; 3) mixed pine and agriculture land use (“ag-pine”); and 4) agriculture. Watershed area ranged from 4 to 12 km2. Gaging stations were established to continuously measure water levels and turbidity, and rain gages were installed near each gaging station. Water samples were automatically collected during high flows by pump samplers and analyzed for suspended sediment concentrations (SSC). This paper focuses on the data collected over the 2010 rainy season from March/April through late October; data from the second year of monitoring has still not been analysed due to a lack of funding.

Hydrology in a Changing World: Environmental and Human Dimensions Poster Proceedings of FRIEND-Water 2014, Montpellier, France, 7-10 October 2014
79
RESULTS AND CONCLUSIONS Precipitation was initially above average but near average over the entire monitoring
period as indicated by the long-term record at Dalat. Valid runoff data were collected only at the broadleaved and pine sites due to the high sedimentation rates and unstable channels at the ag-pine and agricultural sites, together with access and logistical problems. Runoff accounted for about 25% of the precipitation at the broadleaved site and up to about 40% of the precipitation at the pine site. The highest estimated peak flows were only 0.2 m3 s-1 km-2 for the broadleaved watershed but 1.5 m3 s-1 km-2 for the pine watershed. Minimum flows were 0.04 m3 s-1 km-2 for the broadleaved watershed and only 0.009 m3 s-1 km-2 for the pine watershed.
Runoff from the broadleaved site was exceptionally clean, while turbidities and suspended sediment concentrations (SSC) were 50-100% higher at the pine site. The higher turbidities and SSC values from the pine watershed were attributed to the reduction in cover due to local burning. Turbidities and suspended sediment concentrations increased progressively from the two forested sites to the ag-pine site, and were several times higher still for the agricultural watershed. Measurement problems meant that monthly flows for these two watersheds were calculated by multiplying the mean monthly runoff/precipitation ratios derived from the broadleaved and pine watersheds by the measured precipitation at each watershed. Sediment yields for these two watersheds were estimated by multiplying the calculated runoff times the mean suspended sediment concentrations as measured from the pump samples.
The total sediment yield for the broadleaved watershed was estimated to be 30 tons km-
2, while the pine watershed had a somewhat higher estimated sediment yield of 47 tons km-2. These values are very consistent with measured values from other moist tropical forested areas. In contrast, the estimated sediment yield from the ag-pine watershed was 140 tons km-2, while the predicted sediment yield from the agricultural watershed was nearly 1200 tons km-2, or forty times higher than the broadleaved watershed.
The results clearly show that the conversion of forests to agriculture will greatly increase sediment yields but will have a much smaller effect on the amount or timing of runoff. Hence PES should be calculated primarily from the costs of the increase in sediment yields and loss of reservoir storage capacity rather than the projected changes in flow. The project results emphasize the logistical difficulties of collecting high quality runoff and sediment yield data at the watershed scale, and that a clear commitment is needed from local, national, or international organizations to sustain the intensity and duration of monitoring efforts needed to quantify PES. If sediment is the primary concern, hillslope-scale sediment fences may be a more useful and much more inexpensive technique to quantify land use and site-scale differences in sediment production (e.g., Benavides-Solorio and MacDonald, 2006). Acknowledgements The author is very grateful for the assistance from Lam Dong Department of Natural Resources and the Environment, Allen Roberts and Pat Rasmussen of the US Geological Survey, Dr. Attachai Jintrawet of Chiang Mai University, Dr. David Dust, June Bigler, Winrock International, and USAID. REFERENCES Benavides-Solorio, J., and MacDonald, LH (2005) Measurement and prediction of post-fire erosion at the hillslope scale, Colorado
Front Range. International Journal of Wildland Fire 14: 1-18.

Hydrology in a Changing World: Environmental and Human Dimensions Poster Proceedings of FRIEND-Water 2014, Montpellier, France, 7-10 October 2014
80
The way we are heading in flood quantiles estimation IWONA MARKIEWICZ, WITOLD G. STRUPCZEWSKI & KRZYSZTOF KOCHANEK
Institute of Geophysics, Polish Academy of Sciences. Ksiecia Janusza 64, 01-452 Warsaw, Poland [email protected]
INTRODUCTION
Flood frequency analysis (FFA) provides information about the probable size of flood flows and has been used for the design of civil engineering works for over the century. The at-site frequency analysis is the most commonly used approach. Then the estimation of flood escribing the annual peak flows for the investigated gauging station along with the method of estimation of parameters and, thus, upper quantiles of the hypothetical distribution. To find the best fitting model to empirical data, the selected discrimination procedure is applied.
The choice of distribution for fitting the annual maximum flows was attracted considerable interest, e.g. NERC, 1975; Cunnane, 1989. Nowadays the heavy-tailed distributions are recommended for the description of the peak flow data, e.g. FEH, 1999; Rao and Hamed, 2000. However, the heavy-tailed form of hydrological variables it is not sufficiently supported, e.g. Weglarczyk et al., 2002. The analysis of Polish datasets of annual peak flows in Strupczewski et al. (2011) shows that they should be modeled using soft-tailed rather than heavy-tailed distributions. The inverse Gaussian distribution (IG) has been found to match the number of Polish data successfully. Figure 1 illustrates the relation of coefficient of skewness SC versus the coefficient of variation VC for two-parameter distributions commonly used in FFA (solid lines) plotted with the Polish data of annual peak flows for 38 gauging stations (triangular points).
Fig. 1 VC - SC relation for some two-parameter distributions plotted with the Polish data of 90-year-long annual
peak flow series. Distributions: Ga – gamma, We – Weibull, GE – generalized exponential, IG – inverse Gaussian, LN – log-normal, LL – log-logistic, LG – log-Gumbel, Exp – exponential.
One can see that the area between the inverse gaussian and the gamma distributions is filled by data points for several Polish rivers and by no distribution. Clearly, there is still room for a new model. The generalized exponential (GE) distribution seems to be a suitable complement (dotted line). This distribution has been derived recently (Gupta and Kundu, 1999) and used quite effectively to analyze

Hydrology in a Changing World: Environmental and Human Dimensions Poster Proceedings of FRIEND-Water 2014, Montpellier, France, 7-10 October 2014
81
lifetime data in the reliability analysis, being an alternative to the gamma, Weibull, Pareto and log-normal distributions.
The aim of this study is to examine the way we heading in flood quantiles estimation and, in particular, to investigate the suitability of the generalized exponential distribution in flood frequency analysis.
RESULTS AND CONCLUSIONS
In order to analyze the fitting GE and other distributions to the data, the 90-year long series of annual maximum flows for Stary Sacz gauging station on the Poprad River has been selected as an example. Seven two-parameter models, namely Ga, We, GE, IG, LN, LL and LG, have been assumed successively, as the hypothetical models for describing the data series. The 1% quantile has been estimated by three estimation methods, i.e. the method of moments (MOM), the method of linear moments (LMM) and the maximum likelihood method (MLM). To find the best fitting distribution among all competing PDFs, four discrimination procedures have been applied, i.e. K procedure based on the maximized logarithm of the likelihood function, QK procedure based on the density function of the scale transformation maximal invariant, D procedure based on the Daniels characteristic and R procedure based on the differences between the maximum likelihood estimate of 1% quantile and its value assessed by the method of moments and linear moments, in sequence.
The results vary in respect to the discrimination procedure and the estimation method, causing difficulties in concluding about the best fitting model. It is characteristic for hydrological size of samples. For the annual peak flows series for Stary Sacz gauging station on the Poprad River, the best fitting models are: IG, LG, LN and LL, depending on the discrimination procedure. In particular, the GE distribution occupies one of the leading positions.
Over the years of the development of the flood frequency modeling, the main effort has been devoted to the improvement of the statistical techniques. However, their proliferation causes the heterogeneity of results and finally leads to an increase in our awareness of the uncertainty of flood quantile estimates, instead of leading to clear solution. This stands in contrast with the expectation of engineers and hydrologists as they want to have a unique value, not accepting the uncertainty. It seems essential that we should revise the way we have been doing the hydrological frequency analysis, putting emphasis on the integration of hydrology in flood frequency modeling. Acknowledgements This work was partially supported within statutory activities No 3841/E-41/S/2014 of the Ministry of Science and Higher Education of Poland.
REFERENCES
Cunnane, C. Statistical distributions for flood frequency analysis. Operational Hydrology Report No.33, World Meteorological Organization: Geneva. 1989.
FEH, Flood Estimation Handbook. Institute of Hydrology, Wallingford, Oxfordshire OX10 8BB, U.K. 1999. Gupta, R.D. and Kundu, D., Generalized exponential distributions. Australian and New Zealand Journal of Statistics, 41(2), 1999, pp.
173 - 188. DOI: 10.1111/1467-842X.00072. NERC, Natural Environment Research Council. Flood Studies Report Volume 1: Hydrological Studies, Natural Environment Research
Council. London.1975. Rao, A.R. and Hamed, K.H., Flood frequency analysis. CRC Press: Boca Raton, Florida, USA. 2000. Strupczewski, W.G., Kochanek, K., Markiewicz, I., Bogdanowicz, E., Weglarczyk, S., Singh, V.P., On the tails of distributions of
annual peak flow. Hydrological Research, 42(2-3), 2011, pp. 171-192. DOI: 10.2166/nh.2011.062. Weglarczyk., S., Strupczewski, W.G., Singh, V.P., A note on the applicability of log-Gumbel and log-logistic probability distributions
in hydrological analyses: II. Assumed pdf.. Hydrological Sciences Journal 47(1), 2002, pp. 123-137.

Hydrology in a Changing World: Environmental and Human Dimensions Poster Proceedings of FRIEND-Water 2014, Montpellier, France, 7-10 October 2014
82
Near real-time remotely sensed data for flood monitoring and forecasting
DAVID C. MASON1, JAVIER GARCIA-PINTADO2, SARAH L. DANCE2 & HANNAH L. CLOKE12 1 Dept. of Geography and Environmental Science, University of Reading, PO Box 227, Reading RG6 6AB, UK. [email protected] 2 School of Mathematical and Physical Sciences, University of Reading, PO Box 243, Reading RG6 6BB, UK.
Abstract This extended abstract describes a prototype system for extracting flood extents from satellite Synthetic Aperture Radar images and using them to improve flood monitoring and forecasting. Key words flood forecasting; flood monitoring; remote sensing; data assimilation In recent times, the technology of Earth Observation has begun to be adopted to improve flood visualisation and reduce flood modelling uncertainties. High resolution satellite Synthetic Aperture Radar (SAR) sensors are now commonly used in natural disasters such as flooding because they allow images to be taken from space over a wide area, can see through clouds, and can acquire images at night-time as well as during the day. These sensors have resolutions as high as 1m, so that they are able to image flooded streets in urban areas. In the absence of significant surface water turbulence due to wind, rain or currents, flood-water generally appears darker than un-flooded land surfaces in a SAR image because the water acts as a specular reflector. There are a number of uses of flood extents, including damage assessment and mitigation, operational flood relief management and improved flood forecasting. Damage assessment and mitigation studies can be performed in a post-flood offline mode, and here we concentrate on uses that rely on SAR images being obtained in near real-time. Current high resolution satellite SARs include TerraSAR-X, RADARSAT-2 and the COSMO-SkyMed constellation. The latter is particularly important for flood detection because it is a constellation of four satellites that can provide images of a flood at 12-hour intervals. Apart from RADARSAT-2, these satellites do not yet provide near real-time geo-registered imagery that can be overlaid directly onto a digital map. However, the European Space Agency (ESA) has recently launched the first satellite in the two-satellite Sentinel-1 SAR constellation, with the second satellite due for launch in 18 months. These will give almost daily coverage of floods at European latitudes, allowing processed multi-look geo-registered SAR images to be available to the user within three hours of data acquisition. In addition, ESA have developed the Fully Automated Acqua Processing Service (FAAPS) to process SAR images in near real-time to create geo-registered rural flood extent maps and deliver them to the user via the Internet. We have developed a near real-time algorithm for detecting flooding in both urban and rural areas of a high resolution SAR scene (Mason et al., 2012). The algorithm assumes that high resolution LiDAR data are available for at least the urban areas in the scene. The flood extent is first detected in the rural area using object-based image segmentation techniques. The urban flood detection is then guided by the rural flood detection, taking account of the fact that some urban areas will not be visible to the SAR because of radar shadow and layover caused by buildings. An important use of such a near real-time flood extent is as a tool for operational flood relief management. This allows the emergency services to view the geo-registered flood extent at high resolution over a large area overlaid on a base map a few hours after overpass. However, here we concentrate on using near real-time SAR flood extents to derive water level observations that can be assimilated into a flood inundation model in order to improve its forecast. Flood inundation is difficult to model due to the complexity of the mathematical equations describing the flow, and to uncertainties in the input flow rates and bottom friction parameters. We can partly compensate for these uncertainties by using data assimilation to update the model state with observed information as this becomes available, to help keep the model on track. Assimilation can also improve the estimates of the input flow rates and bottom friction parameters.

Hydrology in a Changing World: Environmental and Human Dimensions Poster Proceedings of FRIEND-Water 2014, Montpellier, France, 7-10 October 2014
83
One common observation that may be assimilated is the water level at various points along the modelled reach. Water levels can be estimated along the boundaries of a flood extent by intersecting them with the floodplain Digital Terrain Model. An advantage of measuring Water Level Observations (WLOs) from SAR flood extents is that the method will work in un-gauged catchments. Every pixel along a flood extent boundary will provide a water level, and we first select a subset of levels for assimilation because adjacent levels will be strongly correlated and add little new information (Mason et al., 2012). The selection process ensures that the set selected are spatially uncorrelated. Typically the water levels have a height accuracy of 25cm or so. The method of assimilation used is the Ensemble Kalman Filter (EnKF) (Garcia-Pintado et al., 2013). This assumes that a sequence of SAR images can be obtained in near real-time over the duration of the flood. At the time of acquisition of each processed image, the flood extent and WLOs are extracted, and the EnKF uses the WLOs to correct the water levels predicted by the flood inundation model at this time. This improves the forecast of the future flood level and extent. The EnKF requires an ensemble of model runs to be made in order to represent the forecast uncertainty. These are obtained by making small perturbations in the time-varying input water flow rate into the flood inundation model domain about its estimated values, and performing a model run for each perturbed inflow. At each point in time and space, the ensemble produces a mean model water level and a spread about this representing the water level uncertainty. An example is shown in fig. 1, based on the assimilation of WLOs derived from a 7-image sequence of COSMO-SkyMed images of a flood event on the lower Severn and Avon in the UK in November/December 2012. The graph shows the water levels of the runs in the forecast ensemble (grey lines) at a location (Bredon) in the Avon. The satellite overpass times are indicated by dashed vertical
lines. At each assimilation time, the WLOs are used to correct the predicted water levels. The red line is the mean forecast line. The blue line indicates the Water Level time series recorded by a gauge at the location, and is used here as a reference and not for modelling or assimilation. While the first satellite overpass misses the peak of the flood, once the SAR data are available, the processing chain is able to successfully adjust the sequential forecast and keep the flood model on track.
REFERENCES
Mason, D.C., Davenport, I.J., Neal, J.C., Schumann, G.J-P. and Bates, P.D. (2012) Near real-time flood detection in urban and rural areas using high resolution Synthetic Aperture Radar images. IEEE. Transactions on Geoscience and Remote Sensing, 50(8), 3041-3052.
Mason, D.C., Schumann, G.J-P., Neal, J.C., García-Pintado, J., Bates, P.D. (2012) Automatic near real-time selection of flood water levels from high resolution Synthetic Aperture Radar images for assimilation into hydraulic models: a case study. Remote Sensing of Environment, 124, 705—716.
Garcia-Pintado, J., Neal, J.C,, Mason, D.C., Dance, S., Bates, P.D. (2013) Scheduling satellite-based SAR acquisition for sequential assimilation of water level observations into flood modelling. Journal of Hydrology, 495, 252-266.
Fig. 1 Water levels at Bredon on the Avon during November 2012 event.

Hydrology in a Changing World: Environmental and Human Dimensions Poster Proceedings of FRIEND-Water 2014, Montpellier, France, 7-10 October 2014
84
Characterization of sediment and physical chemistry of Ayame Lake
MELEDJE N'DIAYE HERMANN1, KOUASSI KOUAKOU LAZARE1, NGO YAO ALEXIS2, SAVANE ISSIAKA2 1 Centre de Recherche en Ecologie, Laboratoire de Géologie Marine, Sédimentologie et Environnement, 08PO Box 109 Abidjan 08 Côte d’Ivoire [email protected] 2 Université Nangui Abrogoua , Laboratoire Géosciences et Environnement Côte d’Ivoire INTRODUCTION
Hydroelectric dams in Cote d'Ivoire have long suffered erosion and disruption of the sediment balance. A recent study by Kouassi (2007) was interested in determining the sediment dynamics in Taabo Dam confirms the fragility of this item. Indeed, the evolution of the bottom shows a filling contour of the bottom. The filling is the result of the combined effects of natural and anthropogenic action. To all these human activities are added proliferations of freshwater salads (Paskoff, 1994). In this paper, we propose to study the particle size characteristics of the sediments of Ayame Lake and Bia River. The particle size analysis used to determine the nature of the sediments, their origin and mode of travel. It also determines the sediment dynamics in relation to their spatial distribution, size and characteristics of hydrodynamic parameters. The physicochemical analyzes helped to know the origin of the lake eutrophication. MATERIALS AND METHODS To determine the particle size characteristics of sands at Ayame Lake, 33 samples of sediment were taken (see fig.1). The sediments were analyzed according to the technique described by SAAIDI (1991). For the 34 sediments studied, we have established an auto organizer map of Kohonen (SOM). The SOM help out similar groups from the matrices of complex data (Kohonen, 2001). Thirty-three samples were collected in low water season (February 2004, December 2012, January 2013) and flood season (October 2004, April 2010). The samples were subjected to physicochemical situ measurements (conductivity, temperature, pH, dissolved oxygen and turbidity) and laboratory (suspended solids). The corresponding statistical analysis (corrmap) developed in matlab was used to study the evolution of physicochemical parameters as a function of depth. The corrmap.m function displays a map of the pseudo correlation matrix by rearranging the variables so that they are grouped and correlated with each other. Fig. 2 Points levies. RESULTS
The numerical classification by the Ward method allowed us to group the sediments from the

Hydrology in a Changing World: Environmental and Human Dimensions Poster Proceedings of FRIEND-Water 2014, Montpellier, France, 7-10 October 2014
85
granulometric average. It is, therefore, the dendrogram of three classification separate groups. Fig. 3 a) Gradient values for each granulometric average on the Kohonen map b) Distribution of samples according to their similarity to the Kohonen map. The first is represented by the sediments S6, S7, S32, S33, S12, S27, S13, S17, S28, S30, and S31. While the second comprises S19, S22, S24, S21. The first group concerns species which settle and build their nests in levels higher than those in the second group whose nests are placed much lower. Fig. 4 Correlation matrix of the physico-chemical characteristics of the waters of Ayame Lake. Figure 3 produced a map to visualize the proximity between the different variables. The correlation matrix applied on the physico-chemical variables depending on the season and depth, shows a good correlation between the set of variables (Fig. 3). On the matrix, the highest values are observed on the diagonal of the matrix, and the correlation between the various points then logically decreases with the distance between these points. One can, however, note that the correlation between the points, even distant from each other, remains relatively strong. However, there is a very strong positive correlation between the concentration of suspended solids and turbidity (r = 0.92). The turbidity of the water is influenced by the solid fillers in suspension.
REFERENCES
Saaidi E. (1991). Traité de sédimentologie. Pétrographie, environnements sédimentaires. Editions Ellipses, 393 p. Kohonen T. 2001. Self-Organizing Maps (3 Editions). Springer-Verlag, Berlin,Germany,362p.
a) b)

Hydrology in a Changing World: Environmental and Human Dimensions Poster Proceedings of FRIEND-Water 2014, Montpellier, France, 7-10 October 2014
86
Probability distribution of rainfall in the Bia watershed: contribution of Markov chains
MELEDJE N'DIAYE HERMANN1, KOUASSI KOUAKOU LAZARE1, NGO YAO ALEXIS2, SAVANE ISSIAKA2 1 Centre de Recherche en Ecologie, Laboratoire de Géologie Marine, Sédimentologie et Environnement, 08PO Box 109 Abidjan 08, Côte d’Ivoire [email protected] 2 Université Nangui Abrogoua , Laboratoire Géosciences et Environnement, Côte d’Ivoire INTRODUCTION
The phenomena of drought and desertification that hit many African countries south of the Sahara have not spared the Ivory Coast, especially from the 1970s. The drought of 1980 has highlighted the limits of hydroelectric power production and Ivory Coast was confronted with unwanted interruptions in electricity supply. These outages were severely felt in 2010. The operation of dams becomes increasingly difficult because of fluctuations affecting hydro resources (Kouassi, 2007). According to Doudja et al. (2007), droughts, whose appearance and occurrence in a given year represent a case of irregular rainfall, are important climatic phenomena which deserve to be studied in order to understand and adopt adaptation and mitigation measures. In this study we aim to model precipitation occurrence and distribution of wet and dry periods using Markov chain models (Pablo and Javier, 2011).
STUDY AREA
The Bia catchment is a watershed border between Ivory Coast and Ghana. Fig. 5 Meteorological stations and spatial distribution of annual mean precipitation during 1901–2009.
METHODS
The definition of a drought severity index (PDSI) allowed to highlight the rainfall trends on the one hand and on the other hand to analyse the impacts of variability or climate change on water resources.This index has determined the threshold of drought for the characterization of drought by Markov chains.Markov chains helped to determine the probabilities of succession of different States dry or wet from the rain on the Bia basin. A cartographic approach based on geomatics technologies has highlighted the probability distribution of the rains to spatial reference for a better management of the water resources of the basin.
RESULTS
Application of Drought Index (ISSP) at Bia basin

Hydrology in a Changing World: Environmental and Human Dimensions Poster Proceedings of FRIEND-Water 2014, Montpellier, France, 7-10 October 2014
87
Fig. 3 Evolution of standardized drought to the different stations in the basin of River Bia from 1901 to 2009
Analysis of the spatial variability of drought
Fig. 4 Spatial distribution of the likelihood of a dry spell lasting 2 years
Table 1 Return period, computed according to Markov chains of first order and given in year, to a new dry episode (Dry) and to a new wet episode (Wet)
Period (year)
From 1901 to 1945 From 1946 to 1970 From 1971 to 2009
Dry Wet Dry Wet Dry Wet
Agnibilékro 1,45 1,41 1,73 1,51 1,26 2,84
Enchi 1,45 1,41 1,50 1,08 1,26 2,84
Sunyani 1,73 1,24 1,78 1,27 1,19 4,56
Ayamé 1,56 1,06 1,64 1,42 1,24 3,82
Buakuc 1,70 1,11 1,73 1,51 1,25 3,25
Bianouan 1,67 1,16 1,58 1,58 1,25 3,25
The application of standardized drought index rainfall has distinguished three climatic trends from 1901 to 2009: a wet period from 1901 to 1945 followed by a normal period 1946 to 1970 and a dry period from 1971 to 2009. The most significant fluctuation is observed around 1970 and marked around 1980, during which there is generally quite a significant decrease in annual rainfall. This deficit period is ever since characterized by its intensity and duration. The study of the persistent drought, using Markov chains, showed that two successive dry years is more persistent in the basin of the River Bia.
REFERENCES
Doudja S-G, Nour Ed & Abd E.M.B. (2007). Simulation de la pluviométrie journalière en zone semi-aride par l’analyse en composantes principales. Sécheresse 18 (2), 97-105. Kouassi K.L. (2007). Hydrologie, transport solide et modélisation de la sédimentation dans les lacs des barrages hydro-électriques de Côte d’Ivoire : cas du lac de Taabo (Côte d’Ivoire). Thèse de doctorat, Université d’Abobo-Adjamé, Abidjan , Cote d’Ivoire. Pablo F.H.A. & Javier M.V. (2011). Regionalization of the probability of wet spells and rainfall persistence in the Basque Country (Northern Spain). Int. J. Climatol. 32, 1909–1920. Pita M.F. (2000). Un nouvel indice de sécheresse pour les domaines méditerranéens. Application au bassin du Guadalquivir (sud-ouest de l’Espagne). Publications de l’Association Internationale de Climatologie 13, 225-234. Zhi L., Francois B. & Jie C. (2013). Assessing the applicability of six precipitation probability distribution models on the Loess Plateau of China. Int. J. Climatol 33, doi: 10.1002/JOC3699

Hydrology in a Changing World: Environmental and Human Dimensions Poster Proceedings of FRIEND-Water 2014, Montpellier, France, 7-10 October 2014
88
Annual maximum stream flows of the Danube River in 1876–2005 PAVOL MIKLANEK1, PAVLA PEKAROVA1, JAN PEKAR2 & IVAN MESZAROS1 1 Institute of Hydrology Slovak Academy of Sciences, Racianska 75, 831 02 Bratislava, Slovakia [email protected] 2 Dept. of Applied Mathematics and Statistics, FMPI Comenius University, Bratislava, Slovakia DISTRIBUTION OF THE ANNUAL MAXIMUM STREAM FLOWS
The Danube River Basin is Europe's second largest river basin, with a total area of 817,000 km² and a total length of 2,857 km. The occurrence of the floods is analyzed the in the upper, central, and lower Danube basin based on archive data from the database of the project „Flood regime of rivers in the Danube River basin“. The time series of the maximum annual stream flow were used from 23 stations along the Danube. In the first part, the occurrence (Fig. 1) and propagation of the floods downstream the Danube River (Fig. 2) is analyzed between the stations Berg and Ceatal Izmail based on maximum annual stream flow series 1931–2005. The floods occur most frequently in June-August in the upper Danube basin, in April in the central part, and in April-May in the lower one. The floods in the upper and lower parts of the Danube basin do not occur in the same years necessarily. The high flows do not hit the whole area of the Danube basin.
Fig. 1 Number of occurrence of the annual maximum discharge in individual months in selected stations along the Danube.
Catastrophic floods on the upper (from the Danube source to Bratislava gauge), the middle, and the
lower (from the Orsova gauge to the river outlet) Danube, usually do not occur simultaneously. On the upper Danube from Passau city, the highest floods during the observation period occurred in years 1862, 1897, 1899, 1954, and 2002 (Fig. 2, left). On the lower Danube it have been those in the years 1897, 1940, 1942, 1970, 1980, or 1981. In the years 1897, 1965, or in 2006, the flood occurred in the whole Danube basin (Fig. 2, right).
Achleiten
0
5
10
15
20
25
30
35
Jan
Feb
r
Mar
ch
Apr
May
June
July
Aug
Sep
t
Oct
Nov
Dec
1901-2005
Bratislava
0
5
10
15
20
25
30
35
Jan
Feb
r
Mar
ch
Apr
May
June
July
Aug
Sep
t
Oct
Nov
Dec
1901-2005
Orsova
0
5
10
15
20
25
30
35
Jan
Feb
r
Mar
ch
Apr
May
June
July
Aug
Sep
t
Oct
Nov
Dec
1901-2005
Ceatal Izmail
0
5
10
15
20
25
30
35
Jan
Feb
r
Mar
ch
Apr
May
June
July
Aug
Sep
t
Oct
Nov
Dec
1931-2005

Hydrology in a Changing World: Environmental and Human Dimensions Poster Proceedings of FRIEND-Water 2014, Montpellier, France, 7-10 October 2014
89
Fig. 2 Development of the floods along the Danube channel in the selected years.
LONG-TERM TREND OF THE ANNUAL MAXIMUM STREAM FLOWS
In the second part the long-term trends are discussed of the maximum annual dischrge series of the Danube. The long-term trends were tested for period 1876–2005 for four stations along the Danube River, only. For the trend analysis we used the maximum annual discharge series in stations Linz, Stein-Krems/Kienstock, Bratislava and Orsova/Turnu Severin. The significant increasing trend was identified by Mann-Kendal test in station Linz in 1876–2005. The increase in Stein-Krems/Kienstock is less pronounced. The increasing trend was not confirmed in stations Bratislava and Orsova.
Fig. 3 Long-term trend of the maximum annual discharge at selected stations along the Danube. Acknowledgements This work was supported by the Slovak Research and Development Agency under the contract No. APVV-0015-10 and the Research & Development Operational Programme funded by the ERDF under the project implementation: 26240120004 ITMS.
1500
3500
5500
7500
9500
1875 1895 1915 1935 1955 1975 1995
m3 s
-1
Qmax Linz
2000
4000
6000
8000
10000
12000
1875 1895 1915 1935 1955 1975 1995
m3 s
-1
Bratislava
5000
7000
9000
11000
13000
15000
17000
1875 1895 1915 1935 1955 1975 1995
m3 s
-1
Orsova
0
5000
0000
5000
0000
050010001500200025003000river km
1899
1954
2002
0
5000
10000
15000
20000
050010001500200025003000river km
Qm
ax [
m3s-1
]
1897
1965
2006
c)

Hydrology in a Changing World: Environmental and Human Dimensions Poster Proceedings of FRIEND-Water 2014, Montpellier, France, 7-10 October 2014
90
Buffering Capacity of Constructed and Manipulated Wetland: Case Study Kirinya Wetland, northern Lake Victoria
FREDRICK J. MUYODI1, MOHSSINE EL KAHLOUN2, EPHRAIM N. BANADDA³ & PATRICK MEIRE4
1 Department of Biological Sciences, Makerere University, P.O. Box 7062, Kampala, Uganda [email protected]; [email protected] 2 University of Antwerp, Department of Biology, Ecosystem management research group, Universiteitsplein 1c. B2610 Antwerp, Belgium. 3 School of Food Science and Technology, Makerere University, P.O. Box 7062, Kampala, Uganda. 4 Universiteit of Antwerpen, Department of Biology (ECOBE), BE-2610, Antwerpen (Wilrijk), Belgium. Abstract Due to its importance in integrated water resources management of the Nile Basin, ecohydrology was proposed as a new component in the second phase of Friend-Nile II project funded by the Flemish Government through the UNESCO. Kirinya wetland in Uganda located at the northern shores was selected to identify the gaps on eco-hydrological issues and to suggest possible areas of focus. Kirinya wetland provides a water treatment function for wastewater from Jinja town, in addition to buffering Lake Victoria against runoff. The wetland was bio-manipulated with a perforated pipeline aimed at increasing wastewater distribution and contact surface through the wetland. Water quality was assessed before and after bio-manipulation, in addition to nutrient content. Improved treatment efficiencies were recorded after the bio-manipulation processes. It is recommended that bio-manipulation of existing and constructed wetlands can play a big role in water purification and enhancing the buffering capacity of these ecosystems. Key words ecohydrology, eutrophication, integrated water resource management, Kirinya, Lake Victoria, wetlands. INTRODUCTION Kirinya wetland in Uganda located at the northern shores was selected to identify the gaps on eco-hydrological issues and to suggest possible areas of focus. Kirinya wetland provides a water treatment function for wastewater from Jinja town, in addition to buffering Lake Victoria against runoff. Lake Victoria, shared by Uganda, Kenya and Tanzania, is an important natural resource because of its economic, social and aesthetic value to the people of these and other neighbouring countries. Unfortunately, the lake has undergone several ecological changes, which are manifested in the occurrence of algal blooms, low levels of oxygen in the water and the frequent fish- kills (Hecky, 1993). One of the key contributors to the deterioration of the lake water quality is the input of nutrients from the catchment. Much of this influx has been attributed to the degradation and destruction of wetland buffers at the land/water interface (Kansiime et al., 2007; Bugenyi et al., 2009). As a way of managing these crises arising out of mismanagement of natural wetlands, constructed wetlands have been taken on as mitigation measures, where natural wetlands have become degraded. This type of treatment is based around the beds of aquatic plants, with the sewage flowing through the root system. The plants transfer oxygen into the sewage via the roots and take up nutrients such as phosphorus and nitrogen. METHODS The wetland is located on the northern shore of Lake Victoria at Jinja, Uganda, in the Napoleon Gulf, at an altitude of 1175 m above sea level. It receives effluent from the stabilisation ponds of National Water and Sewage Cooperation (NWSC) in Jinja. The wetland is dominated by Cyperus papyrus and Phragmites mauritianus, and covers an area of 0.47 km2. The wetland was bio-manipulated with a perforated pipeline installed halfway across Transect 1 and aimed at increasing wastewater distribution and contact surface through the wetland. It also increased the retention time between the wastewater and the wetland treatment system. Wastewater flow patterns were ascertained by carrying out measurements along 3 transects cut across the wetland. Transect 1 (T1) received the inflow (effluent from the stabilization ponds, Transect 3 (T3) was adjacent to the wetland-lake interface while Transect 2 (T2) was in between. Water quality was assessed before (without) and after bio-manipulation, in addition to nutrient content using standard methods (APHA, 1998).

Hydrology in a Changing World: Environmental and Human Dimensions Poster Proceedings of FRIEND-Water 2014, Montpellier, France, 7-10 October 2014
91
RESULTS Improved treatment efficiencies were recorded after the bio-manipulation processes. Electrolytical conductivity (EC) in T1 before manipulation ranged from 600.7 ± 7.3 to 1876.0 ± 23.8 µS/cm; n = 6; after manipulation it ranged from 604.7 ± 11.3 to 1301.0 ± 7.0 µS/cm; n = 6; T2 before manipulation (311.7 ± 8.2 to 1810.0 ± 10.9 µS/cm; n = 6) while after manipulation it ranged from 377.0 ± 25.6 to 1301.0 ± 9.8 µS/cm; n = 6. For T3 the EC before manipulation ranged from 296.7 ± 8.7 to 1299.0 ± 10.6 µS/cm; n = 6) while after manipulation it ranged from 250.3 ± 3.4 to 700.0 ± 8.9 µS/cm; n = 6. Faecal coliforms (FC) in T1 before manipulation ranged from 428.1 ± 26.7 to 1958.0 ± 58.0 CFU/100 mL; n = 8 and after manipulation, it ranged from 197.4 ± 11.1 to 813.8 ± 46.3 CFU/100 mL; n = 8 while in T3 before manipulation ranged from 347.6 ± 15.6 to 496.4 ± 21.2 CFU/100 mL; n = 8 and after manipulation was 317.4 ± 5.3 to 379.1 ± 5.5 CFU/100 mL; n = 8. The results show that the concentration of total nitrogen (TN) were greatest in samples taken from T1 followed by T2 and then T3. Ammonium nitrogen (NH4-N) levels were highest in T1 (6.1 ± 0.6 to 25.4 ± 1.0 mg/l; n = 8) followed by T2 (6.2 ± 0.5 to 15.6 ± 1.1 mg/l; n = 8) and T3 (5.2 ± 0.7 to 9.4 ± 0.8 mg/l; n = 8). The same trend was observed for total phosphorus and orthophosphate. Other parameters tested showed the similar trend. This implied that water quality improves as the wastewater flows towards the lake highlighting the importance of bio-manipulation potential of the wetland vegetation. DISCUSSION The measured parameters reduced from T1 towards T3 indicating improvement in the water quality as the water flows through the wetland towards Napoleon Gulf. The distribution pipeline increased the contact surface area and the retention time between the wastewater and the wetland treatment system and hence improved treatment efficiency of the tertially effluents by the wetland system. Related studies on wetland functioning have been done by various workers (Muyodi & Hecky, 2005; Bugenyi et al., 2009; Muyodi et al., 2010). CONCLUSIONS AND RECOMMENDATIONS Effluent bio-manipulation of the natural wetland improved effluent quality from the municipal wastewater treatment and can be adopted by other municipalities. Bio-manipulation of existing and constructed wetlands can play a big role in water purification and enhancing the buffering capacity of these ecosystems. Restoration of wetland vegetation is suggested to enhance the ecosystem function of this wetland in addition to bio-manipulation. Acknowledgments Special thanks are due to the “Flemish Government through UNESCO” for funding this work. We also thank all members of the FN-Nile ecohydrology component. Dr. Zaki Abdelaziz, offered administrative support and facilitated the work. REFERENCES APHA. (1998). Standard methods for the examination of water and waste waters. 20th edn. American Public Health Association, Washington, D.C. Bugenyi, F.W.B., Kizito, Y.S, Luyiga, S., Miyingo-Kezimbira, A. & Muyodi, F. (2009). Wetlands. In: Larsson, P., Kirumira, E.K,
Steigen, A.L. and Miyingo-Kezimbira, A. (eds), Sharing Water: Problems, Conflicts and Responsible Solutions – The case of Kampala. Universitetsforlaget AS, Oslo, Norway. ISBN: 978-82-15-01444-9.
Hecky, R. E. (1993). The eutrophication of Lake Victoria. Verh. Internat. Vierin. Limnol. 25: 39-48. Muyodi, F.J and R.E. Hecky. (eds). (2005). Water Quality Synthesis for LVEMP-1. Final Report. Lake Victoria Environmental
Management Project (LVEMP), Republic of Uganda, World Bank. Muyodi, F.J., Bugenyi, F.W.B. and Hecky, R.E. (2010). Experiences and Lessons Learned from Interventions in the Lake Victoria basin: the Case of Lake Victoria Environmental Management Project. Lakes & Reservoirs: Research and Management, 15(2): 77-88.

Hydrology in a Changing World: Environmental and Human Dimensions Poster Proceedings of FRIEND-Water 2014, Montpellier, France, 7-10 October 2014
92
Recorded changes over hydrological extremes of Oubangui at Bangui (Central African Republic): trends analysis
CYRIAQUE-R. NGUIMALET Département de Géographie, Faculté des Lettres et Sciences Humaines (Université de Bangui), B.P. : 1037 - Bangui (République Centrafricaine) - [email protected]
INTRODUCTION The Oubangui at Bangui is a transborder basin of 499,000 km2 which extends in DRC (fig. 1). This fluvial corridor is the main North affluent of Congo and long of 546 km from Mbomou-Uele confluent to the Bangui’s outlet. The river regime is Sudano-guinean’s, marked by two contrasted seasons: rainy and dry, determining the Oubangui flow dynamics leading to both risings and low-water levels regimes at Bangui since 1935. So this work analyzes the recorded Oubangui’s regime changes over annual risings and low-water levels critical discharges due to persistent climatic variability since 1970s up to date.
Fig. 1 The Oubangui at Bangui catchment.
PROBLEM Bravard (2000) attempted to understand the hydrological extreme either as reducible handicaps or like patriarchal components to save, because these ones are admitted since the debut of 1990s such a new scientific and societal deal through biodiversity and unsettlement in floodplains. Nguimalet and Ndjendolé (2008), as for them, discussed hydrological extreme like the indicators of the Mesozoic Mouka-Ouadda Sandstones’ water resources assessment, using low-water levels discharges of Pipi at Ouadda (2,576 km2). In this paper, risings and low-water levels’ discharges are analyzed in order to detect changes on hydrological extremes due to climate decline persistence in Africa since 1970s. So how were the changes effects recorded on risings and low-water levels? What were this evolution on annual risings, annual low-water levels and multi-annual trend?
DATA AND METHODS Annual averages and mainly maximum and minimum daily mean discharges data over 1911-2005s periods were used basing on CAR hydrological year (April 1st-March 31). They were subjected to statistical tests (flow indices, R irregularity indices, seek for trends and appearance dates changes of risings and low-water levels etc.). The appearance dates of risings and low-water levels’ annual peaks were used with HYFRAN Plus1 software for detecting changes in the occurrence dates in time. Additionally, risings power with A coefficient (A = Qmax (m3/s)/√S (km2)), and specific flow were calculated. Also the depletion coefficients were calculated to establish climate variability effect on low-water levels discharges and assess its total potential groundwater discharge regarding to rainfall decline into the basin. Data analysis based on 1969-1970s interruption date in the series.
RESULTS Risings power, a coefficient evolution According to the A coefficient, the reference rising on Oubangui at Bangui was recorded on October 1916 (A coefficient: 22.65); it is followed by those of 1961 (A coefficient: 20.39) and 1964 (A coefficient: 19.96). Reversely, the weakest rising is noted on 1990 (A coefficient: 6.98). The average A coefficient is 15.25 on 1911-1970 periods and 11.87 on 1971-2005 periods. So risings kept their power
1 Conceived by Chair team in Statistical hydrology (HYDRO-QUEBEC/ALCAN/ CRSNG) at INRS-ETE (University of Québec).

Hydrology in a Changing World: Environmental and Human Dimensions Poster Proceedings of FRIEND-Water 2014, Montpellier, France, 7-10 October 2014
93
although hydrological drought is severe during 1980 and more in 1990 decades, due to A coefficients <10 (figure 2). Low-water levels severity, indicator of changes or hydrological degradation Averages R irregularity indices per period are 10.62 (1960-1969), 18.31 (1970-1974) and 29.1 (1983-2005), showing the indices gradual increase on 1970s, mainly since 1983s (figure 3). Coefficients varied from 20 (1995-1996) to 54 (2002-2003) when Oubangui’s recorded weakest minimum discharge (227 m3 s km-2). Additionally, the calculated depletion coefficients have increased in time from a year to another: the highest depletion coefficient has been recorded on 2000-2001s (0.0251 day-1) and the lowest on 1953-1954 (0.0133 day-1) (figure 4). Dry season seems longer than rainy one due to the 2000-2001s depletion coefficients for example.
Fig. 3. R irregularity indices
Fig. 4. Depletion coefficient over 1935-2005 periods
Hydrological changes trends and effects on risings and low-water levels’ occurrence During 1970-2005s, risings dates are passed from October (1911-2005) to November (1970-2005) and low-water levels’ ones from March-April (1911-2005) to April (1970-2005). A little shift of critical discharges recording dates characterizes these hydrological trends, signifying the extension of dry season duration maybe.
CONCLUSION Occurred changes on these hydrological extreme coincide with a rainfall decline (29%) characterized by low-water levels severity. Indeed, low-water levels’ specific flow is below 1 l s-1 km-2 since 1983 (figure 5). This evolution would indicate a basin groundwater decrease. In addition, the depletion coefficients increased since 1935s accentuating with some amplitude from 1969-1970s to date (figure 6). That established the total potential groundwater discharge weakness. So in such deficit climate context, what’s about water abstraction from Oubangui with reduced discharges to feed Lake Chad?
Fig. 5. Annual minimum specific discharges of Oubangui at Bangui (1911-2005)
Fig. 6. Depletion coefficients and total potential groundwater discharge of Oubangui at Bangui (1935-2005)
REFERENCES Bravard J.-P., 2000. Les extrêmes hydrologiques : handicaps réductibles ou composantes patrimoniales à sauvegarder ? In : Les régions
françaises face aux extrêmes hydrologiques. Gestion des excès et de la pénurie, Bravard J.-P. (eds), SEDES, 5-14.
Nguimalet, C.-R. & Ndjendolé, S., 2008. Les extrêmes hydrologiques : des indicateurs d’hydrodynamisme ou d’hydraulicité du plateau gréseux de Mouka-Ouadda sur la rivière Pipi à Ouadda (République Centrafricaine). Zf Geomorphologie, 52(1), 125-141.
Oubangui at Bangui
0
5
10
15
20
25
30
35
40
45
50
1911‐1912
1914‐1915
1917‐1918
1920‐1921
1923‐1924
1926‐1927
1929‐1930
1932‐1933
1935‐1936
1938‐1939
1941‐1942
1944‐1945
1947‐1948
1950‐1951
1953‐1954
1956‐1957
1959‐1960
1962‐1963
1965‐1966
1968‐1969
1971‐1972
1974‐1975
1977‐1978
1980‐1981
1983‐1984
1986‐1987
1989‐1990
1992‐1993
1995‐1996
1998‐1999
2001‐2002
2004‐2005
R irregularity index
Qmax/Qmin Mean R indices
Oubangui at Bangui
y = 8E‐05x + 0,0157
R2 = 0,3512
R = 0.6
0
0,005
0,01
0,015
0,02
0,025
0,03
1935‐1936
1938‐1939
1941‐1942
1944‐1945
1947‐1948
1950‐1951
1953‐1954
1956‐1957
1959‐1960
1962‐1963
1965‐1966
1968‐1969
1971‐1972
1974‐1975
1977‐1978
1980‐1981
1983‐1984
1986‐1987
1989‐1990
1992‐1993
1995‐1996
1998‐1999
2001‐2002
2004‐2005
Dep
letion coefficient
Depletion coefficient Linéaire (Depletion coefficient)
Oubangui at Bangui
0
0,005
0,01
0,015
0,02
0,025
0,03
19
35
-19
36
19
38
-19
39
19
41
-19
42
19
44
-19
45
19
47
-19
48
19
50
-19
51
19
53
-19
54
19
56
-19
57
19
59
-19
60
19
62
-19
63
19
65
-19
66
19
68
-19
69
19
71
-19
72
19
74
-19
75
19
77
-19
78
19
80
-19
81
19
83
-19
84
19
86
-19
87
19
89
-19
90
19
92
-19
93
19
95
-19
96
19
98
-19
99
20
01
-20
02
20
04
-20
05
Hydrological years
De
ple
tio
n c
oe
ffic
ien
t
0
10
20
30
40
50
60
70
80
90
To
tal p
ote
nti
al g
rou
nd
wa
ter
dis
ch
arg
e (
km
3)
Depletion coefficient Total potential groundw ater discharge (km3)

Hydrology in a Changing World: Environmental and Human Dimensions Poster Proceedings of FRIEND-Water 2014, Montpellier, France, 7-10 October 2014
94
Assessment of the environmental risk of glyphosate herbicide and its metabolite AMPA in the canals, surface water at Saigon - Dong
Nai and Mekong Delta TRAN-THI NHU-TRANG1, TRUONG LAM SON HAI1, DIDIER ORANGE2 & CAMILLE PICQUART3 1 Department of Analytical Chemistry, Faculty of Chemistry, University of Science – VNU-HCMC, 227 Nguyen Van Cu, District 5, Ho Chi Minh City, Vietnam [email protected] 2 Institut de Recherche pour le Développement, 44 Boulevard de Dunkerque, Marseille, France 3 University of Science and Technology of Hanoi, 18 Hoang Quoc Viet, District Cau Giay, Hanoi, Vietnam INTRODUCTION
Glyphosate [N-(phosphonomethyl)glycine] is a broad spectrum, nonselective postemergence herbicide. It is used for weed control in agriculture, forestry and gardens, and also on railway embankments. Rueppel et al. (1977) showed that glyphosate is rapidly adsorbed in soil and degraded to aminomethylphosphonic acid (AMPA) – its main metabolite and then transported to groundwater and surface water (Fig. 1).
Fig. 1 Glyphosate (left) and AMPA (right)
The success of glyphosate comes from its effectiveness for controlling perennial weeds and overwintering rhizomes and tubers, as well as from its safety in the environment due to its ability to bind to soil colloids and to be degraded by soil microbes, but the main factor for the increased use of glyphosate has been the introduction of glyphosate-resistant transgenic crops as reported by US Department of Agriculture (1996) and Castle et al. (2004). However, the continued use of glyphosate raises the potential for residue accumulation in water and crop commodities. Although reviews of Williams et al. (2000) on the safety of glyphosate and Roundup herbicide have concluded that glyphosate has been considered as a “toxicologically harmless” compound, recent studies of Marc et al. (2004) suggest that glyphosate-based pesticides affect cell cycle regulation. Castle et al. (2004) showed that, in the past decade, the use of glyphosate has grown steadily, and it has become the most frequently used herbicide all around the world. Consequently, glyphosate residues have been found in many samples, including vegetables as reported by Cox (1998). The US Environmental Protection Agency (USEPA, 1994) has set a maximum contaminant level of glyphosate in drinking water at 0.7 mg/L or 700 ppb based on the best available science to prevent potential health problems whereas EEC Council Directive 98/83/EEC (1998) set at 0.1 g/L (0.1 ppb) for surface water in the European Union. In the basin of Saigon - Dong Nai and Mekong rivers, most people who live there use directly surface water and/or groundwater for the human activities and agriculture. However, in Vietnam, there is not any regulation for the maximal permissible level nor the regular control not only for glyphosate but also for all pesticides in surface and drinking water. It is the first time that the assessment of the environmental risk of glyphosate and AMPA was reported in Vietnam. Our study would help to warn pollution levels, support for controlling the use of glyphosate in Vietnam as well as evaluating water quality.
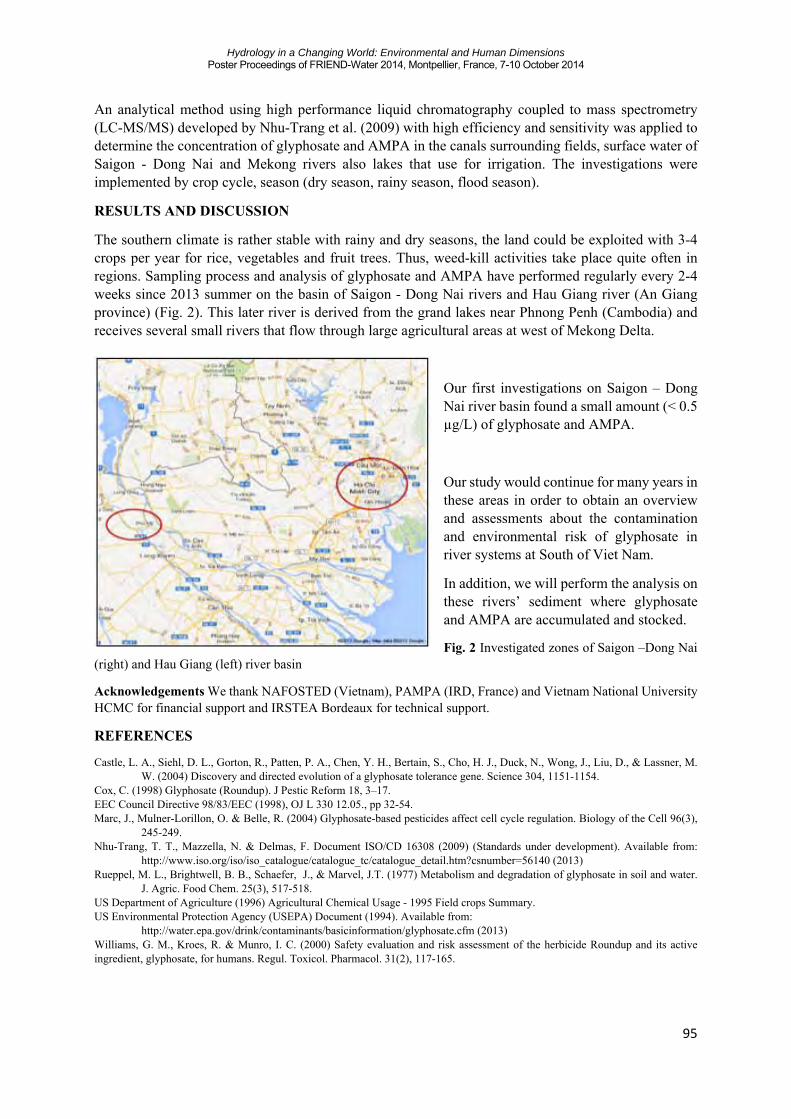
Hydrology in a Changing World: Environmental and Human Dimensions Poster Proceedings of FRIEND-Water 2014, Montpellier, France, 7-10 October 2014
95
An analytical method using high performance liquid chromatography coupled to mass spectrometry (LC-MS/MS) developed by Nhu-Trang et al. (2009) with high efficiency and sensitivity was applied to determine the concentration of glyphosate and AMPA in the canals surrounding fields, surface water of Saigon - Dong Nai and Mekong rivers also lakes that use for irrigation. The investigations were implemented by crop cycle, season (dry season, rainy season, flood season).
RESULTS AND DISCUSSION
The southern climate is rather stable with rainy and dry seasons, the land could be exploited with 3-4 crops per year for rice, vegetables and fruit trees. Thus, weed-kill activities take place quite often in regions. Sampling process and analysis of glyphosate and AMPA have performed regularly every 2-4 weeks since 2013 summer on the basin of Saigon - Dong Nai rivers and Hau Giang river (An Giang province) (Fig. 2). This later river is derived from the grand lakes near Phnong Penh (Cambodia) and receives several small rivers that flow through large agricultural areas at west of Mekong Delta.
Our first investigations on Saigon – Dong Nai river basin found a small amount (< 0.5 µg/L) of glyphosate and AMPA.
Our study would continue for many years in these areas in order to obtain an overview and assessments about the contamination and environmental risk of glyphosate in river systems at South of Viet Nam.
In addition, we will perform the analysis on these rivers’ sediment where glyphosate and AMPA are accumulated and stocked.
Fig. 2 Investigated zones of Saigon –Dong Nai (right) and Hau Giang (left) river basin
Acknowledgements We thank NAFOSTED (Vietnam), PAMPA (IRD, France) and Vietnam National University HCMC for financial support and IRSTEA Bordeaux for technical support.
REFERENCES
Castle, L. A., Siehl, D. L., Gorton, R., Patten, P. A., Chen, Y. H., Bertain, S., Cho, H. J., Duck, N., Wong, J., Liu, D., & Lassner, M. W. (2004) Discovery and directed evolution of a glyphosate tolerance gene. Science 304, 1151-1154. Cox, C. (1998) Glyphosate (Roundup). J Pestic Reform 18, 3–17. EEC Council Directive 98/83/EEC (1998), OJ L 330 12.05., pp 32-54. Marc, J., Mulner-Lorillon, O. & Belle, R. (2004) Glyphosate-based pesticides affect cell cycle regulation. Biology of the Cell 96(3), 245-249. Nhu-Trang, T. T., Mazzella, N. & Delmas, F. Document ISO/CD 16308 (2009) (Standards under development). Available from: http://www.iso.org/iso/iso_catalogue/catalogue_tc/catalogue_detail.htm?csnumber=56140 (2013) Rueppel, M. L., Brightwell, B. B., Schaefer, J., & Marvel, J.T. (1977) Metabolism and degradation of glyphosate in soil and water. J. Agric. Food Chem. 25(3), 517-518. US Department of Agriculture (1996) Agricultural Chemical Usage - 1995 Field crops Summary. US Environmental Protection Agency (USEPA) Document (1994). Available from: http://water.epa.gov/drink/contaminants/basicinformation/glyphosate.cfm (2013) Williams, G. M., Kroes, R. & Munro, I. C. (2000) Safety evaluation and risk assessment of the herbicide Roundup and its active ingredient, glyphosate, for humans. Regul. Toxicol. Pharmacol. 31(2), 117-165.

Hydrology in a Changing World: Environmental and Human Dimensions Poster Proceedings of FRIEND-Water 2014, Montpellier, France, 7-10 October 2014
96
A framework for evaluating local climate impacts on the surface-water balance and the hydrological regime in the Vu Gia-Thu Bon
basin in Central Vietnam PHUONG NGUYEN1, JOHANNES CULLMANN1, PATRICK LAUX2 1 IHP/HWRP Secretariat, Federal Institute of Hydrology, 56068 Koblenz, Germany [email protected] 2 Karlsruhe Institute of Technology (KIT), Institute of Meteorology and Climate Research, Department of Atmospheric Environmental Research (IMK-IFU), 82467 Garmisch-Partenkirchen, Germany Abstract The Vu Gia Thu Bon (VGTB) basin is located in Central Vietnam, a region that is dominated by a complex climate system. Its effects influent on all aspects in this area. Therefore, understanding local climate is of vital importance. This abstract evaluates the impacts of local climate on the surface-water balance and the hydrological regime. It may contribute considerably to finding suitable adaptation strategies for water resources. The purposes of this study are i) to determine the impacts of local climate on the surface-water balance and the hydrological regime in the VGTB basin over the period 1981 - 2000, and ii) to assess the ability of predicting water balance changes in response to local climate change for the future using both statistical methods and regional climate modelling. The study analyses the long-term trends of precipitation, which can be considered as important input variables for hydrological modelling. The model results are in good spatial and temporal agreement with the observations. Based on the A1B climate change scenario and updated land use datasets, the local climate changes and their effects on the local hydrological regime in the future is assessed.
Key words climate change; local climate; vu gia thu bon basin; hydrological regime; surface-water balance; WRF model; Vietnam LOCAL CLIMATE IMPACTS ON SURFACE-WATER BALANCE
In order to assess the climate in the Vu Gia - Thu Bon (VGTB) basin, the Weather Research and Forecasting Model (WRF-model) is applied to simulate atmospheric processes in the VGTB basin from 1981 to 2000. The correlation coefficient of monthly total rainfall at 13 stations within 20 years shows a large agreement between observations and simulations in this region (Fig.1). The distribution of the mean annual precipitation depth in the VGTB basin can be seen in Fig.2. Total rainfall in the model exceeds the values observed. However, rainfall distribution from the North to the South is largely consistent.
Fig. 1 Correlation coefficient of monthly rainfall amount (1981 – 2000) between WRF-ERA40 and Observations for different locations across the VGTB river basin.

Hydrology in a Changing World: Environmental and Human Dimensions Poster Proceedings of FRIEND-Water 2014, Montpellier, France, 7-10 October 2014
97
Fig. 2 Mean simulated (left) and observed (right) total annual rainfall (mm) in the VGTB basin (1981 – 2000)
In this paper, WRF is performed to assess
its ability to model extreme events. Fig.3 illustrates total rainfall during the El Niño period 1997 – 1998 compared with the normal year 2000. March 1998 and October 1997 each represent a dry respectively a wet season during the El Niño period. Moreover, they are compared with the dry and wet seasons in 2000. The reduction of rainfall in the El Niño period proves the ability of the WRF model to simulate this phenomena in the relevant area. WATER PROCESSES RESPONNSE TO LOCAL CHANGE IN THE FUTURE In recent years, a large number of studies have shown the impact of climate change on the increasing surface temperature and changing precipitation regimes. Based on the A1B climate change scenario, we will evaluate the
impacts of local climate on hydrological regimes in the future as regards land use scenarios created by the “Land Use and Climate Change interactions” (LUCCi) project. REFERENCES
Souleymane Fall, Dev Niyogi, Alexander Gluhovsky, Roger A. Pielke Sr, Eugenia Kalnay and Gilbert Rochon. (2010) Impacts of land use land cover on temperature trends over the continental United States: assessment using the North American Regional Reanalysis. International Journal of climatology 30, 1980–1993. DOI: 10.1002/joc.1996.
Souleymane Fall, Noah S. Diffenbaugh, Dev Niyogi, Roger A. Pielke Sr and Gilbert Rochon (2010) Temperture and equivalent temperature over the United States (1979 – 2005). International Journal of climatology 30, 2045–2054. DOI: 10.1002/joc.2094.
Vimal Mishra, Keith A. Cherkauer, Dex Niyogi, Ming Lei, Bryan C. Pijanowski, Deepak K. Ray, Laura C. Bowling and Guoxiang Yang. (2010). A regional scale assessment of land use/land cover and climatic changes on water and energy cycle in the upper Midwest United States. International Journal of climatology 30, 2025–2044. DOI: 10.1002/joc.2095.
Hiroshi G. Takahashi, Takao Yoshikane, Masayuki Hara, Kumiko Takata and Yasunari (2010). High-resolution modelliing of the potential impact of land surface conditions on regional climate over Indochina associated with the diurnal precipitation cycle. International Journal of climatology 30, 2004–2020. DOI: 10.1002/joc.2119.
a) b)
c) d) Fig. 3 Total rainfall in the VGTB basin related to ENSO 1997-1998 phenomena a) Mar -1998; b) Oct - 1997; c) Mar - 2000; d) Oct - 2000)

Hydrology in a Changing World: Environmental and Human Dimensions Poster Proceedings of FRIEND-Water 2014, Montpellier, France, 7-10 October 2014
98
Changements climatiques et mutations agraires dans les paysanneries de l’Est ivoirien
DABISSI NOUFE1, ÉRIC SERVAT3, BRUNO LIDON2, ISSIAKA SAVANE1 et TIE ALBERT GOULA BI1 1Laboratoire GéoSciences & Environnement, UFR-SGE Université Nangui-Abrogoua 02 BP 801 Abidjan 02, [email protected] 2HSM, UMR 050 (IRD)/UMR 5569 (CNRS) Université Montpellier 2 place Eugène Bataillon 34095 Montpellier cedex 05 ; 3CIRAD TA 60/02, UMR 34398, Montpellier cedex 05.
INTRODUCTION Depuis des décennies, l’Est ivoirien subit des modifications environnementales et climatiques.
Les études régionale et locale (Paturel et al. 1997; Bigot et al. 2005) mettent en évidence une diminution des cumuls pluviométriques interannuels qui se manifeste par une rupture de stationnarité des séries temporelles à la fin des années 60. D’où l’intérêt de s’interroger sur l’impact de ces décrochages sur les saisons culturales et sur les systèmes de culture, dans une zone d’économie de plantation ancienne telle que l’Est ivoirien. Et surtout si l’on s’accorde avec l’opinion généralement répandue que le climat constitue un des moteurs des transformations en agriculture pluviale conventionnelle, dans quelle mesure la donne climatique actuelle impacte-elle l’agriculture dans cette zone ? En effet, la modélisation de l’évolution des conditions hydriques de production couplées avec les systèmes de culture, montre que les changements climatiques actuels profitent aux cultures annuelles comme le maïs et permettent le développement de certaines cultures arbustives telles que l’anacardier et l’hévéa. Ces mutations se manifestent par des recompositions qui, compte tenu des contraintes du moment, laissent très peu de place à la protection environnementale.
MATERIEL ET METHODES Limité par le golfe de Guinée au sud, le Burkina Faso au nord et le Ghana à l’est, l’Est ivoirien
s’étend sur 75 000 km² entre les 5° et 10° N et 5° et 2° W. Ainsi, il apparaît une zonalité des principaux domaines climatiques qui se modifie du nord au sud (Fig. 1).
Fig. 6 Localisation de l’Est ivoirien et domaines climatiques associés (Adaptée de Noufé et al. 2011)
Tenant compte du rôle tampon de la réserve utile (RU) et de la distribution spatiale des pluies, cette étude vise, à partir d’un modèle de simulation du bilan hydrique journalier (Allen, 1998), à effectuer l’analyse fréquentielle du déroulement interannuel des saisons culturales (début, fin, durée) et du risque de déficit hydrique ; l’intérêt est d’évaluer l’impact de la péjoration pluviométrique sur les conditions agroclimatiques de la zone étudiée. Ainsi, les données pluviométriques journalières du SIEREM (Boyer et al. 2006), d’évapotranspiration potentielle (ETP) mensuelles issues de la base de données de l'Université East Anglia (Norwich, UK), et les niveaux des réserves utiles (RU) du sol retenus selon un gradient régional (Roose, 1981), ont permis de caractériser l’évolution interannuelle
-7 -6 -5 -4 -3 -25
6
7
8
9
10
ABIDJANDABOU
ABOISSO
ADIAKE
ALEPELAME
CECCHI
AZAGUIE
AGBOVILLE
AGNIBILEKROU
ABENGOUROUBONGOUANOUDIMBOKRO
BOCANDA
M'BAHIAKRO
ADZOPE
DABAKALA
BONDOUKOU
BOUNA
Domaine soudanien
Domaine soudano-guinéen I
Domaine soudano-guinéen II
Domaine guinéen
L E G E N D E:
Limite climatique probable

Hydrology in a Changing World: Environmental and Human Dimensions Poster Proceedings of FRIEND-Water 2014, Montpellier, France, 7-10 October 2014
99
des saisons de pluies et les conditions hydriques de production, 8 années sur 10 ; la description des systèmes de culture a été faite sur la base des enquêtes de terrain.
RESULTATS ET DISCUSSION En régime bimodal, si la grande saison culturale n’a pas connu de variation significative, la
petite a pratiquement disparu sur le littoral où elle atteint à peine 80 jours, 8 années sur 10 (Fig. 2). Ces contraintes associées à la saturation foncière, confèrent aux caféières et cacaoyères une extension inversement proportionnelle aux recrûs ligneux, allant du sous-espace I à IV (Tab. 1).
Fig. 7 Fréquences de dépassement 8/10 de la durée des saisons culturales en 1950-1969 et 1970-2000
Tableau 1 Recomposition paysagère dans le contexte actuel de crise agraire dans l’Est ivoirien
CONCLUSION
Comme on s’en doute bien, tous les facteurs de transformations (saturation foncière, appels du marché, changements climatiques, etc.) jouent enfin de compte. Mais peut-on les hiérarchiser? Difficile de répondre, tant ils sont imbriqués; à moins de leur appliquer une analyse multicritère.
REFERENCES Allen R. G., Pereira L. S., Raes D. & Smith M. (1998) Crop evapotranspiration: Guidelines for computing crop water requirements. Irr. & Drain. Paper 56. UN-FAO, Rome, Italy. Bigot S., Brou Y.T., Diédhiou A. & Houndenou C. (2005) Facteurs de la variabilité pluviométrique en Côte d’Ivoire et relations avec
certaines modifications environnementales. Sécheresse 16 (1), 14–21. Boyer J.F., Dieulin C., Rouche N., Cres A., Servat E., Paturel J.E. & Mahé G. (2006) SIEREM an environnemental information
system for water resources. IASH Publ. 308, 19-25 Paturel J.E., Servat E., B. Kouamé, Lubès H., Ouédraogo M., & Masson J.M. (1997) Climatic variability in humid Africa along the
Gulf of Guinea. Part II: an integrated regional approach. Hydrol. Sci. J.; 191, 16-36. Noufé D., Lidon B., Mahé G., Servat E., Brou T., Koli Bi. Z., Chaléard J-L., 2011. Variabilité climatique et production de maïs en
culture pluviale dans l’Est ivoirien. Hydrol. Sci. J. 2150-3435, 56 (1), pp. 152–167. Roose E. Les bilans de matières. In travaux et documents de l’Orstom. Dynamique actuelle des sols ferrallitiques et ferrugineux
tropicaux d’Afrique occidentale. Bondy : Orstom 1981. http://www.cru.uea.ac.uk/cru/data/hrg/

Hydrology in a Changing World: Environmental and Human Dimensions Poster Proceedings of FRIEND-Water 2014, Montpellier, France, 7-10 October 2014
100
Analysis of climate variability in Enugu state Nigeria using 30 years rainfall and temperature data
FIDELIS OKORIE1, AUSTINE NNAJI2 and CYPRAIN EZEDIKE3 1, 3 Department of Geography and Environmental Management, Imo State University, PMB 2000 Owerri, Nigeria. 2. Department of Environmental Technology, Federal University of Technology, Owerri, Nigeria. [email protected]
Abstract Climate and conditions in much of Africa are harsh and extreme. With increasing global warming and higher temperatures, a number of climatic phenomena have, been observed. The researchers believe that fluctuations in rainfall and temperature regimes are the atmospheric driving forces causing climate variations over Enugu state and the entire southeastern Nigeria, which is likely a global phenomenon. In that regards, this paper analysis climate variability in Enugu state of Nigeria using 30 years (1980-2009) rainfall and temperature data from Nigerian meteorological agency (NIMET). The results show rainfall fluctuation and temperature shift within the period under study, being the basis for the climatic variability, and the phenomenon is expected to lead to continuous increase in extreme climatic events. Key words: climate variations; analysis; meteorological parameters; Enugu; Nigeria
INTRODUCTION Many variations in temperature and rainfall particularly have occurred for different climatic regions and individual locations in Nigeria. For instance, in Southeastern region there is considerable variation in the total annual rainfall from year to year. This study assesses local climate variability in Enugu using 30 years rainfall and temperature parameters. Enugu State in the southeastern Nigeria is located between latitudes 50 58i N and 7008IN and longitudes 70081E and 70481E, and covers an area of 8, 212km2. It is situated within the Guinea savanna vegetation region, comprising mainly a mixture of tress interspersed with tall grasses. There is a marked seasonality of climate (wet and dry season) in the area. So due to the variability the state is observed to experience mean annual rainfall ranging from 1,800mm to 2,000mm. The temperature is also fluctuating. METHODOLOGY 30 years (1980-2009) mean monthly rainfall and air temperature data from Enugu synoptic station collected from Nigeria metrological Agency, Lagos, was used. From the data, total rainfall, mean annual rainfall and percentage mean annual rainfall for each year were calculated for the 30 years. On the other hand, maximum and minimum total temperature and maximum and minimum mean temperature for each year were also calculated as well as mean average temperature in each year for the same period.
RESULTS AND DISCUSSION This study established that as globally observed there is a variability and change in the weather and climate systems of Enugu state of southeastern Nigeria. For example, figure 1 below shows mean annual rainfall of 174.2mm in 1980, which in 1981 declined to 142mm, and 130.6mm in 1982. It decreased sharply to 76.1mm in 1983, (severe drought year) and increased to 148.3mm in 1984 and 175.5mm in 1985 being the highest mean annual rainfall in that decade (1980-1989). In 1990 it was 173.6mm, 131.5mm in 1993, 197.1mm in 1995, 205.7mm in 1997 and 171.9mm and 109.3mm in 2003 and 2008 respectively. On the other hand, air temperature showed a gradual steady increase and decrease which ranges from 0-1.70C. For example, in 1980, the mean annual temperature was 27.1oc; in 1982, 27.20c; in 1983, 27.7 0c; in 1987, 28.00c; in 1990, 27.70C and in 1994, 27.10c. Also in 1998, the temperature was 28.20c (the highest throughout the research period), and in 2004 it was 27.30c while in 2006 it was 26.50c (the lowest in the research period), then in 2008 and 2009, it was 27.00c (see figure 1). Also on a decadal level, the study indicated that the first decade D1 (1980-1989) had mean maximum rainfall (R1) of 175.5mm in 1985 and mean minimum rainfall (R2) of 76.1mm in 1983, while the highest mean average temperature (T1) and lowest mean average temperature (T2) of 28.00c and 27.00c were

Hydrology in a Changing World: Environmental and Human Dimensions Poster Proceedings of FRIEND-Water 2014, Montpellier, France, 7-10 October 2014
101
observed respectively in 1987 and 1989. The last decade D3 (2000-2009) had R1, 183.4mm in 2000 and T1,27.8oc in 2003 as well as R2, 109.3mm in 2008 T2, 26.5o c in 2006 etc.
Fig. 1 Graphical representation of rainfall and temperature variations in Enugu (1980-2009)
CONCLUSION Climate variability is a global phenomenon and it occurs from region to region. Many variations in rainfall and temperature have occurred in the state within the period of the research (1980-2009). For instance anomalous in mean annual rainfall were recorded in 1983 and 2008 with 1.7% and 2.4% respectively, and highest mean average temperatures of 28.0oc and 28.20c were observed in 1987 and 1998 respectively. This variability in the climate systems could have affected agricultural planning, water resources management and other environmental assessments in the state.
REFERENCES
Adegun, O., Balogun I, and Adeago D. (2012). Precipitation Concentration changes in Owerri and Enugu. “Hydrology for Disaster Management”. Special Publication of the Nigerian. Association of Hydrological Sciences, 2012.
Egboka, B.C.E. (1985). “Water Resources Problems in the Enugu area of Anambra State, Nigeria”. Proceedings of the Jerusalem Symposium, September 1985, IAHS publications. No 153.
Ezemonye, M.N and Emeribe, C.N. (2011) Correllogram Analysis of Trends and Cycles in Rainfall over south-Eastern Nigeria. Pakistan Journal of Social Science, 8(6), 325-333.
Okorie, F.C., Okeke, I.C., Nnaji, A.O., Chibo, C.N., Pat –Mbano, E. C. (2012). “Evidence of climate variability in Imo State of southeastern Nigeria”. Journal of Earth Science and Engineering. Vol. 2 No. 9. September 2012. pp. 544-553. David Publishing Company US
0
50
100
150
200
250
1980
1981
1982
1983
1984
1985
1986
1987
1988
1989
1990
1991
1992
1993
1994
1995
1996
1997
1998
1999
2000
2001
2002
2003
2004
2005
2006
2007
2008
2009
Mean Annual RF
Average Mean Temp

Hydrology in a Changing World: Environmental and Human Dimensions Poster Proceedings of FRIEND-Water 2014, Montpellier, France, 7-10 October 2014
102
Trends in Rainfall and Rainfall Related Extremes in the East Coast of Malaysia
OLANIYAN, OLUSEGUN MAYOWA & SHAMSUDDIN SHAHID
Department of Hydraulics & Hydrology, Faculty of Civil Engineering, Universiti Teknologi Malaysia (UTM), Johor Bahru, Malaysia [email protected] INTRODUCTION The east coastal region is considered as the most vulnerable area of Malaysia to hydrological hazards (NAHRIM, 2006). Floods triggered by heavy rainfall are almost every year phenomena in the region. Serious water deficiency due to long dry spell is also very frequent in the region. It is anticipated that future climate changes may involve modifications in climatic variability as well as changes in averages which in turn may produce relatively large changes in the probability of extreme events (Shahid, 2011). Historical rainfall recodes are analyzed in the present study to understand the ongoing changes in rainfall and rainfall related extremes in the east coast of Malaysia. DATA AND METHOD Long term (1971-2010) daily rainfall records at 55 stations in the three states of Kelantan, Pahang and Terengganu along the east coast of Peninsular Malaysia are collected from the Department of Irrigation and Drainage (DID), Malaysia for the study. Annual and monsoon rainfall as well as eleven extreme rainfall indices (Table 1) are calculated from the daily rainfall data. Trends in rainfall and rainfall related extreme are analyzed using Mann-Kendall test. Trends at different stations are interpolated using kriging method to show their spatial pattern. Details about trend analysis and mapping trends using GIS can be found in (Shahid, 2010).
Table 1 Definitions of Rainfall Indices used in the Study Index Description Unit AnnRain Annual Total Rainfall in a year mm RI Average Rainfall on Wet days in a year mm/day TWD Total number of Wet days (rainfall > 0) in a year day MonRain Rainfall during monsoon of a year mm CDD Maximum number of consecutive dry days (rainfall = 0) in a year day CDR<1 Maximum number of low rainfall days (rainfall<1) in a year day CWD Maximum number of consecutive Wet days (rainfall>0) in a year day C5DPT Total cumulative 5-Day rainfall amount in a year mm Max1DR Maximum 1-Day rainfall amount in a year mm M5DR Maximum 5-Day rainfall amount in a year mm Rain>20m Total number of days with rainfall>20mm in a year day Rain>95pctl Total number of days with rainfall>95th percentile of 1971-2010 daily rainfall day PCI Annual Rainfall concentration index in a year %
RESULTS AND DISCUSSION The maps showing the spatial pattern in the trends of rainfall and rainfall related extremes in the east coast of peninsular Malaysia are given in Figure 1. The results reveal that due to the increase in the monsoon rainfall, there has been an increase in the annual rainfall over the years. Cumulative 5-day precipitation total is on the increase as well as the high rainfall days and these may have been responsible for the flood events being experienced in the east coast of Peninsular Malaysia in the recent times. Extreme rainfall days are more pronounced in Terengganu and Kelantan areas which may have contributed to the extreme event of flood in these two coastal states of the peninsular Malaysia. The dry days and low rainfall days are decreasing which further corroborates the fact that the wet days are on the increase in the east coast of the Peninsular Malaysia. The Precipitation Concentration Index (PCI) is decreasing which is an indication that the rainfall has become more uniform in the coastal area of the Peninsular Malaysia.

Hydrology in a Changing World: Environmental and Human Dimensions Poster Proceedings of FRIEND-Water 2014, Montpellier, France, 7-10 October 2014
103
CONCLUSION Significant changes in rainfall and rainfall related extremes are observed in some parts in the east coast of Malaysia. It can be concluded that increase of rainy days and decrease of PCI will make the rainfall in the east coast more distributed over the seasons. But increase of heavy rainfall events will worsen the flood condition. Acknowledgement We are grateful to Universiti Teknologi Malaysia (UTM) and Ministry of Higher Education (Malaysia) for financial support of this research through ERGS grant no. PY/2012/00829 REFERENCES NAHRIM 2006. Study of the Impact of Climate Change on the Hydrologic Regime and Water Resources of Peninsular Malaysia. National Hydraulic Research Institute of Malaysia (NAHRIM) and California Hydrologic Research Laboratory (CHRL), United States. Shahid, S. 2011. Trends in extreme rainfall events of Bangladesh. Theoretical and Applied Climatology, 104(3): 489-499. Shahid, S. 2010. Rainfall variability and the trends of wet and dry periods in Bangladesh. Int J Climatology, 30(15):2299–2313.
Fig. 1 Spatial distribution in the trends of rainfall and rainfall related extremes in the east coast of Malaysia.

Hydrology in a Changing World: Environmental and Human Dimensions Poster Proceedings of FRIEND-Water 2014, Montpellier, France, 7-10 October 2014
104
Modélisation hydrologique dans un contexte de changement global en Afrique de l’Ouest
J.-E. PATUREL1,2, S. OUERMI2, H. KARAMBIRI2 1 IRD/HSM – case MSE - pl. E. Bataillon – 34095 Montpellier Cedex 5 – France [email protected] 2 2iE - Rue de la Science - 01 BP 594 - Ouagadougou 01 - Burkina Faso CONTEXTE
Depuis 1970, le climat a nettement changé en Afrique de l’Ouest, même si une légère reprise des précipitations s’observent dorénavant.. Cela a des répercussions sur le régime hydrologique des cours d’eau déjà perturbé par les changements environnementaux imputables à l’homme. Contraint par la pression démographique, l’homme a été amené à user d’actions telles que l’augmentation des superficies en terre agricole au détriment des espaces naturels. Une étude préalable (Lubès-Niel et al., 2003) avait abordé la question de la relation pluie-débit : quelle a été son évolution dans ce contexte de changement climatique en Afrique de l’Ouest et Centrale? Les auteurs concluaient que si on fait l’hypothèse que stabilité des paramètres d’un modèle peut signifier stabilité des processus de transformation de pluie en débit, alors le changement climatique n’implique pas nécessairement une modification du comportement hydrologique d’un bassin. Cependant dans 66% des cas, on observe une modification significative d’un point de vue statistique des jeux de paramètre de part et d’autre de ce changement climatique. Cela pose alors beaucoup de questions concernant certaines applications opérationnelles dédiées aux modèles hydrologiques comme par exemple les études d’impact du changement global. Le développement économique des pays en développement comme ceux de l’Afrique de l’Ouest étant étroitement lié au devenir des ressources en eau, dans quelles conditions peut-on supposer une bonne transférabilité d’un jeu de paramètres optimisés d’un modèle hydrologique d’une période à une autre sensiblement différente d’un point de vue global ? DONNEES ET METHODES
Cette étude s’est appuyée sur un jeu de trente-huit bassins (1 820 à 120 000 km²) décrivant plusieurs régimes pluviométriques (< 500 mm/an à > 2 000 mm/an), sur le modèle conceptuel à réservoir GR2M (http://fresno.cemagref.fr/webgr/Modeles/GR2M/fonctionnement_GR2M.htm) et sur le differential split-sample test (DSST), test proposé par Klemes (1986), qui permet une évaluation des modèles hydrologiques dans des conditions climatiques différentes. Trois périodes ont été distinguées (« avant 1970 », « 1970-1980 » et « après 1980 ») en fonction des modifications connues des régimes pluviométrique et hydrologique de la région et des transformations environnementales. En fonction des données disponibles et des bassins choisis, les précipitations annuelles ont pu varier jusqu’à -40% entre ces trois périodes, les évapotranspirations potentielles n’ont pas varié et les écoulements ont pu varier entre + 25% et -70%. La méthode d’optimisation se base sur la combinaison des algorithmes de Rosenbrock et du Simplex, l’efficience du calage se mesurant en termes de critère de Nash-Sutcliffe (NSE). RESULTATS
Analyse des performances de calage
Le modèle GR2M se cale globalement le mieux sur la période « 1970-1980 » puis sur la période « avant 1970 » et enfin sur la période « après 80 ». La période « 70-80 » se caractérise par un coefficient de variation des pluies plus faible que pour les autres périodes et inversement pour la période « après 1980 ». L’efficience du modèle apparaît comme plus importante sur les bassins où les pluies et les écoulements sont les plus importants moyenne mais les moins importants en variabilité (faible coefficient de variation). Concernant ce dernier point, il peut effectivement paraître normal que le modèle soit plus efficient sur une période où la variabilité hydroclimatique est moindre.

Hydrology in a Changing World: Environmental and Human Dimensions Poster Proceedings of FRIEND-Water 2014, Montpellier, France, 7-10 October 2014
105
Analyse des performances de validation entre périodes
Il est mieux de caler les paramètres du modèle GR2M sur une période sèche et de les appliquer sur une période humide pour avoir des résultats de simulations acceptables. Ces résultats sont semblables à ceux de Dezetter et al. (2008) sur des bassins ouest-africains et de Vaze et al. (2011) et Coron (2013) sur des bassins australiens mais contredisent ceux de Wilby (2005) sur des bassins anglais. Vaze et al. (2011) relient ce constat au fait que sur les bassins australiens, l’ETP est limitée par la disponibilité en eau, comme les bassins de notre zone d’étude, alors que les autres le sont par l’énergie. Il semble préférable de caler le modèle sur une période à dispersion importante et de l’utiliser sur une période à dispersion moindre ; cela va dans le même sens que Wilby (2005). Relation entre sensibilité et transposabilité d’un jeu de paramètres
Fig. 1 Sensibilité d’un modèle à ses paramètres n’est pas la même d’une période à l’autre (i.e. le modèle est plus sensible sur la période « après 80 » que sur la période « avant 1970 »). La transposition du jeu optimal de paramètres d’une période où la sensibilité des paramètres du modèle est élevée à une période où elle est moindre n’entraînera pas une baisse importante de performance du modèle (i.e. NSE : 75.0 47.2 ; inversement i.e. NSE : 85.4 -42.5)
CONCLUSIONS
La transposition des paramètres calés d’un modèle d’une période sur d’autres entraine généralement des baisses plus ou moins importantes selon les bassins de son efficience. Elle est liée à la sensibilité des paramètres du modèle. La diversité des résultats trouvés dans la bibliographie, leurs contradictions apparentes parfois montre que leur causalité reste un vaste champ à explorer (Coron, 2013). REFERENCES Coron L. (2013). Les modèles hydrologiques conceptuels sont-ils robustes face à un climat en évolution? Diagnostic sur un échantillon
de bassins versants français et australiens. Thèse AgroParis Tech, 364 p. Klemeš V., 1986. Operational testing of hydrological simulation models. Hydrological Sciences Journal 31 (1), 13-24. Lubès-Niel H., Paturel J.-E., Servat E. (2003). Study of parameter stability of a lumped hydrologic model in a context of climatic
variability. Journal of Hydrology 278, 213-230. Dezetter A., Girard S., Paturel J.-E., Mahé G., Ardoin-Bardin S., Servat E. (2008). Simulation of runoff in West Africa : Is there a
single data-model combination that produces the best simulation results? Journal of Hydrology 354, 203– 212. Vaze J., Post D.A., Chiew F.H.S., Perraud J.-M., Viney N.R., Teng J. (2010). Climate non-stationarity – Validity of calibrated rainfall–
runoff models for use in climate change studies. Journal of Hydrology 394, 447-457. Wilby R.L. (2005). Uncertainty in water resource model parameters used for climate change impact assessment. Hydrological
Processes 19, 3201–3219.
Optimum de
la période
après 1980
Optimum de
la période
avant 1970

Hydrology in a Changing World: Environmental and Human Dimensions Poster Proceedings of FRIEND-Water 2014, Montpellier, France, 7-10 October 2014
106
Water sources and flow paths in a forested catchment of the East Asian monsoon region
JEAN-LIONEL PAYEUR-POIRIER, LUISA HOPP & STEFAN PEIFFER Department of Hydrology, University of Bayreuth, Universitätsstraße 30, 95447 Bayreuth, Germany [email protected] Key words storm events; stable isotopes; chemical quality; hydrograph; ecosystem services
INTRODUCTION
It is generally accepted that human well-being depends mainly on ecosystem services, which are defined as “the benefits people obtain from ecosystems” (Millennium Ecosystem Assessment, 2005). In South Korea, the provision of freshwater from the Soyang reservoir is a highly valued ecosystem service by a significant percentage of the population, as the Soyang reservoir is one of the main sources of freshwater for the 25 million inhabitants of the Seoul Capital Area. In order to maintain the benefits obtained from this ecosystem, sufficient levels of water yield and water quality must be sustained. Water yield of the Soyang reservoir is tightly linked to water discharge of the forested catchments covering 85 percent of the Soyang basin area. Water discharge of these catchments greatly varies on an annual cycle, with the greatest variations occurring during the summer monsoon. It is hypothesized that the high precipitation regime of the East Asian summer monsoon causes significant changes in sources and flow paths of water in forested catchments, which in turn have effects on water discharge and water quality. In order to improve the sustainable management of water of the Soyang basin and reservoir, the coupling of hydrological and chemical processes within the former to the internal chemical processes of the latter must be solved. The results of this study are to provide a part of the solution by answering the following question, namely “In a forested catchment, when does water flow from what source, by which path, in what proportion and on what time-scale?”. This question strongly relates to the following statement by the United Nations in the World Water Development Report 4 (2012): “Understanding the movement of water and the spatial and temporal variability of water availability are the most important aspects of water resources that need to be understood and incorporated in planning and management for resource sustainability”. METHODS
The study was conducted at a site located in the north-eastern part of South Korea (Fig. 1). The site consists of a forested headwater catchment drained by a perennial stream and belongs to the snow, fully humid with warm summer climate (Kottek et al., 2006) and the temperate continental forest ecological zone (FAO, 2012). The site has an area of 0,155 km2 and is characterized by steep slopes and thin soils. Sixty percent of the catchment area is covered by purely deciduous stands while forty percent of the area is covered by purely coniferous stands. Although the site was managed in part at some point in time, it has a very natural and undisturbed character. During baseflow conditions, the stream emerges from the ground some 50 meters upstream from the outfall of the catchment. During and following major storm events, the stream emerges from the ground some 235 meters upstream from the outfall of the catchment. The selection of measurements was derived from the hydrometric, isotopic and hydrochemical approaches of the study, and also includes meteorological measurements as well as measurements for site characterization. A v-notch weir was installed at the outfall of the catchment where water stage and specific electrical conductance were measured at a high frequency from the beginning of June until the end of August, for the years 2013 and 2014. A total of four plots forming a hillslope-toeslope-riparian area transect were established within the coniferous part of the catchment. At each of these plots groundwater level and soil volumetric water content at different depths were measured. Water samples were collected from stream water, soil water and precipitation and were analysed for stable isotopes (δ18O and δ2H) and chemical quality (concentrations of chloride, silica, sulfate, sodium, potassium, calcium and magnesium). Samples were collected once per two days before and after the summer

Hydrology in a Changing World: Environmental and Human Dimensions Poster Proceedings of FRIEND-Water 2014, Montpellier, France, 7-10 October 2014
107
monsoon and, during the summer monsoon, every two hours for stream water and every day for soil water and precipitation. Meteorological measurements were made using a weather station and consisted of: throughfall precipitation amount, air temperature, relative humidity, wind speed, wind direction and downwelling radiation.
Fig. 1 Maps of Asia, Korea, the Soyang watershed and the study site.
RESULTS
The first results of the study clearly indicate strong effects of the high precipitation regime of the summer monsoon on the sources, flow paths, discharge and quality of water. Throughout the study period, the runoff coefficient varied in agreement with the variation in specific electrical conductivity of water at the outfall of the catchment, suggesting varying contributions of pre-event and event water to discharge. The runoff coefficient is also related to the antecedent soil moisture conditions of the site. A comparison of the site’s flow duration curve with that of a similar catchment reveals that the site responds more quickly than the latter in terms of runoff generation. The results of the recession analysis also reveal that runoff generation mechanisms vary throughout the study period. The temporal variation in the relative abundance of stable isotopes of water at the outfall of the catchment also suggests varying contributions of pre-event and event water to discharge. Further investigations will focus on the joint analysis of hydrometric, isotopic and hydrochemical data (Bonell, 1998; Burt and Pinay, 2005; Lohse et al., 2009; McDonnell, 2003). REFERENCES Bonell, M. (1998) Selected challenges in runoff generation research in forests from the hillslope to headwater drainage basin scale.
Journal of the American Water Resources Association 34(4), 765–785. Burt, T. & Pinay, G. (2005) Linking hydrology and biogeochemistry in complex landscapes. Progress in Physical Geography 29(3),
297–316. FAO (Food and Agriculture Organization of the United Nations) (2012) Global ecological zones for FAO forest reporting: 2010
Update. Rome, Italy. Kottek, M., Grieser, J., Beck, C., Rudolf, B. & Rubel, F. (2006) World Map of the Köppen-Geiger climate classification updated.
Meteorologische Zeitschrift 15, 259–263. Lohse, K. A., Brooks, P. D., McIntosh, J. C., Meixner, T. & Huxman, T. E. (2009) Interactions between biogeochemistry and
hydrologic systems. Annual Review of Environment and Resources 34, 65–96. McDonnell, J. J. (2003) Where does water go when it rains? Moving beyond the variable source area concept of rainfall-runoff
response. Hydrological Processes 17(9), 1869–1875. Millennium Ecosystem Assessment (2005) Ecosystems and Human Well-being: Synthesis. Washington, USA. WWAP (World Water Assessment Programme) (2012) The United Nations World Water Development Report 4: Knowledge Base.
Paris, France.

Hydrology in a Changing World: Environmental and Human Dimensions Poster Proceedings of FRIEND-Water 2014, Montpellier, France, 7-10 October 2014
108
Spatio-temporal analysis of monthly temperature in Peruvian mountainous areas. Validation of NCEP/NCAR and CRU data
PEDRO RAU1 THOMAS CONDOM2 & WALDO LAVADO3 1 Universidad Nacional de Ingeniería - IMEFEN. Lima 25, Lima, Peru [email protected] 2 Laboratoire d’étude des Transferts en Hydrologie et Environnement LTHE, IRD Great Ice CNRS, Grenoble 1, France 3 Servicio Nacional de Meteorología e Hidrología del Peru SENAMHI, Lima 11, Lima, Peru INTRODUCTION
Understanding the climate dynamics in mountainous areas still remains a challenge. In their role as storage of water, mountain areas are an important water supplier in the dry period to the lowlands. This offers an opportunity to analyze the variability of temperature, which represents one of critical forcing variables in hydrologic modelling (Ji et al, 2013) over Peruvian Andes characterized by data scarcity. It is also proposed a methodology for validate non in-situ data as NCEP/NCAR Reanalysis (National Center for Environmental Prediction and National Center for Atmospheric Research of USA, NNR hereinafter) and CRU (Climatic Research Unit of UK) monthly gridded temperature datasets by a correction of NNR data considering an altitudinal gradient and the validation of CRU data in terms of in-situ data. Finally, this validation could be used for any mountainous ungauged basin or for extending time series. METHODOLOGY
Time series analysis of in-situ data
In our study, 8 of 27 in-situ (SENAMHI) stations located above 3000 m.a.s.l have more than 30 years of data, enough record length for establish a coherent behavior (WMO, 2003) from 1965 to 2007. It was done a trend analysis with Mann-Kendall test (Man Kendall, 1975) and change-point detection with Pettitt test (Pettitt, 1979) for knowing the regional behaviour.
Correction model of NNR temperature data
NNR grids cover 9 quadrants over Peruvian Andes and have data from 1949. The in-situ temperature data are measured at altitudes which not correspond with pressure levels of NNR data. For NNR grid, it is proposed to make an altitudinal correction with equation 1, considering a regional monthly lapse rate expressed in °C/100m, obtained from in-situ data.
ki
NNRxiNNRBSiii
NNR
hhhhBSfc
kk )().( (1)
ifc = Correction factor for the month i / iBS = Mean Temperature of the base station for the month i /
i = Lapse rate for the month i / k
iNNR = Mean original NNR data for a k pressure level in the month i / BSh = Altitude (a.m.s.l) of base station / xh = Altitude (a.m.s.l) in an “x” point, where is wanted to correct NNR / kNNR
h = Altitude of NNR grid for the pressure level k.
Validation of CRU temperature data
CRU TS 2.1 grids cover 45 quadrants in this study and have data from 1931. Both NNR and CRU data were validated with in-situ data using two indices: 1) The correlation coefficient (%CC) adjusted for a lineal regression, assumed as acceptable when is greater than 70% and validated with a t-test for 99% of significance. 2) The relative root mean squared error (%RMS), assumed as acceptable when is lower than 50% (Gao et al, 2012). RESULTS
From Figure 1.a, white dots show that there are no significant trends at 99% of confidence level in the mean annual temperature, on the other hand, black dots show them for Southern Andean regions

Hydrology in a Changing World: Environmental and Human Dimensions Poster Proceedings of FRIEND-Water 2014, Montpellier, France, 7-10 October 2014
109
reaching the value of +0.03°C/yr. In Figure 1.b the linear inverse relationship between mean annual temperatures and altitude for in-situ data can be expressed in terms of an annual lapse rate of 0.9°C/100 m. The NNR 700 hPa level (~3000 a.m.s.l) and 600 hPa level (~4000 a.m.s.l) are close to terrain elevations of in-situ stations, being necessary correcting. This correction with equation 1 offers a very acceptable approximation to a symmetric function in Figure 1.c by comparison with an in-situ station (e.g. Condoroma station in the Southern region of Central Andes). This behaviour is obtained in many regions of Northern and Central Andes. In Figure 1.d, CRU data offers a good approximation considering that there is no necessary to correct in terms of CC% and RMS%.
Fig. 1 a) Location map, significant temperature trends represented by black dots. b) Relationship between mean annual temperature and altitude. c) Correction of NNR data by comparison with an in-situ station. d) Comparison between CRU data and an in-situ station. CONCLUSIONS
Knowing complex incertitude about climate change in high sites, we can infer that in a mid-term the Southern Andean region is under a climatic change process.
In terms of data availability in mountainous regions, it was presented a methodology for the use of reanalysis and climatological data model for the areas with scarce information. The NNR correction shows very acceptable correlation coefficients for a lineal adjustment and acceptable root mean squared errors in Northern and Central Andes. CRU data offers a good approximation. REFERENCES Gao, L. Bernhardt, M. and Schulz, K. (2012) Downscaling ERA-Interim temperature data in complex terrain. Hydrology and Earth
System Sciences (9), 5931–5953.
Ji, X. and Luo Y. (2013) The influence of precipitation and temperature input schemes on hydrological simulations of a snow and
glacier melt dominated basin in Northwest China. Hydrol. Earth Syst. Sci. Discuss (10), 807–853.
Kendall, M.G. (1975) Rank Correlation Methods. Charles Griffin, London UK. Pettitt, A. N. (1979) A non-parametric approach to change point problem. Appl. Stat. (28), 126-135. World Meteorological Organization. (2003) Climate: Into the 21st Century. Cambridge University Press.
y = -111.73x + 4751.9CC = 92%
3000
3200
3400
3600
3800
4000
4200
4400
4600
4800
2.0 4.0 6.0 8.0 10.0 12.0 14.0A
ltit
ude
(a.m
.s.l)
Mean annual temperature (ºC)
ORIGINALy = 0.35x + 0.71
CC = 83%RMS=58%
CORRECTEDy = 1.01x + 0.05
CC = 90%RMS=19%
-5
0
5
10
15
-5 0 5 10 15
NN
R (
°C)
CONDOROMA (°C)
ORIGINALy = 0.74x - 0.26
CC=89%RMS=36%
-5
0
5
10
15
-5 0 5 10 15
CR
U (
°C)
CONDOROMA (°C)
a)
b)
c) d)

Hydrology in a Changing World: Environmental and Human Dimensions Poster Proceedings of FRIEND-Water 2014, Montpellier, France, 7-10 October 2014
110
Comparing a semi-distributed and a global method for radar calibration
FELIX RAYNAUD1, VALERIE BORRELL-ESTUPINA1, ALAIN DEZETTER2, SEVERIN PISTRE1, HELENE MATHIEU-SUBIAS3 & ERIC SERVAT2
1 UM2, 2 IRD – UMR HydroSciences Montpellier, Place E. Bataillon, 34395 Montpellier Cedex 5, France. [email protected] 3 Direction Départementale des Territoires et de la Mer de l’Aude, Service Prévention des Risques, 105 Boulevard Barbès, 11838 Carcassonne Cedex 9, France. INTRODUCTION
Small Mediterranean catchments are particularly exposed to extreme rainfalls which generate devastating flash floods that may cause human and material damages. Hydrological modelling can improve flood forecasting, however, the lack or absence of data may bias modelling approaches since the karst plays a significant role in the dynamics of these floods by absorbing or amplifying their intensity according to the saturation state (Dörfliger et al., 2008). Furthermore, rainfall in Mediterranean regions is characterized by a high spatial variability, yet rain gauge networks are generally too sparse to access to sufficient information on this heterogeneity. Using data issued from weather radar may be an attractive alternative, but many errors that affect this measurement require suitable corrections (Berne & Krajewski, 2013). METHODS
Radar calibration
Data issued from the weather radar had to be corrected in order to reduce errors due to measurement. In this study we chose a method which merge radar rainfall and rain gauge rainfall. We first applied a global method called Mean Field Bias (MFB) (Vieux & Bedient, 2004). This method calculates a global correction coefficient for an event which is applied to the entire radar image. In order to improve the correction, we have developed a new calibration method based on the MFB taking into account the spatial variability of rainfall. Three factors have been intersected to define five calibration zones. This method is called Semi-Distributed Mean Field Bias (SMFB).
Hydrologic model
To simulate river flow, we chose a distributed, event-based conceptual model developed by Coustau et al. (2012) on the Lez karstic watershed. The model combine a variable runoff model based on the Soil Conservation Service (SCS) model, an underground reservoir simulating transfers of water in the soil and the karst, and a Lag and Route routing model. The model is initialized with the piezometric level observed in the karstic aquifer. Model performances have been estimated on the discharge at the outlet with the Nash-Sutcliffe efficiency (NSE) criteria.
STUDY AREA AND DATA
Study area
The Cesse catchment is located in the South of France. The basin is 248 km² at the Mirepeisset discharge station. Land use is essentially forest, the urban cover is poor. The karstic aquifer is formed in Paleogene terrains, and it outcrops on about a third of the basin.
Data
Flow data are available at the outlet of the basin and piezometric levels are measured at the Mailhac station, in connexion with the karst behavior. The rain gauge network is too sparse to assess the spatial heterogeneity of rainfall in this area; however data issued from the Opoul weather radar (located 40 km south of the outlet) are available since 2001, with a resolution of 1 km² and a time-step of 1 hour. We identified eight events, including two heavy floods, three medium and three low floods from 2002 to

Hydrology in a Changing World: Environmental and Human Dimensions Poster Proceedings of FRIEND-Water 2014, Montpellier, France, 7-10 October 2014
111
2013. Spatial rainfalls injected in the model were of four kinds: rain gauge rainfall interpolated by kriging, raw radar data, and MFB and SMFB-corrected radar data.
RESULTS AND DISCUSSION
Calibrations efficiency
To assess the quality of radar calibration, the correlation between radar data and rain gauge data has been computed for raw data, MFB-corrected data and SMFB-corrected data. Gains of correlation relative to raw data showed that the SMFB method improves the correlation for each episode, with an average gain of 34% (against 7% for the MFB), so this novel approach seems to be the most efficient.
Model performances
The average NSE has been calculated for each rainfall data and for heavy, medium and low floods. Results show that MFB (NSE up 0.71) to and SMFB (NSE up to 0.68) corrections improve considerably the performances for heavy and medium floods, in comparison with rain gauge and raw radar rainfall data. These performances are encouraging in the context of flood forecasting. However, the distributed calibration approach turns out to not improve the model performances.
Initialization
In the runoff model, the size of the soil reservoir S is related to the initial state of the basin. Two main indicators have been correlated with S. The initial piezometric level at the Mailhac station obtained the best results in terms of correlation with S (up to 87% with the SMFB-corrected rainfall). The Hu2 indicator, which is a spatial soil wetness index obtained daily and with a 8x8 km² resolution by the Safran-Isba-Modcou (SIM) model developed by Meteo-France, showed a poor correlation with S (up to 35%), certainly because the SIM model does not take into account the role of the karst.
CONCLUSION AND PROSPECTS
The implementation of a spatial dimension in the method of calibration improved the correlation with rain gauge rainfall, but did not lead to higher performances in simulation. This means that bringing the radar data closer to rain gauge data is not necessarily a good approach. Assimilating flow data from the model output to correct radar data could probably provide a better approximation (Harader et al., 2012). Moreover, this kind of approach cannot be applied to forecast floods, because the correction factor is calculated over the entire event. However, it would be possible by calculating this factor for each time step, accounting with previous rainfall observed by the radar and the gauges. The model performances clearly showed that the use of radar rainfall, with suitable corrections, can greatly improve simulations of heavy and medium floods. This result is very interesting in the context of flood forecasting. We showed that model initialization is possible with piezometric level, and this indicator had shown the predominant importance of the role of karst in the runoff model.
REFERENCES Berne, A. & Krajewski, W.-F., 2013. Radar for hydrology : Unfulfilled promise or unrecognized potential? Adv. Water Resour. 51,
357-366. Coustau, M., Bouvier, C., Borrell-Estupina, V. & Jourde, H., 2012. Flood modelling with a distributed event-based parsimonious
rainfall-runoff model: case of the karstic Lez river catchment. Nat. Hazards Earth Syst. Sci. 12, 1119–1133. Dörfliger, N., Fleury, P., & Ladouche, B., 2008. Inverse Modeling Approach to Allogenic Karst System Characterization. Ground
Water 47(3), 414-426. Harader, E., Borrell-Estupina, V., Ricci, S., Coustau, M., Thual, O., Piacentini, A. & Bouvier, C., 2012. Correcting the radar rainfall
forcing of a hydrological model with data assimilation: application to flood forecasting in the Lez catchment in Southern France. Hydrol. Earth Syst. Sci. 16, 1–18.
Vieux, B.-E. & Bedient, P.-B., 2004. Assessing urban hydrologic prediction accuracy through event reconstitution. J. Hydrol. 29, 217-236.

Hydrology in a Changing World: Environmental and Human Dimensions Poster Proceedings of FRIEND-Water 2014, Montpellier, France, 7-10 October 2014
112
The evaporation reduction of Algerian open water storages by monolayers
S. SAGGAÏ, D. BOUTOUTAOU University of Kasdi Merbah Ouargla, Laboratory of Exploitation and Valorisation of Natural Resources in Arid Zones, Faculty of Sciences and Technology and Sciences of Material, Ouargla 30000 Algeria. [email protected]
INTRODUCTION While the long-term effects of climate change are largely unknown, there is concern that rainfall patterns will alter, and that some areas will experience decreased rainfall (Barnes, 2008). For example, large areas of southern Algeria have experienced drought conditions over much of the past decade and as a consequence water storages are being adversely affected. This is focusing attention on the ways that available water is used and shows the need for improvements in the efficient use of water in agriculture, industry and urban areas. One major source of loss comes from the evaporation of water. Ouargla’s area, for example, the decrease in water level attributed to evaporation averages about 2.6 m/year (Boutoutaou, 1995). Means of reducing this loss are being studied. For small storages, mechanical devices are effective, but for large areas of water surface they are not economic. For these large storages the use of spread monolayers to reduce evaporation has the potential to be an attractive and cost effective solution. The objective of this paper is to present the first Algerian field trials of water plans evaporation reduction by monolayers of hexadecanol and octadecanol.
MATERIALS Pan evaporation Evaporation from open water storage can be determinate by two ways: energy balance and water balance. In our analyses, we used water balance equation. For eliminating infiltration and seepage (which are very difficult to estimate) we use evaporation pan and the water balance becomes: E P δD (1) Pans used in our experience were of Colorado-type with one meter square and half meter deep. Since pan evaporation (Epan) normally exceeds evaporative losses from water plans (Ew), researchers commonly adjust the pan data as follows: Ew Epan. Kpan. (2) where Kpan is a pan coefficient which generally depends on the pan and the surrounding environment. In Algerian Sahara the adopted pan coefficient for the Colorado-type pan is 0.78 (Dubief, 1950). Monolayers It has been known for a long time that monolayers of certain surfactants can retard water evaporation (Rideal, 1925). For many years, important studies in laboratory scale were carried out in order to identify the optimal substances and conditions for reducing water evaporation (Langmuir & Langmuir, 1927and Archer & La Mer, 1955). Among the surfactants tested, biodegradable fatty alcohols of low toxicity presented the highest resistance to water evaporation, especially hexadecanol and octadecanol (La Mer & Healy, 1965), which were the used substances in our experience and were applied as powder.
APPLIED METHOD The experimental site was located at 32°52’ N, 05°26’ E. The evaporation pans were partially buried and placed one near each other. They were filled by water by 80% of total volume and covered by wire mesh to prevent animals drinking. The first pan was covered by Hexadecanol “0.336 g/m2”; the second by mixer of Hexadecanol and Octadecanol “0.336 g/m2” (0.168g:0.168g); the third by Octadecanol “ 0.336 g/m2” and the fourth (the ‘control’) contained only water. Both formulations were put on the respective water surface every three days, in order to form a monolayer. In addition to the water losses by evaporation in pans, air temperature, wind velocity, and humidity were measured every day.

Hydrology in a Changing World: Environmental and Human Dimensions Poster Proceedings of FRIEND-Water 2014, Montpellier, France, 7-10 October 2014
113
RESULTS Figures, 1 and 2, compare the rate of evaporation accumulate evaporation in the four pans. Figures, 3 and 4 show the influence of meteorological parameters on evaporation reduction (ER) rate.
Fig. 1 average of every three days evaporation (mm). Fig. 2 accumulate of evaporation in pans (mm).
Fig. 3 Variation of ER rate in relation to temperature. Fig. 4 Variation of ER rate in relation to windspeed.
DISCUSSION It is well known that the combination of high temperatures low humidity and dry winds create the strongest conditions for evaporation from open water (Remini, 2005). These meteorological parameters were present in the Ouargla region during the experimental period: temperature Tmax average of 41°C, humidity Hmin average of 19 %, and wind u10m at 10 m, average of 5 m/s, had caused losses by evaporation more than 10 mm/day in control pan. As is shown in Figure 1, losses by evaporation were significantly greater in the control pan which means that monolayers have an effect in reducing the rate of evaporation. This result is consistent with the observations of Barnes (2008) who concluded that monolayers have good efficiency in evaporation reduction. The losses by evaporation in the covered pans were found to depend on the used alcohol; they were less in the pan covered by monolayer of mixer of hexadecanol and octadecanol with an average of 7.4 mm/day. These results go with those obtained by Gugliotti (2005) who reported that mixed films of hexadecanol and octadecanol showed high potential of evaporation reduction. Meteorological factors, especially wind and temperature, also affect monolayer proprieties. The values of wind measured during the period of experiment did not exceed 5 m/s for most of the time. These results agree with those of Vines (1962) who showed that no evaporation reduction could be detected when winds exceeded 6.7 m/s. For the temperature more the temperature increases, more the resistance in the evaporation is reduced. These results agree with those of Mansfield (1958) who found that the evaporation resistance of a monolayer fell at higher temperatures.
REFERENCES Archer, R. J.; La Mer, V. K., (1955). The rate of evaporation of water through fatty acid monolayers. J. Phys. Chem., 59, 200. Barnes G.T., (2008). The potential for monolayers to reduce the evaporation of water from large water storage, Agr. Wat. Manag. vol. 95, pp 339 – 353. Boutoutaou D., (1995). Evaporation des surfaces des plans d’eau des retenues et barrages en Algérie. Thèse de Doctorat en Scie.Tech. Inst Hyd., Moscou, 200pp. Dubief J., (1950). Evaporation et coefficients climatiques ah Sahara; Travaux de l’I R S. Tome 6, Univ. d’Alger. Gugliotti M, Baptista M. S .and Politi M. J., (2005). Reduction of evaporation of natural water samples by monomolecular films. J. Braz. Chem. Soc., Vol. 16, No. 6A, 1186-1190, 2005. La Mer V. K.; Healy, T. W.; Science 1965, 148, 36. Langmuir, I.; Langmuir, D.; effect of monomolecular films on the evaporation of ether solution J. Phys. Chem. 1927, 31, 1719. Mansfield W. W., (1958). The influence of monolayers on evaporation from water storages. I. The potential -performance of monolayers of cetyl alcohol. Austral. J. appl. Sci., vol. 9, no. 3, p. 245-54. Rideal, E.K., (1925). On the influence of thin surface films on the evaporation of water. J. Phys. Chem. 29,, 1585. Remini B., (2005). L’évaporation des lacs de barrages dans les régions arides et semi arides : exemples algériens. Larhyss Journal, pp.81-89. Vines, R.G., (1962). Evaporation control: A method of treating large water storages. In: V.K. La Mer (Editor), Retardation of evaporation by monolayers: Transport processes. Academic Press, New York, pp. 193-202.

Hydrology in a Changing World: Environmental and Human Dimensions Poster Proceedings of FRIEND-Water 2014, Montpellier, France, 7-10 October 2014
114
Assessment of the hydrological regime in the Upper Don River Basin under a changing climate
SENTSOVA NADEZDA Water Problems Institute of Russian Academy of Sciences, 119333 Russia, Moscow, 3, Gubkin St., IWP RAS [email protected] The hydrological regime is formed under influence both natural and anthropogenous factors. On the first place among them there is a climate condition. As a result of various influences there is a redistribution of the river runoff that can cause negative changes in the environment. Frequently as a result of various effects there occurred negative changes of an environment. The increase of a number of droughts and flooding is observed. It is necessary to estimate the reaction of the rivers hydrological regime to changing climate. This purpose requires the research of long-term and seasonal fluctuations of the river runoff, the analysis of time series of meteorological characteristics, revealing trends. The object of researches is the Upper Don River. It is located in the Central part of Russia within the limits of forest-steppe zone. The drainage area is about 69500 km2. Climate in the basin is continental. More than 20 water gauges are now in operation in the basin. Observations on them were started in the beginning of XX century. The longest series of runoff observations is near the town Lisky (more than 120 years). This point is chosen as basic for the research of long-term fluctuations of annual runoff. Don concerns to rivers of flat type with sharply expressed spring high water and small low-water runoff. The river runoff is distributed on time and space non-uniformly. It creates an intense hydroecological situation (Bolgov, M. V. et al. 2005). On the basis of the analysis of hydrological and meteorological time-series are found out periodicity and trends. Long-term changes of the hydrometeorological characteristics were investigated on the base of data of meteorological station located within water-balance station Kamennaya Steppe. The data were observed from the end of XIX century and have duration of more than 120 years. We carried out the statistical analysis of time series of the climatic parameters. The time periods with increased (in comparison with long-term average levels) and decreased values of the climatic characteristics were determined using the differential integral curves. Inflection points of differential integral curves of air temperatures and atmospheric precipitation showed good agreement (about 1950). Average values of air temperature for year and for a warm period decreased from the first years of observation to 1950, but their values for a cold period increased. Since 1950-ies, the inverse tendency has been observed: annual and warm-season air temperature increased and cold-season air temperature decreased. The values of annual and warm-season precipitation increased until the middle of the XX century (their increase during warm period was more significant), whereas precipitation during cold season decreases. After 1950, annual and warm-season precipitation decreased and cold-season precipitation increased. However, since the 1980-ies, all sums of precipitation (for the year and its warm and cold seasons) have increased. The long-term and seasonal fluctuations of the Upper Don River runoff are investigated. The analysis of annual runoff has shown, that obvious negative changes on the region rivers it is not detected. However the up-to-date low-flow periods became much more abounding in water. It is connected, first of all, with increase of year temperature during the cold period and, accordingly, the become frequent winter thaw promoting increase of a river runoff. In this connection the main attention was given to detection of the various periods for the low-flow runoff of the Upper Don River. The time periods with the increased and decreased values of the river runoff are determined. The analysis of the differential integral curves has allowed to allocate two homogeneous periods. Quantitative estimations of changes of a river runoff for the periods from the beginning of observation till 1979 and since 1980 on present time have shown, that values of the average annual runoff have not changed. However low-water flow has increased more than in 1.6 times during the modern period. I.e.

Hydrology in a Changing World: Environmental and Human Dimensions Poster Proceedings of FRIEND-Water 2014, Montpellier, France, 7-10 October 2014
115
the new hydrological regime was formed. In this connection calculation statistical characteristics of the river runoff should be received for the modern period taking into account climatic changes. However, the river runoff monitoring is insufficient for scientific research. The hydrological look-out stations are located non-uniformly. Besides, majority of the hydrological time series are characterized by the short period of observation and significant errors of measurements and omissions. All this complicates the application of calculating and forecasting methods according to the observation on separate hydrological look-out stations. The extension of the information due to the joint analysis by groups of hydrological homogeneous objects enables to avoid many random errors. In this connection, in the present work it is offered hydrological regionalization for the improvement of forecasting and management of a river runoff. The approach to hydrological regionalization suggested in this work is based on the analysis of annual distribution of the river runoff by means of extracting features of its seasonal variability and grouping time series of the average monthly water flow with the help of cluster procedures (Kendall, M. J. & Stuart, A. 1976). As characteristics of seasonal variability of the river runoff we used the set of features received during the transformation of initial long time series of the average monthly water flow. Such parameters, in particularly, are seasonal indexes, characteristics of spectral density functions, and also the parameters of the low-flow periods - their durations, skewness and variability coefficients. For this aim, more than 20 objects on the Upper Don River Basin (hydrological look-out stations which satisfy some criteria of the fullness and the duration of supervising) have been selected and processed from the hydrological archive. The times series have been limited by the period, since 1980 on present time (in according with revealed up-to-date river runoff changes in the low-flow period). The extracted sets of parameters served as the basis for the hydrological regionalization. The regionalization is performed on the basis of the cluster analysis with the help of the program system TeleStat which is intended for the statistical analysis of multivariate data and time processes (Enjukov, I.S. et al. 2004). As cluster procedures we used a new method based on regression approach to clustering which uses radial basis functions (RBF). The employment of such a RBF regression-based procedure gives a possibility to find group centers and to evaluate the number of groups. The result of clustering depends vitally on the specified distance between objects. In the work the weighted Euclidian distance was used. Variable weights were adjusted in such a way that ensured both the geographic proximity of objects (hydrologic points) and their criteria proximity. The multiple calculations carried out with the use of the above described cluster procedures have allowed to allocate on the territory of the Upper Don River Basin statistically homogeneous areas according to the character of seasonal variability of a river runoff.
The integrated characteristics of seasonal fluctuations of the river runoff have been calculated
for each region. (In particular, autocorrelation functions, spectral functions of distribution, and also the parameters of the low-flow period – their duration, skewness and variability coefficients. These characteristics can serve for the conservancy in the Upper Don River basin at water deficiency in changed climatic conditions. REFERENCES Bolgov, M. V., Mishon V.M. & Sentsova N.I. (2005) Up-to-date problems of evaluation of water resources and water supply. M.: Nauka, 318 p. Enjukov, I.S., Retinskaja, I.V. & Skuratov, A.K. (2004) Statistical analysis and monitoring of the scientific-educational Internet- networks. M.: Finance and statistics, 320 p. Kendall, M. J. & Stuart, A. (1976) Multivariate statistical analysis and time series. M.: Nauka, 1976. 736 p.

Hydrology in a Changing World: Environmental and Human Dimensions Poster Proceedings of FRIEND-Water 2014, Montpellier, France, 7-10 October 2014
116
Hydrological monitoring and the formation of hydrological data bases in the Republic of Belarus
NATALI SHEVTSOVA, VICTAR MELNIK, YURY LIASNICHY
Republican hydrometeorological centre, 110. Nezavisimosti ave., 220114 Minsk Republic of Belarus [email protected]
Abstract Basic information on water resources and the hydrological and hydrochemical monitoring in the Republic of Belarus are presented in this work. The list of published main hydrological materials for consumers is provided. Based on researches the features of an annual runoff of the majority of the large rivers of the Republic of Belarus in connection with climate change are noted.
Key words water; rivers; lakes; hydrological posts; observations; monitoring; Republic of Belarus
INTRODUCTION
The Republic of Belarus is situated in the west of the East European Plain. The climate of the territory is moderately continental and determined by its location in the middle latitudes, its proximity to the Atlantic Ocean and the absence of natural boundaries (mountains) obstructing traffic of air masses (see Figure 1).
Fig. 1 Economic and geographical location of the Republic of Belarus.
Rivers of the Republic of Belarus belong to the basins of two seas - the Baltic Sea (West Bug, Neman, Vilia, and West Dvina - 43% of the territory) and the Black Sea (Dnieper, Pripyat, Sozh and Berezina - 57% of the territory).
The observations of the hydrological regime in Belarus have been begun at the end of the XIX century (1876 - 1881). For the period from the beginning of observation and to date there were 761 hydrological posts, including 710 on the rivers and 51 on the lakes and reservoirs.
THE MAIN RESULTS
137 hydrological posts are currently operating in Belarus (123 - on the rivers and 14 - on the lakes and reservoirs), 36 posts are on the small rivers with a catchment area of about 500 km2 and less. Monitoring is made: over the water levels and temperature, ice depth, ice phenomena, water flow (106 posts). Additional meteorological observations are made on 76 hydrological posts: precipitation, snow cover, meteorological phenomena. 67 posts are attracted for daily submission of information which is used for hydrological forecasting.

Hydrology in a Changing World: Environmental and Human Dimensions Poster Proceedings of FRIEND-Water 2014, Montpellier, France, 7-10 October 2014
117
The program of hydrometeorological service development till 2015 which provides automation of the most part of hydrological observations is operated at the present time in Belarus. Specialized hydrological network of the country includes the observation network of the 1 lake and 1 swamp station, a network of observing evaporation of 9 observation points and 1 evaporative basin. 4 observation points over evaporation from a soil surface are operated. Hydrochemical monitoring is carried out now in 301 observation points on the 160 water objects (86 rivers, 51 lakes, 23 storage reservoirs) and hydrobiological monitoring is carried out in 258 points on the 151 water objects (81 rivers, 50 lakes, 20 storage reservoirs) of the river basins of West Dvina, Neman, West Bug, Dnepr and Pripyat.
In total on the territory of the Republic of Belarus are about 20.8 thousand small, medium and large rivers with a total length 90.6 thousand km. and 10.8 thousand of lakes. The longest on the territory of Belarus is Dnieper River (696 km within Belarus) and Berezina (613 km). The largest lake are Naroch (79.6 km2) and Osveiskoye (52.8 km ²). In average water content year is 5.8 m3 of water per resident of Belarus. River runoff, which is a basis of surface water resources, is 57.6 km3 in an average water content year. In high-water years an overall river runoff is increasing till 92.4 km3 (1985), and in law-water year is reducing till 29.8 km3 (1921) per year. Great part of a river runoff (60%) is formed within the Republic of Belarus; transboundary water flow from the territories of neighboring countries (Russia, Ukraine) is 40% (Chekan (2009)).
Within the last decades, due to climate change (warming), the annual runoff of the majority large rivers of Belarus increased by 5-20%, except for Neman and West Bug where river runoff reduction from 10 to 25% is observed. A river runoff increased in winter. In connection with the reduction of water reserves in snow a decrease in spring runoff was noted (Melnik et al, 2013).
In the Republic of Belarus there is a qualitative and full database of the main hydrological characteristics on the rivers, channels, lakes. At present it contains information since the beginning of observations on all operating and closed hydrological posts: water levels and flow of water, sediment runoff, water temperature, ice phenomena, ice depth, etc.
In the field of an exchange of hydrometeorological information, use and protection of waters purposeful work on development and strengthening of international cooperation with CIS countries and other states (Russia, Ukraine, Poland, Lithuania, and Latvia) is organized. Hydrological information is transferred to the WMO World Data Centres: State Establishment «All Russian Research Institute of Hydrometeorological Information», Obninsk, Russian Federation; Global Runoff Data Centre the Federal institute of a hydrology, Koblenz, Germany; International Centre on the Hydrology of Lakes and Reservoirs, State Hydrological Institute, St. Petersburg, Russian Federation.
67 hydrological posts are involved in submission of daily data for operational providing republican state bodies, local executive and administrative bodies, the ministries, departments and the population with hydrometeorological information, hydrological forecasts of a water and ice regime of the rivers and reservoirs. In addition, the mutual exchange of information on cross-border waterways of Dnieper, Pripyat, Neman, West Bug, and West Dvina with neighboring states (Russia, Ukraine, Poland, Lithuania, and Latvia) is carried out.
Regularly materials on water resources of the Republic of Belarus are issued: "Annual data on a mode and resources of a surface water" (annually); "Long-term data on a mode and resources of a surface water" (1 time in 5-10 years); "Changes of a hydrographic network of Belarus as a result of reclamation works" (1 time in 5-10 years); materials for the interdepartmental edition of the State water cadastre (annually); and materials for the ecological bulletin (annually). The main consumers of the hydrological information are the Ministry of Agriculture and Food, the Ministry of Energy, the Ministry of forestry, the Ministry of transport, Department on melioration and a water management, etc. The hydrological information received from a hydrological network of posts and let-out materials on water resources are sufficient for providing consumers with necessary information.
REFERENCES V.Melnik and E. Komarovskaya (2013). Features of Climate Change on the Territory of the Republic of Belarus. Materials of 7-th Conference on BALTEX, Borgholm, Island of Öland, Sweden, pp. 80-81 A.Palishchuk and R.Chekan (2009). Hydrological monitoring of the Republic of Belarus, Minsk pp.159-16

Hydrology in a Changing World: Environmental and Human Dimensions Poster Proceedings of FRIEND-Water 2014, Montpellier, France, 7-10 October 2014
118
Flood Frequency Analysis supported by the largest historical flood
WITOLD G. STRUPCZEWSKI1, KRZYSZTOF KOCHANEK1 & EWA BOGDANOWICZ2 1 Institute of Geophysics Polish Academy of Sciences, Ksiecia Janusza 64; 01-452 Warsaw, Poland, [email protected], [email protected] 2 Institute of Meteorology and Water Management, Podlesna 61, 01-673 Warsaw, Poland, INTRODUCTION
The scientists and practitioners put significant efforts to improve the accuracy of estimates of the hydrologic design value by specifying the various sources of uncertainty and incorporating them in the analysis produce the opposite effect from that intended. To improve the accuracy of estimates of upper quantiles all possible sources of additional information are used including the augmentation of the systematic records by historical and paleoflood data.
Frequency analysis of flood data (FFA) arising from systematic, historical, and paleo-flood records has been analysed by several authors (a review Stedinger and Baker 1987, Frances et al. 1994). The use of nonsystematic flood data for statistical purposes depends on reliability of assessment both flood magnitudes and their return period. If the historical record is available, usually it provides information about the floods larger than prevailing majority of floods reported in the systematic record and in particular about the largest of all reported floods.
Most often the first hydrological historical notice concerns a large flood and therefore it is not known what had happened before (Girguś & Strupczewski, 1965). Then the date of the first recorded historical flood is taken as the historical memory length L, i.e. L is the duration of nonsystematic period commencing on the large flood. Even if one properly assess the magnitudes of historic floods, a problem of their return periods remains unsolved. In the literature (Benson, 1950, Dalrymple, 1960, IACWD 1962, Zhang, 1982 and NERC, 1975, p.177) the effective length of historical record M is always the period from the first extraordinary flood to the beginning of the systematic record, i.e. L. The matter is that the only largest flood (XM) is known during whole historical period and its occurrence marks the beginning of the historical period and defines its length (L) (Fig. 1). Consequently one can expect the upward bias of the upper quantile estimates if the historical period of length L is taken in analysis as the nonsystematic observation period, or in other words coming from an underestimation of the return
period M L of XM value. Problem arises to estimate the time period (M) representative of the largest
observed flood XM, to evaluate the efficiency of using the largest historical flood (XM) for large quantile estimation and to compare it with the case when systematic records alone (N) are used only.
The object of the paper is to assess by maximum likelihood method whether there is any use for Flood Frequency Analysis of the largest flood terminating the time series assuming its magnitude is known. Therefore, the value of using the largest flood terminating observation period relative to using records without it is examined by comparing the bias (B) and the root mean square error (RMSE) of flood quantiles of two two-parameter distributions, namely Gumbel and Weibull while applying the simulation experiments. The emphasis is put on the effect of misspecification of the return period (M) of the largest historical (paleo-) flood (XM) and on the proper assessment of the M estimate on the basis of XM occurrence (L). So far the above case has not been presented in the hydrological literature.
To assess the statistical gain from historical information the asymptotic variances of the quantile estimates got from the systematic records alone and the combined time–series were compared by means of computer simulation experiments. The results of the study performed for defined length (M) of historical period indicate that value of historical data for estimating flood quantiles can be small or large depending on three factors only: the relative magnitudes of the length of the systematic record (N), the length of the historical period (M); the return period (T) of the flood quantile of interest; and the probability threshold defining the historical floods.

Hydrology in a Changing World: Environmental and Human Dimensions Poster Proceedings of FRIEND-Water 2014, Montpellier, France, 7-10 October 2014
119
Fig.1 The case of N systematic and one largest flood in the beginning of historical period.
RESULTS AND CONCLUSIONS
Errors in historical data of course diminish the utility of the data for improvement the estimate of the flood magnitude at the given return period. In the simulations the magnitude of largest historical flood (XM) was assumed to be measured without error and so was assumed for systematic record, but it is realistic to suppose that the XM flood was measured much less accurate than the gauged record. Error in estimating the largest historical magnitude (XM) is much more important than error in estimating the date of its occurrence. It is significant that the practice of improvement the accuracy of estimates through more realistic assumptions and a wider use of the information leads to the opposite effect – an increased uncertainty of flood estimates is observed. Acknowledgements This research project was partly financed by the grant of the Polish National Science Centre titled ‘Modern statistical models for analysis of flood frequency and features of flood waves’, contract nr UMO-2012/05/B/ST10/00482. REFERENCES
Benson, M.A. (1950) Use of historical data in flood-frequency analysis, EOS Trans. AGU, 31(3), 419-424. Dalrymple, T. (1960) Flood frequency analysis, U.S. Geol. Surv. Water Supply Pap., 1543-A. Frances F., Salas, J.D., Boes, D.C. (1994) Flood frequency analysis with systematic and historical or paleoflood data based on the two-
parameter general extreme value models. Wat. Resour. Res. 30 (6), pp. 1653-1664. Girguś, R. and Strupczewski, W. (1965) Excerpts from the historical sources dealing with extraordinary hydro-meteorological
phenomena on the Polish territories from X - XVI c. Instr. i Podr. 87(165). Wyd. Kom. i Laczn., Warsaw, pp.216 (in Polish). Interagency Advisory Committee on Water Data (IACWD) and U.S. Water Research Council Hydrology Committee,. Guidelines for
determining flood flow frequency, Bull 17B (1982), (revised) Hydrol Subcomm, Office of Water Data Coord., U.S. Geol. Surv., Reston, Va.U.S. Gov. Print. Off. Washington D.C.
Natural Environment Research Council (NERC), (1975) Flood Studies Report, vol.1, London. Stedinger, J.R. and Baker, V.R. (1987) Surface Water Hydrology: Historical and Paleoflood Information. Review of Geophysics, V.25,
2, pp. 119-124. U.S. National Report to IUGG 1983-1986. Zhang, Y. (1985) On the role and treatment of outliers in probability estimation method of flood frequency analysis. Paper presented
at U.S. – China Bilateral Symposium on the Analysis of Extraordinary Flood Event, Oct. 21-25, Nanjing, China.

Hydrology in a Changing World: Environmental and Human Dimensions Poster Proceedings of FRIEND-Water 2014, Montpellier, France, 7-10 October 2014
120
Model development for analysis of nitrate leaching and its field application in a rural area
HEEJUN SUK & KIM YONGCHEOL Groundwater Department, Korea Institute of Geoscience and Mineral Resources, Republic of Korea. [email protected]
Abstract Unsaturated/saturated groundwater flow and solute transport model, VSFRT2D (Variable Saturated Flow and Reactive Transport model) was developed considering effects of pumping, irrigation, and denitrification. VSFRT2D employed Richards’s equation as governing equation. The developed model was applied to field data in Hongsung area contaminated with nitrate. In order to identify the effect of precipitation, pumping, evapotranspiration, irrigation, fertilizer application, and various bioremediations on groundwater flow and contaminant transport, individual processes were separated and simulated. The simulation results show that bioremediation had a negligible effect on nitrate concentration change. However, pumping for irrigation, precipitation, and nitrogen fertilizer application showed profound influences on nitrate concentration change. Key words nitrate, unsaturated/saturated groundwater flow, contaminant transport, VSFRT2D INTRODUCTION In Korea, the underground water pollution, primarily due to oil, heavy metals, nitrate nitrogen, etc. are reported. There are many complex pathways for pollution of groundwater, but nitrate-nitrogen contamination is the most significant reason for groundwater contamination in Korea. Nitrate can originate from various anthropogenic sources, such as fertilizers, animal manure, domestic waste water and septic tanks, as well as organic nitrogen from soil.
STUDY AREA The study area is mainly used for cabbage and water melon cultivation and also for paddy fields. To identify the nitrate contamination and groundwater characteristics from this area, observation wells are installed (HBH-1, HBH-2, W1 AND W-2). The monitoring wells are located in Hong-Sung. The location of wells and water lever data are given in Fig.1.
DEVELOPMENT OF VSFRT (Variably Saturated Flow and Reactive Transport model)
The model developed for the unsaturated and saturated groundwater flow model used Richard’s equation (Yeh et al., 1997)
qzhKKt
h
dh
dSn
n wwrse
ew
*
'' .
(1)
RESULTS & DISCUSSION W-1 well is utilized to pump the water for cabbage cultivation. The water level fluctuations in the wells around W-1 are significantly affected by pumping from W-1. A maximum draw down of 250cm is observed (Fig.2b). The results of observation of groundwater pumping for two weeks shown that area is affected greatly by rainfall, as well as positive changes in groundwater levels were simulated. The groundwater level fluctuation in the well HBH-1 is affected greatly due to the pumping for W-1. Also the precipitation data is compared with the pressure head variation (Fig.2a & b). Also observation from
Fig. 1 Location to water of monitoring wells.

Hydrology in a Changing World: Environmental and Human Dimensions Poster Proceedings of FRIEND-Water 2014, Montpellier, France, 7-10 October 2014
121
the figures reveals that the groundwater level is largely affected or depended on the rainfall of the particular area. In Fig.3, it is clear that nitrate concentration distribution over time is independent of biodegradable nitrate concentration. In this area, however, oxygen is present in all areas of denitrification almost did not happen. Thus the present study reveals that the study area nitrate concentration is highly depended on pumping for irrigation, precipitation, and nitrogen fertilizer application.
CONCLUSION The developed model was applied to field data in Hongsung area contaminated with nitrate. In order to identify the effect of precipitation, pumping, evapotranspiration, irrigation, fertilizer application, and various bioremediations on groundwater flow and contaminant transport, individual processes were separated and simulated. Then all results obtained from the individual processes are compared with each other. The simulation results show that bioremediation had a negligible effect on nitrate concentration change. Acknowledgements This work was supported by the research project of “Advanced Technology for Groundwater Development and Application in Riversides (Geowater+)” in “Water Resources Management Program (code 11 Technology Innovation C05)” of the MLTM and the KICTEP in Korea. REFERENCES Yeh, G-T, Cheng, J-R & Short, T.E. (1997) 2DFATMIC: User’s manual of a two-dimensional subsurface flow, fate and transport of microbes and chemical model version 1.0, EPA/600/R-97/052, US EPA.
Fig. 2 (a) Simulation results of temporal pressure head change with depth and (b) measurement of groundwater level fluctuation at HBH-1 by pumping at W-1
Fig. 3 Subsurface distribution of nitrate

Hydrology in a Changing World: Environmental and Human Dimensions Poster Proceedings of FRIEND-Water 2014, Montpellier, France, 7-10 October 2014
122
Flood Hazard Assessment in Kota Tinggi, Malaysia T. H. TAM1, Ab. L. IBRAHIM2, M. Z. A. RAHMAN3, M. ZULKLIFI4 1,2 Institute of Geospatial Science and Technology (INSTeG), Universiti Teknologi Malaysia, MALAYSIA [email protected] 3 TropicalMap, Faculty of Geoinformation and Real Estate, Universiti Teknologi Malaysia, MALAYSIA 4 Dr. Nik & Associates Sdn Bhd, MALAYSIA INTRODUCTION A comprehensive flood risk management can be divided into two aspects: flood risk assessment and flood risk reduction (Schanze, 2006). Risk assessment aiming at providing the risk information related to elements at risks at a particular area and estimated flood damage in term of economic losses. While, risk reduction focuses in reducing flood risk to the element at risks using different types of means. Risk assessment is the first primary part to any flood risk management, as it outlines the decision-making process (Plate, 2002). A risk assessment project usually involved three main steps: (i) hydrological, (ii) hydraulic, and (iii) socioeconomic studies (Cunha et al., 2011) and it is prerequisite for the production of a flood risk map. Flood risk map provides the valuable information regarding to consequences of a flood event (de Moel et al., 2009) has become an important map to cope with flooding. Hazard and vulnerability are two elements that are required for the generating of flood risk map (Merz et al., 2007). Therefore, the main objective of this study is to estimate different magnitudes of flood hazard (2, 25, 50, 100 and 200-yr) in Kota Tinggi. STUDY AREA This study is carried out in Kota Tinggi located in the state of Johor, Peninsular Malaysia (Figure 1). This study area experienced an unprecedented flood event in 2006/2007 in which this scenario is considered as the most disastrous flood event (estimated damage is about USD 600 million) recorded in the Malaysian history.
Fig. 8 Location of study area (Green box shown the location of Kota Tinggi city).
DATA USED & METHODOLOGY This study is primarily based on an optical Landsat TM 5 image, hydrological data (water level and discharge), LiDAR Digital Elevation Model (DEM), river networks and cross sections. The Landsat image was downloaded at U.S.Geological Survey (USGS) website. The rest of the data were provided by Department of Irrigation and Drainage (DID). Hydrodynamic model 1D2D Sobek was used in this study for flood simulation of different magnitudes of flood events. The hazard parameters of this study are mainly produced from hydrodynamic model that is maximum flood depth and maximum flow velocity. The flood impulse is product of flood depth and flow velocity. The adopted five hazard classes have modified the inundation depth classes were proposed by the Japanese International Cooperation Agency (JICA) in which DID apply this standard in Sungai Muda, Kedah (AHAMAD et al., 2011).
Peninsular Malaysia Johor State Kota Tinggi District

Hydrology in a Changing World: Environmental and Human Dimensions Poster Proceedings of FRIEND-Water 2014, Montpellier, France, 7-10 October 2014
123
RESULTS AND DISCUSSION For the flood model calibration, due to lack of available data, the simulated result was compared to a flood map that produced by DID. The maximum flood depth, maximum flow velocity and maximum flood impulse are shown in Figure 2.
(a)
(b)
(c)
Fig. 3 (a) 200-yr flood hazard map, (b) 100-yr flood hazard map, (c) 50-yr flood hazard map (d) 2-yr flood hazard map CONCLUSION The objective of this study was achieved in which the three main hazard parameters produced from hydrodynamic model has been produced for Kota Tinggi. Production of flood hazard map is a primary step in risk assessment as this map was used an input for producing vulnerability and risk map. The results of this study has to be enhanced in order to produce a better result and able to achieve micro-scale of flood risk management. Acknowledgements We would like to acknowledge Universiti Teknologi Malaysia for providing financial assistant to carry out this research project. REFERENCES Ahamad, M. S. S., Ali, R., Zakaria, N. A., Ghani, A. A. & Chang, C. K. Flood loss asssessment of the 2003 Muda River flood. 3rd
International Conference on Managing Rivers in the 21st Century: Sustainable Solutions for Global Crisis of Flooding, Pollution and Water Scarcity, 6th-9th, December 2011.
Cunha, L. K., Krajewski, W. F., Mantilla, R. & Cunha, L. (2011). A framework for flood risk assessment under nonstationary conditions or in the absence of historical data. Journal of Flood Risk Management, no-no.
De Moel, H., Van Alphen, J. & Aerts, J. C. J. H. (2009). Flood maps in Europe - methods, availability and use. Natural Hazards and Earth System Sciences, 9(2), 289-301.
Merz, B., Thieken, A. H. & Gocht, M. 2007. Flood Risk Mapping At The Local Scale: Concepts and Challenges. In: BEGUM, S., STIVE, M. F. & HALL, J. (eds.) Flood Risk Management in Europe. Springer Netherlands.
Plate, E. J. (2002). Flood risk and flood management. Journal of Hydrology, 267(1–2), 2-11. Schanze, J. 2006. FLOOD RISK MANAGEMENT – A BASIC FRAMEWORK. In: SCHANZE, J., ZEMAN, E. & MARSALEK, J.
(eds.) Flood Risk Management: Hazards, Vulnerability and Mitigation Measures. Springer Netherlands.
Legend
0 - 0.01
0.01 - 0.5
0.5 - 1.0
1.0 - 2.0
2.0 - 3.0
3.0 - 5.0
Legend
00 - 0.5
0.5 - 1.0
1.0 - 1.5
1.5 - 2.0
2.0 - 5.0
5.0 - 13.0
Legend
0 - 0.5
0.5 - 1.0
1.0 - 1.5
1.5 - 2.0
2.0 - 3.0

Hydrology in a Changing World: Environmental and Human Dimensions Poster Proceedings of FRIEND-Water 2014, Montpellier, France, 7-10 October 2014
124
Nonuniform sediment transport and flow characteristics downstream of a hydraulic structure
DONATELLA TERMINI Dipartimento di Ingegneria Civile, Ambientale, Aerospaziale, dei Materiali (DICAM) - Università di Palermo, Italy. Tel: ++39/091/23896522; mobile: 3287274471; Fax: ++39/091 6657749 [email protected] INTRODUCTION
Transient transport phenomena can be determined in a given river reach by “constrained” sediment boundary conditions which can arise either from the presence of a man-made structural intervention or from the variation of inflow sediment rate upstream of an alluvial channel reach. Many predictive mobile-bed one-dimensional models have been developed but, even today, they have not attained an high degree of efficacy because they are confronted with some difficulties (reliable prediction of bed roughness or/and to the presence of flexible vegetation, of hydraulic sorting, of water-bed sediment interchanges in non equilibrium situations). Recently a new approach to simulate the erosion processes, the bed levels changes and the entity of sediment transported, taking into account the non-uniformity in sediment size and the interchange between the bed and the stream, has been developed by Termini (2011a; 2012). The model allows the simulation of the bed longitudinal profile variations and the quantitatively estimation of the material transported by the flow during transients. The aim of the present work is to give a contribution for a better understanding on the morphodynamic processes determined by “constrained” upstream sediment conditions. Experimental program was conducted to analyze scour - caused by a horizontal jet downstream of a rigid bed - and the flow velocity and turbulence characteristics within the scour hole. An equation which relates the bed shear stress and the sand volume eroded has been determined (Termini and Sammartano, 2012). In this work this equation has been included in the model in order to test its applicability in numerical simulation.
GOVERNING EQUATIONS AND STUDY CASE
The model solves the following governing equations for sediment:
t
)δ(zFλ1φ
x
q abkks,
ksb,
(1)
ks,
kx
kk φx
ChK
xx
qC
t
hC
(2)
x
qαqq
x
q *ksb,
kksb,*
ksb,kksb,
with : kkks, DEφ ;
N
1kkF =1 (3)
with h=water depth, q= flow rate per unit width, zb = bed level, a =thickness surface active layer, = sediment porosity, qsb,k and *
ksb,q = the actual and the equilibrium specific volumetric bed-load sediment transport rate for size class k, respectively, Fk = fractional representation of size class dk, Ck = vertically averaged concentration of suspended sediment of size class k, Kx = longitudinal dispersion coefficient for suspended sediment, Dk and Ek = sediment deposition and resuspension rates respectively. More details and closure equations can be found in Termini (2011a, b; 2012). Experiments were carried out in a rectangular straight flume 11.2 m long and 0.4 m wide. In the first reach of the channel (2.65 m long) the bed was rigid and in the remaining part (8.55 m long) the bed was mobile. The bed was of quartz sand (median sediment diameter D50 = 0.86 mm), with longitudinal slope equal to 0.4%. During the experiment with water discharge Q = 35 l/s, the evolution of the scour

Hydrology in a Changing World: Environmental and Human Dimensions Poster Proceedings of FRIEND-Water 2014, Montpellier, France, 7-10 October 2014
125
downstream of the rigid-bed was examined and the flow velocity components were measured through a two-dimensional laser anemometer – LDA2D by Dantec s.r.l - and the ultrasonic anemometer DOP2000 - by Signal Processing s.a. - (see in Termini, 2011b; Termini and Sammartano, 2012) .
RESULTS AND DISCUSSION
By using the measured time series of flow velocity components, the turbulent intensity components have been determined. Through the linear regression of the Reynolds stress at the bed, the values of the “experimental” bed shear stress, bτ , have been obtained and the following expression has been
determined:
02851τ .eYdsincWlnbaYˆ (4)
where avb τττ /ˆ ( avτ = the average bed shear stress in each section) and totWWW /ˆ (W = volume
of sand eroded at generic section and Wtot = total volume of sand eroded along the channel reach interested by scouring; Y indicates the transversal axis). For the considered case the coefficients assume the following values: a = 0.02, b = -0.35, c = 1.148, d = 0.1995, e = 0.4442. Then the process has been simulated by applying the model (assuming zero sediment inflow at upstream boundary). In Figure 1 the experimental values of τ are plotted against the computed ones. As Figure 1 shows, the points concentrate around the bisector line (although model tends to underestimate the bed shear stress). In any case, Figure 1 confirms that Equation 4 can be used to simulate the variation of the bed shear stress during transients. But it should be noted that Equation (4) is restricted to the experimental conditions investigated in this work. Thus, further analyses should be conducted in order to generalize the expression.
Fig. 1 Comparison between experimental and computed τ
REFERENCES
Termini, D., 2011a. 1- D numerical simulation of sediment transport in alluvial channel beds: study cases. European Journal of Environmental and Civil Engineering– EJECE 15(2), DOI:10.1080/19648189.2011.9693322; pp. 269-292.
Termini, D., 2011b. Bed scouring downstream of hydraulic structures under steady flow conditions: Experimental analysis of space and time scales and implications for mathematical modeling. CATENA 84 - Elsevier B.V. doi:10.1016/j.catena.2010.10.008, pp. 125–135
Termini D., 2012. Numerical simulation of non-equilibrium sediment transport in a flume - Erosion and Sediments Yields in the Changing Environment (IAHS Publ. 356) –ISSN 0144-7815.
Termini D. and Sammartano V., 2012. MORPHODYNAMIC PROCESSES DOWNSTREAM OF MAN-MADE STRUCTURAL INTERVENTIONS: experimental investigation of the role of turbulent flow structures in the prediction of scour downstream of a rigid bed. Physics and Chemistry of the Earth (2012) - Elsevier B.V. doi.org/10.1016/j.pce.2011.12. vol. 49 (2012). pp. 18–31.
0
1
2
3
4
5
6
0 1 2 3 4 5 6
Computed
Experimental

Hydrology in a Changing World: Environmental and Human Dimensions Poster Proceedings of FRIEND-Water 2014, Montpellier, France, 7-10 October 2014
126
Regulation effects of reservoir system on flow regime in Red River downstream
THI THUY NGO1, THU PHUONG TRINH2, HUU DUNG LUONG3, JOONG HOON KIM1 1 Department of Civil, Environmental and Architectural Engineering, Korea University, Anam-Dong, Seongbuk-Gu, Seoul 136-713, Korea; [email protected]; [email protected] 2 Vietnam National Center for Hydro-Meteorological Forecasting, No.3 Dang Thai Than Str., Hanoi, Vietnam 3 Viet Nam Institute of Meteorology, Hydrology and Environment, No.23/62 Nguyen Chi Thanh Str., Hanoi, Vietnam LARGE RESERVOIR SYSTEM IN RED RIVER BASIN
Red River is one of the largest river basins in Vietnam having total area of around 87,400 km2. Covering Hanoi capital and big cities in the northern region of Vietnam, the Red River Delta is the most important economic zones with the second largest rice field, point industrial zones, and National Relics and Landscapes. In Red River Basin, there are more 1900 reservoirs having the volume of more than 200,000m3 (Decision number 198/QD-TTg, 2011). Also, there are four large multi-purpose reservoirs with minimum storage volume of 1 billion m3 namely Son La, Hoa Binh, Tuyen Quang, and Thac Ba. These reservoirs have four main tasks: flood control, power generation, water transport, and water supply for downstream.
EFFECTS OF RESERVOIR REGULATION ON FLOW REGIME OF RED RIVER
Based on analysis of data observed at main hydrological stations on Red river, variations in flow regime are considered in following periods: (1) before Thac Ba reservoir was built (1972); (2) before Hoa Binh reservoir was built (1989); (3) from 1973 to 2007, before Tuyen Quang reservoir was built; (4) from 2008 up to now, the four large reservoirs has operated. Son La hydropower plant was constructed in middle of 2010 year. Therefore, data availability is not enough to analyse and assess separately from other reservoirs.
Annual flow Total flow decreases in flood season and increases remarkably in dry season, in particular irrigation time for winter-spring crop (from January to February). At Genh Ga station (downstream Lo River), after Tuyen Quang reservoir operating, dry season flow increases 6%, while after building Thac Ba reservoir and Tuyen Quang reservoir, dry season flow observed at Vu Quang station increases 3.3%. At Son Tay station in downstream of Red river, total flow in dry season has risen by 2.1%, 4.2%, and 8.8% when Thac Ba, Hoa Binh, and Tuyen Quang reservoirs are operated, respectively (See Fig.2).
The extreme water level Analysis of flood peak observed and reverted at Ha Noi station in the period 1993-2012 shows that before 2007 year, Hoa Binh and Thac Ba reservoirs could reduce flood peak level at Hanoi by 0.15-0.97 m and up to 2010, Hoa Binh, Thac Ba, Tuyen Quang and Son La reservoirs could cut down flood peak level at Hanoi station by 1.32 - 2.56 m. (See Fig. 3) In the particular drought years, conflicts among the main water users including flood control, water supply, and hydropower generation were considered as major problems in operation of reservoirs. Since 2000, in dry season, water level in Hanoi station has been reducing. In particular, on 21st Feb 2010, the minimum water level was 0.1 m which is the lowest historical water level recorded over more than 100 years.
Fig. 1 The major reservoirs system on Red river

Hydrology in a Changing World: Environmental and Human Dimensions Poster Proceedings of FRIEND-Water 2014, Montpellier, France, 7-10 October 2014
127
Fig. 2 Variations in seasonal flow (a) and monthly flow (b) at hydrological stations on Red River
Fig. 3 Maximum (a) and minimum (b) water level at Ha Noi station in the period 2002-2011
Rating curve The rating curve has changed dramatically, especially in recent years under regulation of four reservoirs Son La, Hoa Binh, Thac Ba, and Tuyen Quang.
Fig. 4 Variations in rating curve at Son Tay (a) and Hanoi (b) station in recent years
CONCLUSIONS Since the operation of reservoir system on Red River, dry season flow at hydrological stations increases significantly, especially in the period of irrigation (Jan - Mar). In the rest months of dry season, downstream flow depends on real power generation (hydropeaking regulation) resulting wild fluctuation in water level and being dried out on downstream rivers. In flood season, the reservoir system can prevent flood for Hanoi capital. Flood peak water level at Hanoi station can be cut down by 1.32 - 2.56 m. The average and the highest water level decrease dramatically, about 2.2 m to 3.4 m comparing to reverted data.
Acknowledgement This research was supported by a grant (13AWMP-B066744-01) from Advanced Water Management Research Program (AWMP) funded by Ministry of Land, Infrastructure and Transport of Korean government.
REFERENCES Bac Huynh Le, Lan Chau Nguyen, Viet Thi Nguyen. (2007) Measures to ensure water in the dry season at Red River Basin by assessing
the effective of water release for irrigation in Winter-Spring crop in recent years. Journal of Hydro-meteorology-6 / 2007. Decision number 198/QD-TTg –February 10th year 2011 about “Son La, Hoa Binh, Thac Ba and Tuyen Quang Reservoirs regulation
in flood season”. Thu Phuong Trinh. (2013). Research methods of estimated surface water resources for water resources outlook annual, case-study on
Red River basin. Ministry level project. Ministry of Natural Resources and Environment.
a) b)
a)b)
a) b)

Hydrology in a Changing World: Environmental and Human Dimensions Poster Proceedings of FRIEND-Water 2014, Montpellier, France, 7-10 October 2014
128
Groundwater pollution and the safe water supply challenge in Cotonou coastal town, Benin (West Africa)
HENRI S. V. TOTIN1,2, LEOCADIE ODOULAMI1, PATRICK A. EDORH3 & MOUSSA BOUKARI4 1 Department of Geography, University of Parakou, BP 123, Parakou, Benin 2 Laboratory Pierre PAGNEY, Climate, Water, Ecosystems and Development, 03 BP 1122 Jericho, Cotonou, University of Abomey-Calavi, Benin [email protected]; [email protected] 3 Interfaculty Centre of Training and Research in Environment for Sustainable Development; Department of Microbiology, University of Abomey-Calavi, 03 BP 1463, Cotonou, Benin 4 Laboratory of Applied Hydrology, University of Abomey-Calavi, BP 526 Cotonou, Benin INTRODUCTION
In Cotonou, shallow groundwater is the most detrimentally impacted by uncontrolled land occupation due to the higher population density (10 431 people/km²). This population growth has seriously compromised access to safe water (Odoulami, 2009) on account of groundwater physicochemical and bacteriological pollution (Boukari, 1998; Adelana et al., 2008; Totin et al., 2012).
This town is located in the coastal sandy plain of Benin, between latitudes 6°20’N and 6°23’N and longitudes 2°22’E and 2°30’E. It is established on a large site (4 and 6 km) and formed by a succession of offshore bars, lagoons and marsh, between the Atlantic Ocean and the Lake Nokoue.
This study aims to strengthen drinking water supply problem in Cotonou, focusing on pollution aspects and alternative approaches of safe water providing for its increase population.
DATA AND METHODS
The key physicochemical parameters (nitrogen, sodium, and chloride) were analysed using an Ionic Chromatograph DIONEX ICS 1000. The bacterial pollutants had been identified using the membrane filter technique with specific culture media Mac Conkey agar (for coliforms) and Slanetz and Bartley agar (for streptococcus) and Eosin methylene blue agar (EMB) (for enterobacteria such as Escherichia coli). Water quality compliance was assessed versus the drinking water standards of the WHO (2008).
The participative investigations and observations were used to identify the water pollution source and to assess popular perceptions of the groundwater pollution problem and the potential strategies for providing safe water for supporting projected population growth.
RESULTS AND DISCUSSIONS
Groundwater quality and pollution sources in Cotonou
Assessment of groundwater quality generated data for the concentrations of pollutants: nitrogen (5.05 to 68.6 mgL-1), sodium (74 to 78.3 mgL-1) and chloride (1.82 to 319.5 mgL-1). So, the main sources of
nitrate in local drinking water have been identified as agricultural contamination during the wet season followed by the transfer of this contamination by recharge (by wastewater) during the dry period (Totin, 2010). Moreover, the bacterial pollutants like total coliforms, Escherichia coli and faecal streptococci are identified. Their consistently exceeded drinking water guidelines and standards (0 CFU/100 ml) set by the WHO (2008).
The means sources of bacteria present on groundwater are the solid waste deposits, inadequate toilets and pit latrines, septic tanks less watertight (within the radius of 5 m from the water source), rapid land use change, wastewater induced recharge, recurrent floods with regard to the morphostructure and topography relatively flat, relatively flat (0.4 to 6.5 m).
Strategies to cope with the safe water supply challenge In the above context of increasing groundwater pollution, the shallow Quaternary aquifer is currently excluded from drinking water supplies (Boukari, 1998) which are reliant on the Continental Terminal deep aquifer on the Plateau of Allada far from Cotonou (Fig. 1).

Hydrology in a Changing World: Environmental and Human Dimensions Poster Proceedings of FRIEND-Water 2014, Montpellier, France, 7-10 October 2014
129
Fig. 1 Moving trajectory of the safe water supply site for the Cotonou Town in Benin.
According to the fact that the cost of remediation of polluted aquifers becomes extremely high (Mehta, 2006), groundwater protection will be improved by appropriate excreta, solid waste and wastewater treatment and disposal. An improved excreta management strategy will require the use of the ECOSAN latrine which consistently helps to avoid the contamination of groundwater by human faecal waste.
The continued success of these types of groundwater pollution control strategies in the town of Cotonou requires: (i) the development of an Environmental and Sanitary Information System (ESIS); (ii) taking account of the WHO directives for latrine and water sources installation (a big challenge in the town of Cotonou); (iii) incentives for maintaining safe drinking water supply or for using individual water treatment techniques; (iv) proper protection of the aquifer recharge area. CONCLUSIONS
In Cotonou town, the shallow aquifer is polluted. This coastal town is therefore confronted with the serious problem of water scarcity on account of declining groundwater quality.
To face the safe water supply challenge, groundwater pumping areas are moving from the coastal sandy plain (Quaternary shallow aquifer) towards the plateau of Allada (Continental Terminal deep aquifer). An ecosystem approach could help improve the protection of groundwater quality and to provide sustainable safe drinking water on the coastal region of West Africa. REFERENCES Adelana, A. M. S., Abiye, A. T., Nkhuwa W. C. D., Tindimugaya C. & Oga S. M. (2008) Urban groundwater management and
protection in Sub-Saharan Africa. In: Applied Groundwater Studies in Africa (ed. by S. Adelana, A. MacDonald), 13, 231-260. CRC Press/Balkema.
Boukari, M. (1998) Fonctionnement du système aquifère exploité pour l’approvisionnement en eau de la ville de Cotonou sur le littoral béninois. Impact du développement urbain sur la qualité des ressources. Thèse Doctorat ès-Science. Université Cheick Anta Diop de Dakar, Sénégal.
Mehta, M. (2006) Status of groundwater and policy issues for its sustainable development in India. Groundwater Research and Management: Integrating Science into Management Decisions. (ed. by B. R. Sharma, K. G. Villhoth & K. D. Sharma), 62–76. Malhotra Publishing House.
Odoulami, L. (2009) La problématique de l’eau potable et la santé humaine dans la ville de Cotonou (République du Bénin). Thèse de Doctorat, Université d’Abomey-Calavi, Cotonou, Bénin.
Totin, V. S. H. (2010) Sensibilité des eaux souterraines du bassin sédimentaire côtier du Bénin à l’évolution du climat et aux modes d’exploitation : Stratégies de gestion durable. Thèse de Doctorat, Université d’Abomey-Calavi, Cotonou, Bénin.
Totin, V. S. H., Boukari, M., Odoulami, L., Edorh, A. P. (2012) Qualité bactériologique des eaux souterraines et sources de pollution dans le bassin sédimentaire côtier du Bénin. Clim. & Dév., N°. 13, 16-27.
WHO (2008) Guidelines for drinking-water quality: Incorporating 1st and 2nd addenda, Vol.1, Recommendations. – 3rd ed., Geneva.

Hydrology in a Changing World: Environmental and Human Dimensions Poster Proceedings of FRIEND-Water 2014, Montpellier, France, 7-10 October 2014
130
Application of a 3D numerical model for simulation of suspended sediment transport in Bach Dang – Cam estuary (Vietnam)
VU DUY VINH1, DINH VAN UU2, SYLVAIN OUILLON3 1 Institute of Marine Environment and Resources, VAST, 246 Danang, Haiphong City, Vietnam, [email protected] 2 Ha Noi University of Science, 334 Nguyen Trai Street, Hanoi, Vietnam 3 IRD, Université de Toulouse, UPS (OMP), UMR 5566 LEGOS, 14 av. Edouard Belin, 31400 Toulouse, France INTRODUCTION
Bach Dang - Cam estuary coastal area has complicated litho-hydrodynamics with combined influence of fresh water, tidal oscillations, wave actions and big sediment flux but just gather on the rainy season. This area is important place on the social economic development in Northeast of Vietnam. However, this coastal area also faces with problem such as erosion coastline, deposition port, and increase turbidity in the beach which impact on suitable development of this region. This poster presents some results of application a three dimension (3D) numerical model to study and assessment influences of tidal oscillation, wind and wave action on characteristics of suspended sediment transport in the study area. MODEL SETUP
The Delf3d model was used as a tool to simulation hydrodynamics, sediment transport condition in Bach Dang- Cam coastal area. Delft3D is a flexible integrated modelling suite, which simulates two-dimensional and three-dimensional flow, sediment transport and morphology, waves and is capable of handling the interactions between these processes. The model for the study area is orthogonal curvilinear grid. The grid includes 293 x 455 point, grid size change in 21.9-320.9m. In the vertical, coordinate was used with 7 layers. The model coupling online process of hydrodynamics, wave and sediment transport. The hydrodynamics model takes into account process salinity, water temperature, wind and wave (online coupling). Time step for running is 30 seconds with two present scenarios: in dry season (Feb. - Mar. 2009) and rainy season (Jul. – Aug. 2009). Sea boundaries conditions for the model were gained from the overall model by nesting methods. River boundaries conditions are time- serial of river discharge and suspended sediment at each river, which were measured in the same time simulation of the model. Initial conditions for the model were obtained from the results of one month previous runs. - The bottom roughness coefficients in this study are Manning (n) coefficient, n change in spatial from 0.018-0.023m-1/3s. They are estimated base on the map of bottom sediment characteristic and the guide for Selecting Manning’s (Arcement, G.J., Jr. and V.R. Schneider (1989). - The horizontal eddy viscosity and horizontal diffusion were selected with the value of 1.0m2/s. These coefficients in the vertical are 1.0 x 10⁻⁶m2/s. The turbulence model for 2D is HLES (Uittenbogaard, 1998; Van Vossen, 2000) in the Delft3D and k-є turbulence model for 3D. - The settling velocity of suspended sediment was used with value of 0.1mm/s. This value is used in case of fresh water and take into account effect of salinity. The critical erosion shear stress of sediment is changing in 0.1-1.0 N/m2 (Van Rijn, 1993) and 0.25 N/m2 for this study. The critical deposition shear stress of sediment was defined with the value of was used with the values of 0.2 N/m2. The initial rate of natural erosion was assumed 10-3 kg/m2.s. - The open boundaries condition of the wave model for the study area was use wave prediction of the wave climate in 2009. The Alfa coefficients in this study it is used with the values of 1.0. The Gamma coefficients in this study it is used with the values of 0.73. The Bottom friction of wave model in this study is JONSWAP with value of 0.067. The B&J model (Battjes, J. and J. Janssen, 1978) was used in order to model the energy dissipation in random waves due to depth induced breaking (Delft Hydraulics, 2003). The model was validated with measure data of water elevation, current and suspended sediment at some point in the study area. The results validation shows agree between model and measure. In order to estimate characteristics of suspended sediment transport in the Bach Dang- Cam estuary,

Hydrology in a Changing World: Environmental and Human Dimensions Poster Proceedings of FRIEND-Water 2014, Montpellier, France, 7-10 October 2014
131
the model was setup with scenarios group: present, influence of tide: same as present scenarios but without tidal oscillation; influence of wind and wave combined; influence of wave alone. RESULTS AND DISCUSIONS
Suspended sediment concentration (SSC) in Bach Dang –Cam estuary changes in with phase of tide and strong variation between dry and rainy season. Due to sediment flux of rivers to the sea is small, so the distribution of sediment is restricted in closed the estuaries with SSC prevalent less than 0.07kg/m3. On the other hand, SSC could bigger than 0.1kg/m3 and higher SSC reach to area between Do Son and Cat Ba in the rainy season. The stratification of suspended sediment in Bach Dang - Cam estuary is just occurring in ebb/flood tide at about 7-16km from river mouths. Tide is important influence on suspended sediment transport in the study area, especially in the rainy season: strengthen transport sediment from river to the sea about 4-8km in ebb tide and 5-10km at low tide. On the contrary, tidal oscillations during the flood tide make increasing penetrate of seawater into the rivers more 1-2.5km. Wind action show evident effects on suspended sediment transport in the rainy season. In flood tide: sea water in upper layer into estuary 0.5-1.5km more and strengthen re-suspension of sediment from bottom to upper layers. In the ebb tide, wind action makes strengthen re-suspension of sediment at zone of 10-16km from the river mouths. Wind actions also make increase turbidity in the coastal zone of Do Son, especially in the ebb tide combined with wind come from east and southeast. Wind and wave action show evident effects on suspended sediment transport in the rainy season. In flood tide: strengthen re-suspension of sediment from bottom to upper layers. In the ebb tide, wind and wave actions make strengthen re-suspension of sediment at zone of 10-20km from the river mouths. They also make evident increase turbidity in the coastal zone of Nam Trieu mouth, Do Son, especially in the ebb tide combined with wind come from southeast. CONCLUSION
A system of linked hydrodynamics, wave and sediment transport models was applied to Bach Dang- Cam to simulate hydrodynamic, wave and suspended sediment conditions. Comparisons with observations showed that models were suitable agree. The role of tide, wind, wave were preliminary investigate in this study. The results show wind and wave are main factors creating the turbidity water zone in outside of Nam Trieu mouth, northeast area of estuary and Do Son beach, especially during the wind and wave in SE direction. REFERENCES Arcement, G.J., Jr. and V.R. Schneider (1989), “Guide for Selecting Manning’s Roughness Coefficients for Natural Channels and
Flood Plains”. U.S. Geological Survey Water Supply Paper 2339, 38 p. Battjes, J. and J. Janssen (1978), “Energy loss and set-up due to breaking of random waves”, In Proceedings 16th International
Conference Coastal Engineering, ASCE, pages 569-587. 47, 133, 134, 138, 139, 188 Delft Hydraulics (2003), “Delft3D-FLOW User Manual” Uittenbogaard, R.E., (1998), “Model for eddy diffusivity and viscosity related to sub-grid velocity and bed topography”. Note, WL |
Delft Hydraulics. Van Rijn, L., (1993), “Principles of Sediment Transport in Rivers, Estuaries and Coastal Seas”, Aqua Publications, The Netherlands. Van Vossen, B., (2000), “Horizontal Large Eddy Simulations; evaluation of computations with DELFT3D-FLOW”. Report MEAH-
197, Delft University of Technology.

Hydrology in a Changing World: Environmental and Human Dimensions Poster Proceedings of FRIEND-Water 2014, Montpellier, France, 7-10 October 2014
132
Quantification et analyse multivariée de l’érosion hydrique en région méditerranéenne (cas du bassin versant Isser, Algérie)
HOUARI ZEGGANE & DJAMEL BOUTOUTAOU Laboratoires Exploitation et Valorisation des Ressources Naturelles en Zones Arides. Université Kasdi-MERBAH Ouargla. Route de Ghardaïa BP 511 Ouargla 30000 Algérie. [email protected] INTRODUCTION
La dégradation des sols et l’envasement des retenues de barrage sont des conséquences les plus dramatiques du phénomène de l’érosion dans les régions semi-arides, à l’instar des pays de Maghreb, où l’eau de par son insuffisance et son inégale répartition est le facteur limitant du développement économique Ramdane (1994), de plus cette dégradation affecte considérablement les terres arables dans la région. En Algérie, le climat est très agressif avec des pluies très irrégulières. Les pluies torrentielles sont fréquentes en automne, avec des intensités dépassant souvent 45 mm/h, au moment où la couverture végétale est absente, engendrant, des temps de concentrations des eaux très courts, des crues fortes, rapides et chargées de sédiments, dont les conséquences, ont des répercussions directes, tant à l’amont par des pertes de sols et des ravinements qu’à l’aval par des inondations et des dépôts de sédiments Touaïbia (2010).
MATÉRIELS ET MÉTHODES
Enclavé dans les contreforts de l’Atlas tellien, le bassin de l’Isser est situé à environ de 70Km au Sud-Est d’Alger (capitale d’Algérie) et s’étend sur 3 615 Km2 à la station hydrométrique de Lakhdaria. Le cadre géographique dans lequel se développe ce bassin est constitué essentiellement de l’Atlas tellien algérois au Nord qui culmine à 1 130 m au mont de Tamesguida et de la chaîne des Bibans au sud qui culmine à 1 700 m au mont de de Dira. Ces deux chaines sont séparées par la plaine des Aribs, de point de vue géologique, les affleurements en place ou charriés du crétacé supérieur et du miocène marin sont prédominants, ce qui se traduit sur le plan lithologique par la présence des schistes et de formation marno-calcaire dans la zone nord-tellien. Au sud de la chaine quartzitique des Bibans, on trouve des faciès de marnes schisteuses avec des bancs de calcaires du crétacé supérieur. Le flux annuel des matières solides en suspension exporté par l’oued Isser aux différents points de mesure, est calculé par la formule(1) Cherif et al. (2009).
j
N
1jjj1j CQttAs
(1)
où Cj est la concentration (g/l) évaluée à l’instant tj correspondant au débit liquide Qj(m3/s), N est le nombre de prélèvements effectués sur l’année considérée, tj+1-tj est le pas de temps séparant deux prélèvements consécutifs, le nombre de mesures instantanées (débit liquide-concentration) pour les stations Lakhdaria(SB1), La Traille (SB2), Mezahime(SB3) et Déchmiya(SB4) est de 7514,1828,1564 et 281 respectivement. Les résultats de calcul ainsi que les données d’autres points de mesure, avec leurs coordonnées Lambert Nord Algérie sont données dans le tableau 1.Une analyse à différentes échelles temporelles du transport solide au droit de ces quatre stations hydrométriques a été effectuée, par la suite et afin de mettre en évidence, d’éventuelle relation entre la variable expliquée qu’est l’érosion en T/Ha.an et d’autres variables explicatives, une régression multiple a été appliquée aux données du tableau 1, après transformation en log de l’ensemble des données.

Hydrology in a Changing World: Environmental and Human Dimensions Poster Proceedings of FRIEND-Water 2014, Montpellier, France, 7-10 October 2014
133
Tableau 1 Principaux résultats et données relatives au bassin versant Isser.
Individus X
Km
Y
Km
Es
(T/H.an)
S
Km2
Im
%
Dd
Km/Km2
Ce
%
CV
%
SB1 579.10 368.75 22.50 3615.00 48.50 3.60 18.00 60,00
SB2 559.25 343.25 9.50 2570.00 51.00 3.20 9.80 45,00
SB3 539.70 322.65 5.30 665.00 54.00 3.03 7.40 20,00
SB4 578.25 316.45 45.40 73.00 60.00 2.40 26.00 35,00
MB1 558.92 329.36 23.80 1.69 5.25 4.08 5.70 20,00
MB2 549.36 311.20 29.20 0.27 11.00 5.74 5.40 10
MB3 566.51 336.38 45.50 0.08 25.05 12.50 30.80 10
RC1 557.60 328.80 4.70 3.33 45.00 4.41 13.30 10,00
RC2 550.40 327.20 4.50 2.88 40.20 4.33 11.60 10,00
Rc3 547.40 323.80 5.00 10.00 47.85 4.80 11.40 10,00
RC4 528.75 324.80 4.50 3.77 61.60 3.20 15.00 5,00
RC5 527.80 322.00 6.00 3.58 68.30 3.43 11.60 10,00
RC6 585.50 357.30 8.00 0.70 38.35 6.03 19.00 15,00
RC7 597.60 350.80 9.00 1.40 27.50 3.70 19.00 10
RC8 577.10 331.20 8.00 3.69 39.90 2.42 12.00 10
RC9 576.80 335.50 16.00 4.80 75.50 4.95 15.00 10
B-Ladrat 533.30 326.55 20.00 73.50 46.50 4.80 15.10 10
Dd : Densité de drainage (km/km2). Im : Pente moyenne (%). S : Superficie en (Km2). Ce : Coefficient d’écoulement (%). Es : Erosion spécifique (Tonne/Hectare.an).Cv : Couverture végétale. SB (1, 2,3 et 4) : Sous Bassins Lakhdaria, La Traille, Mezahim, Dechmiya. MB (1,2 et 3) : Micros Bassins expérimentaux. RC (1, 2, 3, 4,.., 9) : Retenues collinaires. B-Ladrat : Barrage Ladrat.
RESULTATS ET CONCLUSION
La répartition mensuelle des apports solides des mesures de quatre stations hydrométriques, montre un fort pourcentage de transport solide durant la période fin d’été et l’automne, on enregistre 50% ,50%, 68% et 86% pour les stations Lakhdaria, La Traille, Mezahim et Dechmiya, quant à la période hivernale, les pourcentages du transport solide sont 30%,33%,13% et 7%. Au vue de ces résultats la fin de l’été et l’automne présentent un fort transport solide, les orages d’été, d’automne et les grandes crues de l’hiver un facteur essentiel pour le transport solide sur l’ensemble du bassin versant.
Le modèle ressorti au terme de la régression multiple, après vérification de significativité de la
régression globale et celle des coefficients de régressions,Es 17Im . Ce . , 97.08.0 CeIm17Es montre une nette contribution du coefficient d’écoulement au transport solide, cependant l’érosion ne croît pas avec l’accroissement de la pente où. Selon les travaux de Roose et al. (1993), l'érosion, ne croissent pas systématiquement avec la pente sur vertisol sur marnes.
REFERENCES
Ramdane, M. (1994) Etat des connaissances sur l’érosion et les transports solides en Algérie à travers les études de cas. Bassins de l’oued Isser et de l’Oued Mina. Eaux et sols d’Algérie ANRH (7), 51-60.
Cherif, E.A., Errih, M. & Madani Cherif, H. (2009) Modélisation statistique du transport solide du bassin versant de l’oued Mekerra (Algérie) en zone semi-aride méditerranéenne. Hydro. Sci. J. 54(2), 383-348.
Roose, E., Arabi, M., Brahamia, K., Chebbani, R., Mazour, M. & Morsli, B. (1993) Érosion en nappe et ruissellement en montagne méditerranéenne. Réduction des risques érosifs et intensification de la production agricole par GCES. Cahiers ORSTOM, série Pédologie. Vol. 28, 289-308. Touaïbia, B. (2010) Problématique de l’érosion et du transport solide en Algérie septentrionale. Revue Sécheresse 21(1), 1-6.

Hydrology in a Changing World: Environmental and Human Dimensions Poster Proceedings of FRIEND-Water 2014, Montpellier, France, 7-10 October 2014
134