reforming power markets: lessons from five developing countries presented at: workshop on power...
Post on 20-Dec-2015
213 views
TRANSCRIPT

Reforming Power Markets:Lessons from Five Developing Countries
presented at:Workshop on Power Sector Reform:
Rio de Janeiro, 5-6 April 2004
David G. Victor
Program on Energy and Sustainable Development
Stanford University
http://pesd.stanford.edu/

Program on Energy & Sustainable Development
1. Electricity Market reforms Five-country comparison
(Brazil, China, India, Mexico, South Africa) IPPs
2. Geopolitics of Natural Gas Looking to 2030
3. Rural energy supply Shift from traditional to modern fuels and
technologies4. Climate change policy
Beyond Kyoto

Power Sector Reform in Developing Countries
1. Causes of Reform From state-centered to market-oriented
power systems
2. Speed and Character of Reform
3. Outcomes Impact on organization of the power sector Impact on the “social contract”

1. Causes of Reform
• In the advanced industrialized nations– Goal: economic efficiency– Expected outcome: tariff reductions
• In these five developing countries– Goal: financial solvency and investment– Realistic outcome: tariff increases

End of the Declining Cost Paradigm:United States example
Average U.S. Retail Electricity Prices
05
10152025303540
1926
1931
1936
1941
1946
1951
1956
1961
1966
1971
1976
1981
1986
1991
1996
19
95
U.S
. c
en
ts/k
wh
Number of Steam Electric Generators, U.S.
0
500
1000
1500
2000
2500
3000
1920 1930 1940 1950 1960 1970
Nu
mb
er o
f S
team
Pla
nts

3
4
5
6
7
8
9
10
11
12
13
14
15
16
172
00
2
20
03
20
04
20
05
20
06
20
07
20
08
20
09
20
10
20
11
20
12
20
13
20
14
20
15
20
16
20
17
20
18
20
19
20
20
Wh
ole
sa
le P
ric
e (
20
01 c
/kW
h)
Regulated Current Cost Accounting
Regulated Historical Cost Accounting
Competitive Scenario
Expected Future Costs of Power Delivery in South Africa
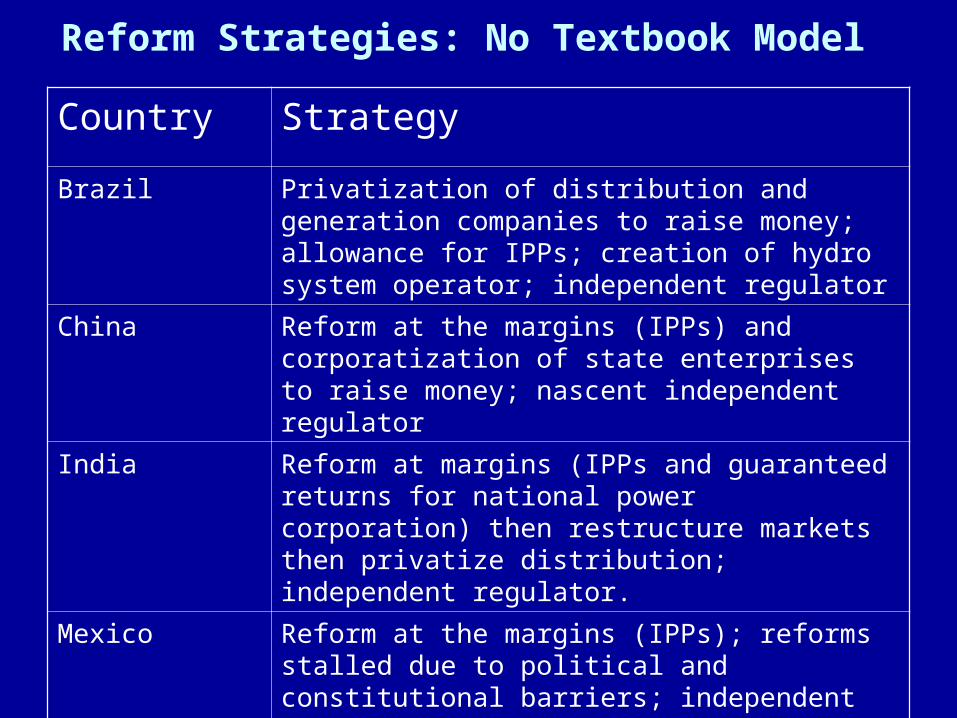
Reform Strategies: No Textbook Model
Country StrategyBrazil Privatization of distribution and generation
companies to raise money; allowance for IPPs; creation of hydro system operator; independent regulator
China Reform at the margins (IPPs) and corporatization of state enterprises to raise money; nascent independent regulator
India Reform at margins (IPPs and guaranteed returns for national power corporation) then restructure markets then privatize distribution; independent regulator.
Mexico Reform at the margins (IPPs); reforms stalled due to political and constitutional barriers; independent regulator
South Africa Aggressive electrification; reform of distributors; corporatization of utility; independent regulator

2. Speed and Character of Reforms
• Electricity Reforms depend on other reforms– Factor Markets
• Labor; fuels– Judicial
• Independent regulators– Corporate Governance and accounting
• Essential for regulatory oversight and private investment– Finance
• The single most important factor• State sector finance; soft budget constraints
– Contrast w/ OECD• reform with “rule of law,” market institutions, and independent
financial sectors already in place

3. Outcomes:Organization of the Power Sector• Emergence of “hybrid markets”
– Partially state-controlled• Financing; tariffs
– Partially market• Project and concession bidding• Brief market experiments
– Six provinces in China (1999-2001)
– A sustainable model for investment?• Predictability and solvency

Value and Number of Financial Closings of Greenfield Electricity Projects in East Asia and the Pacific
0
2000
4000
6000
8000
10000
12000
14000
1994 1995 1996 1997 1998 1999 2000 2001
Year
Va
lue
in U
S$
mill
ion
s
0
5
10
15
20
25
30
35
40
45
50
Value ofinvestment
Number offinancialclosings

Hybrid Markets
• Fragmented Ownership and Control– Isolated pockets of profitability: listed corporations– Pervasive under-performing: retained by the state
• Hybrid financing– Hard debt; equity squeeze; soft loans; pervasive state “safety
nets”• Hybrid governance
– “JV model” survives– Constant pressure to “socialize the downside and privatize the
upside”• Policy implications: tunneling strategies?
– APDRP in India• Policy implications: large effect of transparency reforms
– Corporate governance and accounting

3. Outcomes (continued)
• Impact of Restructuring on Reliability?– Still unclear– Financial reforms probably very positive
• Impact on “social contract”– Electric services for the poor
• Neutral to positive
– Protection of the environment• Neutral to positive
– Investment in innovation• Very negative?

Final Observations
• Central role for “non-electric” reforms– Especially financial and judicial reforms
• Importance of building coalitions for reforms– Coalitions that favor reform– “tunneling through” opposition
• APDRP in India
• Independent regulators as substitutes for government– To create confidence and stability
• Regulators overseeing hybrid markets, not textbook markets– Key issues: governance, transparency, IPP tenders– Lesser issues: market power, congestion

[backup slides follow]

From State-Centered to Market-Centered…
• Organization– Unbundling; fragmentation
• Ownership– Privatization, IPPs
• Financing– Market finance replaces “soft budgets”
• Governance and Accounting– External shareholder accountability
• Oversight– From the state to independent regulators

Five Critical Developing Countries
Country Populat’n Income
(GDP/cap $, PPP)
GDP
(billionUS$)
PowerSupply
(Twh)
Gen. Capacity
(Gw)
DominantFuel
NewFuel
Brazil 170m 7625 595 332 69 Hydro(88%)
Gas(0.2%)
China 1262m 3976 1079 1240 294 Coal (78%)
Gas(0.4%)
India 1016m 2358 456 527 108 Coal(75%)
Gas(6%)
Mexico 98m 9023 575 192 39 Oil (47%)
Gas(18%)
SouthAfrica
43m 9401 126 200 40 Coal(93%)
Gas(0%)

Why No “Textbook” Restructuring? (1)
• Key Reform Driver: Need for New Capacity– Tight systems; bad context for true markets– How to attract investors
• Markets, or stability?• Brazil’s experience
– Fast reformers focus on IPPs• China, India, Mexico, Brazil
– Slower reformers have excess capacity• South Africa
– Contrast w/ OECD: efficiency driven reforms

Electric Power Restructuring: Financing Options
Need new capacity
Self-financing through retained earnings
Financing through the state
Financing at margin (e.g., IPPs)
Financing through restructuring
PPAs (local & FDI
Unbundling SOEs, new governance,
independent regulators, market rules, etc.

Time for a Change?CFE’s slow expansion in Mexico
0%10%20%30%40%50%60%70%80%90%
100%
1930 1940 1950 1960
CFEChapalaImpulsoraMexicana

Source: Energy Ministry with CFE and LyFC data.
38,195
51,468 48,94654,244 53,064
61,72366,401 66,352
71,19174,334
IPPs in Mexico: Visions for the Future Close to 60 billion dollars will be required during the next 10 years in
the power sector.
Only 47% of the investment is expected to come from the Federal Budget.
2002-20112002-2011
(Billion pesos of 2002)(Billion pesos of 2002)IPP and FPIPP and FP
Federal BudgetFederal Budget
39%
61% 59% 51% 52% 47% 41% 42% 41% 42%
61%
39%41%
49% 48%
53%59% 58.0%
59%58%
0
15.000
30.000
45.000
60.000
75.000
90.000
2002 2003 2004 2005 2006 2007 2008 2009 2010 2011

Conclusion: Implications for Regulation
• Regulators overseeing hybrid markets, not markets– Key issues: governance, transparency, IPP
tenders– Lesser issues: market power, congestion– Interplay with other reforms
• Regulators as “replacement” for the State– Example of tariff control– Especially in democratic countries?
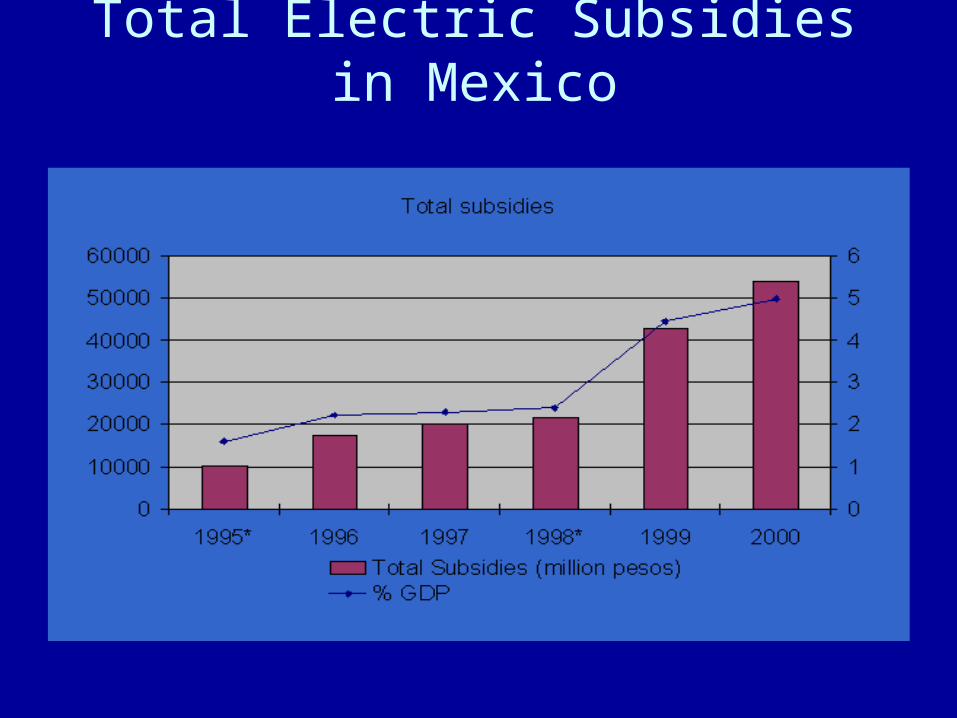
Total Electric Subsidies in Mexico
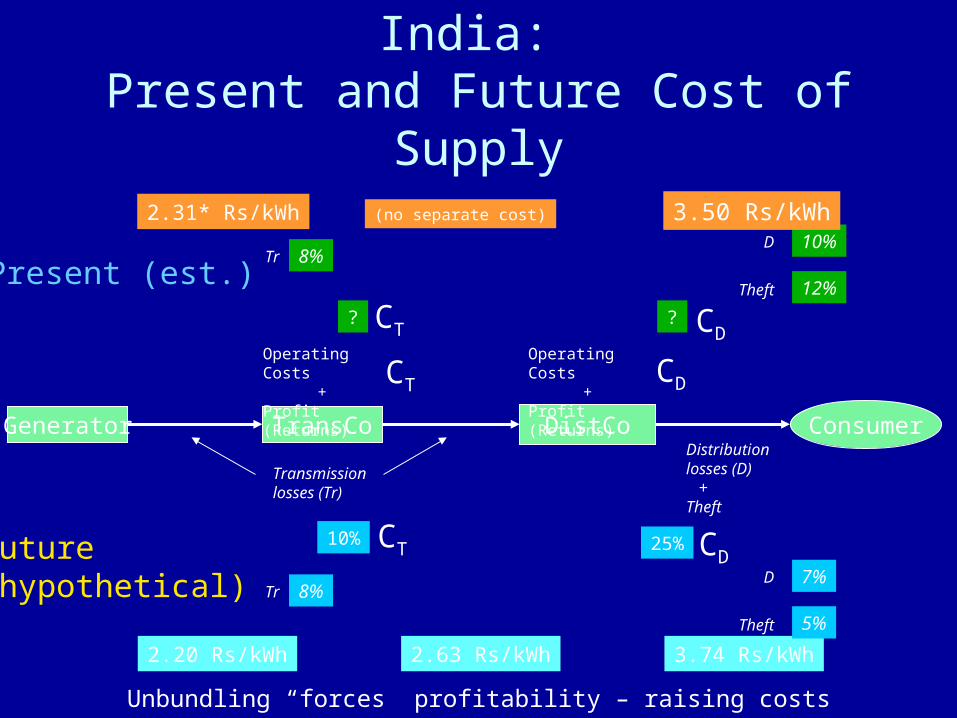
India: Present and Future Cost of Supply
Unbundling “forces” profitability – raising costs
Generator TransCo DistCo Consumer
Transmission losses (Tr)
Distribution losses (D) +Theft
Operating Costs
+Profit (Returns)
Operating Costs
+Profit (Returns)
CT CD
2.20 Rs/kWh 2.63 Rs/kWh 3.74 Rs/kWh
25%10%
7%
5%
8%D
Theft
Tr
CT CD
Future(hypothetical)
??
2.31* Rs/kWh10%
12%
8%
(no separate cost) 3.50 Rs/kWhD
Theft
Tr
CT CD
Present (est.)

Power Consumption in ChinaPower Consumption Structure
0
200
400
600
800
1000
1200
1400
1980 1984 1988 1992 1996 2000
TW
h
Residential
Tertiary
Industry
Agriculture

41.6
426.3
195.6
378.7
449.2
194.4
239.9 ps/kWh(Average)
5.00 ¢/kWh
Prices
Power Consumption and Tariffs in India
Domestic21%
Commercial5%
Agricultural30%
Industry31%
Outside 1%
Railway2%
Others10%
Source: Planning Commission
Consumption 315 Billion kWh