reflections on the saps
TRANSCRIPT

© Copyright – Institute for Security Studies – 11 October 2016
Reflections on the SAPS Annual Report 2015/16
11 October 2016
Gareth Newham Head of the Governance Crime & Justice Division
© Copyright – Institute for Security Studies – 11 October 2016 2
WHATISTHEINSTITUTEFORSECURITYSTUDIES?
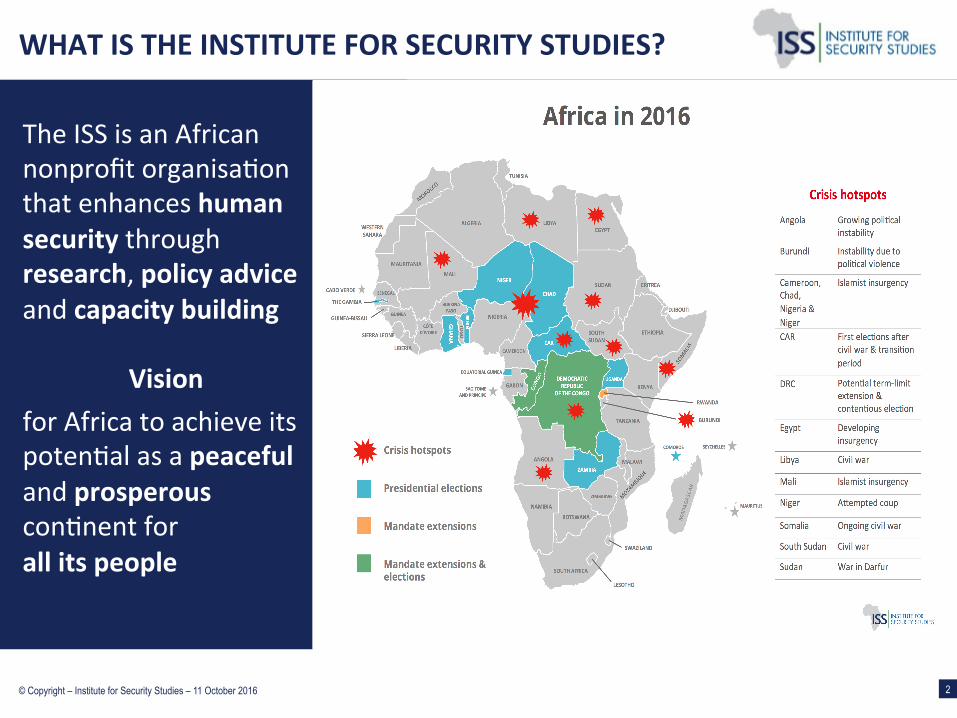
TheISSisanAfricannonprofitorganisa4onthatenhanceshumansecuritythroughresearch,policyadviceandcapacitybuilding
VisionforAfricatoachieveitspoten4alasapeacefulandprosperouscon4nentforallitspeople

© Copyright – Institute for Security Studies – 11 October 2016 3
ISSORGANISATION
ISSPretoria
ISSAddisAbaba
ISSNairobi
ISSDakar
99STAFF
STAFFFROM
AFRICANCOUNTRIES
14
3663
© Copyright – Institute for Security Studies – 11 October 2016 4
OVERVIEW
• General Comments
• Police Performance • Police Conduct • Police Well-being
© Copyright – Institute for Security Studies – 11 October 2016 5
GENERAL COMMENTS
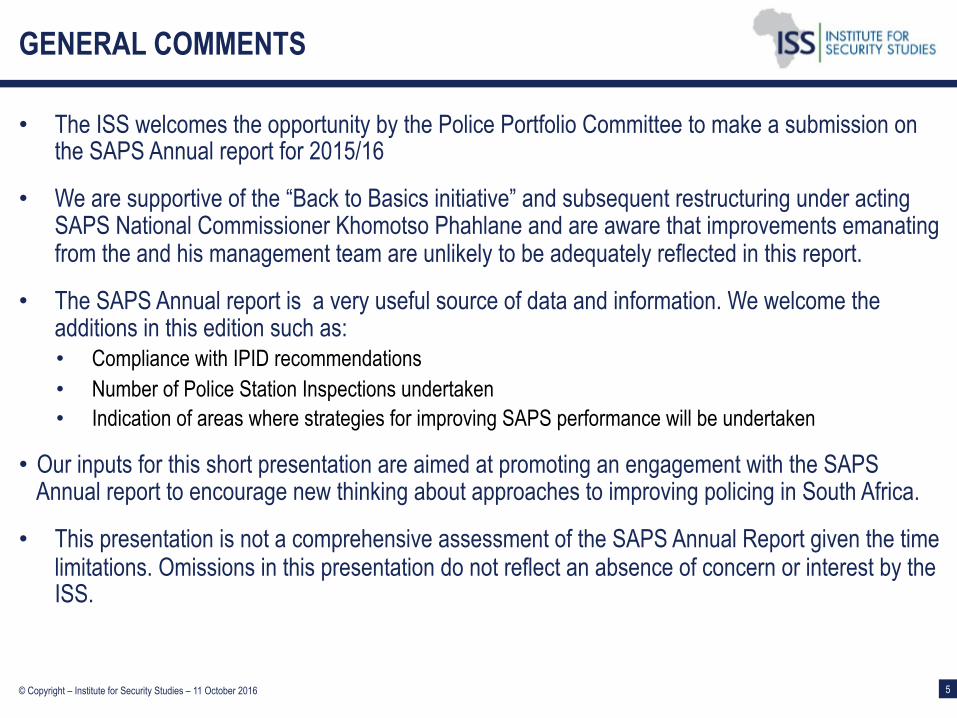
• The ISS welcomes the opportunity by the Police Portfolio Committee to make a submission on the SAPS Annual report for 2015/16
• We are supportive of the “Back to Basics initiative” and subsequent restructuring under acting SAPS National Commissioner Khomotso Phahlane and are aware that improvements emanating from the and his management team are unlikely to be adequately reflected in this report.
• The SAPS Annual report is a very useful source of data and information. We welcome the additions in this edition such as: • Compliance with IPID recommendations • Number of Police Station Inspections undertaken • Indication of areas where strategies for improving SAPS performance will be undertaken
• Our inputs for this short presentation are aimed at promoting an engagement with the SAPS Annual report to encourage new thinking about approaches to improving policing in South Africa.
• This presentation is not a comprehensive assessment of the SAPS Annual Report given the time limitations. Omissions in this presentation do not reflect an absence of concern or interest by the ISS.
© Copyright – Institute for Security Studies – 11 October 2016 6
MURDER & ROBBERIES AS KEY PRIORITIES
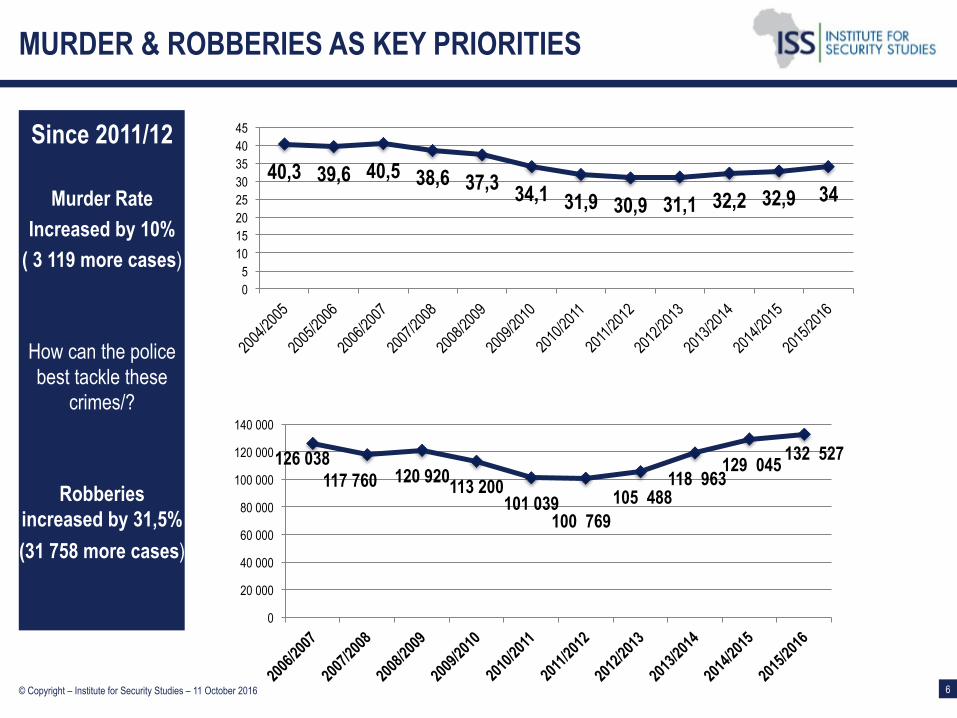
Since 2011/12
Murder Rate Increased by 10%
( 3 119 more cases)
How can the police best tackle these
crimes/?
Robberies increased by 31,5% (31 758 more cases)
40,3 39,6 40,5 38,6 37,3 34,1 31,9 30,9 31,1 32,2 32,9 34
0 5
10 15 20 25 30 35 40 45
126 038 117 760 120 920 113 200
101 039 100 769
105 488 118 963
129 045 132 527
0
20 000
40 000
60 000
80 000
100 000
120 000
140 000
© Copyright – Institute for Security Studies – 11 October 2016 7
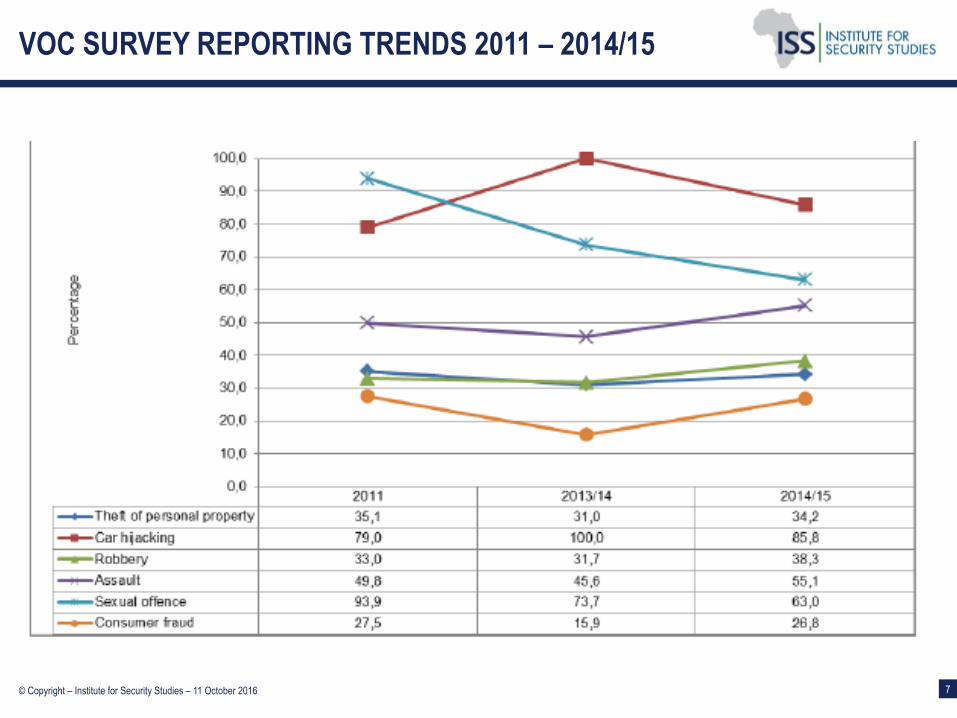
VOC SURVEY REPORTING TRENDS 2011 – 2014/15
© Copyright – Institute for Security Studies – 11 October 2016 8
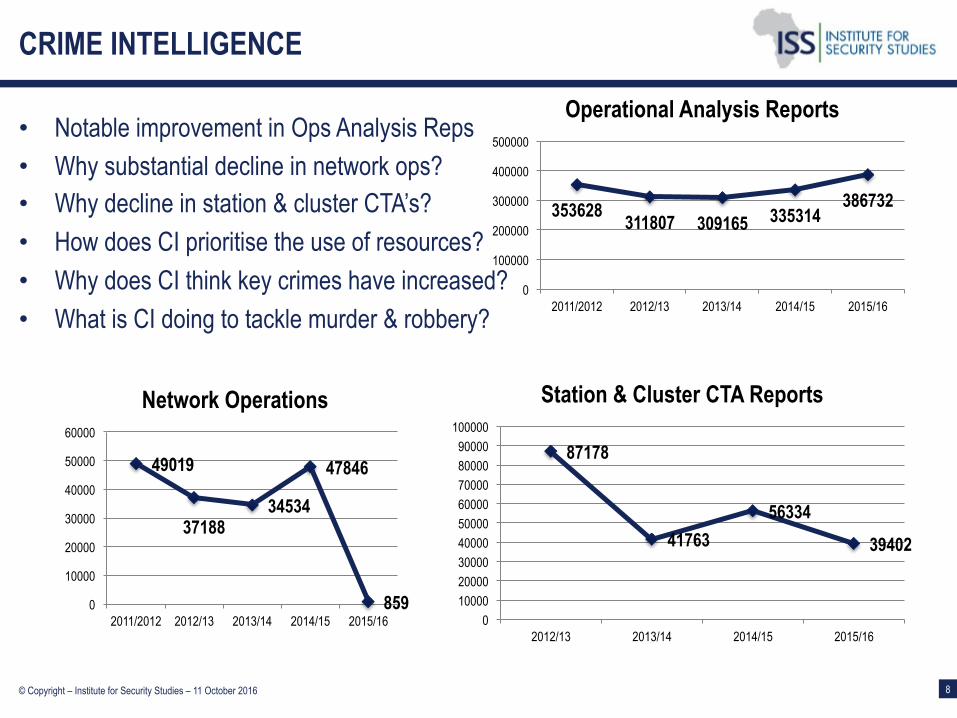
CRIME INTELLIGENCE
• Notable improvement in Ops Analysis Reps • Why substantial decline in network ops? • Why decline in station & cluster CTA’s? • How does CI prioritise the use of resources? • Why does CI think key crimes have increased? • What is CI doing to tackle murder & robbery?
353628 311807 309165 335314 386732
0
100000
200000
300000
400000
500000
2011/2012 2012/13 2013/14 2014/15 2015/16
Operational Analysis Reports
49019
37188 34534
47846
859 0
10000
20000
30000
40000
50000
60000
2011/2012 2012/13 2013/14 2014/15 2015/16
Network Operations
87178
41763 56334
39402
0 10000 20000 30000 40000 50000 60000 70000 80000 90000
100000
2012/13 2013/14 2014/15 2015/16
Station & Cluster CTA Reports
© Copyright – Institute for Security Studies – 11 October 2016 9
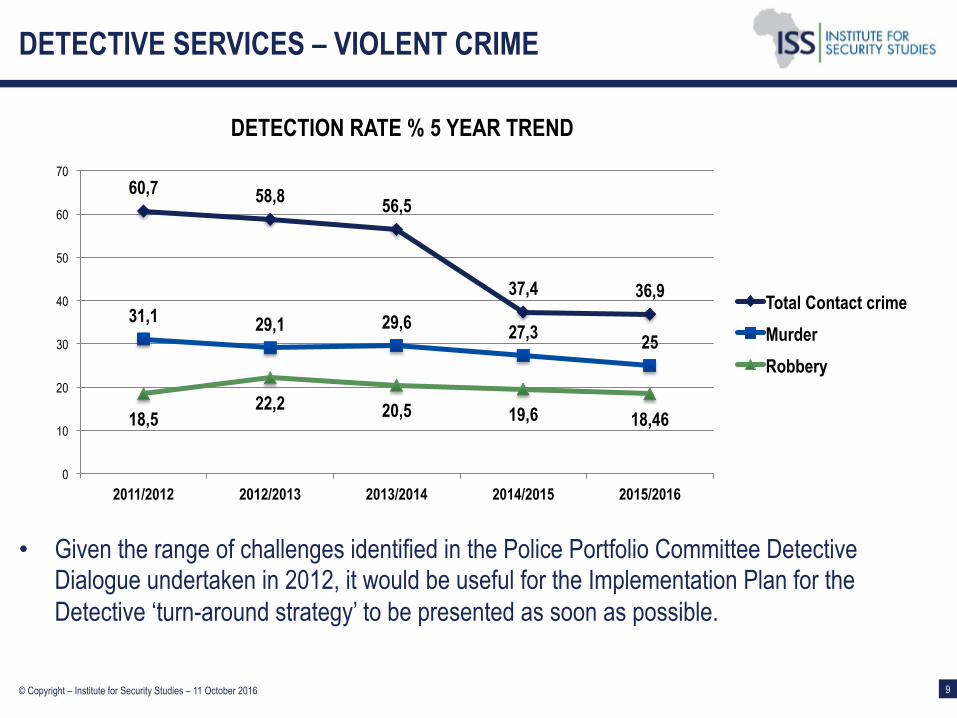
DETECTIVE SERVICES – VIOLENT CRIME
• Given the range of challenges identified in the Police Portfolio Committee Detective
Dialogue undertaken in 2012, it would be useful for the Implementation Plan for the Detective ‘turn-around strategy’ to be presented as soon as possible.
60,7 58,8 56,5
37,4 36,9 31,1 29,1 29,6 27,3 25
18,5 22,2 20,5 19,6 18,46
0
10
20
30
40
50
60
70
2011/2012 2012/2013 2013/2014 2014/2015 2015/2016
DETECTION RATE % 5 YEAR TREND
Total Contact crime Murder Robbery

© Copyright – Institute for Security Studies – 11 October 2016 10
DETECTIVE SERVICES – CORRUPTION & OC
129
70 83
58 39
53
86
21 9 15
6 11 0
20
40
60
80
100
120
140
2012/2013 2013/2014 2014/2015 2015/2016
Prevention & Combatting of Corruption Act - Performance
PRECCA Cases
PRECCA Arrests
PRECCA Convictions
8 5
12 10
7 1
34
13
6
9 10
4 0 5
10 15 20 25 30 35 40
2012/2013 2013/2014 2014/2015 2015/2016
Prevention of Organised Crime Act - Performance
POCA Cases
POCA Arrests
POCA Conviction
© Copyright – Institute for Security Studies – 11 October 2016 11
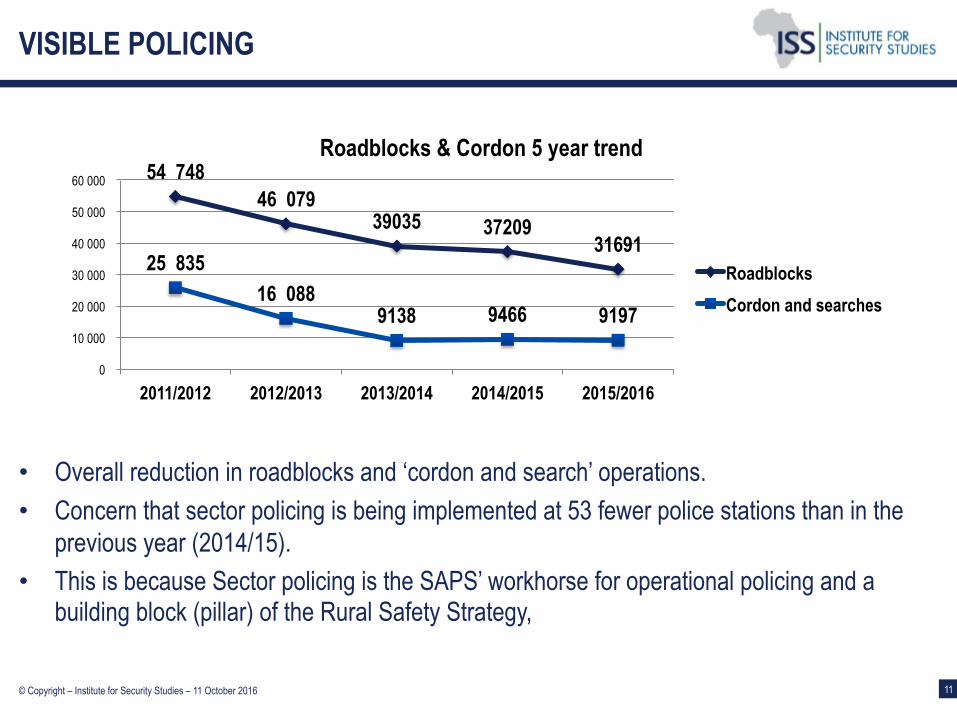
VISIBLE POLICING
• Overall reduction in roadblocks and ‘cordon and search’ operations. • Concern that sector policing is being implemented at 53 fewer police stations than in the
previous year (2014/15). • This is because Sector policing is the SAPS’ workhorse for operational policing and a
building block (pillar) of the Rural Safety Strategy,
54 748 46 079
39035 37209 31691
25 835 16 088
9138 9466 9197
0
10 000
20 000
30 000
40 000
50 000
60 000
2011/2012 2012/2013 2013/2014 2014/2015 2015/2016
Roadblocks & Cordon 5 year trend
Roadblocks Cordon and searches

© Copyright – Institute for Security Studies – 11 October 2016 12
PUBLIC ORDER POLICING
- “Unrest’ cases on IRIS not always violent - Number of public violence cases opened no longer available. - See www.issafrica.org/crimehub for more analysis and maps of public violence in South Africa
8981 6640 6342
7993
11680 10832 10517 11601 12451
11151
753 755 753 1014 971 1226 1882 1907 2289 3542
0
2000
4000
6000
8000
10000
12000
14000
POP IRIS Data
Peaceful Unrest
© Copyright – Institute for Security Studies – 11 October 2016 13
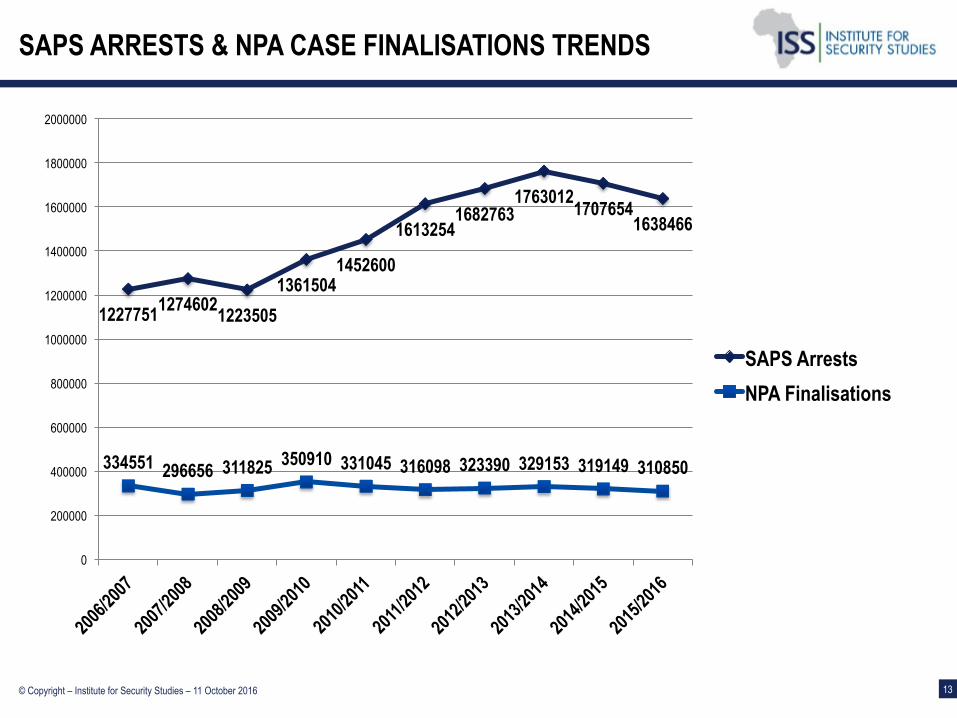
SAPS ARRESTS & NPA CASE FINALISATIONS TRENDS
1227751 1274602 1223505 1361504
1452600
1613254 1682763
1763012 1707654 1638466
334551 296656 311825 350910 331045 316098 323390 329153 319149 310850
0
200000
400000
600000
800000
1000000
1200000
1400000
1600000
1800000
2000000
SAPS Arrests NPA Finalisations
© Copyright – Institute for Security Studies – 11 October 2016 14
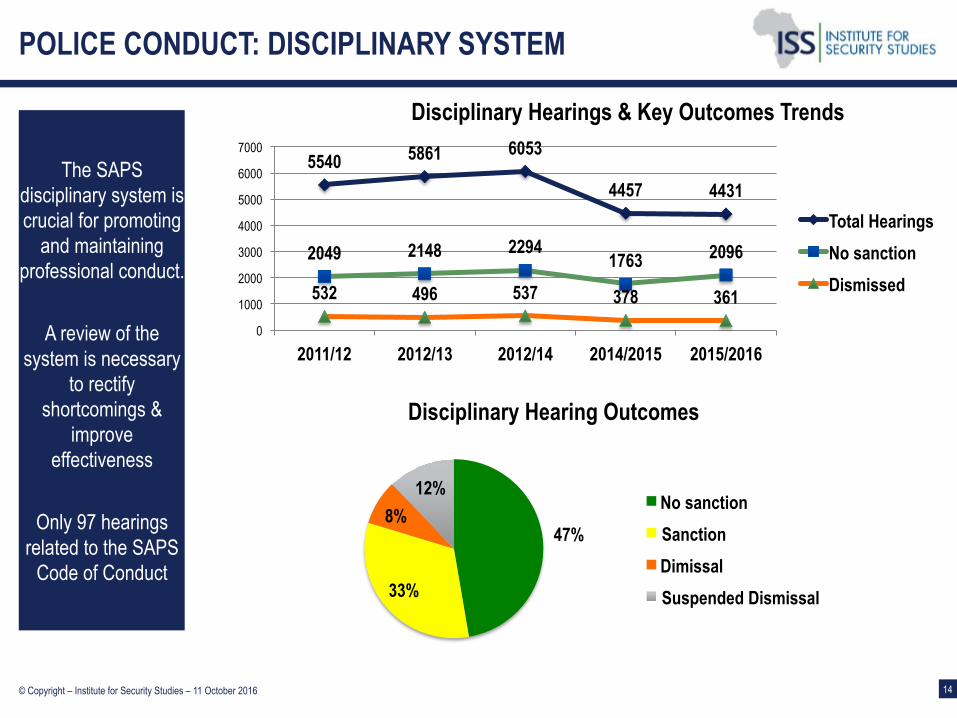
POLICE CONDUCT: DISCIPLINARY SYSTEM
The SAPS disciplinary system is crucial for promoting
and maintaining professional conduct.
A review of the
system is necessary to rectify
shortcomings & improve
effectiveness
Only 97 hearings related to the SAPS
Code of Conduct
5540 5861 6053
4457 4431
2049 2148 2294 1763 2096
532 496 537 378 361 0
1000
2000
3000
4000
5000
6000
7000
2011/12 2012/13 2012/14 2014/2015 2015/2016
Disciplinary Hearings & Key Outcomes Trends
Total Hearings No sanction Dismissed
47%
33%
8% 12%
Disciplinary Hearing Outcomes
No sanction Sanction Dimissal Suspended Dismissal
© Copyright – Institute for Security Studies – 11 October 2016 15
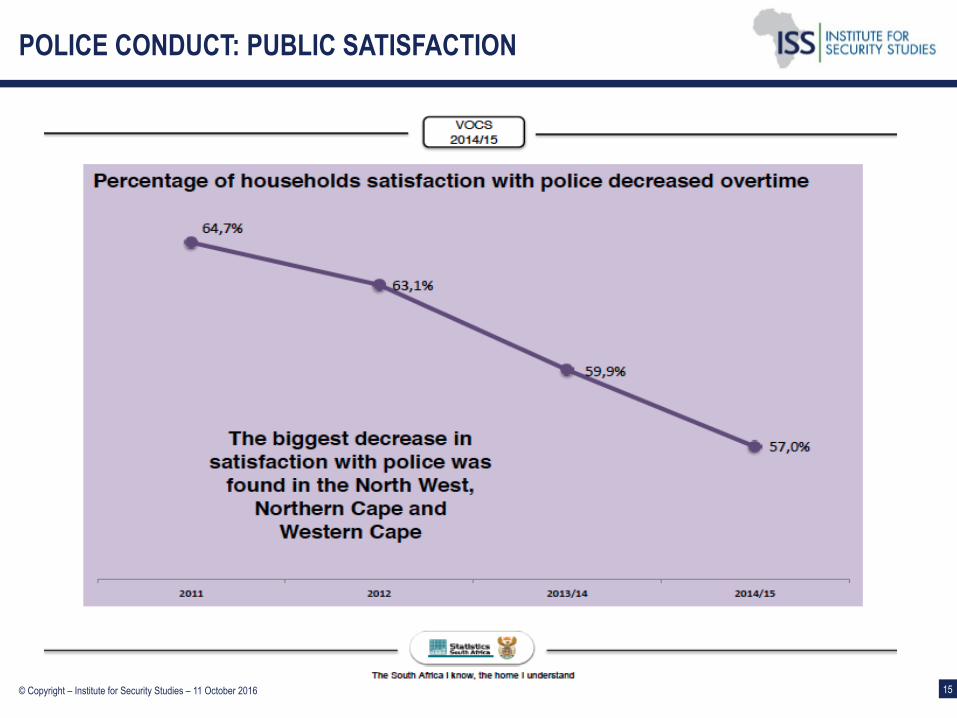
POLICE CONDUCT: PUBLIC SATISFACTION

© Copyright – Institute for Security Studies – 11 October 2016 16
POLICE CONDUCT: CIVIL CLAIMS
16 In Millions
R105,960
R187,132
R251,192 R256,188
R290,979
0
50000
100000
150000
200000
250000
300000
350000
2011/2012 2012/2013 2013/2014 2014/2015 2015/2016
Civil Claims Paid Out in R Millions
175 % Increase in five years
© Copyright – Institute for Security Studies – 11 October 2016 17
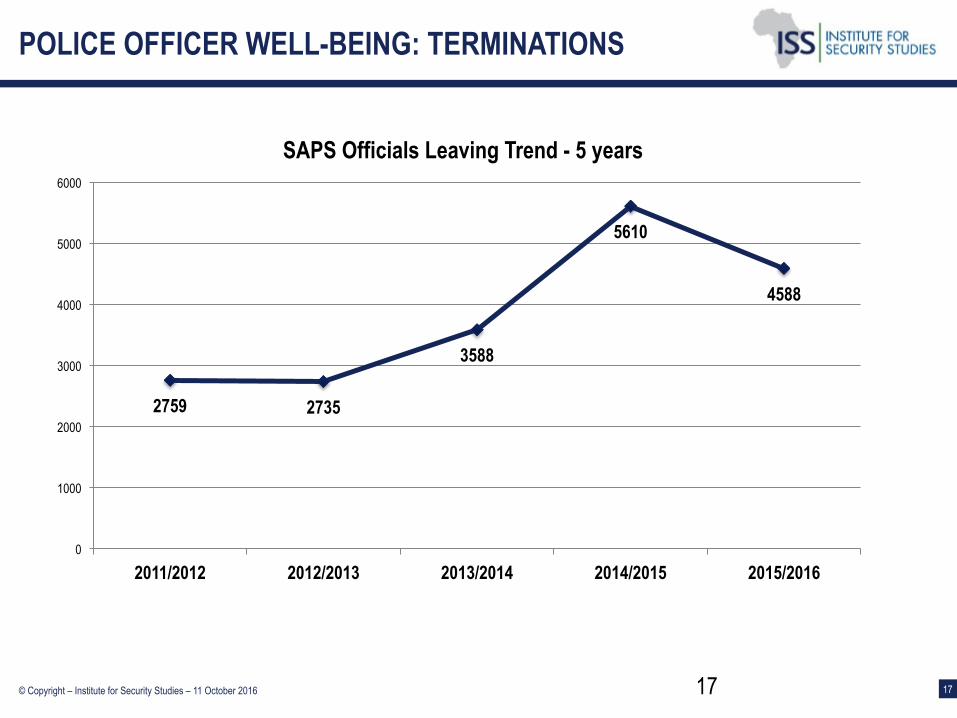
POLICE OFFICER WELL-BEING: TERMINATIONS
17
2759 2735
3588
5610
4588
0
1000
2000
3000
4000
5000
6000
2011/2012 2012/2013 2013/2014 2014/2015 2015/2016
SAPS Officials Leaving Trend - 5 years
© Copyright – Institute for Security Studies – 11 October 2016 18
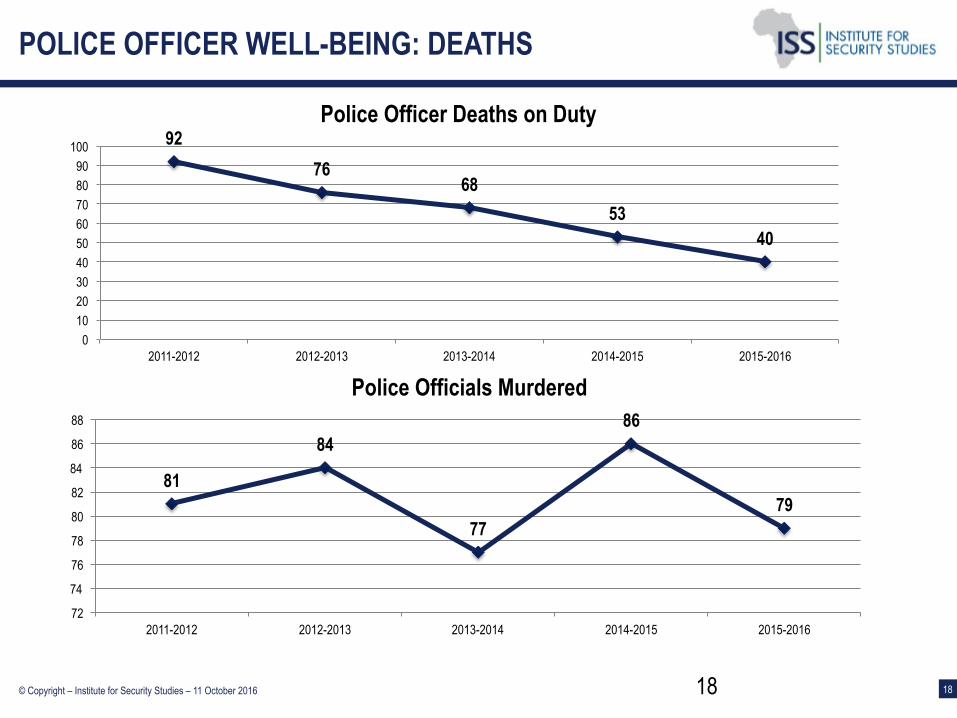
POLICE OFFICER WELL-BEING: DEATHS
18
81
84
77
86
79
72
74
76
78
80
82
84
86
88
2011-2012 2012-2013 2013-2014 2014-2015 2015-2016
Police Officials Murdered
92 76
68 53
40
0 10 20 30 40 50 60 70 80 90
100
2011-2012 2012-2013 2013-2014 2014-2015 2015-2016
Police Officer Deaths on Duty
© Copyright – Institute for Security Studies – 11 October 2016 19
CONTACT & SUBSCRIPTION DETAILS
www.issafrica.org/crimehub [email protected]