reflecting on trackfin
TRANSCRIPT

For more information:http://www.who.int/water_sanitation_health/glaas/trackfin/en/Contact: [email protected]
R E F L E C T I N G O N
TrackFin 2012–2020Key results, lessons learned, and the way forward

R E F L E C T I N G O N
TrackFin 2012–2020Key results, lessons learned, and the way forward

Reflecting on TrackFin 2012–2020: key results, lessons learned and the way forward
ISBN 978-92-4-002843-2 (electronic version)ISBN 978-92-4-002844-9 (print version)
© World Health Organization 2021
Some rights reserved. This work is available under the Creative Commons Attribution-NonCommercial-ShareAlike 3.0 IGO licence (CC BY-NC-SA 3.0 IGO; https://creativecommons.org/licenses/by-nc-sa/3.0/igo).
Under the terms of this licence, you may copy, redistribute and adapt the work for non-commercial purposes, provided the work is appropriately cited, as indicated below. In any use of this work, there should be no suggestion that WHO endorses any specific organization, products or services. The use of the WHO logo is not permitted. If you adapt the work, then you must license your work under the same or equivalent Creative Commons licence. If you create a translation of this work, you should add the following disclaimer along with the suggested citation: “This translation was not created by the World Health Organization (WHO). WHO is not responsible for the content or accuracy of this translation. The original English edition shall be the binding and authentic edition”.
Any mediation relating to disputes arising under the licence shall be conducted in accordance with the mediation rules of the World Intellectual Property Organization (http://www.wipo.int/amc/en/mediation/rules/).
Suggested citation. Reflecting on TrackFin 2012–2020: key results, lessons learned and the way forward. Geneva: World Health Organization; 2021. Licence: CC BY-NC-SA 3.0 IGO.
Cataloguing-in-Publication (CIP) data. CIP data are available at http://apps.who.int/iris.
Sales, rights and licensing. To purchase WHO publications, see http://apps.who.int/bookorders. To submit requests for commercial use and queries on rights and licensing, see http://www.who.int/about/licensing.
Third-party materials. If you wish to reuse material from this work that is attributed to a third party, such as tables, figures or images, it is your responsibility to determine whether permission is needed for that reuse and to obtain permission from the copyright holder. The risk of claims resulting from infringement of any third-party-owned component in the work rests solely with the user.
General disclaimers. The designations employed and the presentation of the material in this publication do not imply the expression of any opinion whatsoever on the part of WHO concerning the legal status of any country, territory, city or area or of its authorities, or concerning the delimitation of its frontiers or boundaries. Dotted and dashed lines on maps represent approximate border lines for which there may not yet be full agreement.
The mention of specific companies or of certain manufacturers’ products does not imply that they are endorsed or recommended by WHO in preference to others of a similar nature that are not mentioned. Errors and omissions excepted, the names of proprietary products are distinguished by initial capital letters.
All reasonable precautions have been taken by WHO to verify the information contained in this publication. However, the published material is being distributed without warranty of any kind, either expressed or implied. The responsibility for the interpretation and use of the material lies with the reader. In no event shall WHO be liable for damages arising from its use.
Design and layout by L’IV Com Sàrl

iii
Contents
Acknowledgements . . . . . . . . . . . . . . . . . . . . . . . . . . . . . . . . . . . . . . . . . . . . . . . . . . . . . . . . . . . . . . . . . . . . . . . . . . . . v
Acronyms and abbreviations . . . . . . . . . . . . . . . . . . . . . . . . . . . . . . . . . . . . . . . . . . . . . . . . . . . . . . . . . . . . . . . . . . . vi
Introduction . . . . . . . . . . . . . . . . . . . . . . . . . . . . . . . . . . . . . . . . . . . . . . . . . . . . . . . . . . . . . . . . . . . . . . . . . . . . . . . . . . . . 1
How does TrackFin work? . . . . . . . . . . . . . . . . . . . . . . . . . . . . . . . . . . . . . . . . . . . . . . . . . . . . . . . . . . . . . . . . . . . . . 4
What are the key outcomes of TrackFin? . . . . . . . . . . . . . . . . . . . . . . . . . . . . . . . . . . . . . . . . . . . . . . . . . . . . . . . 6Stronger positioning to advocate for increased WASH resources . . . . . . . . . . . . . . . . . . . . . . . . . . . . . . . . . . 6Improved availability and quality of WASH financial data in countries . . . . . . . . . . . . . . . . . . . . . . . . . . . . . . . 6Improved communications and harmonized data from development partners . . . . . . . . . . . . . . . . . . . . . . . 7Better coordination, communication and collaboration among WASH actors . . . . . . . . . . . . . . . . . . . . . . . . 7Institutionalization of WASH accounts . . . . . . . . . . . . . . . . . . . . . . . . . . . . . . . . . . . . . . . . . . . . . . . . . . . . . . . . . . 8
What challenges arose during TrackFin implementation? . . . . . . . . . . . . . . . . . . . . . . . . . . . . . . . . . . . . . . 9
What can be learned from TrackFin data? . . . . . . . . . . . . . . . . . . . . . . . . . . . . . . . . . . . . . . . . . . . . . . . . . . . . . 10Overall expenditure in the WASH sector . . . . . . . . . . . . . . . . . . . . . . . . . . . . . . . . . . . . . . . . . . . . . . . . . . . . . . . 10Distribution of government, donor, and user contributions to the WASH sector . . . . . . . . . . . . . . . . . . . . . 11Distribution of WASH expenditures among services and geographic regions . . . . . . . . . . . . . . . . . . . . . . . 13Main service providers and their respective share of spending . . . . . . . . . . . . . . . . . . . . . . . . . . . . . . . . . . . . 15Hygiene expenditures as a proportion of WASH spending . . . . . . . . . . . . . . . . . . . . . . . . . . . . . . . . . . . . . . . 17
What are the essential elements for successful TrackFin implementation and institutionalization? . . . . . . . . . . . . . . . . . . . . . . . . . . . . . . . . . . . . . . . . . . . . . . . . . . . . . . . . . . . . . . . . . . . . . . . . . . . . 19
National government ownership and strong stakeholder engagement . . . . . . . . . . . . . . . . . . . . . . . . . . . . 19Capacity-building of national teams, with access to up-to-date tools and training materials . . . . . . . . . . 19An iterative and incremental approach to TrackFin implementation . . . . . . . . . . . . . . . . . . . . . . . . . . . . . . . . 19Use of the WASH accounts production tool (WAPT) for developing WASH accounts and standardized outputs . . . . . . . . . . . . . . . . . . . . . . . . . . . . . . . . . . . . . . . . . . . . . . . . . . . . . . . . . . . . . . . . . . . . . . . . 19
What is the way forward for TrackFin? . . . . . . . . . . . . . . . . . . . . . . . . . . . . . . . . . . . . . . . . . . . . . . . . . . . . . . . . 21
Annex 1. The scope of TrackFin in countries . . . . . . . . . . . . . . . . . . . . . . . . . . . . . . . . . . . . . . . . . . . . . . . . . . 23
Annex 2. Availability of data for developing WASH accounts . . . . . . . . . . . . . . . . . . . . . . . . . . . . . . . . . . 24
Annex 3. Standard WASH accounts parameters . . . . . . . . . . . . . . . . . . . . . . . . . . . . . . . . . . . . . . . . . . . . . . 26

iv Reflecting on TrackFin 2012–2020
List of FiguresFigure 1. Timeline of TrackFin development and implementation . . . . . . . . . . . . . . . . . . . . . . . . . . . . . . 2Figure 2. Overview of the WASH accounts process . . . . . . . . . . . . . . . . . . . . . . . . . . . . . . . . . . . . . . . . 4Figure 3. Funding types and funding units for core WASH expenditures (drinking-water supply, sanitation, and support services) for Ghana (2012), Mali (2015), and Senegal (2016) . . . . . . . . . . . . . 12Figure 4. Per capita core WASH expenditures by WASH service . . . . . . . . . . . . . . . . . . . . . . . . . . . . . 13Figure 5. Distribution of WASH expenditure per capita by region in Senegal (2016) and Burkina Faso (2015) . . . . . . . . . . . . . . . . . . . . . . . . . . . . . . . . . . . . . . . . . . . . . . . . . . . . . . . . . . . . . . . . . . . . . . 13Figure 6. Expenditures for WASH services by type of cost in Senegal (2016) . . . . . . . . . . . . . . . . . . . . 14Figure 7. Breakdown by funding type for different types of costs for large water supply and sanitation systems in Senegal (2016) . . . . . . . . . . . . . . . . . . . . . . . . . . . . . . . . . . . . . . . . . . . . . . . . . . 15Figure 8. Expenditure for different types of WASH services by WASH service providers in Burkina Faso (2015) . . . . . . . . . . . . . . . . . . . . . . . . . . . . . . . . . . . . . . . . . . . . . . . . . . . . . . . . . . . . . . . 16Figure 9. Contribution of different funding types to WASH service providers in Burkina Faso (2015) . . . . . . . . . . . . . . . . . . . . . . . . . . . . . . . . . . . . . . . . . . . . . . . . . . . . . . . . . . . . . . . 16Figure 10. Distribution of total WASH expenditure by WASH service . . . . . . . . . . . . . . . . . . . . . . . . . . 18Figure 11. Financial flows between sources of funding and services in Senegal, in US$ millions (2016) . . . . . . . . . . . . . . . . . . . . . . . . . . . . . . . . . . . . . . . . . . . . . . . . . . . . . . . . . . . . . . 20
List of TablesTable 1. Countries implementing TrackFin . . . . . . . . . . . . . . . . . . . . . . . . . . . . . . . . . . . . . . . . . . . . . . . 3Table 2. TrackFin classifications . . . . . . . . . . . . . . . . . . . . . . . . . . . . . . . . . . . . . . . . . . . . . . . . . . . . . . . 5Table 3. Total and core WASH expenditure, core WASH expenditure per capita, and core WASH expenditure as a percentage of GDP . . . . . . . . . . . . . . . . . . . . . . . . . . . . . . . . . . . . . . . . . . . . . . . . . . 10Table 4. Approximate expenditure per capita by WASH service in Senegal (2016) . . . . . . . . . . . . . . . . 14Table A1. Scope of TrackFin in countries . . . . . . . . . . . . . . . . . . . . . . . . . . . . . . . . . . . . . . . . . . . . . . . 23Table A2. WASH financial data availability by funding type . . . . . . . . . . . . . . . . . . . . . . . . . . . . . . . . . . 24
vKey results, lessons learned, and the way forward
AcknowledgementsThe World Health Organization (WHO) gratefully acknowledges the financial and technical support provided by the Agence Française de Développement (AFD); the Bill & Melinda Gates Foundation; the Foreign, Commonwealth & Development Office, United Kingdom of Great Britain and Northern Ireland (FCDO); Directorate-General for International Cooperation, Netherlands (DGIS); IRC; Swiss Agency for Development and Cooperation (SDC); UNICEF; United States Agency for International Development (USAID); WaterAid, the Water Supply and Sanitation Collaborative Council (WSSCC) and the World Bank for TrackFin.
Additionally, WHO would like to acknowledge all of the country government teams as well as all partners and stakeholders at country level that have made TrackFin possible in Argentina, Bangladesh, Brazil, Burkina Faso, Ghana, India, Kenya, Kyrgyzstan, Nepal, Niger, Nigeria, Madagascar, Malawi, Mali, Mexico, Morocco, Mozambique, Peru, Senegal, Tunisia, and Uganda.

vi Reflecting on TrackFin 2012–2020
Acronyms and abbreviationsCBO Community-based organizationGDP Gross domestic productGLAAS UN-Water Global Analysis and Assessment of Sanitation and Drinking-WaterJMP WHO/UNICEF Joint Monitoring Programme for Water Supply, Sanitation and HygieneNGO Nongovernmental organizationSDG Sustainable Development GoalUNICEF United Nations Children’s FundUSAID United States Agency for International DevelopmentWAPT WASH accounts production toolWASH Water, sanitation and hygieneWHO World Health Organization

1Key results, lessons learned, and the way forward
IntroductionAdequate funding and effective financing for water, sanitation and hygiene (WASH) are essential to deliver and sustain services, and to allow countries to make progress towards Sustainable Development Goal (SDG) 6 and other SDG targets. Since 2008, UN-Water Global Analysis and Assessment of Sanitation and Drinking-Water (GLAAS) results have indicated that there are substantial gaps in our understanding and tracking of financial flows in the WASH sector. A GLAAS-commissioned expert review in 2012 concluded that financial reporting is often insufficient for making sound, evidence-based planning and budgeting decisions.
To respond to this need, the World Health Organization (WHO), through the GLAAS initiative, developed the TrackFin methodology to provide a global standardized methodology for collecting and analysing WASH financial data. The overall aim of TrackFin is to support countries to understand their WASH financial situation for more effective financial planning, programming and use of funds to improve WASH services and service delivery. Closely modelled on the System of Health Accounts1, the TrackFin methodology enables countries to map and analyse financial flows to the sector based on standard classifications and terminology, resulting in what is referred to as WASH accounts. The process aims to strengthen national capacities and systems for collecting and analysing financial information for the WASH sector and to ultimately institutionalize the regular production of WASH accounts.
Data from WASH accounts can be used by policy-makers in combination with other data and assessments, such as joint sector reviews, as part of a comprehensive and strategic analysis that informs policies and programmes, and supports WASH monitoring and reporting. Development partners can also use WASH accounts data to support allocation and prioritization of resources and for strengthening partnerships with country governments.
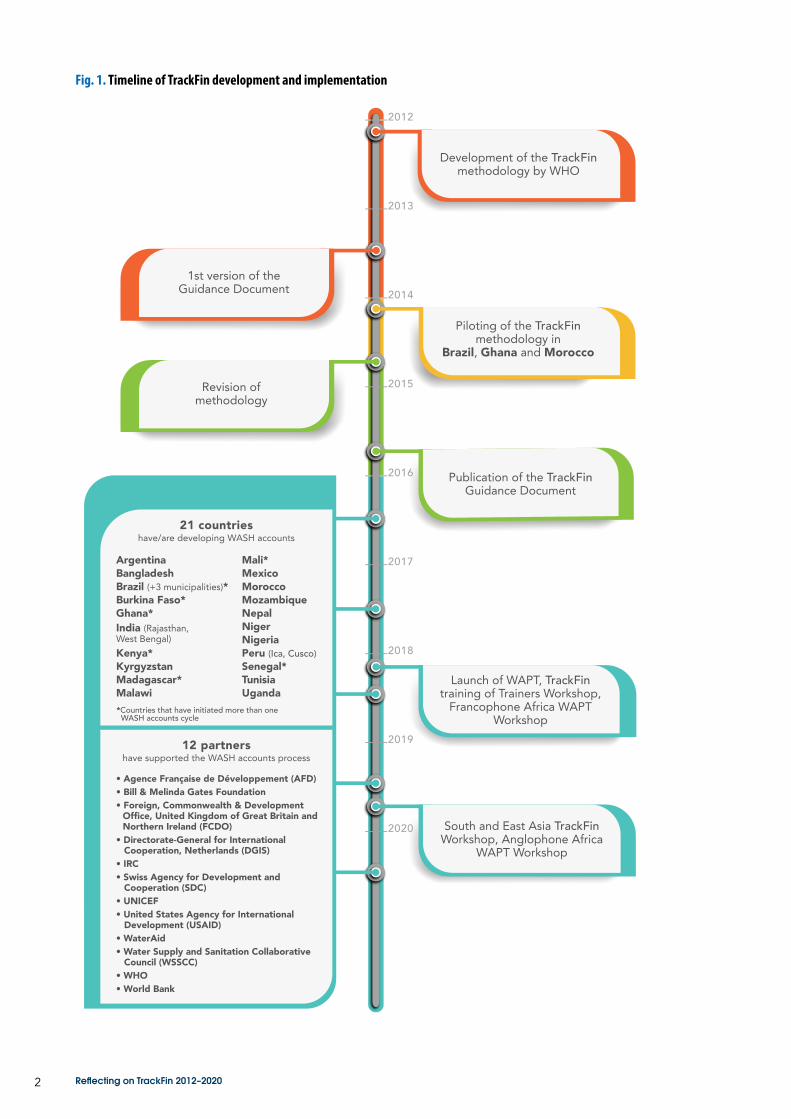
In 2014, the TrackFin initiative was successfully piloted in three countries – Brazil, Ghana and Morocco. Based on these pilots, the TrackFin Guidance Document was finalized in 2015, providing methodological guidance for countries developing WASH accounts. A software tool, the WASH Accounts Production Tool (WAPT), was developed to support countries to import and map expenditure data and to automate the production of standard WASH accounts parameters and tables2. The WAPT was launched in February 2018 and is available in English, French, Portuguese, and Russian. In August 2018, WHO established an online TrackFin Community of Practice platform for posting country WASH accounts and documents and providing a discussion forum for methodological issues. Figure 1 provides an overview of the development of the TrackFin methodology and implementation in countries.
1 For more information on health accounts see: https://www.who.int/health-topics/health-accounts/#tab=tab_12 Annex 3 presents a table of the standard WASH accounts parameters.
2 Reflecting on TrackFin 2012–2020
Fig. 1. Timeline of TrackFin development and implementation
Development of the TrackFin methodology by WHO
Piloting of the TrackFin methodology in
Brazil, Ghana and Morocco
Publication of the TrackFin Guidance Document
Launch of WAPT, TrackFin training of Trainers Workshop,
Francophone Africa WAPT Workshop
South and East Asia TrackFin Workshop, Anglophone Africa
WAPT Workshop
1st version of theGuidance Document
Revision ofmethodology
Since 2014:21 countrieshave/are developing WASH accounts
12 partnershave supported the WASH accounts process
*Countries that have initiated more than one WASH accounts cycle
ArgentinaBangladeshBrazil (+3 municipalities)*Burkina Faso*Ghana*India (Rajasthan, West Bengal)Kenya*KyrgyzstanMadagascar* Malawi
Mali*MexicoMoroccoMozambiqueNepalNigerNigeriaPeru (Ica, Cusco)Senegal*TunisiaUganda
2012
2013
2014
2015
2016
2017
2018
2019
2020
• Agence Française de Développement (AFD)• Bill & Melinda Gates Foundation• Foreign, Commonwealth & Development
Office, United Kingdom of Great Britain and Northern Ireland (FCDO)
• Directorate-General for International Cooperation, Netherlands (DGIS)
• IRC• Swiss Agency for Development and
Cooperation (SDC)• UNICEF• United States Agency for International
Development (USAID)• WaterAid• Water Supply and Sanitation Collaborative
Council (WSSCC)• WHO• World Bank

3Key results, lessons learned, and the way forward
As of July 2020, 21 countries have initiated TrackFin representing a mix of geographic regions and country income groups. As indicated in Table 1, three countries are launching their second cycle, three are launching their third, and several more countries have expressed strong interest in developing WASH accounts. Table 1 also highlights that TrackFin can take place at the national or regional level; two states in India and two states in Peru have implemented TrackFin. In addition to the essential support provided by implementing country governments, TrackFin development and implementation have been supported technically and financially by a range of development partners1.
Initiated first cyclea Completed first cycle Initiating second cycle Initiating third cycle Completed third cycle
Countries Bangladesh, Malawi, Mozambique, Nepal,
Niger, Nigeria, Peru (Ica, Cusco)
Argentina, Brazil, India (Rajasthan and West Bengal), Kyrgyzstan,
Mexico, Morocco, Tunisia, Uganda
Burkina Faso, Madagascar, Senegal
Ghana, Kenya Mali
Table 1. Countries implementing TrackFin
a Including planning, resource mobilization, data collection and analysis.
1 The following development partners have provided support to TrackFin at the global and/or country level: Agence Française de Développement (AFD); the Bill & Melinda Gates Foundation; the Foreign, Commonwealth & Development Office, United Kingdom of Great Britain and Northern Ireland (FCDO); Directorate-General for International Cooperation, Netherlands (DGIS); IRC; Swiss Agency for Development and Cooperation (SDC); UNICEF; United States Agency for International Development (USAID); WaterAid, the Water Supply and Sanitation Collaborative Council (WSSCC) and the World Bank.
4 Reflecting on TrackFin 2012–2020
How does TrackFin work?
The TrackFin methodology was developed to support the collection and mapping of WASH financial flows, in a comprehensive and comparable manner, based on standard TrackFin classifications. The financial flows that TrackFin focuses on are expenditures, meaning money that is spent rather than budgeted for WASH goods and services. TrackFin does not analyse budgets for WASH. The resulting outputs of TrackFin are called WASH accounts. TrackFin and WASH accounts aim to answer four key questions:
1. What is the total expenditure in the WASH sector?2. What are WASH funds being spent on?3. Who pays for WASH services and how much do they pay?4. Who are the main WASH service providers and how much are they spending?
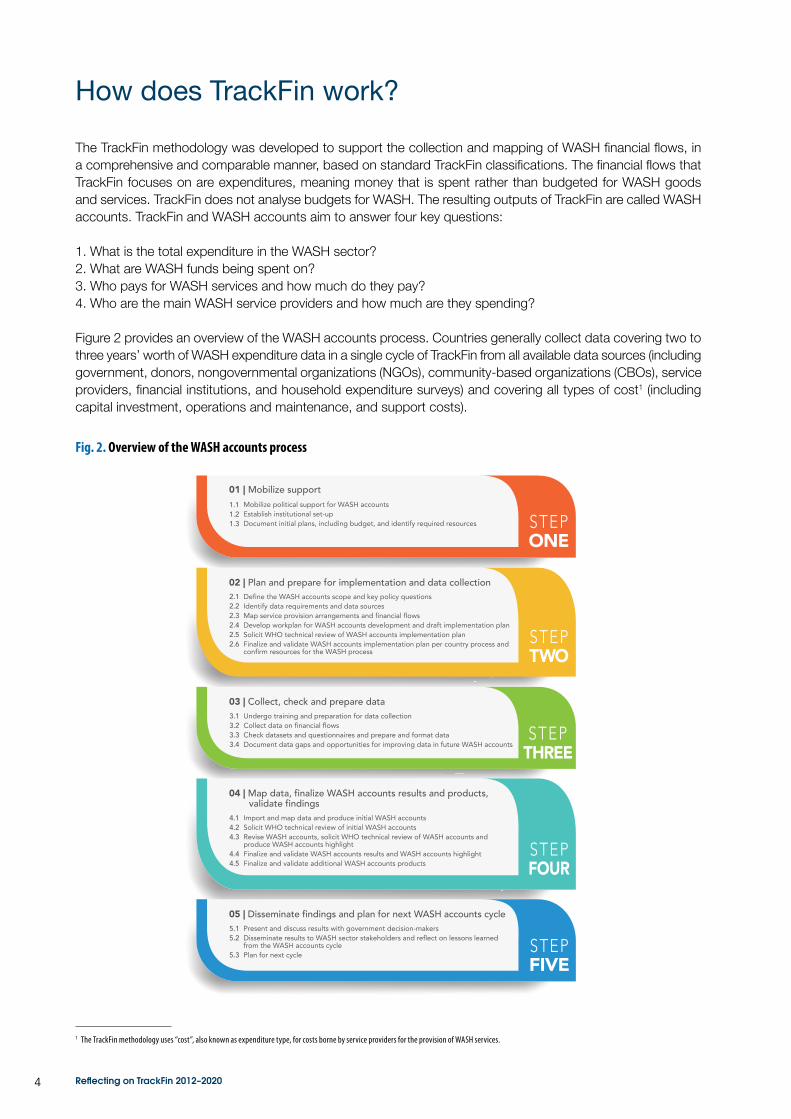
Figure 2 provides an overview of the WASH accounts process. Countries generally collect data covering two to three years’ worth of WASH expenditure data in a single cycle of TrackFin from all available data sources (including government, donors, nongovernmental organizations (NGOs), community-based organizations (CBOs), service providers, financial institutions, and household expenditure surveys) and covering all types of cost1 (including capital investment, operations and maintenance, and support costs).
Fig. 2. Overview of the WASH accounts processFIGURE 2
ONESTEP
01 | Mobilize supportMobilize political support for WASH accountsEstablish institutional set-upDocument initial plans, including budget, and identify required resources
1.11.21.3
02 | Plan and prepare for implementation and data collectionDefine the WASH accounts scope and key policy questionsIdentify data requirements and data sourcesMap service provision arrangements and financial flowsDevelop workplan for WASH accounts development and draft implementation planSolicit WHO technical review of WASH accounts implementation planFinalize and validate WASH accounts implementation plan per country process and confirm resources for the WASH process
2.12.22.32.42.52.6
TWOSTEP
03 | Collect, check and prepare dataUndergo training and preparation for data collectionCollect data on financial flowsCheck datasets and questionnaires and prepare and format dataDocument data gaps and opportunities for improving data in future WASH accounts
3.13.23.33.4 THREE
STEP
04 | Map data, finalize WASH accounts results and products, validate findings
Import and map data and produce initial WASH accountsSolicit WHO technical review of initial WASH accountsRevise WASH accounts, solicit WHO technical review of WASH accounts and produce WASH accounts highlightFinalize and validate WASH accounts results and WASH accounts highlightFinalize and validate additional WASH accounts products
4.14.24.3
4.44.5 FOUR
STEP
05 | Disseminate findings and plan for next WASH accounts cyclePresent and discuss results with government decision-makersDisseminate results to WASH sector stakeholders and reflect on lessons learned from the WASH accounts cyclePlan for next cycle
5.15.2
5.3
FIVESTEP
1 The TrackFin methodology uses “cost”, also known as expenditure type, for costs borne by service providers for the provision of WASH services.

5Key results, lessons learned, and the way forward
TrackFin is a government-led process, with the scope and focus defined according to country context and government priorities1. The scope of TrackFin may vary to an extent from country to country, depending on national needs; however, all countries should include, as a minimum, expenditures for drinking-water supply, sanitation, and for support services to WASH (which includes policy development, planning and programme administration). These expenditures are referred to as “core WASH expenditures”. Annex 1 provides an overview of the scope of data collected for TrackFin in a number of countries. All expenditures are then classified and mapped to the eight standard TrackFin classifications2 shown in Table 2 as well as any additional country-specific classifications. The resulting WASH accounts are often shown in the form of the standard WASH accounts parameters (Annex 3), tables showing two or more classifications, graphs and other visual representations.
Table 2. TrackFin classifications
Classification Definition
Funding units (FU) Entities that provide or mobilize funding to the sector to pay for WASH services, as well as entities that provide financing (e.g. loans) to actors in the WASH sector. They may allocate funds directly to service providers or channel them through intermediary institutions. Funding units include users, government authorities and service providers.
Funding types (FT) Financial flows between funding units and service providers, characterized by their origin and nature. Funding types include tariffs, government funding, repayable financing and grants.
WASH providers (P) Actors engaged in the production and delivery of WASH goods and services, including government institutions that provide support.
WASH services (S) WASH services and products provided by WASH service providers and consumed by users.
Costs (C)a Type of costs borne by service providers for the provision of WASH services. Types of costs include capital investment, operations and maintenance and support activities.
Uses of WASH services (U) Types of use (e.g. by households or health care facilities) of WASH goods and services.
Service areas (A) Types of areas where WASH services are provided and consumed (urban, rural, centralb) defined according to the country definition.
Geographic regions (R) Regions (geographical jurisdictions) where WASH services are provided and used. Names of geographical jurisdictions will vary from one country to another.
a Costs refers to different expenditure types (for example operations and maintenance and capital investment), thus the money that is being spent.b In the TrackFin classifications, central is defined as service areas that cannot be defined as urban or rural because both benefit (such as support activities of the state, an NGO or other organization). Central could
be activities performed by a central or decentralized actor.
1 Annex 1 provides further discussion of the scope of TrackFin in implementing countries.2 Detailed information on all TrackFin classifications can be found here: https://www.who.int/water_sanitation_health/publications/trackfin_guidance_document/en/

6 Reflecting on TrackFin 2012–2020
What are the key outcomes of TrackFin?
Although TrackFin is a young initiative, the use of the TrackFin methodology and the WASH accounts data it generates have already shown impact.
Stronger positioning to advocate for increased WASH resources
WASH accounts provide comprehensive financial evidence for developing a business case to advocate for increased funds within the national budget and for fundraising with development partners. Madagascar reported that the “powerful information” compiled through TrackFin strengthened government leadership, with the government in a position to request donor-specific reporting and to hold development partners accountable. In Burkina Faso, WASH accounts results showed that funding would need to be increased by 268% to achieve the targets described in the WASH national plan linked to the SDGs. This finding was used by the government at high-level meetings to advocate for more funding for WASH sector investments and institutional development. In Ghana, WASH accounts showed that WASH funding lagged behind other essential services and provided evidence for increased funding for the sector.
Using WASH accounts data to advocate for additional funding in Mali
From WASH accounts in Mali, we learned that total expenditure on capital investment from all actors for drinking-water from 2012–2015 represented only 53.5% of what was planned for infrastructure in the National Plan for Access to Drinking-Water, contributing to Mali not reaching the Millennium Development Goal for drinking-water, despite good progress between 2006–2011. Results from the WASH accounts were presented in September 2017 to the Minister’s Council [a council that sits under the Prime Minister] which helped me to justify the importance of the Presidential Programme of Social Emergencies 2017–2020 and to convince the Ministry of Finance and partners to strengthen funding for the sector. TrackFin was the tool we were missing to monitor funding of the National Plan for Access to Drinking-Water.MALICK ALHOUSSEINI
MINISTER OF ENERGY AND WATER (2016–2018), MALI
Benefits of WASH accounts in Senegal
Developing national WASH accounts in Senegal allowed us to critically reassess the financial needs identified in Sector Development Policy Letter 2016–2025, which is particularly important for achieving the SDGs. WASH accounts also highlighted both social and geographic equity issues and provided evidence to advocate for a better balance of investments in water and sanitation. Finally, WASH accounts made it possible to identify the strengths and weaknesses of our existing information system to effectively support the production of relevant data on water and sanitation.AMADOU DIALLO
COORDINATOR OF THE PROGRAMME PLANNING AND MONITORING UNIT, MINISTRY OF WATER AND SANITATION, SENEGAL
Improved availability and quality of WASH financial data in countries
One of the immediate benefits of TrackFin implementation in countries is the identification of gaps in WASH expenditure data, and steps taken to actively fill these gaps by improving data availability and quality. In Ghana, Mali and Senegal, the government ministry leading TrackFin has engaged with the National Bureau of Statistics to ensure that household surveys are better aligned with TrackFin data needs leading to higher quality data on household WASH expenditures. Ghana is in the process of setting up a WASH management information system to ensure better tracking of WASH access and expenditures. In Brazil, the existing national database for water was expanded to include sanitation and adapted to use TrackFin classifications to facilitate reporting and data access for WASH accounts. Annex 2 provides more information on the availability of data in TrackFin countries.

7Key results, lessons learned, and the way forward
Improved availability of WASH financial data in Ghana
Although there were challenges with regards to accessing financial data, especially in the first round, which was expected, access to financial data improved in the second round. We hope for even better experiences in subsequent rounds as more and more stakeholders are advocating for the process to continue.SUZZY ABAIDOO
TRACKFIN FOCAL PERSON, MINISTRY OF SANITATION AND WATER RESOURCES, GHANA
A better understanding of WASH financial data in Burkina Faso
The Ministry of Water and Sanitation took the opportunity of TrackFin to realize its own ambition to establish WASH accounts as a decision-making tool. The first exercise covering the period 2013–2015 was a great success. WASH accounts have enabled us to better understand and review the financial role of the various actors. It was also a great surprise for everyone to discover that users largely represent the main source of funding for the sector at 69.8%, particularly in covering the recurrent costs of services. The ministry has committed to financially contribute to the second cycle which will cover 2016–2019 within our own monitoring and evaluation system.OUSMANE OUEDRAOGO
DIRECTOR OF MONITORING, EVALUATION AND CAPITALIZATION, MINISTRY OF WATER AND SANITATION, BURKINA FASO
Improved communications and harmonized data from development partners
There are indications that working with development partners on compiling WASH accounts has strengthened communication and alignment with government data and processes around WASH finance. For example, in Mali, UNICEF modified its accounting system after the first cycle of TrackFin to facilitate reporting of financial data to the government and has, in the process, improved the availability and quality of disaggregated data. Additionally in Mali, several donors, including Germany, Belgium and European Union progressively increased communication of disaggregated financial data through the TrackFin process. In Madagascar, the United States Agency for International Development (USAID) requested both international and local NGOs implementing USAID programmes to report on WASH expenditures using the same disaggregations outlined in the TrackFin methodology. This facilitated compilation of WASH accounts in the first cycle and laid the foundation for further harmonization of reporting across stakeholders in subsequent cycles. In Kenya and Uganda, country NGO networks were able to collect financial data and activity reports from their members, which was very useful for NGO data collection.
Development partners working with government to improve WASH finance
IRC is committed to promoting TrackFin as a methodology to be used in all countries, and WASH accounts data have enhanced the results of IRC’s WASHCOST project. The first TrackFin cycle in Burkina Faso highlighted, among other things, the enormous challenges of funding the WASH SDGs because they require a tripling of investments. Because of TrackFin results, IRC initiated a technical assistance project with the government to develop and implement a strategic plan for funding the WASH SDGs. WASH accounts will be a tool to monitor progress and evaluate funding challenges.JUSTE HERMANN NANSI
IRC COUNTRY DIRECTOR, BURKINA FASO
Better coordination, communication and collaboration among WASH actors
For countries implementing TrackFin, compiling information and data to develop national WASH accounts has enhanced collaboration among actors – different ministries and levels of government, development partners, NGOs, utilities – and across the multiple sectors engaged in WASH activities. In Senegal, the National Agency of Statistics and Demography and the Ministry of Water and Sanitation developed a WASH specific household survey including questions on household expenditures, which, for the first time, was able to capture household expenditure on WASH investments, particularly on latrines. In Ghana, the WASH accounts team found that local government expenditures on sanitation included activities outside of the TrackFin classification definition. Close collaboration between ministries led the Ministry of Finance to adapt its accounting system to disaggregate among the different activities to better capture the expenditures.

8 Reflecting on TrackFin 2012–2020
Additionally, governments are using WASH accounts data to inform decision-making processes such as national reviews in Madagascar, Mali and Uganda. TrackFin data have also been used by countries in the preparation process for Sanitation and Water for All Sector Ministers’ Meetings and Finance Ministers’ Meetings.
Institutionalization of WASH accounts
Governments have understood the value of WASH accounts and many are now striving to institutionalize TrackFin in their country processes. They are establishing the foundation of clear institutional roles and responsibilities, committed staff and well-defined government leadership that are integral to TrackFin implementation. Country examples of progress towards institutionalization of WASH accounts include:
• In Senegal, the Ministry of Water and Sanitation established a technical committee comprised of government officials as well as representatives from donors and NGOs to facilitate the development of WASH accounts.
• In Burkina Faso, the government has allocated funds specifically for the development of WASH accounts.
Institutionalizing TrackFin in Mali
Data from the WASH accounts made it possible to present the real WASH finance situation to ministries and partners. Financial monitoring, which had not been done before TrackFin, is essential to understanding if adequate resources are being spent, if they correspond to planning and if they are allocated effectively. Mali is now in its third cycle of TrackFin and the government is working to make this process sustainable and that financial monitoring will be fully integrated into sector monitoring.MALICK ALHOUSSEINI
MINISTER OF ENERGY AND WATER (2016–2018), MALI
Mainstreaming TrackFin in sector monitoring in Ghana
Due to the importance of the TrackFin process to the ministry and stakeholders, Ghana is in the process of mainstreaming it into the sector information system, which is in its final stages of completion. TrackFin will, therefore, be the source of information of two national level indicators.SUZZY ABAIDOO
TRACKFIN FOCAL PERSON, MINISTRY OF SANITATION AND WATER RESOURCES, GHANA

9Key results, lessons learned, and the way forward
What challenges arose during TrackFin implementation?
While TrackFin has had successful outcomes, governments also encountered challenges implementing the TrackFin methodology. Creating the political will to implement and institutionalize WASH accounts often took longer than expected. Because of the slower rate of institutionalization, policy impacts that TrackFin contributes to have at times been slower than initially expected. However, WASH accounts do have the potential to lead to policy impacts, improved resource allocation for WASH and ultimately increased access to sustainable WASH services.
Data availability was also a challenge, especially when looking to compare WASH accounts data across countries. While most governments were able to collect data on drinking-water, sanitation and support services (core WASH expenditures) as well as other areas (such as hygiene and water resources management), the completeness of the data varies and not all country WASH accounts include data from all sources (funding units). For example, data on user investment on self-supply for sanitation were only available in Senegal. Because of the variations in the completeness of data, caution needs to be taken when looking to compare data across countries. See Annex 2 for more information on the data that were available for each completed cycle of TrackFin.
Reflecting on TrackFin in Kyrgyzstan
Work on WASH accounts was carried out for the first time in Kyrgyzstan in 2019. Although we faced some difficulties at the initial stage, we had a successful experience with TrackFin implementation. TrackFin application enabled us to have an overview of WASH sector finance, diagnose the shortcomings and identify a way forward. Creation of an interdepartmental working group was instrumental in coordinating the work and having access to data. It is important to strengthen WASH funding by creating and institutionalizing a WASH accounts mechanism based on lessons learned and ensure accountability and sustainability of WASH services in the country. We now understand the process and know what and how to do for the next cycle.BUBUJAN ARYKBAEVA
NATIONAL COORDINATOR FOR TRACKFIN IMPLEMENTATION, MINISTRY OF HEALTH, KYRGYZSTAN
Although the data presented in this paper are not always directly comparable across countries or cycles within a country, they do provide a snapshot into a country’s WASH financial flows for a specific period in time. These snapshots are valuable for governments, development partners and civil society to advocate for and make informed decisions on WASH. The data also show the potential of TrackFin and opportunities for governments and development partners to use data from WASH accounts, especially as work continues to institutionalize them, and have data be more consistent and comparable across countries and TrackFin cycles.

10 Reflecting on TrackFin 2012–2020
What can be learned from TrackFin data?
Implementing TrackFin has increased the availability and quality of WASH financial data. A number of analyses of financial flows and WASH sector expenditure can be done based on WASH accounts from countries in a variety of contexts and regions, and as TrackFin continues to improve there is the potential for more comparable analyses. A selection of these results, and related implications for government and WASH stakeholder consideration and action, are presented below. Note that not all countries were able to provide disaggregated data for all TrackFin classifications; therefore, comparisons between countries are not always possible.
Overall expenditure in the WASH sector
Knowing the total expenditure in the WASH sector is a crucial starting point as it provides context to all further analysis. If data on total expenditure are recorded over multiple years, countries can assess trends in sector expenditures over time. It also allows for comparison of the WASH sector with other sectors, such as health, and gives an indication of the extent to which WASH is prioritised relative to other sectors when considered within their specific country context.
Table 3 shows total and core WASH expenditure, core WASH expenditure per capita and as a percentage of gross domestic product (GDP), as well as health expenditure as a percentage of GDP for 10 countries for the most recent year of data available. Total WASH expenditure refers to all expenditures within the scope of TrackFin as defined by the country (see Annex 1 for more information) and is not strictly comparable across countries as different areas were included in the WASH accounts across countries. Therefore, “core” WASH expenditure, which consists of drinking-water supply, sanitation and support services, is included in the analysis since those areas are common to countries developing WASH accounts. While most countries in Table 3 do not have a large difference between total and core expenditures, Mali and Burkina Faso show large differences due to the inclusion of hygiene expenditures in their WASH accounts. Additionally, not all countries were able to collect data from all potential sources (for example NGOs) so expenditure numbers may be underreported and not directly comparable.
Country Financial Year
Total WASH expenditure (current US$
millions)
Corea WASH expenditure (current US$
millions)
Corea WASH expenditure per capita (current
US$)
Corea WASH expenditure as percentage of
GDP
Health expenditure as percentage of
GDPb
Brazil 2012 26 535 26 285 131.1 1.1% 7.7%
Mexico 2018 8 234 8 009 63.9 0.7% 5.5%
Morocco 2011 2 219 2 205 67.1 2.2% 5.7%
Ghana 2014 1 555 1 546 57.3 2.9% 4.1%
Tunisia 2015 671 642 57.0 1.5% 7.0%
Senegal 2016 353 333 21.6 1.8% 4.3%
Kenyac 2017 617 617 12.4 0.8% 4.8%
Burkina Faso 2015 273 179 9.9 1.7% 5.8%
Mali 2015 258 103 5.9 0.8% 4.1%
Madagascarc 2015 57 52 2.1 0.5% 5.7%
Table 3. Total and core WASH expenditure, core WASH expenditure per capita, and core WASH expenditure as a percentage of GDP
a “Core” WASH expenditure refers WASH expenditure on drinking-water supply, sanitation, and support services, the three areas that are common to countries developing WASH accounts.b Note: Health expenditures as a percentage of GDP is provided as a point of comparison.c TrackFin source data did not include complete data on household expenditures; therefore, WASH expenditure is likely to be underestimated.

11Key results, lessons learned, and the way forward
Per capita expenditure varies considerably between countries and tends to track closely with the overall income level of the country. WASH expenditure as a percentage of GDP is another useful way to compare countries. Unlike per capita expenditure, core WASH expenditure as a percentage of GDP does not necessarily correlate with the overall income level of the country, with low and lower-middle income countries such as Ghana (2.9%), Morocco (2.2%), and Senegal (1.8%) having a higher percentage of GDP for WASH expenditures compared to Brazil (1.1%), an upper-middle income country. Health expenditure as a percentage of GDP is also shown in Table 3 as a point of comparison, which can be useful as an indication of the priority given to the WASH sector relative to another sector in the country. Expenditure in the health sector is generally considerably higher than in the WASH sector, with health spending on average five times higher as a percentage of GDP compared to core WASH spending.
These results raise the following questions for policy-makers:
• Are current expenditures sufficient to meet national targets for WASH, and if not, what is the funding gap? • Are government finance strategies improving financial flows to the sector?• What is the trend in expenditures? Is it increasing or decreasing? • How does the level of expenditure compare to other countries?• How does the level of expenditure compare to other sectors (health, education)?
Distribution of government, donor, and user contributions to the WASH sector
A clear understanding of the sources of funding for the sector and their contributions is an important first step towards better planning and optimizing the impact of investments. For example, donor funding for WASH is often perceived to be a large share of overall WASH funding in a country; however, WASH accounts data show that in reality it is generally less than a third of overall funding to the sector. Similarly, the contribution of government funding to the sector is usually quite limited, with the largest proportion of WASH funding coming from users either in the form of tariffs to service providers or expenditure on self-supply.
Figure 3 shows examples of TrackFin results from Senegal (2016), Mali (2015), and Ghana (2012) that show the type of funding (for example tariffs, government funding, grants) for core WASH services (drinking-water supply, sanitation, and support services). Results are shown for core WASH expenditures rather than total WASH expenditures to maximize comparability across countries; however, the completeness of the data varies among the countries, so the percentages are not entirely comparable. Users (households and businesses/institutions) made the largest contribution to WASH sector funding, ranging from 45% in Ghana to and 70% in Senegal. User contributions can take the form of tariffs or expenditure on self-supply. There are large differences among countries in the proportions of these expenditures. In Ghana, 65% of total user expenditure was on self-supply, whereas it was only 4% in Senegal. Differences in these proportions can likely be explained by the different nature of services in each country. For example, in Senegal in 2016, 87% of the population with access to drinking-water had piped water, which means there is very little self-supply, whereas this percentage was 43% in Ghana in 2012.
Other significant contributors to the WASH sector include central/sub-national governments and bilateral/multilateral donors. Although both actors combined generally contribute to the majority of non-user expenditure (around 25%–50% of total expenditure), their individual contribution varies by country. In Senegal, government contributions were 18% of core WASH expenditures, whereas in Ghana it was only 7%.
Repayable financing is another funding type that can be used in the WASH sector. Repayable financing in TrackFin is slightly tricky because loans are generally considered a financing mechanism, but in the TrackFin classifications they are also a funding type (as seen in Figure 3). The analysis in Figure 3 shows repayable financing as a funding type because TrackFin accounts for money when it enters the WASH sector. Loans taken out will eventually have to be repaid, but those repayments will be considered as a financial cost when they are repaid. Currently loans captured in WASH accounts have been from donors and international financial institutions, rather than from commercial finance. In Ghana repayable financing accounted for 15% of funding while in Mali it was less than 1%.

12 Reflecting on TrackFin 2012–2020
Fig. 3. Funding types and funding units for core WASH expenditures (drinking-water supply, sanitation, and support services) for Ghana (2012), Mali (2015), and Senegal (2016)
Users
Nationalauthorities
Bilateral andmultilateral donors
NGOs
Tariffs (households)
Tariffs (others)
User expenditure on self-supply
Central and sub-national government funding
Bilateral and multilateral donor grants
Bilateral and multilateral donor repayable financing
Donations/grants from NGOs5%
1%
30%
16%
14%
5%
29%
5%
31%
48%
16%
MALI2015
(core expendituresUS$ 103 million)Bi
late
ral a
nd m
ultil
ater
al do
nors
National authorities
Users
NGOs
FUNDING UNIT FUNDING TYPE
1%
11%
70%
18%
1%
8%
3%
18%
3%
21%
46% Tariffs (households)
Tariffs (others)
User expenditure on self-supply
Central and sub-national government funding
Bilateral and multilateral donor grants
Bilateral and multilateral donor repayable financing
Donations/grants from NGOs
Users
Nationalauthorities
Bilateral andmultilateral donors
NGOs
SENEGAL2016
(core expendituresUS$ 333 million)
Nat
iona
l aut
horit
ies
Users
NGOsBilateral and
multilateraldonors FUNDING UNIT FUNDING TYPE
5%
15%
28%
7%
30%
6%
9% Tariffs (households)
Tariffs (others)
User expenditure on self-supply
Central and sub-national government funding
Bilateral and multilateral donor grants
Bilateral and multilateral donor repayable financing
Other donor financing
7%
48%
45%Users
National (5%) andlocal (2%) authorities
Bilateral andmultilateral donors
FUNDING UNIT FUNDING TYPE
Bila
tera
l and
mul
tilat
eral
do
nors
Users
GHANA2012
(core expendituresUS$ 948 million)
National and local authorities
These results raise the following questions for policy-makers:
• Does a large proportion of expenditure made by users on self-supply indicate they are self-supplying due to lack of, or inadequacy of, formal provided services?
• If it is government policy to encourage self-supply of water supply and sanitation services, is the government doing enough to optimize self-supply investments?
• Are out-of-pocket expenditures affordable for vulnerable populations?• What is the balance between government and external funding to the sector, can it be further optimized, and
is external funding playing a catalytic role?

13Key results, lessons learned, and the way forward
Distribution of WASH expenditures among services and geographic regions
Understanding how spending is distributed across WASH services, costs, and geographic regions can provide insight into what services and regions are being provided with more resources relative to others. Combined with a rational assessment of needs and priorities, this information can be used by governments to better target future spending. Figure 4 shows the per capita core WASH expenditure for urban and rural water supply and sanitation services and support services, which can include policy development, planning and programme administration. The countries shown are those which were able to disaggregate between urban and rural WASH, and results are shown for the most recent available year.
Fig. 4. Per capita core WASH expenditures by WASH service
80 —
60 —
40 —
20 —
0 —
Morocco (2011)
Ghana (2014)
Urban water supply Rural water supply Urban sanitation Rural sanitation Support services
Burkina Faso (2015)
Expe
nditu
re pe
r cap
ita (U
S$)
70 —
50 —
30 —
10 —
Senegal (2016)
Mali(2015)
Note: Expenditure per capita for support services in Ghana is US$ 0.05. Expenditure per capita for rural sanitation in Senegal is US$ 0.08. Expenditure per capita for rural sanitation in Mali is US$ 0.11.
Expenditure on water supply generally makes up the greatest proportion of WASH expenditure, most of which is on urban rather than rural services. Expenditure on sanitation is often lower than on water, which likely reflects a combination of lower expenditure as well as lack of data on user investment in sanitation.
In addition to disparities between urban and rural areas, there are often regional disparities in WASH spending within a country. Figure 5 shows regional distributions of per capita WASH expenditure for Senegal (2016) and Burkina Faso (2015). For both countries, the highest expenditures by far are in the region surrounding the capital city.
Fig. 5. Distribution of WASH expenditure per capita by region in Senegal (2016) and Burkina Faso (2015)
WASH expenditure per capita, 2016 (CFA per capita) 4918–6032 6033–9385 9386–13 664 13 665–22 487 22 488–37967
WASH expenditure per capita, 2015 (CFA per capita) 3404–3689 3690–4342 4343–6467 6468–7660 7661–20 930
Burkina FasoSenegal

14 Reflecting on TrackFin 2012–2020
In Senegal’s WASH accounts, expenditures were disaggregated between “large network” and “basic” systems (as defined in the TrackFin classifications1) for water supply and sanitation, making it possible to provide more detailed analyses on the different service types. For example, based on WHO/UNICEF Joint Monitoring Programme for Water Supply, Sanitation and Hygiene (JMP) estimates of population covered by different facility types (piped/non-piped for water supply, sewered/septic/latrines for sanitation), it is possible to calculate an approximate expenditure per capita for each service type as shown in Table 4. While the total spending on large water supply systems dwarfs the total amounts for other services, the expenditure per person covered (US$ 21) is not much higher than for basic water supply (US$ 16). The disparity is much larger for sanitation, with an expenditure of US$ 34 per person covered for large systems compared to US$ 3 for basic. Governments can look at this type of data over a longer timeframe and take into account the availability and state of infrastructure to support decision-making on resource allocation and cost-effectiveness of different service types.
Table 4. Approximate expenditure per capita by WASH service in Senegal (2016)
Water supply – large systems
Basic water supply
Sanitation – large systems
Basic sanitation
Expenditure (US$ millions) 300 25.1 43.4 31.2
Population covered (thousands)a 11 085 1 598 1 275 9 098
Approximate expenditure per person covered (US$) 20.8 15.7 34 3.4
a JMP 2017. Population covered is for 2016, the year of the Senegal TrackFin study.
Figure 6 shows expenditures for various WASH services by type of cost for Senegal in 2016. For large water supply services, approximately equal amounts were spent on capital investment (29%) and operations and maintenance (32%). For large networked sanitation systems, almost two thirds of expenditure was for capital investment (63%) while expenditure on operations and maintenance was 18%.
Fig. 6. Expenditures for WASH services by type of cost in Senegal (2016)
200 —
100 —
0 —
Water supply –large systems
Basic water supply
Capital investments Operations and maintenance Financial costs Support activities Taxes Other
Basic sanitation
Expe
nditu
re (U
S$ m
illion
s)
150 —
50 —
Sanitation –large systems
Other
250 —
It is possible to look in further detail and assess the types of funding being spent on different types of costs for specific services. For example, Figure 7 shows the breakdown by funding type for different types of costs for large water supply and sanitation systems in Senegal (2016). For water supply, it appears that the cost of operations and maintenance as well as other types of cost are largely covered through tariffs. The exception is for capital investment, where tariffs cover only a quarter of expenditure. Government funding provides 41% and repayable financing contributes another 27%, with the balance coming from external grants. For sanitation, the picture is
1 The TrackFin classification definitions are available online at: https://www.who.int/water_sanitation_health/publications/trackfin_guidance_document/en/

15Key results, lessons learned, and the way forward
quite different, where tariffs are sufficient to cover only one third of operations and maintenance expenditures, and government funding covers over half of the expenditure for all cost categories.
a “Donations and grants” and “bilateral/multilateral donor grants” are shown separately in the graph as they are separate classifications in the TrackFin methodology. While both are grants, the difference is in who is giving the grant (government/multilateral organization versus charitable foundation, individual).
Fig. 7. Breakdown by funding type for different types of costs for large water supply and sanitation systems in Senegal (2016)
80 —
60 —
40 —
20 —
0 —
Capi
tal
inve
stm
ents
Tariffs Central and sub-national government funding Bilateral/multilateral donor grantsa Donations and grants (NGOs and other)a Repayable financing
Expe
nditu
re (U
S$)
70 —
50 —
30 —
10 —
Oper
atio
ns an
d m
aint
enan
ce
Fina
ncia
l cos
ts
Supp
ort a
ctiv
ities
Taxe
s
Othe
r
Large water supply systems80 —
60 —
40 —
20 —
0 —
Capi
tal
inve
stm
ents
Expe
nditu
re (U
S$)
70 —
50 —
30 —
10 —
Oper
atio
ns an
d m
aint
enan
ce
Supp
ort a
ctiv
ities
Taxe
s
Large sanitation systems
These results raise the following questions for policy-makers:
• Is spending allocated to the WASH services that need it most?• Are regional disparities in line with the national policies and plans for WASH service provision? Is funding going
to regions that need it most?• Are expenditures on operations and maintenance sufficient to ensure sustainability of services, and are the
costs being covered through tariffs?• Are the funding sources for capital investment in line with national planning and could it be further optimized?• Which entities are using repayable financing?
Main service providers and their respective share of spending
The provision of WASH services is central to the WASH sector. Assessing who the main service providers are in the sector and their share of expenditure can provide insight into how resources are currently being directed. This information can be used to see if the allocations could be improved as well as where to focus capacity building efforts for service providers.

16 Reflecting on TrackFin 2012–2020
Figure 8 shows the share of expenditure for various types of WASH service providers by WASH service for Burkina Faso in 2015. Network corporate providers (both public and private utilities and associations) comprise the largest share of expenditure for water supply and sanitation services, followed by non-network corporate providers1 (small-scale independent providers).
a Note: The non-network corporate provider data for Burkina Faso includes expenditures from self-provided users in addition to non-network providers for water supply and sanitation services.
Fig. 8. Expenditure for different types of WASH services by WASH service providers in Burkina Faso (2015)
160 —
120 —
80 —
40 —
0 —
Water supply services
Sanitation services
Government agencies Network corporate providers Non-network corporate providersa NGOs and CBOs Self provided users
180 —
140 —
100 —
60 —
20 —
200 —
Support services
Hygiene services
Expe
nditu
re (U
S$ m
illion
s)
Figure 9 shows the breakdown of funding types (including tariffs, grants, loans and government funding) to WASH service providers in Burkina Faso in 2015. For corporate providers (utilities, associations and small private providers) providing both networked and non-networked2 services, tariffs are the main funding type. For corporate providers offering networked services, bilateral and multilateral donor grants are also a significant contributor at 26%. For the support services such as policy-making, planning and regulation carried out by government agencies, bilateral and multilateral donor grants are the main funding type, followed by funding from central and sub-national government. For NGOs and CBOs providing WASH services, bilateral/multilateral donor grants are the main funding type at 73%.
Fig. 9. Contribution of different funding types to WASH service providers in Burkina Faso (2015)
a “Donations and grants” and “bilateral/multilateral donor grants” are shown separately in the graph as they are separate classifications in the TrackFin methodology. While both are grants, the difference is in who is giving the grant (government/multilateral organization versus charitable foundation, individual).
Note: Donations and grants (NGOs and other) contributed US$ 0.16 million to government agencies and US$ 0.04 million to non-network corporate providers. Repayable financing contributed US$ 0.11 million to NGOs and CBOs. Central and sub-national government funding contributed US$ 0.05 million to NGOs and CBOs.
80 —
40 —
0 —
Government agencies
Network corporate providers
Tariffs Central and sub-national government funding Bilateral/multilateral donor grantsa Donations and grants (NGOs and other)a Repayable financing
Expe
nditu
re (U
S$ m
illion
s)
60 —
20 —
Non-network corporate providers
NGOs and CBOs
180—
160 —
120 —
140 —
100 —
1 Network corporate providers and non-network corporate providers are the terms used in the TrackFin classifications. They are used in the text to be consistent with the methodology.2 Non-networked services include provision of small-scale WASH goods (e.g. bottled or sachet water) or services. They usually involve low-skilled labor and a low level of initial investment.

17Key results, lessons learned, and the way forward
Disaggregating data by service provider can be challenging in practice, as funds may pass through several entities before reaching the service provider. If expenditure data are obtained from a donor, for example, for a project implementing sanitation services in a rural area of the country, the donor may have limited knowledge of the entities actually providing sanitation services on the ground. For example, in Mali, it has been challenging to obtain the data from NGOs as there are a large number active in the sector and no centralized data source on NGO WASH expenditure.
These results raise the following questions for policy-makers:
• What is the balance of expenditure among different service providers?• Are the service providers promoted by the government receiving enough funding?• How are donors aligning to government priorities regarding investments in specific types of providers?
Hygiene expenditures as a proportion of WASH spending
The COVID-19 pandemic has highlighted the importance of hygiene in safeguarding health. While TrackFin has included hygiene within its scope since the methodology was developed, in practice countries have experienced challenges in including hygiene expenditures in their TrackFin cycles. There is no consistent definition of hygiene across countries, and there may even be differing definitions of hygiene among stakeholders within the same country, making it difficult to collect comparable expenditure data on hygiene. For example, WHO defines hygiene as “the conditions and practices that help to maintain health and prevent the spread of diseases”. In the context of the SDGs, hygiene is focused on handwashing as indicated in the SDG indicator 6.2.1: Proportion of the population using safely managed sanitation services, including a handwashing facility with soap and water. Other frameworks may include some or all of the following aspects beyond handwashing, including personal hygiene, menstrual hygiene, domestic hygiene, food hygiene, and public hygiene including insect and pest control.
Data on hygiene expenditures are often difficult to separate from broader programme expenditures; for example, hygiene promotion may be embedded within broader health promotion programmes and budgets or may be combined with sanitation expenditures in Community-led Total Sanitation programmes.
For hygiene financial flows to be adequately tracked, the development, adoption, and mainstreaming of specific classifications for expenditures on hygiene products and services is required. Hygiene activities currently considered within the scope of TrackFin are as follows:
• Hygiene promotion programmes by government, donors, NGOs, and service providers, including handwashing campaigns, menstrual hygiene management and chlorine distribution.
• Personal and household-level hygiene activities related to water and sanitation. This includes handwashing, bathing, washing clothes and washing material/equipment (for example soap, and tippy taps).
There is an ongoing effort to refine the hygiene-related aspects of the TrackFin methodology based on consultations with governments and experts. With increased attention to hygiene programming, successful tracking of hygiene expenditures can be viewed as a marker of success or an indicator of progress in national programmes.
Only a few countries (Burkina Faso, Kyrgyzstan, Mali, Mexico, and Uganda) have included hygiene within the scope of WASH accounts thus far. Figure 10 shows the distribution of total WASH expenditure by WASH services including hygiene in Burkina Faso (2015), Mali (2015), and Kyrgyzstan (2017). In all three countries, hygiene expenditures comprised a large proportion of total WASH expenditure (over a third in Burkina Faso and over half in Mali and Kyrgyzstan), mostly in the form of household spending on hygiene activities and products.

18 Reflecting on TrackFin 2012–2020
80% —
60% —
40% —
20% —
0% —
Burkina Faso (2015)
Mali (2015)
Water supply Sanitation Support services Hygiene Other
90% —
70% —
50% —
30% —
10% —
100% —
Kyrgyzstan(2017)
Fig. 10. Distribution of total WASH expenditure by WASH service
Hygiene may make up such a large proportion of total WASH expenditure due to a broad definition of household hygiene spending, including expenditures that go beyond handwashing. For example, Kyrgyzstan defined it as funds that households spend on handwashing, the purchase of soap, washing powder and other detergents, the cost of washing clothes, and maintaining family and household hygiene. Additionally, the large proportion of WASH expenditure on hygiene could be due in part to data gaps in other WASH services. For example, Mali was not able to collect data on user self-supply for sanitation and Kyrgyzstan did not include data from NGOs or CBOs or on self-supply for drinking-water or sanitation, although strong efforts are made to progressively fill data gaps in subsequent WASH accounts cycles. Hygiene is an area in WASH accounts that continues to be further refined.
These results raise the following questions for policy-makers:
• How can better hygiene expenditure data be collected?• Are hygiene expenditures placing a burden on users?

19Key results, lessons learned, and the way forward
What are the essential elements for successful TrackFin implementation and institutionalization?
To continue to see results, and for governments to continue to use WASH accounts data, TrackFin needs to be implemented and institutionalized in country processes. While each country context is unique, WHO and national WASH accounts teams have identified the following elements as critical to successful TrackFin implementation. These same factors also contribute to the use of data by policy-makers, ongoing improvements in data and monitoring systems, and the institutionalization of WASH accounts.
National government ownership and strong stakeholder engagement
Compiling and sharing financial data requires time and effort and can be sensitive. Although TrackFin is a government-led process, advocacy about the value of TrackFin and how WASH accounts data will be used is still needed to promote engagement by the many government, non-government and private-sector stakeholders that will provide financial data and information. Participation by government agencies involved in WASH in identifying key policy questions that TrackFin will answer establishes ownership prior to implementation as well as commitment to using the data and results. The preliminary (and essential) advocacy step to firmly establish government ownership and engage stakeholders can take significant time depending on the country context, and thus needs to be considered when planning TrackFin timelines.
Capacity-building of national teams, with access to up-to-date tools and training materials
National and regional TrackFin training workshops have developed sound knowledge of the TrackFin process and classifications among national teams while also providing valuable opportunities for exchange of experience and expertise among implementing countries. TrackFin training has been complemented by ad hoc technical support by international consultants to ensure consistent application of the methodology in diverse country contexts, robust analysis and report writing and reliable and comparable TrackFin data. Experienced and knowledgeable national TrackFin teams are a critical foundation for the institutionalization of national WASH accounts and have proven to be effective advocates for integration of TrackFin into country processes.
An iterative and incremental approach to TrackFin implementation
The implementation of TrackFin is an iterative process whereby different stakeholders learn progressively about the methodology, the importance of the disaggregation of data and the analytical steps. As countries implement iterative cycles of TrackFin, the monitoring, availability and quality of WASH financial data consistently improves. With increasing interest in TrackFin and continued cycles, countries are applying the lessons learned from previous cycles to further improve data collection. Implementation of multiple cycles of TrackFin has demonstrated that even in countries where significant data and coordination gaps exist in the first cycle, these can be gradually filled in and resolved, resulting in more complete, better quality data as well as improved national monitoring and coordination mechanisms. This in turn generates the interest and support that leads to institutionalization.
Use of the WASH accounts production tool (WAPT) for developing WASH accounts and standardized outputs
Use of the WAPT by national teams enables more consistent application of the TrackFin methodology and streamlines the process of data compilation and analysis, saving considerable time and effort while improving data quality. The WAPT also facilitates mapping of expenditures to TrackFin classifications from one year to

20 Reflecting on TrackFin 2012–2020
the next, streamlining the TrackFin data processes in subsequent years. The WAPT facilitates WASH accounts reporting by producing standard outputs on key indicators and tables. The standard presentation of outputs in tables and graphs supports compilation of data and comparability over time and across countries.
Using the WAPT also facilitates more complex and comprehensive methods of data visualization. For example, Figure 11 shows how overall results of WASH accounts can be visualized using a Sankey diagram. This visual representation is a clear way to show the relationship between sources of funding and services.
Fig. 11. Financial flows between sources of funding and services in Senegal, in US$ millions (2016)

21Key results, lessons learned, and the way forward
What is the way forward for TrackFin?
Experience with TrackFin over the last eight years has confirmed the strengths of the current approach and highlighted opportunities for improvements that increase cost-effectiveness, promote sustainability and support expansion of WASH accounts to new countries.
Demand from countries for support for the standard production of WASH accounts using the TrackFin methodology is increasing, as seen by the growing number of requests from governments to produce WASH accounts. Governments are recognizing the value of WASH accounts for monitoring and supporting SDG 6 progress, and for informing decisions on funding allocations, policy development and planning.
To enable uptake and institutionalization of WASH accounts by all interested and committed countries, the approach to implementation and related technical support must evolve, based on experience and learning from the first years of implementation and growing collaboration with WASH sector partners on WASH accounts based on the TrackFin methodology.
Over the next two to three years, WHO plans to further develop TrackFin as a global public good1, supported by mechanisms for promoting consistent application of the TrackFin methodology and a robust set of tools and training materials. Delivering TrackFin as a global public good will promote the institutionalization of WASH accounts. The capacity of country teams will be enhanced through new materials leading to decreasing reliance on external technical support, thereby increasing country ownership.
To further develop TrackFin as a global public good, WHO will lead efforts on the following activities:
• Developing an implementation guide for TrackFin to provide accessible, easy-to-use information on the TrackFin process, classifications, the WAPT, using data for policy- and decision-making and institutionalization of WASH accounts.
• Developing a package of companion tools including updates of current TrackFin resource materials, reporting templates, a WAPT technical user manual, training slidesets and exercises, and standard WASH-specific household survey questions.
• Building capacity on and knowledge of the TrackFin methodology and use of the WAPT through regional workshops, training of TrackFin experts in partner organizations engaged in TrackFin and streamlined technical support to implementing countries.
• Continuing to engage WASH sector partners in supporting TrackFin implementation in countries that request technical assistance.
• Establishing a mechanism for regular technical reviews of WASH accounts data by TrackFin experts to verify consistent application of the TrackFin methodology, thus promoting reliable and comparable data across implementing countries.
• Enhancing the WAPT to include features that facilitate the generation of WASH accounts, standard outputs and WASH accounts highlights that promote use of WASH financial data for policy- and decision-making.
• Maintaining the TrackFin Community of Practice platform, where TrackFin implementors access information, share results and exchange solutions, ideas and expertise.
• Evolving the TrackFin methodology in collaboration with technical experts in response to issues highlighted during country implementation2.
• Establishing and maintaining a repository of WASH accounts/TrackFin results shared by countries, publicly accessible through the WHO website.
• Establishing TrackFin as a tool for cooperation and collaboration at country level as part of the SDG 6 Global Acceleration Framework3.
1 TrackFin as a global public good means multiple organizations, including governments and development partners, can use and benefit from the TrackFin methodology. Training materials, resources and the WAPT will be publicly available to any interested government or development partner. However, WHO will conduct technical reviews of WASH accounts to ensure that the methodology has been applied correctly, and that the WASH accounts and WASH accounts highlights produced are consistent and comparable and that data and WASH accounts highlights are publicly available through the WHO website.
2 Issues highlighted include (1) the need to improve the definition and boundaries of hygiene within the scope of TrackFin to encourage inclusion of hygiene, and (2) the need for clarifying the monitoring requirements of SDG 6.a to benefit from the opportunity presented by TrackFin to increase the alignment of development partner funding with national priorities, and improve data sharing between development partners and national governments towards meeting SDG Target 6.a.
3 The SDG 6 Global Acceleration Framework aims to deliver fast results at an increased scale. The UN system and its multi-stakeholder partners, driven by country demand and coordinating through UN-Water, will unify the international community’s support to countries for SDG 6. For more information see: https://www.unwater.org/publications/the-sdg-6-global-acceleration-framework/
22 Reflecting on TrackFin 2012–2020
Delivering the required high-quality outputs that result from these activities will rely greatly on active engagement by, and support from, governments and WASH sector partners to complement inputs by the GLAAS/TrackFin team at WHO. Having an increasing number of countries producing WASH accounts will contribute to the sector’s knowledge on WASH financing and funding leading to better targeted resources and more informed policy and programming decisions. This collaborative effort will help to achieve the long-term vision of sustainable and high-quality WASH financial data used in national policy and decision-making.

23Key results, lessons learned, and the way forward
Annex 1. The scope of TrackFin in countriesThe standard TrackFin services are drinking-water supply, sanitation, support services, water resources management1 and hygiene. The first three (drinking-water supply, sanitation, and support services) should generally be included in all TrackFin implementations and are referred to as core WASH areas. However, since TrackFin is a country-driven process, governments may decide to adjust the scope outside of these three services in consideration of the country context, needs and priorities. In particular, some countries have included additional WASH areas as summarized in Table A1.
1 Water resources management is included in TrackFin only to the extent that it relates to water supply and sanitation services. This may include management such as water resources protection or river basin development that may affect WASH services.
Table A1. Scope of TrackFin in countries
CountryCycle + year(s)(financial years included)
Core areas Additional areas
Drink
ing-w
ater
Sanit
ation
Supp
ort
serv
ices
Wat
er
reso
urce
s m
anag
emen
t
Hygie
ne
Solid
was
te
man
agem
ent
Stor
mwa
ter
man
agem
ent
WAS
H in
healt
h car
e fac
ilities
WAS
H in
schoo
ls
Wat
er fo
r pr
oduc
tion
ArgentinaCycle 1 – 2016/2017 (2013–2015) √ √ √ √
BrazilCycle 1 – 2014 (2010–2012) √ √ √ √
Burkina FasoCycle 1 – 2017 (2013–2015) √ √ √ √
GhanaCycle 1 – 2014 (2010–2012) √ √ √ √
GhanaCycle 2 – 2016 (2013–2014) √ √ √ √
India (Rajasthan & West Bengal)Cycle 1 – 2017 (2014–2017)
√ √
KenyaCycle 1 – 2017 (2015–2016) √ √ √
Kenya Cycle 2 – 2020 (2017) √ √ √
KyrgyzstanCycle 1 – 2019 (2017) √ √ √ √ √
MadagascarCycle 1 – 2018 (2013–2015) √ √ √
MadagascarCycle 2 – 2019 (2015–2017) √ √ √ √
MaliCycle 1 – 2016 (2012–2014) √ √ √ √
MaliCycle 2 – 2017 (2012–2015) √ √ √ √ √ √ √ √
MaliCycle 3 – 2020 (2016–2018) √ √ √ √ √ √ √ √
MexicoCycle 1 – 2019 (2018) √ √ √ √ √
MoroccoCycle 1 – 2014 (2009–2011) √ √ √ √
SenegalCycle 1 – 2018 (2014–2016) √ √ √ √ √
TunisiaCycle 1 – 2017 (2013–2015) √ √ √ √
UgandaCycle 1 – 2018 (2014–2017) √ √ √ √ √ √ √ √

24 Reflecting on TrackFin 2012–2020
Annex 2. Availability of data for developing WASH accounts Through TrackFin, countries have realized that the financial data required to develop WASH accounts are generally available, although often highly fragmented and challenging to consolidate. Where actual expenditure data are not available, countries have used estimates; for example, most countries estimate household expenditures based on household survey data. Countries that have implemented TrackFin are able to identify data gaps and incrementally improve monitoring systems to improve the quality and availability of data. In all countries, it has been possible to obtain relatively complete and detailed information on WASH-sector expenditures with clear recommendations on how to improve data for subsequent cycles. Table A2 presents the availability of data by funding type.
CountryCycle + year(s) (financial years included)
Funding type
Tariffs (users)
User expenditure on
self-supply
Central government
funding
Sub-national government
funding
Bilateral and multilateral
donor grants
Donations and grants (NGOs
and other)
Repayable financing
(loans)
ArgentinaCycle 1 – 2016/2017 (2013–2015)
BrazilCycle 1 – 2014 (2010–2012)
Burkina FasoCycle 1 – 2017 (2013–2015)
GhanaCycle 1 – 2014 (2010–2012)
GhanaCycle 2 – 2016 (2013–2014)
India (Rajasthan & West Bengal)Cycle 1 – 2017 (2014–2017)
KenyaCycle 1 – 2017 (2015–2016)
KenyaCycle 2 – 2020 (2017)
KyrgyzstanCycle 1 – 2019 (2017)
MadagascarCycle 1 – 2018 (2013–2015)
MaliCycle 1 – 2016 (2012–2014)
MaliCycle 2 – 2017 (2012–2015)
MaliCycle 3 – 2020 (2016–2018)
MexicoCycle 1 – 2019 (2018)
MoroccoCycle 1 – 2014 (2009–2011)
SenegalCycle 1 – 2018 (2014–2016)
TunisiaCycle 1 – 2017 (2013–2015)
UgandaCycle 1 – 2018 (2014–2017)
Data available Data partly available and estimated Estimated data No data
Table. A2. WASH financial data availability by funding type
Note: This chart provides an overview of aggregated data availability and does not show differences in urban and rural availability or by WASH area.

25Key results, lessons learned, and the way forward
Some additional information on trends in data availability across countries are as follows:
• Central government funding: Data on transfers from central governments to other levels of government are usually available. This is because national accounting systems are in place and are generally well managed.
• Tariffs: Tariff data are generally obtained from national utilities/large providers or from a national regulator, as was the case in Kenya, and availability of data is high overall for household and other tariffs. However, it is more difficult to obtain data from small providers, especially for small towns and rural areas. Household expenditure surveys are a reliable source to estimate household WASH expenditures on tariffs; comparison of tariff data from utilities and estimates from household surveys in Mali, Burkina Faso and Senegal shows good correspondence between the two. In Mali, household expenditure survey questions were revised in collaboration with the National Bureau of Statistics to obtain data disaggregated between solid and liquid waste for the second cycle of TrackFin, with a view to further disaggregate survey questions in future rounds to obtain even more granularity.
• User expenditure on self-supply: Estimates of recurring costs for household expenditure on self-supply can generally be obtained through household expenditure surveys. Data on household capital investments in WASH (including building latrines) are often not available, except through WASH-specific household surveys such as the SDG 6 baseline survey conducted in Senegal. Data on non-domestic user expenditure on self-supply is difficult to obtain for most countries.
• Bilateral and multilateral donor grants: Governments can generally provide partial data on bilateral/multilateral donor grants, but complete financial information is not always available. This is especially true when funds are not channelled through the national government or not closely coordinated with national institutions. As a result, there can be conflicts when comparing nationally available government data to sector-wide aid data from the Organisation for Economic Co-operation and Development (OECD) Creditor Reporting System.
• Donations and grants (NGOs and other): Data from NGOs are generally very difficult to collect and are often not available to national institutions.
• Repayable financing: Data on repayable financing in the form of loans from donors are generally available from government institutions and utilities. Commercial banks and financial institutions providing loans to the WASH sector is not yet common, particularly in low-income settings.
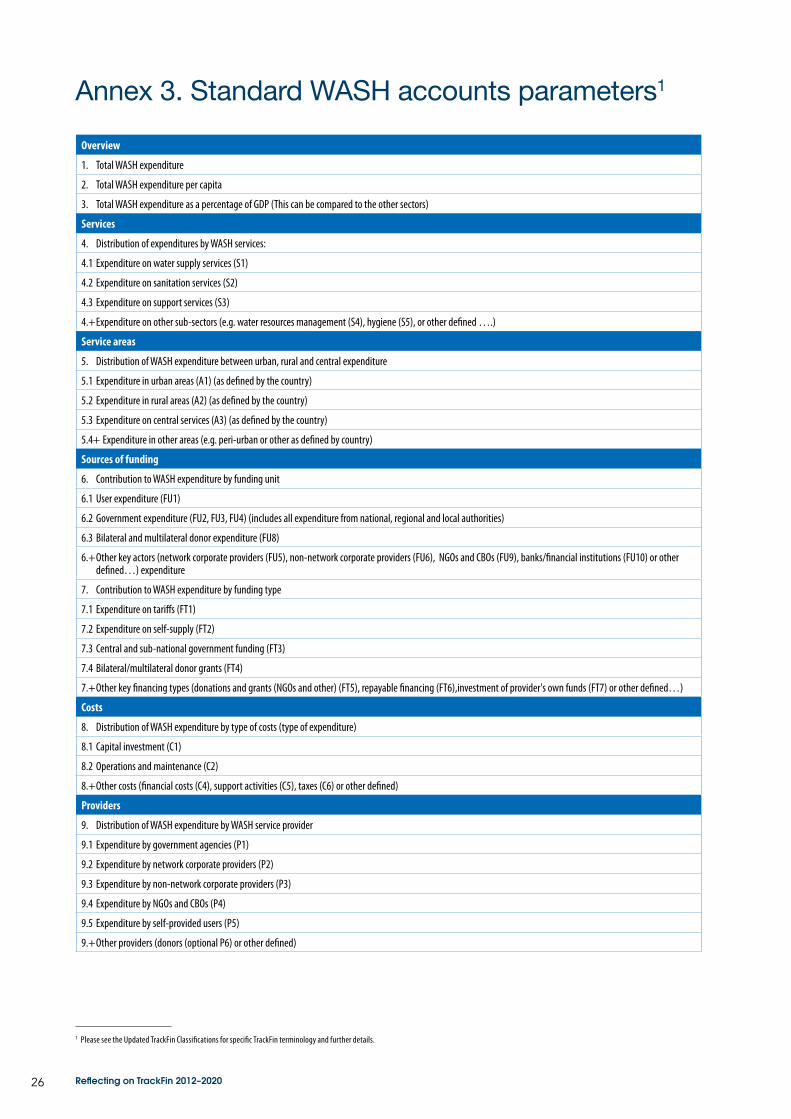
26 Reflecting on TrackFin 2012–2020
Annex 3. Standard WASH accounts parameters1
1 Please see the Updated TrackFin Classifications for specific TrackFin terminology and further details.
Overview
1. Total WASH expenditure
2. Total WASH expenditure per capita
3. Total WASH expenditure as a percentage of GDP (This can be compared to the other sectors)
Services
4. Distribution of expenditures by WASH services:
4.1 Expenditure on water supply services (S1)
4.2 Expenditure on sanitation services (S2)
4.3 Expenditure on support services (S3)
4.+ Expenditure on other sub-sectors (e.g. water resources management (S4), hygiene (S5), or other defined ….)
Service areas
5. Distribution of WASH expenditure between urban, rural and central expenditure
5.1 Expenditure in urban areas (A1) (as defined by the country)
5.2 Expenditure in rural areas (A2) (as defined by the country)
5.3 Expenditure on central services (A3) (as defined by the country)
5.4+ Expenditure in other areas (e.g. peri-urban or other as defined by country)
Sources of funding
6. Contribution to WASH expenditure by funding unit
6.1 User expenditure (FU1)
6.2 Government expenditure (FU2, FU3, FU4) (includes all expenditure from national, regional and local authorities)
6.3 Bilateral and multilateral donor expenditure (FU8)
6.+ Other key actors (network corporate providers (FU5), non-network corporate providers (FU6), NGOs and CBOs (FU9), banks/financial institutions (FU10) or other defined…) expenditure
7. Contribution to WASH expenditure by funding type
7.1 Expenditure on tariffs (FT1)
7.2 Expenditure on self-supply (FT2)
7.3 Central and sub-national government funding (FT3)
7.4 Bilateral/multilateral donor grants (FT4)
7.+ Other key financing types (donations and grants (NGOs and other) (FT5), repayable financing (FT6),investment of provider's own funds (FT7) or other defined…)
Costs
8. Distribution of WASH expenditure by type of costs (type of expenditure)
8.1 Capital investment (C1)
8.2 Operations and maintenance (C2)
8.+ Other costs (financial costs (C4), support activities (C5), taxes (C6) or other defined)
Providers
9. Distribution of WASH expenditure by WASH service provider
9.1 Expenditure by government agencies (P1)
9.2 Expenditure by network corporate providers (P2)
9.3 Expenditure by non-network corporate providers (P3)
9.4 Expenditure by NGOs and CBOs (P4)
9.5 Expenditure by self-provided users (P5)
9.+ Other providers (donors (optional P6) or other defined)

27Key results, lessons learned, and the way forward
Users
10. Distribution of WASH expenditure by WASH use
10.1 Expenditure for households (U1)
10.2 Expenditure for institutions, organizations, industries/businesses (U3), including for health care facilities (U3.3) and schools (U3.4)
10.3 Expenditure for general public interest (U5)
10.+ Other users as defined
Regions
11. Distribution of WASH expenditure by (country–defined) regions (R)

For more information:http://www.who.int/water_sanitation_health/glaas/trackfin/en/Contact: [email protected]
R E F L E C T I N G O N
TrackFin 2012–2020Key results, lessons learned, and the way forward