reducing the cost of the dairy program
TRANSCRIPT

Cdn. J. of Agric. Economics 34 (November 1986)
Reducing the Cost of the Dairy Program
Cameron Short*
The effects on farm incomes and consumer prices of elimination of the special export program and both an immediate and phased elimination of the direct subsidy with compensatory increases in support prices are ex- ami ned.
The supply of milk is assumed to be verticle at a level determined by the amount of quota which in turn is set so that butter supplies and de- mand balance at the support price. The analysis then is concentrated on the demand side which is represented by the demands for 13 categories of dairy products at the consumer level. The demands are represented in a linear programming model to simulate changing relative prices o f indi- vidual products caused by the changing support prices.
Dropping the special export program unambiguously leads to gains in Canadian welfare. Both an immediate and phased reduction of the direct subsidy requires either a large increase in consumer prices or decrease in farm income. All policy alternatives require a reduction of quota. Gradually eliminating the direct subsidy has the advantage that growth in demand due increases in population and per capita incomes will offset the reduction o f quota due to the policy.
L'article qui suit examine les consiquences, aux revenus agricoles et aux consommateurs d e I'blimination du programme special d'exportation ainsi qu'e d e l'blimination immediate et progressive de la subvention di- recte avec compensation sur les prix d'indemnitCs.
On suppose que I'offre du lait est verticale 'a un niveau ditermini lui est itabli de faFon 'a ce que I'offre et la demande'
est r;present;e par les demandes de I3 categories*de protuits laitiers ,au niveau du consom- mateur. Les demandes sont representees dans un modele de programmation
par le quota qui du beurre soient en iquilibre avec les subventions.
L'analyse, est donc*surtout du c$t; demande, et,
liniaire simulant Ie changement des prix relatifs des p par le changement des subventions.
* Department of Agricultural Economics, University of Br t o 1 umb i a
obui ts , causi
tish

L a i s s e r tomber l e programme s p 6 c i a l d ' e x p o r t a t i o n me'ne i v e n t u e l lement i une augmentation du bien-^etre des canadiens. De t o u t e faSon l ' 6 l i m i - n a t i o n immid ia te e t p r o g r e s s i v e de l a subven t ion d i r e c t e r e q u i s r e s o i t une augmentation du p r i x aux consommateurs ou une d i m i n u t i o n dans l e s revenus a g r i c o l e s . Toutes a l t e r n a t i v e s r e q u i k r e n t une r e d u c t i o n du quo- t a . L 'avantage de 1 ' 6 1 i m i n a t i o n p r o g r e s s i v e e s t que l a demande Cvoluant de l a c ro i ssance de l a p o p u l a t i o n e t des revenus per c a p i t a contreba- lance l a r g d u c t i o n des quotas.
Introduction Expend i tu re programs a t t h e f e d e r a l l e v e l have come under c l o s e sc ru -
t i n y i n r e c e n t years because o f t h e p ressu re t o reduce t h e d e f i c i t . The d i r e c t (or b u t t e r f a t ) subs idy i s t h e main expend i tu re i t e m i n t h e d a i r y program c o s t i n g taxpayers $287 m i l l i o n i n 1984. The major o b j e c t i v e o f t h i s paper i s t o e v a l u a t e p o l i c y o p t i o n s t o reduce t h i s c o s t . Increased e f f i c i e n c y i s a c o n s i d e r a t i o n i n e v a l u a t i n g p o l i c y o p t i o n s t o reduce ex- p e n d i t u r e . But e q u a l l y impor tant i n t h e case o f d a i r y programs a r e p o l - i c y g o a l s o f m a i n t a i n i n g farm incomes and s t a b l e consumer p r i c e s . The major concern o f t h i s paper i s t o q u a n t i f y e f f e c t s o f v a r i o u s approaches t o reduc ing t h e subsidy on farm incomes and t h e consumer p r i c e s . A sec- ondary o b j e c t i v e o f t h i s paper i s t o show how t h i s consequence can be used i n t h e c o n t e x t o f a l i n e a r programming model t o address a range o f p o l i c y issues from t h e demand s i d e .
The l a s t major a n a l y s i s o f Canadian d a i r y p o l i c y was by B a r i c h e l l o i n 1981. B a r i c h e l l o ' s approach i s s i m i l a r t o t h a t o f Gardner (1984) and Oahlgren (1980) f o r t he Un i ted States: t h e w e l f a r e c o s t s o f e x i s t i n g p o l i c y a r e evaluated f rom farm l e v e l supply and demand cu rves f o r m i l k . The approach i n t h i s paper i s more s i m i l a r t o Louwes, Boot and Wage (1964). A programming model i s used t o s i m u l a t e t h e a r b i t r a g e between f i n a l demands f o r d i f f e r e n t d a i r y products : farm l e v e l demand i s the re - f o r e i m p l i c i t as a d e r i v e d demand. I n c o n t r a s t t o B a r i c h e l l o and Gard- ner , t h e focus i s n o t on t h e s o c i a l c o s t s o f d a i r y p o l i c y but r a t h e r how t h e c o s t s o f d a i r y p o l i c y can be t r a n s f e r r e d away f rom taxpayers and t o farmers and consumers.
There a re a number o f p o l i c y i ns t rumen ts t h a t can be used t o i n f l u - ence and c o n t r o l t h e d a i r y sec to r . These p o l i c y i ns t rumen ts a r e a quo ta on p r o d u c t i o n a t t h e producer l e v e l , a subsidy on b u t t e r f a t d e l i v e r i e s , a v a r i a b l e system o f l e v i e s as p r o d u c t i o n nears t h e quota or exceeds t h e quota, and suppor t p r i c e s f o r b u t t e r , cheese and sk im m i l k powder a t t h e who lesa le l e v e l . There i s a l s o a ' s p e c i a l e x p o r t program' which was in- t roduced t o expand m i l k p r o d u c t i o n by t h e e x p o r t o f condensed and evapo- r a t e d m i l k products . A d e t a i l e d d e s c r i p t i o n o f these a r e found i n Stonehouse (1979) and B a r i c h e l l o (1981). Only a subset o f these can b e e f f e c t i v e l y used a t one t ime. T h i s i s because t h e p o l i c y i ns t rumen ts a r e in terdependent : quota l e v e l s s e t t o o r e s t r i c t i v e w i l l r e s u l t i n who lesa le p r i c e s above t h e suppor t p r i c e s f o r example.
The p r a c t i c e f o r seve ra l years has been t o use t h e suppor t p r i c e o f b u t t e r and skim m i l k powder as t h e main p o l i c y inst ruments. The suppor t

38 1
p r i c e o f cheese i s se t so ow as t o be i n e f f e c t i v e . Other p o l i c y instruments are adjusted t o harmonize w i t h these two support p r ices . The Canadian Dairy Commission es tab l i shes support p r i ces f o r b u t t e r and powder a t the wholesale l eve l and maintains those p r i ces through market operations. H i s t o r i c a l l y the support p r i c e s have been se t such t h a t the Net Target Base Pr i ce o f m i l k a l l ow ing f o r farm-wholesale margins i s f i x e d above marginal cost (Bar iche l lo 1981). The leve l o f in-quota pro- duc t ion i s known as Canadian Requirements when expressed i n h l o f stan- dard m i l k ( 3 . 6 kg o f b u t t e r f a t / h l ) and market shar ing quota when meas- ured i n terms o f kg o f b u t t e r f a t . ' The amount o f quota i s se t t o accommodate the support p r i ces such t h a t b u t t e r f a t suppl ies j u s t s a t i s f y demands. Lower l eve l s o f quota would make the support p r i ces i ne f fec - t i v e and r a i s e the wholesale p r i c e o f b u t t e r a t l eas t above the support p r i c e wh i l e higher l eve l s o f quota would g i ve r i s e t o b u t t e r surpluses tha t have t o be disposed abroad. Product ion i n excess o f quota i s noneconomic because o f p r o h i b i t i v e over-quota lev ies . In-quota levy ra tes are se t a t a leve l t o cover adve r t i s i ng and other l i k e a c t i v i t i e s o f the Canadian Dairy Commission p lus the cost o f d isposing o f surplus skim m i l k powder and evaporated products abroad.
This general p o l i c y framework i s assumed t o ho ld i n a l l p o l i c y op- t i o n s considered. Po l i cy opt ions considered invo lve increases i n sup- p o r t p r i ces so m i l k p r i ces remain above marginal cost . Production i s then adjusted t o the l eve l o f t a rge t p r i c e . Since the supply remains p e r f e c t l y i n e l a s t i c , most p o l i c y issues can then be analyzed la rge ly from the demand s ide w i t h reference t o the supply s ide made on ly t o de- termine the amount o r net income or ren ts accruing t o the r i g h t t o s e l l m i l k . (The except ion i s the d i s t r i b u t i o n a l issues among producers which are no t examined i n t h i s paper.)
The fo l l ow ing sec t ion contains a d e s c r i p t i o n o f some p o l i c y op t ions which a l low a reduc t ion i n the cos t o f the d i r e c t subsidy: two o f these op t ions are assumed t o be implemented i n 1985 w h i l e the t h i r d i s assumed t o be phased i n over 1985-88. A desc r ip t i on o f the a n a l y t i c a l model and data used fo l lows. The r e s u l t s f o r each p o l i c y op t i on are then present- ed i n t u r n w i t h a f i n a l sec t ion t o summarize conclusions.
Major Policy Alternatives The e f f e c t s o f three s p e c i f i c p o l i c y a l t e r n a t i v e s which e n t a i l a re -
duc t ion i n the amount o f the subsidy are examined:
1 . E l im ina t i on o f the special export program i n I985
2 . An immediate e l im ina t i on o f the b u t t e r f a t subsidy, compensatory increases i n support p r ices , and adjustment o f market shar ing and quota
When quota included a "sleeve" amount t o permit provinces some f l e x i - b i l i t y i n meeting quota, Canadian Requirements was de f ined as market shar ing quota ne t o f the sleeve. (See Stonehouse f o r a desc r ip t i on o f the "sleeve.")
382
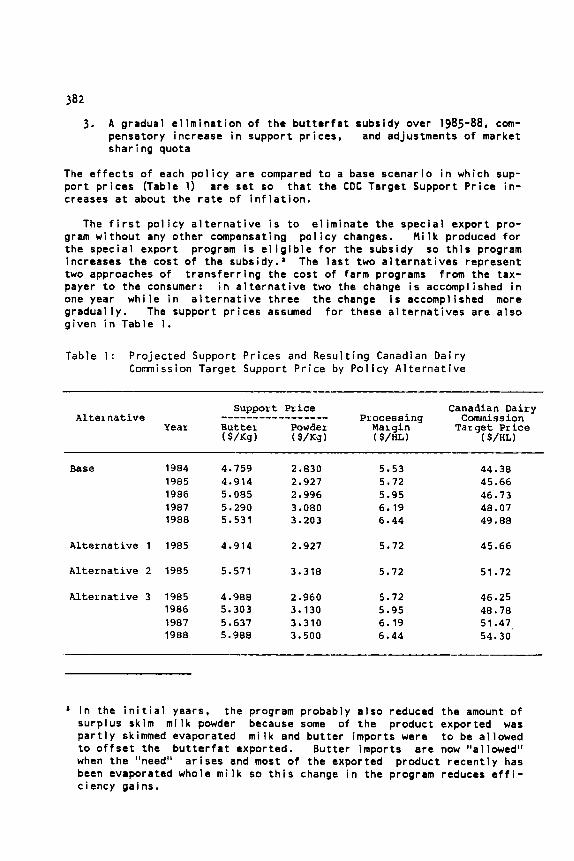
3 . A gradual e l i m i n a t i o n o f t h e b u t t e r f a t subs idy over 1985-88, com- pensatory increase i n suppor t p r i c e s , and adjustments o f market s h a r i n g quota
The e f f e c t s o f each p o l i c y a r e compared t o a base scenar io i n which sup- p o r t p r i c e s (Table 1) a r e s e t so t h a t the CDC Target Support P r i c e i n - creases a t about the r a t e o f i n f l a t i o n .
The f i r s t p o l i c y a l t e r n a t i v e i s t o e l i m i n a t e the s p e c i a l expor t pro- gram w i t h o u t any o ther compensating p o l i c y changes. M i l k produced f o r the s p e c i a l expor t program i s e l i g i b l e f o r t h e subsidy so t h i s program increases the cos t o f the subsidy. ' The l a s t two a l t e r n a t i v e s represent two approaches o f t r a n s f e r r i n g t h e cos t o f farm programs f rom the tax- payer t o t h e consumer: i n a l t e r n a t i v e two the change i s accomplished i n one year w h i l e i n a l t e r n a t i v e t h r e e t h e change i s accomplished more g r a d u a l l y . The suppor t p r i c e s assumed f o r these a l t e r n a t i v e s a r e a l s o g i v e n i n Tab le 1.
Table 1 : P ro jec ted Support P r i c e s and Resu l t ing Canadian D a i r y Commission Target Support P r i c e by P o l i c y A l t e r n a t i v e
Support P r i c e Canadian D a i r y P iocess ing Comniss i o n A l t e i n a t i v e -----------------
Year B u t t e i Powder M a i g i n Target P r i c e ( $/Kg 1 ( $/Kg 1 ($/HL) ($/HL)
Base 1984 4.759 2.830 5.53 44.38 1985 4.914 2.927 5.72 45.66 1986 5.085 2.996 5.95 46.73 1987 5.290 3.080 6.19 48.07 1988 5.531 3.203 6.44 49.88
A l t e r n a t i v e 1 1985 4.914 2.927 5.72 45.66
A l t e r n a t i v e 2 1985 5.571 3.318 5.72 51.72
A l t e r n a t i v e 3 1985 4.988 2.960 5.72 46.25 1986 5.303 3.130 5.95 48.78 1987 5.637 3.310 6.19 51.47 1988 5 * 988 3.500 6.44 54.30
' I n the i n i t i a l years, the program probably a l s o reduced t h e amount o f surp lus skim m i l k powder because some o f t h e produc t expor ted was p a r t l y skimmed evaporated m i l k and b u t t e r impor ts were t o be a l lowed t o o f f s e t the b u t t e r f a t expor ted. B u t t e r impor ts a r e now "al lowed" when t h e "need" a r i s e s and most o f the expor ted produc t r e c e n t l y has been evaporated whole m i l k so t h i s change i n the program reduces e f f i - c iency gains.
383 Ann lye i s
A two step above. The f resenting the (fluid milk, broad types o
process is used to simulate the policy process described rst step makes use of a linear programming (LP) model rep- transformation process of the three classes of farm milk industrial milk, and farm separated cream) into the 13 consumer products listed in Table 2 j
The LP model solves the demand functions allowing arbitrage between commodities for a given level of support prices, costs of transformation and amount of milk supplied at the farm gate. The second step is the selection of the level of Canadian Requirements which has zero net ex- ports of butter. Combining information from the model solution with Canadian Requirements makes it possible to calculate the amount of the butterfat subsidy, export losses, levy rate on industrial milk and farm income.
The objective of the LP model equates returns net of processing costs at the margin across commodities:
(1) f l a x - C + C p F + C C a D j j j k k j k j
where C is total farm-retail margins for the endogenous commodities, pj is the support price per unit for endogenous commodity j, Fj is net ex- ports (or surpluses) of endogenous commodity j, Dk. is the Duloy-Norton variable for demand level k for endogenous commodiiy j, is the area under the demand curve for demand level k for j. The endogenous commodities are nonexported evaporated and condensed products, ice cream, cheese, butter, skim milk powder and, for the 1984 solution only. standard fluid milk and lowfat fluid milk.
The objective simultaneously solves a number of supply and demand functions by maximizing the sum of the area under the demand curves mi- nus the area under the supply curves as suggested by Takayama and Judge (1971). The area under the demand curves, however, is found by intro- ducing the artificial variables Dkj as suggested by Duloy and Norton (1975). The area under the supply function is the processing costs and implicitly in the shadow price of milk. The action of the Canadian Dairy Commission in supporting the price of butter and skim milk powder is represented by competitive infinitely elastic demands at the support prices, (the net export variables), F , for those products in the objec- tive function. This means that all products sold on the domestic market must generate returns net of processing costs at least as great as the returns from butter and skim milk powder.
a Throughout the discuss identify the farm leve the processed commodit
on that follows classes of mi
es as indicated
the index i = l,2,3 is used to k and the index j - 1.2, .... 13 in this table.

W
m
Tab
le 2
: Mi
lk P
rodu
ctio
n an
d Ut
iliz
atio
n in 1984
-- t
--
Com
mod
ity
(mil
lio
ns)
(k
du
nit
)
Far
m
Com
mod
ity :
1.
Flu
id m
ilk
2.
F
ai-m
sep
ara
ted
cre
amb
3.
In-q
uo
ta
ind
. m
ilk
Pro
cess
ed C
omm
odit
y:
1.
Sta
nd
ard
flu
id m
ilk
2.
L
ow-f
at fl
uid
mil
k
3.
Cre
ams
4.
Co
tta
ge
c
he
ese
5.
Yo
gu
lt
5.
Oth
er
skim
mil
k p
rod
uc
ts
7.
Oth
er
who
le
mil
k p
iod
uct
s 8.
E
xp
ort
ed e
va
po
rate
d p
rod
uct
s
H1
26
.11
36.0
3.
70
8.72
H
1
1.82
2
-4
3.60
0
.66
9
HI.
45.5
6
1.5
3.
625
8.65
85
1 8
48
11
.2
0.03
60
0.08
50
1
1738
12
.5
0.01
96
0.08
70
1
11
2
6-5
0.
1572
0.
0510
1
39
0.4
0.02
83
0.59
45
1
49
0.6
0.03
6 0.
087
1
2 0
0.0
07
4
0 -9
65
0
1
12
0.7
0.1
52
0
- 397
1
8
1
2.9
0.09
78
0.23
8
9.
No
n-e
xp
ort
ed
ev
ap
ora
ted
&
con
den
sed
1
60
1.
6 0.
0705
0.
2280
10
. Ice
crea
m
1
31
0
6.8
0
.05
97
0.
0570
11
. C
hee
se
K9
20 2
24
.5
0.3
29
9
0.37
14
12.
Bu
tte
r Kg
107
32.2
0
.81
98
0
.12
64
13
. S
kim
mil
k p
owde
r Kg
4
5
0.1
0 - 00
74
0.
9650
a o
n a
b
utt
erf
at basis.
Eq
uiv
ale
nt
sta
nd
ard
mil
k o
n a
bu
tte
rfa
t b
asi
s.

385
Three classes o f m i l k a t the f a r m gate a re spec i f i ed i n the LP: and i n d u s t r i a l m i l k (M3) .
f l u - i d m i l k (HI) farm separated cream ( M z ) , The leve l o f f l u i d m i l k and farm separated cream i s f i x e d wh i l e the leve l o f i n d u s t r i a l m i l k i s se t a t a leve l s u f f i c i e n t l y high t o generate a sur- p lus o f b u t t e r a t the support p r ices . M i l k i s then converted i n t o i t s cons t i t uen t par ts , b u t t e r f a t and s o l i d s nonfat w i t h a se t o f cons t ra in t s t o assure supply equals demand f o r both cons t i t uen ts on both the f l u i d and i n d u s t r i a l market:
I n equations 2 and 3 the parameters mci are the amount o f b u t t e r f a t ( c - 1) and so l i ds nonfat ( c - 2) per u n i t f o r the m i l k i n c lass i, and q c j i s the amount i n processed commodity j. The v a r i a b l e Qj represents pro- duc t ion o f processed commodity j and T represents t rans fe r o f m i l k con- s t i t u e n t s from the f l u i d market t o the i n d u s t r i a l market--essent ia l ly the f a t skimoff .
There are two sets o f important c o e f f i c i e n t s f o r the product ion ac- t i v i t i e s . The f i r s t o f these i s the amount o f b u t t e r f a t and s o l i d non- f a t requ i red t o produce a u n i t of the product. These c o e f f i c i e n t s are a l so given i n Table 2. They were der ived from a number o f sources i n - c lud ing s t a t u t e requirements b y product, and composit ion o f the cor re - sponding products i n the Uni ted States (Lampert 1970, and United States Department o f Ag r i cu l tu re 1976). Product composit ion was spec i f i ed i n the more d e t a i l e d product c l a s s i f i c a t i o n given by S t a t i s t i c s Canada' and then aggregated i n t o the categor ies given i n Table 2. The c o e f f i c i e n t s f o r cheese and b u t t e r a l so include the b u t t e r f a t and s o l i d nonfat i n the associated biproducts. A v a l i d a t i o n i s provided by comparing t o t a l bu t - t e r f a t and s o l i d nonfat i n a l l products w i t h t h a t ava i l ab le i n the m i l k f o r a base year r e s u l t i n g i n the f i n a l se t o f c o e f f i c i e n t s i n Table 2.
A second se t o f c o e f f i c i e n t s are the u n i t processing costs. Farm gate t o wholesale margins f o r the conversion o f a u n i t o f m i l k i n t o bu t - t e r and skim m i l k powder are es tab l i shed by a nego t ia t i on process be- tween the Canadian Da i ry Commission and farm and manufacturing represen- ta t i ves . These costs are assumed t o increase as shown above i n Table 1 f o r 1985-88. To ca l cu la te u n i t processing cos ts f o r b u t t e r and skim m i l k powder the r u l e o f thumb tha t u n i t processing cos ts are i n a 30:70 r a t i o i s used. This r a t i o together w i t h the ana lys is o f standard m i l k and the b u t t e r and skim m i l k powder c o e f f i c i e n t s i n Table 2 a l lows the c a l c u l a t i o n o f the u n i t farm-wholesale margins f o r b u t t e r and skim m i l k powder o f $0.2171 and $0.5067 per k i logram respec t i ve l y f o r 1984 and corresponding values f o r other years. U n i t processing costs are
For some o f the more minor products i t was necessary t o make assump- t ions : "Other Skim M i l k Products" f o r example, has the same composi- t i o n as skim m i l k powder, A d e t a i l e d account o f the d e r i v a t i o n i s provided i n Short and Cote. The absolute l eve l o f c o e f f i c i e n t i s no t important t o r e s u l t s bu t r a t i o among c o e f f i c i e n t s along a row are.
386
s u b t r a c t e d f rom t h e suppor t p r i c e s f o r b u t t e r and sk im m i l k powder r e - s u l t i n a i n n e t farm r e t u r n s per u n i t o f b u t t e r and sk im m i l k powder which
(4)
where
a r e used i n t h e o b j e c t i v e f u n c t i o n o f t h e LP:
s u b j e c t t o
c' l j a r e t h e un i t farm-wholesale margins.
m 0
The o b j e c t i v e i n equat ions (4) maximizes t h e v a l u e o f b u t t e r and sk im i l k powder produced f rom a h e c t o l i t e r of s tandard m i l k . The s o l u t i o n f t h e LP a l s o i nc ludes t h e shadow p r i c e s o f b u t t e r f a t and s o l i d n o n f a t
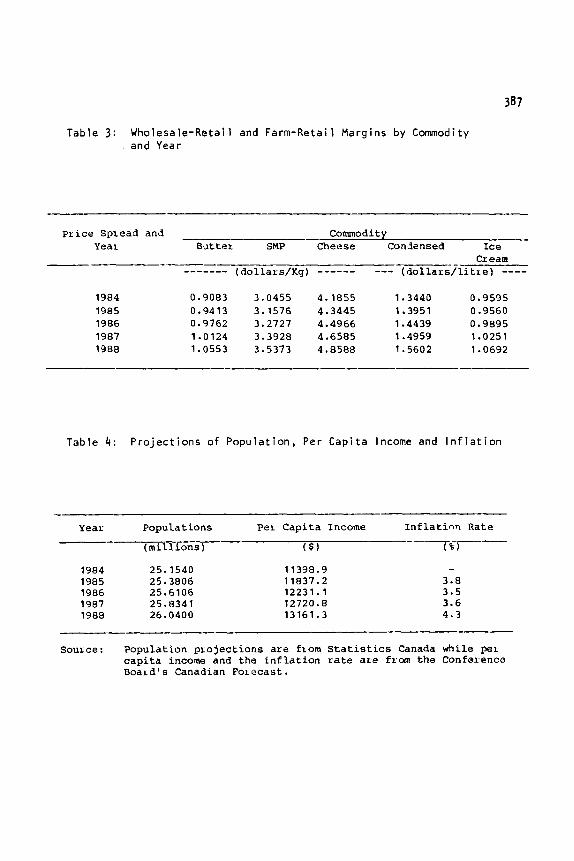
which when m u l t i p l i e d by t h e b u t t e r f a t and s o l i d n o n f a t c o e f f i c i e n t s f rom Tab le 2 g i v e the n e t farm v a l u e o f t h e endogenous commodities. S u b t r a c t i n g t h e n e t farm v a l u e from r e t a i l p r i c e g i v e s t h e farm r e t a i l spreads i n Table 3 f o r 1984. To p r o j e c t these r e s u l t s p a s t I984 i t i s assumed t h a t t he r e t a i l - w h o l e s a l e margins grow a t t h e assumed i n f l a t i o n r a t e (see Table 4) f o r b u t t e r and skim m i l k powder and t h a t t h e e n t i r e r e t a i l farm marg ins grow a t t h e i n f l a t i o n r a t e f o r t h e o t h e r commodi- t i e s .
The fa rm r e t a i l marg ins a r e then used as c o e f f i c i e n t s i n t h e LP model o f t h e s e c t o r i n an equa t ion used t o accumulate the marg ins and t r a n s f e r t h e sum t o t h e o b j e c t i v e f u n c t i o n :
c.Q. + C c j ' F j > 0 j
J J (5) c - C j112.13
where C j a r e u n i t farm r e t a i l marg ins and c j ' a r e w h o l e s a l e - r e t a i l mar- g ins . The w h o l e s a l e - r e t a i l marg ins a r e added back t o a d j u s t f o r b u t t e r and sk im m i l k powder su rp luses t h a t would need t o be expor ted.
The procedure o u t l i n e d above can be used independent ly o f t h e r a t i o i n which b u t t e r f a t and s o l i d n o n f a t a r e a v a i l a b l e , f o r any p a i r o f sup- p o r t p r i c e s where t h e r a t i o o f n e t farm v a l u e o f b u t t e r t o n e t farm v a l - ue o f sk im m i l k powder i s i n t h e range 0.1: l t o 110.8:l. Another way o f i l l u s t r a t i n g t h i s range i s t o n o t e t h a t w i t h a farm v a l u e o f $2.32 pe r kg f o r sk im m i l k powder, t h e fa rm v a l u e o f b u t t e r would have t o r i s e above $250/kg o r f a 1 1 below $O.23/kg b e f o r e t h e procedure i s i n v a l i d a t - ed .
The l a s t component o f t h e model a r e t h e demands. Two types o f demand c o n s t r a i n t s a r e s p e c i f i e d acco rd ing t o whether demands a r e exogenous o r endogenous i n t h e LP. The exogenous demands f o r 1984 a r e f o r t h e minor i n d u s t r i a l products ( co t tage cheese, yogur t , o the r skim m i l k products , o t h e r whole m i l k products , and expor ted evaporated products) and f o r creams on t h e f l u i d market.
(6) b j 6 - * e . f - F . + Q j > D J J - j
38 7
Table 3: Wholesale-Retail and Farm-Retail Margins by Commodity and Year
Commodity -
(dollars/Kg) ------ --- ( do 1 l a I s/li t L e -- - -
p i i c e Spiead and Yeai Butte1 SMP Cheese Condensed Ice
CI eam ------- 1984 0.9083 3.0455 4.1855 1.3440 0.9595 1985 0.9413 3.1576 4.3445 1.3951 0.9560 1986 0.9762 3.2727 4.4966 1.4439 0.9895 1987 1.0124 3.3928 4.6585 1 .4959 1.0251 1988 1.0553 3.5373 4.8588 1.5602 1.0692
---
Table 4: Projections o f Population, P e r Capita Income and Inflation
- Year Populations Per Capita Income I n f l a t i m Rate
--- --- ( $ 1 ( 0 )
-- (mi l l i ons )
1984 25.1540 1985 25.3806 1986 25.6106 1987 25.8341 1988 26.0400
11398.9 11837.2 12231.1 12720.8 13161.3
- 3.8 3.5 3.6 4.3
Souice: Population p io jec t ions are from S t a t i s t i c s Canada while pei cap i t a income and t h e i n f l a t ion rate d i e f x m the Conference Boaid's Canadian Foi ecas t .

wherc b j and e - and E a re f i x e d a t one. Beginning and ending inventor ies 'are equal i n a l l so lu t i ons reported here so t h a t a l l p o l i c y impacts w i l l be seen as surplus b u t t e r and powder. Net exports are f i x e d exogenously a t h i s t o r - i c a l leve ls . D j i s the exogenously determined leve l o f demand.
The q u a n t i t i e s demanded (DjS) f o r a l l these are assumed t o grow a t the r a t e o f growth o f popu la t ion except f o r exported evaporated products which vary by scenar io zero or 81 mhl. Solut ions f o r the years 1985-88 have exogenous demands f o r a l l f l u i d products SO the amount o f b u t t e r f a t skimoff w i l l not vary by year.
are beginning and ending inventor ies respec t ive ly and
The endogenous commodities i n the i n d u s t r i a l market a re nonexported evaporated and condensed products, i ce cream, cheese, b u t t e r and skim m i l k powder. These commodities account f o r 97.5 percent o f the bu t te r - f a t and 89.6 percent o f the s o l i d nonfat so ld on i n d u s t r i a l domestic markets i n 1984. P r i ce f l e x i b l e step demands (Djks) f o r the endogenous commodities are incorporated using the Duloy-Norton technique:
(7)
(8)
b . i - e.E - F . + Q - C dkj D k j > 0 J J ~j~
where dk ' i s the quan t i t y demanded f o r demand leve l k o f commodity j. Again, equal and n e t export l eve l except f o r b u t t e r and skim m i l k powder a re se t exogenously. A l l c o e f f i - c i en ts a re from l i nea r demand func t ions w i t h the e l a s t i c i t i e s given i n Table 5 and passing through the quan t i t i es given i n Table 2 f o r the 1984 average leve l o f p r ices . per cap i ta income and populat ion. Demands f o r 1985-86 a re s h i f t e d outwards f o r changes i n popu la t ion and per cap i ta incomes. A t rend va r iab le (1960 = 0 ) i s a l so included i n the standard m i l k demand funct ion.
deginning and ending inventor ies a re
Table 5: Character izat ion of Demand Equations
E l a s t i c i t y 1984 P r i c e
commodity Index" P i i c e Income Timetrend ~ - _ - _ - - ----
Standard Milk 123 .3 -0 .34 0 . 0 7 -0.74 Lowfat M i l k 123.3 - 0 . 3 3 0 .58 0.00 Ice Cream 118.5 -0 .18 0 . 3 8 0.00 Condensed Pioducts 128.8 -0 .39 0 . 1 3 0.00 Cheese 132.6 -0 .73 1 . 0 6 0.00 Butter 125.8 -0.80 0 . 2 2 0.00 Skim Milk Powder 125.7 -0 .39 0.00 0.00
a P r i c e h d e x with 1981 equal t o 100.
Source: Agr icu l ture Canada, P o l i c y Planning and Economics Branch. Farm: Food and A p i c u l t u r e Regional Model.

389
The second step i s t o determine the leve l o f p roduc t ion cons is ten t w i t h domestic demands selected by the LP and zero expor t o f b u t t e r and t o est imate levy ra tes , b u t t e r f a t subsidies and net farm income. Cana- d ian Requirements a re se t a t a l eve l o f zero exports o f b u t t e r by reduc- ing i n d u s t r i a l m i l k from the LP s o l u t i o n product ion by 0.23005 h l f o r every kg o f surplus b u t t e r ava i l ab le f o r export i n the LP. The amount o f s o l i d nonfa t ava i l ab le f o r manufacturing i n t o powder f o r expor t i s there fore lower so powder exports i s a l so reduced by 1.933 kg f o r every kg o f surp lus b u t t e r . These r a t i o s a re found by s o l v i n g (4) for Q13 and M3 f o r Q12 = -1. Canadian Requirements, CR, a re then ca l cu la ted by:
(9) Canadian Requirements = M2 + (M3 - .23005 F12) (mc3/3.6).
The r a t i o m,3/3.6 ad jus ts t o standard Note a l so t h a t the amount o f quota i s 3.6 times Canadian Requirements and the b u t t e r f a t subsidy i s 6.03 times Canadian Requirements.
m i l k on a b u t t e r f a t bas is .
Net revenues from d i s p o s i t i o n o f evaporated products, surp lus powder and b u t t e r on ex terna l markets a re assumed t o be $1.00 and $1.40/kg re - spec t i ve l y i n constant 1984 d o l l a r s over 1984-88. Losses per u n i t , f j s
t here fore are the support p r i ces minus these ne t revenues. To ta l cos t o f the program t o be o f f s e t by l ev ies i s then ca lcu la ted by:
The $47.04 m i l l i o n represents adve r t i s i ng and other s i m i l a r costs. The next two terms respec t i ve l y are losses on the export o f evaporated prod- uc ts and export o f powder a f t e r ad jus t i ng t h i s quan t i t y t o the amount tha t corresponds t o zero surplus b u t t e r . The levy r a t e f o r i n d u s t r i a l m i l k , L3, which j u s t covers t o t a l costs i s :
(11) L 3 = (TC - L , Mi) / (H3 - -23005 F12)
In equat ion (11) the levy r a t e on f l u i d i n d u s t r i a l m i l k i s determined by d i v i d i n g the t o t a l cos t o f the program net o f l ev ies from the f l u i d mar- ket , LIMl, (where L, i s 30 cents/hl) by amount o f f l u i d i n d u s t r i a l m i l k . There I S no levy on farm separated cream.
Farmers o f course pay the l ev ies and rece ive the b u t t e r f a t subsidy so these components o f t h e i r income are determined above. harke t re tu rns can be determined by m u l t i p l y i n g the shadow p r i ces o f b u t t e r f a t and sol- i d nonfat times the amount o f the cons t i tuents o f the product de l i ve red t o processors:
(12) MR = C C S c m c i M i
Gross farm income, GFI, from i n d u s t r i a l m i l k and farm separated cream i s market re tu rns p lus subsidies minus TC. Average farm leve l p roduc t ion costs per u n i t of m i l k i n aggregate must be less than the Net Target Base Pr i ce i n 1984 or the quotas would no t be met. Three values f o r these cos ts i n 1984 are used t o est imate ne t farm income: $30.00, $32.50. o r $35 .00 , per h l g i v i n g th ree d i f f e r e n t values f o r ne t farm i n - come :
i=2,3 c

390
(13)
The value f o r costs o f production, AC,, i s assumed t o increase w i t h i n - f l a t i o n bu t be reduced by techn ica l change a t a r a t e o f one percent per year f o r 1985-88.
Elimination of the Special Export Program
Pr ices and a v a i l a b i l i t y o f d a i r y products w i t h i n Canada i s n o t changed by e l im ina t i ng the special export program. Canadian consumption i s there fore the same as i t would be w i t h the program. The e f f e c t o f e l i m i n a t i o n i s on d a i r y farmers: the amount o f m i l k t o be produced i n 1985 i n standard u n i t s would dec l i ne from 48.00 mhl t o 45.47 mhl o r 5.3 percent. The impact on the farmer would be o f f s e t s l i g h t l y by growth i n domestic demand: comparing 1985 product ion w i thout the special export program w i t h 1984 product ion would see a dec l ine o f 4.1 percent. Gov- ernment expenditure i n the form o f the b u t t e r f a t subsidy would dec l i ne by some 15.24 m i l l i o n or 5.3 percent o f t o t a l payments i n 1985 compared t o payments w i t h the special export program.
NFI, = C F I - AC, CR s = 1 , 2 , 3
The e f f e c t o f the e l im ina t i on on farm income i s complex because o f changes i n levy rates, farm leve l product ion costs as we l l as market re - turns. The amount o f surplus powder farmers would have t o fund f o r ex- p o r t would ac tua l l y r i s e by a small amount: 96.92 mkg vs. 96.56 mkg. The special export program s t i l l tends t o reduce powder exports s l i g h t l y because the exported product has a s l i g h t l y lower b u t t e r f a t s o l i d nonfa t r a t i o than the i n d u s t r i a l m i l k used t o ma in ta in the program. The s l i g h t l y higher l eve l o f powder exported has t o be subsidized by a smaller amount o f product ion tending t o r a i s e levy ra tes bu t t h i s i s more than o f f s e t by the e l i m i n a t i o n o f losses on the exports o f con- densed products. Consequently i n 1985 the in-quota levy r a t e would be reduced 13.2 percent from the base scenario.
Gross farm income wi thout the program i n 1985 drops by 3 . 6 percent t o $1.770.46 m i l l i o n as shown i n Table 6. Net farm income, however, in - creases: the extent o f the increase depends on the cost o f producing m i l k . I f costs o f producing m i l k a re c lose t o the Net Target Base P r i c e then the gains i n net farm income from dropping the special export pro- gram are la rger : ne t farm income increases by $21.66 m i l l i o n or 11.1 percent. I f the cos t o f producing the m i l k i s lower then the b e n e f i t s from dropping the program are lower. I t i s a l so poss ib leB t o c a l c u l a t e the leve l o f costs o f product ion i n 1984 t h a t would make the ne t farm income w i thou t the program equal t o ne t farm income w i t h the program tak ing account o f changes i n gross farm income and Canadian
This i s done by so l v ing the fo l l ow ing equat ion f o r AC, average costs o f production:
1836.40 - (48.00/1 . O l ) A C * = 1770.46 - (45.47/1.01)AC+ where 48.00 and the two sce- nar ios, 1.01 i s f o r the assumed decrease i n costs i n r e a l terms f o r technical change, and the other numbers are the respec t ive gross farm incomes i n 1984 d o l l a r s .
45.47 are the Canadian Requirements f a r
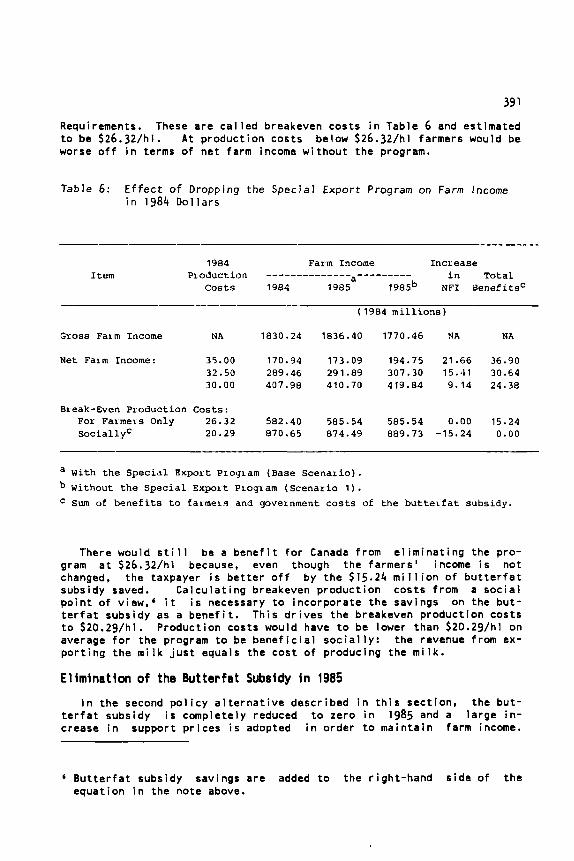
Requirements. These are c a l l e d breakeven costs i n Table 6 and estimated t o be $26.32/hi. A t product ion costs below $26.32/h1 farmers would be worse o f f i n terms o f ne t farm income w i thou t the program.
Table 6: E f f e c t o f Dropping the Special Export Program on Farm Income i n 1984 Do l la rs
Item
-__- (1984 m i l l i o n s )
Gross Faim Income NA 1830.24 1836.40 1770.46 NA NA
N e t Faim Income: 35.00 170.94 173.09 194.75 21.66 36.90 32.50 289.46 291.89 307.30 15.41 30.64 30.00 407.98 410.70 419.84 9.14 24.38
Break-Even Production C o s t s : For Farmeis Only 26.32 582.40 585.54 585.54 0.00 15.24 Soc ia l lyC 20.29 870.65 874.49 889.73 -15.24 0.00
a With the Spec ia l Expol-t Proyiam (Base Scenar io ) . Without the Spec ia l Expoit Piogiam (Scenario 1 ) .
Sum of b e n e f i t s to farmeis and government c o s t s of the b u t t e l f a t subsidy.
There would s t i l l be a b e n e f i t f o r Canada from e l i m i n a t i n g the pro- gram a t $26.32/hl because, even though the farmers' income i s no t changed, the taxpayer i s be t te r o f f by the $15.24 m i l l i o n o f b u t t e r f a t subsidy saved. Ca lcu la t ing breakeven produc t ion cos ts from a soc ia l p o i n t of view,' i t i s necessary t o incorpora te the savings on the bu t - t e r f a t subsidy as a b e n e f i t . This d r i ves the breakeven product ion cos ts t o $20.29/hl. Product ion costs would have t o be lower than $20.29/hl on average f o r the program t o be b e n e f i c i a l s o c i a l l y : the revenue from ex- p o r t i n g the m i l k j u s t equals the cos t o f producing the m i l k .
Elimination of the Butterfat Subsidy i n 1985 I n the second p o l i c y a l t e r n a t i v e descr ibed i n t h i s sect ion, the bu t -
t e r f a t subsidy i s completely reduced t o zero i n 1985 and a la rge in- crease i n support p r i ces i s adopted i n order t o ma in ta in farm income.
' B u t t e r f a t subsidy savings are added t o the r igh t -hand s ide o f the equat ion i n the note above.

392
Support p r i c e s a r e increased 13.4 pe rcen t over t h e base 1985 suppor t p r i c e s and 17 pe rcen t over t h e 1984 suppor t p r i c e s .
Suppor t p r i c e increases do n o t t r a n s l a t e i n t o r e t a i l p r i c e increases o f t he same magnitude because the marke t i ng margins, which r i s e a t t h e i n f l a t i o n r a t e , a r e a l s o a major component o f r e t a i l p r i c e s . I n terms o f 1984 p r i c e s , i c e cream would i nc rease by 8 percent , condensed prod- u c t s and sk im m i l k powder by 9 percent , cheese by 9 pe rcen t and b u t t e r , because of v e r y smal l marke t i ng margins, by n e a r l y 15 pe rcen t as shown i n Table 7. I n comparison w i t h t h e 1985 base these increases would be 4-11 percent .
Table 7: R e t a i l Level P r i c e s w i th E l i m i n a t i o n of t h e B u t t e r f a t Subsidy i n 1985 Compared w i t h Base
BASE ALTERNATIVE INDEXED OVER --------------- TWO 1984 1985 1984 1985
(cunrent dollars) (percent)
--------------
Cheese per KG 7.96 8.24 8.76 110.0 106.2 Condensed Products
Ice C r e a m per L 1.40 1.45 1.52 108.0 104.2 Butter per KG 5.45 5.63 6.25 114.7 111.0 Skim Milk Powder
per L 2.20 2.28 2.40 109.2 105.4
per KG
-
Consumpt t h e genera l c l i n e s a r e
5.37 5.56 5.88 109.4 105.6
---- -
on o f d a i r y products would t h e r e f o r e d e c l i n e , but because o f y smal l p r i c e e l a s t i c i t i e s by a sma l le r amount: t h e de-
pe rcen t f o r i c e cream, 2 pe rcen t f o r condensed p roduc ts and skim m i l k powder, 4.5 pe rcen t f o r cheese, and n e a r l y 9 p e r c e n t f o r b u t - t e r i n comparison w i t h t h e 1985 base. Consumption d e c l i n e s a r e s l i g h t l y sma l le r compared w i t h 1984 because o f growth i n demand due t o t h e exoge- nous v a r i a b l e s . However, t h e r e s u l t i s a r e d u c t i o n i n Canadian Require- ments by 3.14 mhl or 6.5 pe rcen t t o 44.86 mhl.'
The r e d u c t i o n i n demand and Canadian Requirements has a number o f consequences. Su rp lus sk im m i l k powder drops f rom 96.56 mkg t o 79.50 mkg reduc ing t o t a l c o s t s t o be covered by l e v i e s 14.5 pe rcen t . The l e v y
The i m p l i c i t farm l e v e l e l a s t i c i t y o f demand f o r i n d u s t r i a l m i l k i s -.47.

393
r a t e dec l ines by on ly 8.5 percent because cos ts are spread over a small- e r quan t i t y o f m i l k . I n constant d o l l a r terms the p r i c e farmers rece ive (market re tu rns minus l ev ies per h l ) i s near ly i den t i ca l t o t h a t i n the base (which a l so includes the subsidy) f o r 1985: $38.78 and $39.21 f o r a l t e r n a t i v e two and the base respec t ive ly .
To ta l market re tu rns then are much higher than those i n the cor re - sponding base bu t no t high enough t o completely o f f s e t the e l i m i n a t i o n o f the b u t t e r f a t subsidy because o f reduced Canadian Requirements. Gross farm income decl ines i n constant d o l l a r s from the 1984 l eve l by $136.61 m i l l i o n from the 1984 leve l o r 7.5 percent. Net farm income de- c l i n e s by around $32 m i l l i o n (1984 d o l l a r s ) f o r any average costs o f p roduc t ion i n the range $30.00 t o $35.00 per h l .
Net farm income could be maintained w i t h s t i l l greater boosts i n the support p r ices , but the increase i n consumer p r i ces i s already very high. Po l i cy makers would probably have t o a l low some dec l i ne i n ne t farm income t o implement a p o l i c y o f e l i m i n a t i o n of the b u t t e r f a t subsi- dy i n one year.
Gradual Ellmination of the Butterfat Subsidy, 1984-88
R e t a i l p r i ces and consumption f o r 1984-88 are given i n Table 8 f o r the t h i r d p o l i c y a l t e r n a t i v e . These p r i c e s are o f course increasing more qu ick l y than the i n f l a t i o n r a t e b u t no t as qu i ck l y as the support p r i c e s because the increase i n the r e t a i l p r i c e s are a weighted average o f the r a t e o f increase i n the farm p r i ces and i n the fa rm- re ta i l mar- gins. The p r i c e o f b u t t e r increases the most r a p i d l y i n cu r ren t d o l l a r s because i t has the smal lest market ing margin. Conversely, the p r i c e o f i c e cream increases a t the slowest r a t e so t h a t the p r i c e spread between these two increases the most i n r e l a t i v e terms.
Aggregate consumption o f b u t t e r decreases th ree percent between 1984 and 1988 desp i te increases i n popu la t ion and per cap i ta incomes. I n f a c t , consumption o f b u t t e r decreases by near ly s i x percent i n compari- son w i t h the base scenario. S l i g h t increases i n aggregate consumption are pro jec ted f o r the other commodities ranging from 1.0 t o 3.5 percent. The increases are due t o popu la t ion growth as per cap i ta consumption i s down f o r a l l products except i ce cream. Thus, the p r i c e e f f e c t o f the increased support p r i ces i n rea l terms i s stronger than the income e f - f e c t over the period. The exception, i c e cream. i s because o f the smal ler change i n p r i c e for i c e cream combined w i t h an income e l a s t i c i t y o f 0.38 as noted i n Table 8.
Canadian Requirements remain w i t h i n 1/2 percent o f the 1984 leve l throughout the adjustment per iod w i t h t h i s p o l i c y a l t e r n a t i v e . I n e f - f e c t increased aggregate demand due t o popu la t ion and income growth i s j u s t matched by decreased demand due t o p r i c e increases. A small de- c l i n e i n the amount o f powder exported a l s o resu l t s . This dec l i ne i s due t o the p r i c e induced s h i f t away from b u t t e r . Because o f h igher sup- p o r t p r ices , the losses per u n i t exported a re la rger so subs tan t i a l i n - creases i n the levy r a t e are needed: as much as 21.5 percent by 1988 i n constant d o l l a r s .

Table 8: R e t a i l Level P r i c e s and Consumption f o r I n d u s t r i a l M i l k Products w i t h Gradual E l i m i n a t i o n o f t h e B u t t e r f a t Subsidy
ITEM UNITS 1984 1995 1986 1997 1988 -- Retail P r i c e s i n Current D o l l a i s :
Cheese S/KG Condensed Products S / L Ice Cream S/L Butter S/KG Skim Milk Powdei S/KG
Index i n Constant 1984 D o l l a r s : Cheese 0 Condensed Products % I c e Cream 0 Butte1 0 Skim Milk Powder 0
Aggregate Consumption: Cheese mKG Condensed Products rnL Ice Cream mL Butter mKG Skim Milk Powder mKG
Index of Per Capita Consumption: Cheese 0 Condensed Products 0 I c e Cream % Butter % Skim Milk Powdei 0
7.96 8.30 8.66 9 - 0 8 9.55 2.20 2.29 2.39 2.50 2.63 1.40 1.46 1.52 1.59 1.67 5.45 5.70 6.04 6.41 6.79 5.37 5.60 5.86 6.14 6.45
100.0 100.5 101.3 102.5 103.4 100.0 100.4 101.1 102.2 102.9 100.0 100.3 101.0 101.9 102.5 100.0 100.9 103.3 105.6 107.3 100.0 100.4 101.6 102.7 103.4
200.99 203.01 204.02 204.02 204.02 60.00 60.60 61.20 61.20 61.80
310.00 313.10 316.20 317.75 320.85 107.53 107.53 106.46 105.39 104.32 45.22 45.22 45.67 45.67 45.67
100.0 100.1 99.7 98.8 98.1 100.0 100.1 100.2 99.3 99.5 100.0 100.1 100.2 99.8 100.0 100.0 99.1 97.2 95.4 93.7 100.0 99.1 97.2 98.3 97.6
Tu rn ing f i r s t t o t h e components of gross farm income (Table 9 ) . n o t e t h a t s i n c e p r i c e s a r e i n c r e a s i n g i n c u r r e n t d o l l a r s and p r o d u c t i o n i s cons tan t , market r e t u r n s i s i nc reas ing . The inc rease i n market r e t u r n s more than o f f s e t s t h e changes i n l e v i e s and t h e b u t t e r f a t subs idy i n nominal terms b u t i n cons tan t d o l l a r s , gross farm income d e c l i n e s b y more than 2 pe rcen t pe r year throughout t h e adjustment p e r i o d .

395
Table. 9: Gross Farm Income by Component f o r Alternative 3
ITEM 1984 1985 1986 1987 1988 - -
Farm Income Components i n M i l l i o n s of Cur-rent Dol la i s : B u t t e r f a t S u b s i d y 285.87 214.45 142.78 T o t a l Losses 223.92 236.66 246.96 Market Returns 1814.33 1916.08 2016.01 Gross Farm Income 1830.24 1846.07 1862.37
I n d i c e s of Mi l l ions of C o n s t a n t 1984 D o l l a r s : B u t t e r f a t S u b s i d y 100.0 72.3 46.5 T o t a l Losses 100.0 101.8 102.7 Nai k e t R e t u r n s 100.0 101.7 103.5 Gross Farm Income 100.0 97 .2 94.7
Farm Income i n M i l l i o n s of Constant 1984 Dollais: N e t Farm Income @ $35.00a 170.94 127.05 101.12 N e t Farm Income @ $32.50a 289.46 245.01 217.76 N e t Farm Income @ $30.00a 407.98 362.97 334.40
P e r c e n t of Base S c e n a r i o : N e t Farm Income @ $35.00a 100.0 58.0 50 .2 N e t Faim Income @ $32.50a 100.0 72 .5 67.9 N e t Farm Income @ $30.00a 100.0 79.5 76 .1
71.07 259.32
2 1 35-84 1896.35
22.3 104.0 105.8 93 .1
94 .21 209.18 324.47
44.5 63 .3 72.2
0 .00 271.89
2261.28 1935.94
0 . 0 104.6 107.4 91.1
79.63 193.05 306.47
36.7 57.6 67 .5
___- a Costs of p r o d u c t i o n a t t h e farm l eve l .
Costs of production of milk. however, are assumed to increase at the rate of inflation causing net farm income to decline in current dollars. The declines are smaller if a high cost of production such as $35.00/hl is assumed: net farm income in 1984 dollars declines $91 million but in relative terms by 53 percent. If a lower cost of production such as $3O.OO/hl is assumed then the decline o f net farm income is $102 million or more than 25 percent. Heasured against the base policy declines in net farm income would be still larger varying from 63.3 percent if costs of production are $35.00/hl to 33.5 percent with costs of production of $30.00/hl.
conc 1 usi on6
One purpose in preparing this paper is to document and demonstrate a technique for analyzing and evaluating Canadian dairy policy. The tech- nique depends on values selected for parameters such as demand elastici- ties, population projections and costs of production, but is appropriate for evaluation o f the effects of a wide range of policies on government expenditure, consumers, and on farmers as a whole. An important reser- vation, however, is that the distribution o f these effects on farmers in different regions, with different amounts of quota, efficiencies. and on consumers in different regions with different levels of income. are not dealt with.

396 Three approaches t o reduction of the cost of the butterfat subsidy
were evaluated. The elimination o f the special export program would have a favorable effect on farm incomes and reduce the butterfat subsidy marginally. Hilk production would need to be reduced but the Canadian economy would be improved by the elimination of products exported at a loss.
Dropping the butterfat subsidy in 1985 and increasing support prices by approximately 17 percent to maintain target returns was found to in- volve dairy price increases o f 6-15 percent at the consumer level but still result in substantial declines in farm income. Implementation of this policy gradually over 1985-88 does make the policy appear superfi- cially more attractive. This is because some of the effects would be masked by inflation and offset by growth and technical change.
[Received April 1985, Accepted March 19863
References
Agriculture Canada, Policy Planning and Economics Branch. FARM: Food - and Agriculture Regional w. Ottawa: Agriculture Canada. March 1980.
Barichello. Richard R . The Economics of Canadian U Industry Regulation. Technical Report No. E/12. Ottawa: Economic Council o f Canada. 198 1 .
Dahlgnon, Roger A. "Welfare Costs of Interregional Income Transfers Due to Regulation of Dairy Markets." American Journal of Aqricultur- - al Economics 62 (1980): 288-299.
Duloy, John H . , and Norton, Roger 0 . "Prices and Incomes in Linear Programming Models." American Journal of Agricultural Economics 57 (1 975) : 59 1-600.
Gardner, Bruce L. "Price Discrimination on Price Stabilization: Debating with Models of U. S. Dairy Policy." American Journal of &- ricultural Economics 66 (1984) : 763-768.
ing to., Inc. 1970. Lampert, Lincoln H. Modern U Products. New York: Chimcal Publish-
Louwes. 5 . J.; Boot, J. C. G.; and Wage, 5 . " A Quadratic-Programming Approach to the Problem of Optimal Use of Milk in the Netherlands." --- Journal o f Farm Economics 45 (1964): 309-317.
62-010. Ottawa: Statistics Canada November 1981. Statistics Canada. "Consumer Prices and Price Indexes." Catalogue
Statistics Canada. "The Dairy Review." Catalogue 23-001, Ottawa: Statistics Canada Monthly, December 1980 - January 1985.

397
Stonehouse, D . Peter. "Government Policies for the Canadian Dairy Industry." Canadian Farm Economics 14 (February-April 1979): 1 - 1 1 .
Takayama, T., and Judge, G. G. "Spatial and Temporal Price and Allocation Models." Amsterdam: North-Holland Publishing Company. 1971 *
U. S. Department of Agriculture, Agriculture Research Service. "Composition o f Foods." Agriculture Handbook No. 8-1. Washington, 0 . C.: USDA, ARS, November 1976.