reducing food waste and losses in the fresh dairy supply chain
TRANSCRIPT

November 4th, 2016
White paper
Reducing food waste and losses in the fresh dairy supply chain
Chr. Hansen impact study
Authors:
Thomas Westergaard-Kabelmann and Mette Dalgliesh Olsen
Table of contents
Preface 1
Executive summary 2
1 Introduction and research objectives 6
2 Background and context 8
3 Scope and methodology 11
4 Cost-benefit analysis yoghurt
waste reduction 16
5 List of references 40
Appendix A: Expert review 43
1
Preface
As a supplier to the food, health and agricultural sectors, Chr. Hansen (CH), a leading global pro-
ducer of cultures and enzymes to the dairy industry, is working closely with its customers and part-
ners to meet the needs of a growing population for safe, affordable and nutritious products from
farm to fork. With the world’s largest commercial collection of bacteria, numbering more than
20,000 strains, the medium-sized Danish company, despite its modest size, has a significant global
impact and reach. Every day millions of people are in contact with CH’s ingredients in daily prod-
ucts such as yoghurt, cheese, meat and wine.
In support of CH’s business strategy, Nature’s No. 1, through which the company aims to enable
the wider adoption of natural ingredients and bioscience solutions to address important global chal-
lenges within food, health and agriculture1, CH’s management sees an untapped potential in devel-
oping a deeper understanding of how beneficial microbial solutions can create value in a broader
societal sense. Or put differently, what is the societal value of applying natural and beneficial mi-
crobes to food, feed, health and agricultural supply chains beyond their immediate functional bene-
fits (e.g. improved flavour or texture, improved efficiency etc.)?
As the company’s stakeholders are growing increasingly concerned with global challenges such as
resource scarcity, climate change and rising global health costs, CH has a unique opportunity to
leverage the societal impact potential of its microbial technology platform to convey how the com-
pany is addressing important sustainable development challenges. This, however, requires docu-
mented and scientifically robust facts on how, and to what extent, beneficial microbes are adding
value, not just in meeting the company’s sales targets, but also in fulfilling the wider needs of cus-
tomers, consumers and society at large.
For this purpose, CH has engaged QBIS to assess the socio-economic net costs and benefits of one
of its strategic product areas; the development and application of bioprotection solutions to main-
tain and extend the shelf life of perishable foods. With this first impact study, we therefore set out
to further the understanding of how beneficial microbial solutions can address the growing global
challenge of food waste and losses (FWL), which was recently identified by the UN as one of the
world’s most pressing sustainable development priorities leading up to 20302. We hope that the
study will contribute to CH’s own internal understanding of the impact potential of the company’s
microbial technology platform. Likewise, we hope it will provide as a useful example of the value of
scientifically robust and fact-based arguments in the communications and engagement with key
stakeholders on global sustainability issues in agriculture, food and health.
1 Chr. Hansen’s Corporate Social Responsibility report, 2014/15 2 Reduction of Food Wastage and Losses (FWL) have been identified as a key priority in the UN Sustainable
Development Goals launched in September of 2015: “By 2030, halve per capita global food waste at the retail
and consumer levels and reduce food losses along production and supply chains, including post-harvest losses”
(source: UN Sustainable Development Goal, goal 12)

2
Executive summary
In EU-28, more than 29 million tons of dairy products go to waste every year with the majority
of this waste happening downstream in private households, followed by retailers and dairy
manufacturers3. Not only does this pose a significant loss from an economic and nutritional per-
spective, it also comes at an environmental cost as dairy products such as cheese, butter and
yoghurt have a relatively high intensity of greenhouse gas emission (per unit weight).4
One of the main challenges in keeping dairy products fresh throughout the supply chain is contami-
nation of yeast and mould, which are naturally present everywhere and quickly lead to untimely
spoilage. To help address this challenge, CH has introduced a collection of bacterial strains called
FreshQ® intended for the use in fermented milk products such as yoghurt, that make it possible to
extend the shelf life by a minimum of seven days5.
For yoghurt, such extension of shelf life has the potential for reducing waste across all the value
chain. Dairy manufacturers may use some of the extra shelf life to increase the size of their pro-
duction batches (and decrease their frequency) which in turn reduces their production waste. In-
creased shelf life may help retailers sell more of a particular yoghurt delivery before it expires and
in turn reduce wastage levels, while consumers will get more time to consume the yoghurt prior to
its expiration and in turn allow less yoghurt go to waste.
It is this effect of FreshQ® - the ability to extend product shelf life - that is the focus of this study.
As a starting point, the results show that there is a significant potential for reducing yoghurt waste
by extending shelf life. Building on existing literature as well as collection of primary data, the
study assesses that FreshQ® has a waste reduction potential corresponding to around 15% of total
production across dairy manufacturers, retailers and household consumers. The potential is defined
as the amount of yoghurt production that is wasted and that FreshQ® has the potential to influ-
ence, i.e. thrown away for reasons influenced by shelf life.
However, potentials for reducing food waste will only be realised if the stakeholders within the
value chain have an incentive to engage in the process of food waste reduction6. Changes in the
supply chain to prevent food waste can lead to some producers being worse off such that they are
likely to disengage from food waste reduction initiatives, and this is precisely the problem in rela-
tion to reduction of yoghurt waste.
Bioprotection solutions such as FreshQ® are readily available to dairy manufacturers and their
shelf life extending effects well-documented. Nevertheless, bioprotection solutions are not used to
their full potential. This is mainly due to the (somewhat justified) perception by dairy manufactur-
ers and retailers that European consumers will not readily accept longer shelf lives in their fresh
dairy products. Similarly, if shelf life of fresh dairy products in the EU is extended and household
3 Global Food Waste: The Numbers Behind the Problem. FAO. http://www.fao.org/save-food/resources/infographic/en/ 4 Clune, S. et. al. (2016) 5 From Chr. Hansen experience based on hundreds of lab trials, more than three hundred customer field trials and extensive
customer feedback, we consider seven days a conservative average estimate when considering a yoghurt product produced
by an average European dairy and sold in aver-age European cold chain conditions. 6 Rutten, M. (2013).

3
consumers’ waste are reduced, dairy producers and retailers will, all else being equal, sell less, un-
less consumers start consuming (or paying) more. As a result, dairy manufacturers and, to some
extent, retailers in the EU currently do not have strong economic incentives to experiment with
shelf life enhancing food technologies such as FreshQ®.
If the waste reduction potential illustrated in this study is to be fully realized, there is therefore a
need to carefully consider how each of the main actors in the value chain – from dairy manufactur-
ers to retailers and consumers - can maximize their individual gains. Consequently, the net impacts
of applying FreshQ® for each of these stakeholders have been assessed by considering cost sav-
ings from waste reduction, costs of applying FreshQ®, saved household income due to less waste
and lost profit due to less consumer waste.
The results indicate that all actors (dairy manufacturer, retailers and household consumers) actu-
ally can get positive net savings from reducing yoghurt waste and thereby have a financial incen-
tive to engage in waste reduction, if either:
- Allocation of FreshQ®’s extra shelf life days favours the retailers. More specifically, if five
extra shelf life days are used by retailers and just one extra shelf life day is allocated to
household consumers.7
- Around 10% of the retailers’ waste reduction savings are reallocated to the dairy manufac-
turers by means of existing product return agreements or by means of a benefit sharing-
scheme between dairy manufacturers and retailers.
Under these circumstances, it is assessed that FreshQ® can reduce waste of yoghurt up to around
4% of total yoghurt production. In the EU-28, this corresponds to around 356,000 tons of yoghurt
not being wasted each year out of a total production of nearly 9 million tons or around 430,000
tons CO2 emissions. In terms of net savings to dairy manufacturers, retailer and household con-
sumers, it corresponds to around EUR 180 million. It is however important to emphasise that these
findings are indications of the potential of reducing waste rather than hard facts given the uncer-
tainty associated with the assessments.
Creating such financial incentives requires a maximum of between one and three extra shelf life
days to the household consumers. As this is a relatively modest extension of shelf life and since
there is significant variation in available shelf life days when consumers are buying yoghurt8, it is
likely that many consumers will not even discover these one to three days and consequently, con-
tractions in demand due to consumers’ preferences for freshness might be prevented.
This assertion is supported by the findings of a mini-survey conducted among Danish consumers in
connection with the study indicating that half of the respondents would consider buying yoghurt
with a longer shelf life, if it enabled them to reduce waste. Thus, for half of the respondents, pref-
erence for freshness is trumped by the ability to reduce food waste. Also, the mini-survey indicated
that most respondents have a preference for the yoghurt with the longest remaining shelf life when
7 Dairy manufacturers use all seven days to prolong the shelf life of their yoghurt, but only uses one of these seven days in the
dairy. 8 In the UK, average available life in the shops is 13.7 days, but the minimum shelf life is zero and the maximum is 27. Lee, P.,
Osborn, S., & Whitehead, P. (2015), p. 16.
4
they purchase yoghurt, which also support the assertion that modest extension of shelf life will not
necessarily conflict with consumers’ preference for freshness.
This study shows that if such consumer statements turn out to be true for consumers in general
and if at least three or more shelf life days are allocated to the retailers, lost profit from contraction
in consumer demand as well as the costs of using FreshQ® are more than offset by savings relat-
ing to reductions in waste for dairy manufacturers and retailers. Thus, the results indicate that it is
possible for all stakeholders of the yoghurt value chain to benefit from reducing their yoghurt
waste.
The results also indicate that creating incentive for all of the stakeholders does not necessarily
mean less waste reduction for society as a whole. If all of the available shelf life days provided by
FreshQ® are used by the consumers and zero days are used by the retailers, it does not create ad-
ditional benefits to society in term of more waste reduction compared to a situation, where all the
available shelf life days are used by the retailers. In other words, the study estimates that the po-
tential for reducing waste at retailers are as big as it is at the consumers in this situation.
Food waste and its causes for all of the value-chain’s stakeholders have, to the best of our
knowledge, not previously been studied in a comprehensive analysis aiming to determine incen-
tives. This study is a first attempt to do just that. First of all, it demonstrates that such studies are
difficult to carry out for several reasons (probably also explaining their absence). First, lack of data,
studies and reports, necessitates data from primary sources. Second, part of the needed data is
business sensitive requiring networking efforts to obtain and use it. Third, assessing how each
stakeholders’ waste will respond to waste-reduction initiatives requires behavioural knowledge of-
ten difficult to obtain without conducting (expensive) field research. Fourth, the lack of data neces-
sitates assumptions about waste patterns being similar across different countries causing uncer-
tainty, even though cross-referencing of waste data in different EU countries has shown compara-
bility within a reasonable range.
Notwithstanding these challenges, such complete or near-complete value chain studies are neces-
sary and further efforts should be a priority in the future. In her 2013 study on what economic the-
ory tell us about the impact of reducing food losses and waste, Rutten emphasises how trade-offs
occur on the demand side, where a reallocation of spending on previously wasted foods causes
some producers to be worse off and some to be better off. As this might prevent food waste reduc-
tion initiatives from materialising, Rutten calls for analysis of the entire value chain in order to pro-
vide insight on how to facilitate and incentivise food waste reduction efforts.9
This study has tried to accommodate Rutten’s call and it more than anything indicates that it is
possible to create a market driven incentive for reducing food waste for all the stakeholders of the
yoghurt value chain. This is a good starting point. But how will a process of extending shelf life with
FreshQ® get started? Who should take the first step? Basically, it narrows down to either the politi-
cians and legislation or the stakeholders of the yoghurt value chain, i.e. the dairy manufacturers,
retailers and household consumers.
Recognising that yoghurt waste are reduced with longer shelf life, politicians could decide to create
incentives for producing yoghurt with longer shelf life in order to reduce food waste. In France,
newly imposed legislation makes it illegal for retailers throw away unsold food, which primarily is
9 Rutten, M. (2013).
5
expected to enable charity organisations to give out more free meals to people in need. However,
to the best of our knowledge, no legislation in EU-28 target reduction of food waste. Considering
that the results of this study indicate that benefits from food waste reduction can accommodate all
stakeholders in a value chain avoiding passing on the costs to a single stakeholder, such initiatives
need not be a burden on tax payers.
Another possibility is that yoghurt with longer shelf life becomes more in demand than regular yo-
ghurt and this way incentivise the stakeholders of the yoghurt value chain to take the first step.
Longer shelf life will enable retailers to reduce their waste and in turn save costs. This can poten-
tially increase demand as well even prices for yoghurt encouraging dairy manufacturers to focus on
yoghurt with longer shelf life. Similarly, longer shelf life could be considered superior to regular yo-
ghurt by consumers since it enables them to reduce food waste, which is likely to be considered an
attractive feature for the for the increasingly eco-conscious consumers. However, as demonstrated
in the study, empirical evidence is weak as well as contrasting when it comes to consumers’ reac-
tion to bioprotection as a mean to prolong shelf life as well as prolonged shelf life itself. It could
therefore be helpful for the food waste agenda, if further research could provide more insight into
consumers’ behaviour, notably the tension between food freshness and food waste.

6
Chapter 1
1 Introduction and research objectives
As the concern over global food security continues to grow, the topic of FWL has become top of
mind for global policy makers, industry and civil society alike. Each year, 1.3 billion tonnes of food,
about a third of all that is produced, is wasted10. If global food waste and losses were reduced by
just 25%, there would be enough food to feed the more than 800 million people who currently suf-
fer from hunger and malnutrition11. Further, wasted food also inflicts a host of negative environ-
mental impacts, including unnecessary greenhouse gas emissions and inefficient use of water and
land. If food waste was a country, it would rank as the third highest national emitter of greenhouse
gasses after USA and China.12
In response hereto, there has been a growing amount of literature in recent years which demon-
strates the significant economic, social and environmental costs of global food waste and losses as
well as the cost of waste to the various stakeholders in the food supply chain, including individual
households, retailers, food manufacturers and agricultural producers13.
In one of the first major attempts to quantify the size and causes of global FWL, FAO (2011)
pointed to three sector-specific intervention areas which account for the largest share of global
waste. One of these intervention areas is the need to reduce food wastage in the consumption
of meat and fresh dairy products in developed countries14.
Looking at the fresh dairy sector in EU alone, every year more than 29 million tons of dairy
products go to waste with the majority of this waste happening downstream in private house-
holds, followed by retailers and dairy manufacturers15. Not only does this pose a significant loss
from an economic and nutritional perspective, it also comes at an environmental cost as dairy
products such as cheese, butter and yoghurt are relatively high contributors to greenhouse gas
emissions16.
One of the main challenges in keeping dairy products fresh throughout the supply chain is contami-
nation of yeast and mould, which are naturally present everywhere and quickly lead to untimely
spoilage. To help address this challenge, CH has invested extensive R&D resources in identifying
new strains of beneficial cultures to keep dairy products fresh for longer periods of time, thereby
allowing dairy manufacturers to extend the shelf life of their products.
10 Gustavsson, J. et al (2011) 11 Global Food Waste: The Numbers Behind the Problem. FAO. http://www.fao.org/save-food/resources/infographic/en/ 12 http://insinkerator.co.uk/uk/page/global-food-waste-stats 13 See e.g. Gustavsson, J. et al (2011), Quested, T. et al. (2013), Okawa, K. (2015), Lee, P. et al (2015), Rut
ten, M. and Verma, M. (2015), Rutten, M. (2013), Foster, C. et al (2006), Chapagain and James (2011), Buzby,
J. et al (2014), Vanham, D. et al (2015), Monier et al. (2010) etc. 14 FAO highlighted three commodity specific intervention areas of the global food supply chain which account for the largest
share of global FWL. These are: reduced food waste from cereal consumption in North America, Europe and North Africa;
reduced food waste in consumption of meat and dairy products in developed countries; and reduced food losses from crop
production in developing countries (ibid) 15 Global Food Waste: The Numbers Behind the Problem. FAO. 16 Clune, S. et. al. (2016)
7
While these so-called bioprotection cultures can be applied to a broad number of perishable food
categories, including meat and fish, CH’s biggest application area so far is within the fresh dairy
sector and, more specifically, fermented milk products such as yoghurt.
While there are naturally many other ways to keep food fresh and prevent food waste and losses
along the value chain - e.g. improved packaging technologies, optimal cooling facilities, heat treat-
ment technologies or improved inventory and logistics planning tools – existing studies of such
technology interventions rarely consider the socio-economic and environmental costs and benefits
of implementation (i.e. societal relevance and costs), nor the underlying incentives which may, or
may not, lead to their adoption17 (i.e. practical feasibility).
In this study we set out to investigate the waste reduction potential of a specific food technology
intervention – bioprotection – in the fresh dairy sector. Building on existing literature as well as col-
lection of primary data, we map the quantities and causes of waste for a specific fresh dairy value
chain (yoghurt) and assess the net socio-economic impacts of applying bioprotective cultures to
extend product shelf life. Finally, recognizing that adoption of new technologies with food waste re-
duction potential will only happen if actors within the value chain are incentivized to do so18, we
consider various scenarios that may help strengthen the case for implementation.
Ultimately, the study hopes to contribute to the current debate on food waste reduction interven-
tions and initiatives and, particularly, the importance of economic incentives in the food supply
chain. Similarly, the study hopes to inspire CH’s management with new knowledge and facts on the
wider impact potential which can be achieved with the further adoption of bioprotection solutions in
perishable foods.
17 See e.g. Rutten, M. (2013) 18 Ibid
8
Chapter 2
2 Background and context
2.1 Introduction to Chr. Hansen (CH)
CH is a global bioscience company that develops natural solutions for the food, nutritional, pharma-
ceutical and agricultural industries. The company owns of one of the world’s largest commercial
collections of bacteria, numbering more than 20,000 strains, and develops and produces microbial
solutions for a wide variety of foods, confectionery, beverages, dietary supplements as well as ani-
mal feed and plant protection.
In 2012/13, CH launched its new business strategy, Nature’s No. 1, through which the company
aims to enable the wider adoption of natural ingredients and bioscience solutions to address im-
portant global challenges within food, health and agriculture19. As the company’s stakeholders are
growing increasingly concerned with global challenges such as resource scarcity, climate change
and rising global health costs, CH’s management sees an opportunity in developing a better under-
standing of how its products can create value in a broader societal sense, i.e. beyond functional
benefits (e.g. improved flavour, texture, etc.). It is to this end that the current study was commis-
sioned.
2.2 Characteristics of bioprotection and FreshQ®
While CH develops microbial solutions for a wide variety of food groups, this study focuses specifi-
cally on the application of bioprotection cultures which are developed by CH to prevent spoilage in
perishable food. For the purpose of this study, we define bioprotection solutions as ‘the application
of lactic acid bacteria (LAB) to a given food product in order to control the flora without signifi-
cantly altering the sensory properties of the product’. Depending on the food category in question,
bioprotection solutions generally have two main functions: 1) improving quality by delaying growth
of spoilage bacteria and 2) increasing safety by inhibiting and reducing growth of pathogens20.
Even though adoption rates of bioprotection cultures are still relatively modest when looking across
most food groups21, the technology has gained increased attention in markets such as the EU in re-
cent years. With growing trends towards natural and minimally processed foods, stricter food in-
gredient regulations22 as well as consumer scepticism against the use of chemical preservatives, bi-
oprotection cultures offer a potentially attractive solution to food producers who wish to keep their
products fresh without the use of conventional preservatives. This is especially the case within the
19 Chr. Hansen Communication on Progress report, 2014/15 20 The latter is especially the case for meat and fish products. Source: http://www.cmc-cvc.com/sites/default/files/files/En-
hansingSafety.pdf 21 Peter Thoysen, Marketing Director, dairy bioprotection, food cultures & enzymes bioprotection at Chr. Hansen. 22 As an example, the use of artificial preservatives in product groups such as yoghurt is banned by law in the
EU, making bioprotection solutions the only viable alternative for dairy manufacturers who are looking to food
ingredient providers for technologies that can help prevent untimely spoilage and/or extend the shelf life of
their products. Source: Chr. Hansen internal interviews.

9
fresh dairy segment which is characterized by shorter shelf life and a high risk (and cost) of spoil-
age throughout the supply chain.
To assist dairy manufacturers in maintaining and possibly extending the shelf life of fresh dairy
products, CH has introduced a collection of bacterial strains called FreshQ® intended for the use in
fermented milk products such as yoghurt.
“Many of our customers have a strong focus on reducing waste, both for economic but also
for environmental reasons. With FreshQ®, we have found a way to help our customers re-
duce the risk of spoilage and product recalls, enabling an extension of shelf life and deliver-
ing a fresher, higher-quality product to consumers. And they can do so without making use
of chemical preservatives.”
- Peter Thoeysen, Global Marketing Manager, Chr. Hansen
One of the primary shelf life limiting factors of a product like yoghurt is the natural spoilage with
yeast and mould. Spoilage gradually changes the product’s appearance and sensory profile and will
at a certain level make the product unattractive and inconsumable. CH’s FreshQ® cultures can
however inhibit the growth of yeast and mould in yoghurt and other fermented milks which may
benefit CH’s dairy customers in several ways.
Firstly, for dairies in markets like the EU where conventional preservatives in yoghurt are prohib-
ited, FreshQ® allows for better microbial control in the production and distribution of yoghurt by
countering the effects of contaminants which may enter during processing or in the cold chain. In
that sense, FreshQ® acts as an added “insurance” for dairies, protecting them against expensive
product recalls from larger retailers.
In extension of these characteristics, FreshQ® also offers the added and important benefit of al-
lowing dairy manufacturers to extend the shelf life of their yoghurt with minimum seven days23. As
we shall elaborate later in this paper, this benefit can be realized in different parts of the value
chain. Dairies may for instance use some of the extra shelf life to optimize their internal processes
and logistics by allowing themselves to use more time internally thereby enabling a reduction of
changeovers, running larger production batches and improving picking, handling and shipping pro-
cesses. Increased shelf life may likewise help retailers sell more yoghurt and reduce scrap levels
while consumers will get more time to consume the yoghurt prior to disposing of it. It is this effect
of FreshQ® - i.e. the ability to extend product shelf life - that preoccupies the remaining sections
of this paper.
2.3 The link between extended shelf life and FWL reduction
Extending shelf life of fresh dairy products – or any food group for that matter – is not just a com-
mercial matter; it is also a socio-economic and environmental matter. In the UK alone, approxi-
mately 80% of the yoghurt that goes to waste in private households is due to the yoghurt not be-
ing “used in time”, stressing the direct correlation between food waste and shelf life24. Similarly,
23 From Chr. Hansen experience based on hundreds of lab trials, more than three hundred customer field trials and extensive
customer feedback, we consider seven days a conservative average estimate when considering a yoghurt product produced
by an average European dairy and sold in average European cold chain conditions. 24 WRAP in the UK has studied this correlation intensely, see e.g. Quested, T. (2013) and Lee, P., Osborn, S., &
10
product expiration is a key cause of waste for retailers, especially in perishable food categories
such as fresh dairy, meats, fruits and vegetables25.
While there is limited data available on the correlation between shelf life and food waste and
losses, the UK-based NGO, WRAP, has studied this relationship both at the household level26 and
for the grocery supply chain27. Among other things, this research suggests that at a consumer level
– for milk – a small increase in shelf life could lead to considerable reductions in waste, cf. chapter
4.
As such, innovative technologies that can extend shelf life of perishable foods while, at the same
time, meet the commercial interests of key players in the food supply chain are important contribu-
tions to the global efforts to reduce FWL by 50% by 203028.
Whitehead, P. (2015) 25 Quested, T., & Murphy, L. (2014). 26 Quested, T., & Murphy, L. (2014) 27 Parfitt, J., Woodham, S., Swan, E., Castella, T., & Parry, A. (2016). 28 In 2015, the UN published 17 new global goals for sustainable development, one of which specifically targets the issue of
food waste and losses: “By 2030, halve per capita global food waste at the retail and consumer levels and reduce food losses
along production and supply chains, including post-harvest losses” (source: UN Sustainable Development Goal #12)

11
Chapter 3
3 Scope and methodology
3.1 Scope of study
This study assesses the FWL reduction potential of applying a specific strain of bioprotection cul-
tures (FreshQ®) to the yoghurt supply chain and the net impacts to yoghurt manufacturers, retail-
ers and consumers. The scope is defined using the WRI Food Loss and Waste Standard29
Timeframe
The timeframe for the data collected is from 2006 to 2016. Even though this can seem like a long
period, the data used in the study does not show and is not expected to show a lot of variation
over time. For illustration, the yoghurt waste percentage measured in a 2006 study in two Swedish
dairies30 is quite similar to the yoghurt waste percentage stated in connection with an interview of a
Danish dairy in 201631. Also, the waste percentage of household consumers, which is also an im-
portant piece of data in the study, is from 2014 with the field work carried out in 2012 and 201332.
However, as household waste percentage is a result of a behavioural pattern not likely to change
significantly over a short time horizon, the two year of age of these data is similarly not expected
to introduce uncertainty.
The timeframe for the findings is 2012 as this is the first field study year for the mentioned house-
hold consumer study, which is vital for analysis, and since the year is roughly halfway between the
study dates for much of the other data used in the study.
Definition food waste and losses
We follow the definition of food waste and losses (FWL) reiterated by FAO33, which characterizes
food losses as the decrease in edible food mass throughout the part of the supply chain that specif-
ically leads to edible food for human consumption. Food waste occurs at the end of the food chain
and thereby mainly which relates to retailers’ and consumers’ behaviour. For simplicity reasons we
use the two concepts interchangeably in this study with either “food waste and losses (FWL)” or
simply “food waste” as a shared terminology covering both occurrences.
Boundaries
The study focuses on the fresh dairy sector but takes a product-specific approach with yoghurt as
the product focus34. Assessing food waste and losses at a product category level can however intro-
duce uncertainty in the study as the classification of yoghurt is not always consistent between dif-
ferent sources and different markets. When we have had access to granular product level data for
29 Food Loss and Waste Accounting and Reporting Standard version 1.0. See: http://www.wri.org/sites/de-
fault/files/REP_FLW_Standard_July27.pdf 30 Berlin, J., & Sonesson, U. (2006). 31 See section 4.1. 32 Quested, T., & Murphy, L. (2014). 33 Gustavsson, J., (2011). 34 Only the edible parts of yoghurt waste are considered, i.e. excluding packaging.

12
dairy waste and losses, we have generally opted for the broadest available categorization of yo-
ghurt. The study uses data from WRAP, PRODCOM, dairy manufacturers and retailers. For WRAP
data, yoghurt category includes yoghurt, yoghurt drinks and fromage frais35. For PRODCOM data,
both available yoghurt categories have been used.36 For dairy manufacturers, the yoghurt category
include yoghurt, sour cream, cold sauce and creme fraiche, all with multiple flavours37; however,
not all of the interviewed dairy manufacturers produces all of these variants. As evident, the cate-
gories are broad, but not 100% identical. This can introduce uncertainty if major yoghurt catego-
ries are included for some stakeholders of the value chain but not for others.
Due to data limitations, the main focus of the paper is only on three of the key actors in the yo-
ghurt value chain; dairy manufacturers, retailers and households. However, as these actors are as-
sessed to generate the biggest amount of yoghurt waste, the quantification of yoghurt waste and
its causes focuses on the parts of the product life cycle where the study subject – FreshQ® – is be-
lieved to have the biggest direct impact. This also means that the study does not consider the im-
pact of FreshQ® in reducing FWL in the pre-harvest stages or end-of-use stages of the value chain
as well as distribution and food service38.
Destination
While the main causes of waste at each step of the value chain are detailed in the subsequent
chapters, the waste that occurs in the yoghurt supply chain goes to different destinations. How-
ever, lack of detailed mapping makes it difficult exactly to identify which destinations.
For dairy manufacturers and retailers, diversion to animal feed, food banks, composting, incinera-
tion of waste with and without energy recovery as well as landfill and sewer are among the most
cited destinations in the UK.39 For dairy manufacturers yoghurt waste occurs during production
(e.g. a contaminated batch) and in connection with product returns from retailers. For retailers, yo-
ghurt that is contaminated or past its shelf life is either returned to the dairy manufacturer or do-
nated to charity, food banks or thrown out. In France, it is now forbidden by law for retailers to
thrown out food and consequently, it goes to food banks.
For consumers, data from the research from WRAP in the UK shows that the majority of yoghurt
waste at household level is disposed of in unopened packaging and that a large share is not recy-
cled but goes down the sewer. For the purpose of this study all the mentioned destinations are
classified as yoghurt waste and included in the waste reduction potential.
35 The study thus follows the classification of WRAP’s product inventory for yoghurt waste at a household level (Quested, T. et.
al., 2013)
36 PRODCOM, 2014, 10515241: Curdled milk, cream, yoghurt and other fermented products
10515245: Flavoured liquid yoghurt or acidified milk (curdled milk; cream; yoghurt and other fermented
products flavoured or containing added fruit; nuts or cocoa). 37 Berlin, J., & Sonesson, U. (2006). 38 This is not to say that farmers will not be impacted indirectly by longer shelf life and less waste in yoghurt production (e.g.
through reduced demand for milk) or that less yoghurt waste will not have an impact on the disposal and distribution of yo-
ghurt waste, however, these effects are considered secondary. That said, in the environmental impact assessment (to come)
pre-harvest and end-of-use are important considerations as the environmental gains associated with reduced waste in the
grocery supply chain and with consumers are largely attributed to reduced inputs from farms and reduced disposal. 39 Parfitt et. al. (2016).

13
Finally, recognizing that causes and quantities of yoghurt waste can, as mentioned differ between
countries, the impact model is constructed based on FWL data and insights from four key markets
which generally have better-than-average data; UK, Germany, France, Sweden and Denmark. Sim-
ilar to the approach taken by e.g. FAO40, these countries are used as a proxy to model food waste
reductions achievable with FreshQ® within the EU-28.
3.2 Methodology and approach
Studies of how companies impact society – whether through a specific investment, a process or, as
in this case, by developing a specific product or technology – can be conducted in a variety of
ways. As an example, a growing number of companies have started to use environmental Life Cy-
cle Assessments (LCAs) to quantify the impacts of their products on the environment from cradle to
grave, while others use more qualitative methodologies focussing on social and community impacts
such as socio-economic and/or human rights impact assessments, for instance when evaluating a
specific project or production site. It is important to recognize that each of these methods have
merits as well as trade-offs in their own rights, hence the key to a successful outcome is to choose
the methodology that is most appropriate to the research objective in question.
The methodology used in this study builds, and further expands, on the basic principles of eco-
nomic cost-benefit analysis (CBA) as outlined in the guidelines by the EU Commission41 and the
World Bank42 for conducing impact assessments of public and/or private investments. The benefits
of this approach is that it allows for a more holistic assessment of costs and benefits beyond “just”
environmental or social factors by putting a monetary value on potential welfare gains while at the
same time factoring in the costs of implementation.
In practical terms, QBIS uses the CBA methodology to provide an organisational framework for
identifying, quantifying, and comparing the costs and benefits from a specific corporate investment
and/or activity. In this case, we have used the methodology to measure the socio-economic net
impacts of applying CH’s bioprotection solutions (FreshQ®) to a specific product value chain (yo-
ghurt) in a specific market context (UK, Germany, France, Sweden and Denmark) as detailed in the
scope section above.
Building on an extensive review of existing data as well as collection of perspectives from industry
experts, c.f. section 3.3, the study started out by mapping the yoghurt value chain in the selected
EU markets “as is”, including current waste levels, causes and resulting costs and benefits to each
of the main stakeholders in the value chain (Step 1 + 2). A cost benefit assessment was then de-
veloped based on the known effects of adding bioprotection solutions (in this case FreshQ®) to ex-
tend the shelf life of yoghurt (Step 3 + 4 + 5). Finally, a number of “action levers” were identified
(Step 6), which may provide an incentive for all stakeholders in the yoghurt value chain to adopt
FreshQ®, thereby creating a higher likelihood that the waste reduction potential identified in this
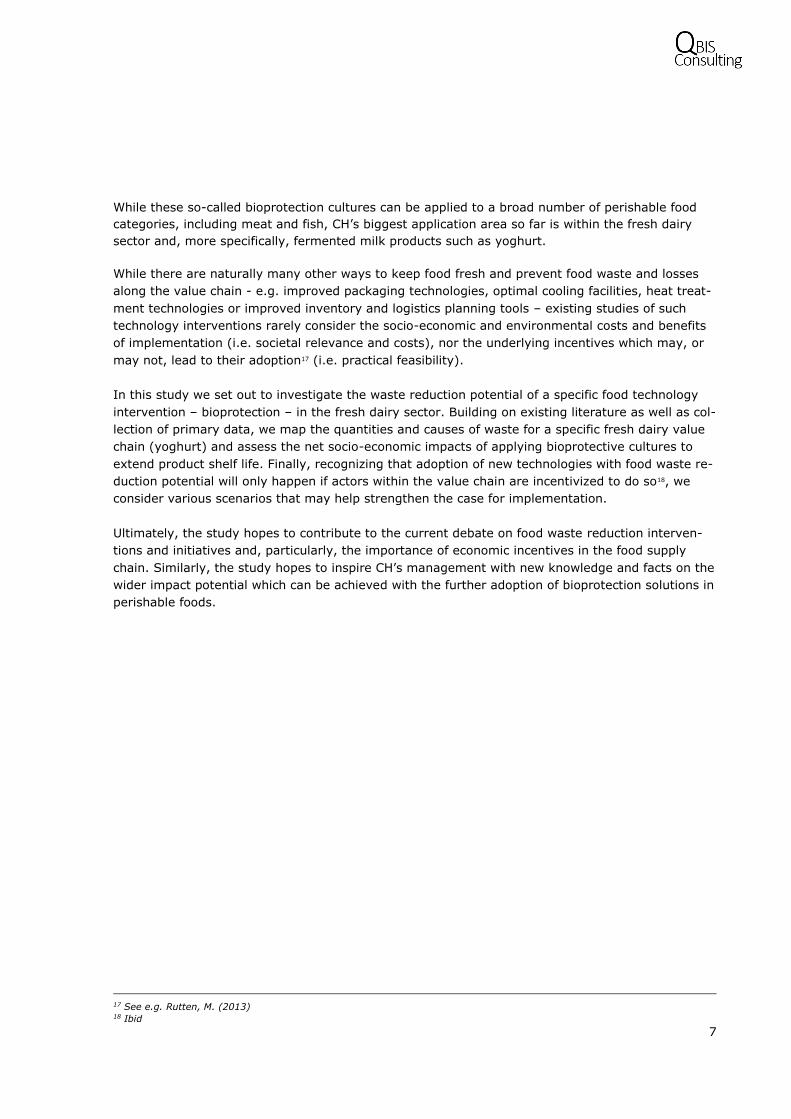
study may actually be realized, cf. Figure 3.1 below.
40 The majority of the findings for EU in FAO’s seminal quantification of food waste and losses from 2011. Gustavsson et al.,
(2011) was based on, or extrapolated from, UK FWL data. 41 “Guide to Cost Benefit Analysis of Investment Projects”, DG REGIO, EU Commission, 2008, http://ec.europa.eu/regional_pol-
icy/sources/docgener/guides/cost/guide2008_en.pdf 42 Cost Benefit Analysis in World Bank Projects, 2010, http://web.worldbank.org/external/default/main?no-
SURL=Y&theSitePK=1324361&piPK=64252979&pagePK=64253958&contentMDK=22703501
14
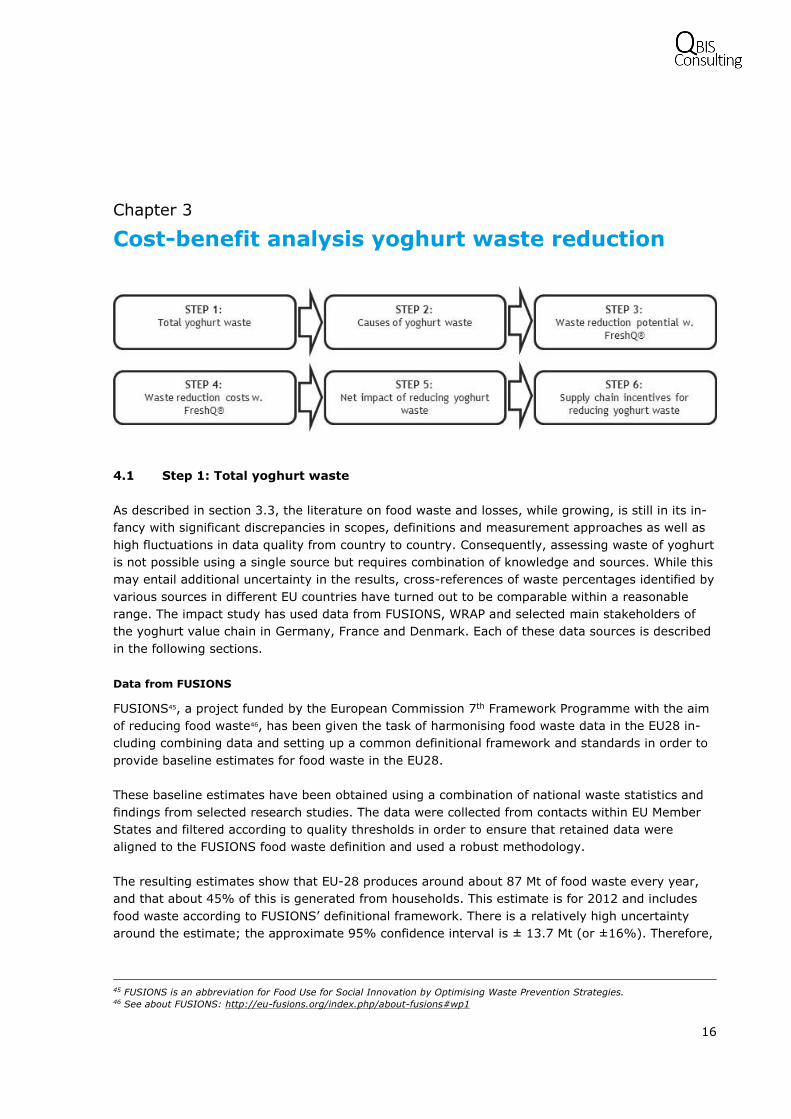
Figure 3.1: The 6-steps approach of the impact assessment
3.3 Data collection
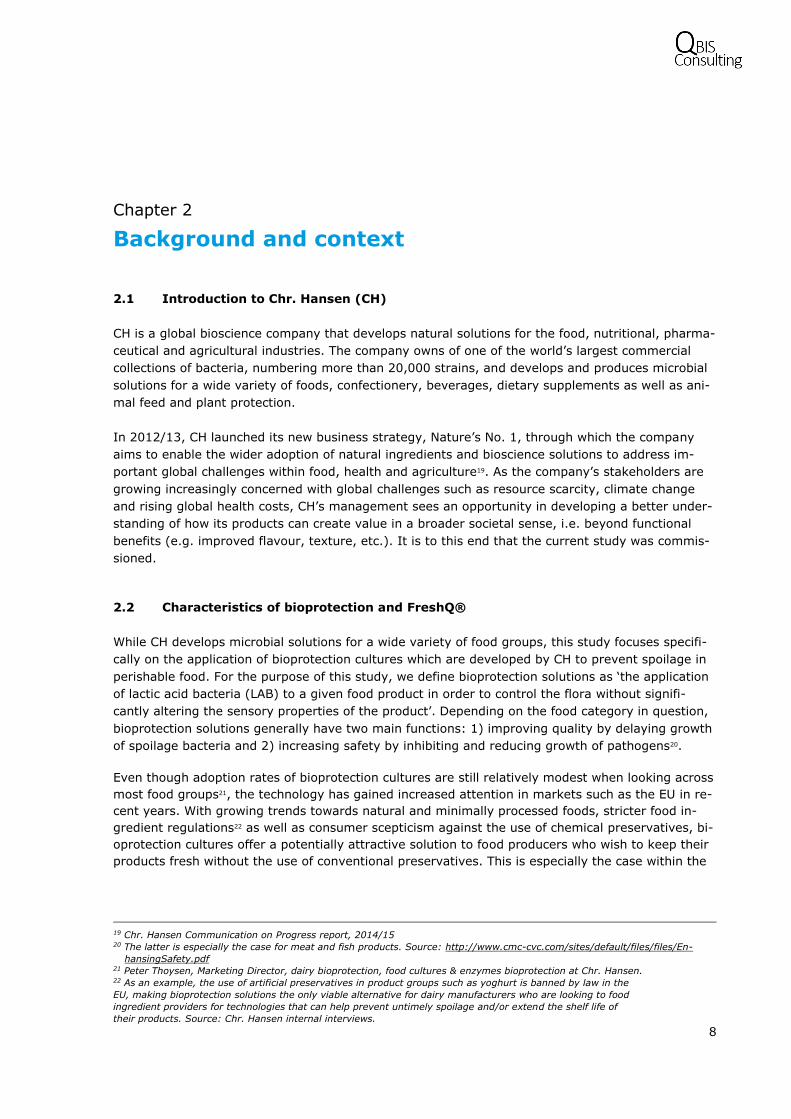
Several data sources have been used in this impact study as illustrated in Figure 3.2 below.
Figure 3.2: Data collection and inputs
Secondary data was collected initially as well as throughout the project, in form of a review of more
than 50 academic articles and reports on various aspects of causes, quantities and interventions
within global food waste and losses as well as relevant statistical databases containing food pro-
duction, demand and waste figures. From this review it was clear that the literature on food waste

15
and losses, while growing, is still in its infancy with significant discrepancies in definitions and
measurement approaches as well as high fluctuations in data quality from country to country.
It was therefore determined early on that it would be necessary to collect primary data as well to
fill the gaps identified in the existing literature and ensure practical relevance of the findings to key
players in the industry. To this end, the study has collected data from the main stakeholders out-
lined in the value chain scope, cf. Figure 3.2 above, i.e. EU dairies, retailers and consumers. For
dairies and retailers, loosely structured interviews were conducted with the main purpose of identi-
fying waste percentages and, in the case of the dairies, current and potential waste reductions
achievable with the application of FreshQ® in yoghurt production.
From experience, many companies underestimate the amount of wasted food they produce unless
they measure it. In order to minimise this bias, information on waste and waste percentages pro-
vided by dairy manufacturers and retailers have only been used if the data is within reasonable dis-
tance from the typical indicated values. For instance, a dairy manufacturer indicated that their yo-
ghurt waste percentage in production was around 0.5%. This value was not used as the typical in-
dicated yoghurt waste percentage in production was 5%-6%. In the absence of more sophisticated
methods and more comprehensive data, this primitive filter is relatively effective.
With regards to consumers, a substantial evidence base on consumer waste quantities and causes
at the product level is available in the UK due to the work of the government-sponsored NGO,
WRAP. Even so, limited insights exist into EU consumers’ willingness and tolerance levels when it
comes to extending the shelf life of perishable foods such as dairy. To this end, a small in-person
survey was conducted in one of the focus EU markets (Denmark) as input for the scenario develop-
ment phase. The survey43, which includes reactions from 70 respondents exiting their local super-
market, provides novel insight into consumer tolerance levels and biases towards shelf life exten-
sions of yoghurt, yet more research is needed in this space. Since what people say and what they
do – especially in a hypothetical situation such as the questions asked – are not always the same,
the results of the survey are subject to uncertainty and should only be used as indications of con-
sumers’ tolerance levels towards shelf life extensions of yoghurt.44
Finally, to ensure validity of the study’s methodology and invite a critical review of the findings, a
number of academic experts have been consulted within various topics of the study. An overview of
the feedback provided by the expert panel is included in Appendix A with the majority of the com-
ments having been worked into the analysis and conclusions.
43 Highlights from the consumer study are presented in section 0.. 44 For example, people who were actively seeking British Seasonal produce were no more or less likely to buy British Strawber-
ries. See: https://www.gov.uk/government/uploads/system/uploads/attachment_data/file/137736/defra-stats-foodfarm-
food-attitudes-report-110406-execsummary.pdf
16
Chapter 3
4 Cost-benefit analysis yoghurt waste reduction
4.1 Step 1: Total yoghurt waste
As described in section 3.3, the literature on food waste and losses, while growing, is still in its in-
fancy with significant discrepancies in scopes, definitions and measurement approaches as well as
high fluctuations in data quality from country to country. Consequently, assessing waste of yoghurt
is not possible using a single source but requires combination of knowledge and sources. While this
may entail additional uncertainty in the results, cross-references of waste percentages identified by
various sources in different EU countries have turned out to be comparable within a reasonable
range. The impact study has used data from FUSIONS, WRAP and selected main stakeholders of
the yoghurt value chain in Germany, France and Denmark. Each of these data sources is described
in the following sections.
Data from FUSIONS
FUSIONS45, a project funded by the European Commission 7th Framework Programme with the aim
of reducing food waste46, has been given the task of harmonising food waste data in the EU28 in-
cluding combining data and setting up a common definitional framework and standards in order to
provide baseline estimates for food waste in the EU28.
These baseline estimates have been obtained using a combination of national waste statistics and
findings from selected research studies. The data were collected from contacts within EU Member
States and filtered according to quality thresholds in order to ensure that retained data were
aligned to the FUSIONS food waste definition and used a robust methodology.
The resulting estimates show that EU-28 produces around about 87 Mt of food waste every year,
and that about 45% of this is generated from households. This estimate is for 2012 and includes
food waste according to FUSIONS’ definitional framework. There is a relatively high uncertainty
around the estimate; the approximate 95% confidence interval is ± 13.7 Mt (or ±16%). Therefore,
45 FUSIONS is an abbreviation for Food Use for Social Innovation by Optimising Waste Prevention Strategies. 46 See about FUSIONS: http://eu-fusions.org/index.php/about-fusions#wp1

17
the range of results within this confidence interval is from around 74 Mt to 102 Mt, cf. Table 4.4
below.47
Figure 4.1: Estimates of food waste in EU-28, 2012
Note: Estimates are presented with 95% confidence intervals.
Source: FUSIONS 2016.
As the FUSIONS’ estimates do not provide detailed knowledge about the kind of types of food that
is wasted including yoghurt, they have primarily been used to confirm, which main stakeholders of
the value chain that produce the largest amount of waste and as such where the biggest return on
reduction of food waste is located, i.e. processing and household consumers.
Data from WRAP
The government-sponsored NGO, WRAP, has published a range of studies investigating food waste
in the UK.48 The studies are very detailed focussing on one value chain stakeholders at the time and
offer valuable insight in terms of waste percentages, waste causes as well as the potential for re-
ducing food waste through different measures including extending product life.
WRAP’s 2014 study (Household food and drink waste, a product focus) shows that household con-
sumers in the UK waste around 8.8% of their purchased yoghurt and all 8.8% is assessed as
avoidable, cf. Figure 4.2 below.49 It also shows that approximately 80% of the yoghurt that goes to
waste in private households is due to the product not being “used in time” placing yoghurt in the
top 20 list of products being disposed of solely due to shelf life expiration50. Also, people in the di-
ary research undertaken by WRAP mentioned the date label as a factor for the vast majority of the
waste incidents, indicating that a long shelf life (as stated by the date label) has the potential to be
influential for this product category.
In addition, WRAP’s 2015 study on reducing food waste by reducing product life estimates that
1.4% of yoghurt sales at the retailer level is due to date expiration causes and as such could be
prevented through longer shelf life.51 As this figure stems from a survey, it could underestimate the
47 FUSIONS (2016). 48 See: http://www.wrap.org.uk/, http://www.wrap.org.uk/content/food-waste-resource-listing, and
http://www.wrap.org.uk/content/manufacturing-and-retail-resource-listing 49 Quested, T., & Murphy, L. (2014). 50 According to Quested, T., & Murphy, L. (2014), yoghurt ranks 11th in the top 20 list of avoidable food waste which is caused
by shelf life expiration. Across all food categories only 50% of avoidable waste is due to shelf life issues versus 80% for yo-
ghurt. 51 Lee, P., Osborn, S., & Whitehead, P. (2015).

18
actual waste companies have a tendency to underestimate their actual waste unless they measure
it, cf. section 3.3 above.
Data from universities
Berlin and Sonesson (2008) investigate the possibility of reducing waste in yoghurt production by
optimising dairy manufacturers’ sequence of product shifts.52 Their results substantiate the poten-
tial for reducing yoghurt waste at dairy manufacturers, but also provide an estimate of yoghurt
waste in production as two detailed dairy case studies included in their study suggests that yoghurt
waste constitutes 4.6%-6.4% of total production.
Data from main stakeholders in the yoghurt value chain
Apart from the estimates from WRAP and Berlin and Sonosson (2008), it has not been possible to
find additional knowledge on yoghurt waste from existing literature. Therefore, in order to fill the
gaps and substantiate existing results, additional data has been collected directly from dairy manu-
facturers and retailers.
Interview with a Danish dairy manufacturer confirms the estimates from Berlin and Sonesson
(2008) in regard to yoghurt waste percentage in production. While Berlin and Sonesson estimate
yoghurt waste to be 4.6%-6.4% of total production, the Danish dairy manufacturer estimates its
waste to be 5.0%-6.0 of total production.
A field study by CH among French retailers’ estimates that yoghurt waste due to expiration is
around 2.0%-2.5% of total production for retailers.53 The study objective was to investigate retail-
ers’ perception towards the value added of shelf life for dairy products using data from the largest
French retailers54. Since this estimate is produced through actual measurement and not interviews,
it could be less biased that the corresponding WRAP estimate, cf. above. However, as it is based on
a single hypermarket, it contains some uncertainty due to the small sample size.
Summary of estimates of yoghurt waste across the value chain
In summary, based on data from WRAP, universities and interviewed stakeholders of the yoghurt
value chain, it has been possible to establish estimates on yoghurt waste for dairy manufacturers,
retailers and household consumers, cf. Figure 4.2 below.
It has not been possible to estimate waste in connection with primary production and food service,
which means that the assessment of yoghurt waste is not going to cover all value chain stake-
holder. However, if the distribution of total waste across the value chain approximately corresponds
to the distribution of yoghurt waste, FUSIONS’s estimates suggest that this assessment – with
dairy manufacturers, retailer and household consumers - covers around 75%-80% of total waste,
cf. Figure 4.1 above.
52 Berlin, J., & Sonesson, U. (2006). 53 Bauquis, C. (2015). The field study was carried out as an internship project with a student from ESC Rennes School of Busi-
ness. 54 Carrefour, E. Leclerc, Intermarche, Casino, Zero Gachis, Auchan and Systems U.

19
Figure 4.2: Estimates of avoidable yoghurt waste in different EU countries
Sources: 1 Berlin, J., & Sonesson, U. (2008). 2 Interview w. Danish dairy. 3 Lee, P., Osborn, S., & Whitehead, P. (2015). 4 Field study of French retailers (Carrefour, E. Leclerc, Intermarche, Casino, Zero Gachis, Auchan and Systems U). 5 Quested, T., & Murphy, L. (2012).
4.2 Step 2: Causes of yoghurt waste
In order to determine how much of the estimated yoghurt waste that accrues from expirations and
shelf life issues and in turn potentially can be reduced by using FreshQ®, the underlying causes of
the estimated waste needs to be identified, cf. Figure 4.3 below.
Figure 4.3: Causes of yoghurt waste
Sources: 1 Berlin, J., & Sonesson, U. (2008). 2 Estimated on the basis of interview w. Danish dairy manufacturer (Arla) and German dairy manufacturer (anonymous). 3 Lee, P., Osborn, S., & Whitehead, P. (2015).
4 Bauquis, C. (2015). 5 Quested, T., & Murphy, L. (2014).

20
Dairy manufacturing
Dairy manufacturers’ waste types are identified as production waste and waste due to return of yo-
ghurt from the retailers’ warehouses.
Concerning production waste, Berlin and Sonesson (2008) identify the causes as being product
change, cleaning, laboratory tests as well as discarded containers55. Cleaning must be done after a
change of base, e.g. after a product containing rhubarb, after a product containing vanilla, and at
the end of the working day. Rinsing is done after products containing tropical fruit (a mix of pine-
apple, mango, peach and passion-fruit), elderberry or honey, which are considered to have aller-
genic potential. Otherwise the pushing principle is used, with pale coloured products preceding dark
ones.
Thus, all of the three waste causes cleaning, rinsing and/or pushing are related to the frequency
and sequence of production batches, which means that if the number of production batches is re-
duced, so is the waste in dairy production and Berlin and Sonesson (2008) show that optimisation
of the production batch sequence given in terms of bigger batches reduces the waste significantly,
cf. section 3.3 below.
As bigger batches can be achieved through longer shelf life, FreshQ® can initiate similar waste re-
ductions as achieved in the Swedish dairies. Thus, longer shelf life enables dairy manufacturers to
reduce the number of production batches and in turn increase the volume of their production
batches. This is because all dairy manufacturers are requested to deliver yoghurt with a certain
number of available shelf life days to the retailers’ warehouses. In order to achieve this number of
available days, the dairy manufacturers need to operate with a certain number of production
batches per week per product, e.g. three production batches per week per product. But when shelf
life of yoghurt is increased, dairy manufacturers can reduce the number of production batches per
week per product and still being able to deliver yoghurt with the required number of available shelf
life days to the retailers’ warehouses. In this way, bigger volumes in the production batches saves
waste through lower production batch frequency, which is the primary waste generator.
55 For each yoghurt product manufactured, approximately 18 filled containers (1 kg each) were discarded. The first 10 and the
last five containers produced were disposed off, because the dairy wanted to eliminate the risk of substandard content.

21
Figure 4.4: Batch size and FreshQ® and waste
reduction, a German dairy manu-
facturer
An example from a German dairy manu-
facturer illustrates this. After applying
FreshQ®, the dairy manufacturer was
able to increase its batch volumes from
6,500 litres to 17,500 litres and in turn
reduce its already low production waste
an additional 50%. The longer shelf life
accruing from using FreshQ® also re-
duced the return of yoghurt from the re-
tailers because longer shelf life meant less
products above the date threshold level at
the store. According to CH’s market intel-
ligence and the interviews with dairy
manufacturers, such return agreements
are used in markets such as Denmark,
Germany, UK and France, but probably
also in other EU countries.
Source: Interview with a German dairy manufacturer using
FreshQ®.
However, product-return waste from retailers’ warehouses is something that varies greatly among
the dairy manufacturers. Some of the interviewed dairy manufacturers say it constitutes a signifi-
cant part of their total waste, while others say it is non-existing or very small. It is therefore diffi-
cult to estimate accurately and has been set to vary between 0.1% to 2.0% of production, which
are the percentages mentioned during the interviews and obtained from available non-scientific
sources.56 But the estimate has considerable uncertainty and that has implications for the findings
as the percentage of return waste has a large impact on the distribution of incentives between
dairy manufacturers and retailers, cf. section 0.
Retailers
According to the field study on French retailers’ perception towards the value of added shelf life for
dairy products57, the causes of yoghurt waste are 1) end of shelf life (2.0%-2.5% of production), 2)
inventory errors (0.5% of production) and 3) consumer handling (0.1% of production). Overall,
these causes generate around 2.6-3.1% yoghurt waste out of total production.58
The 2.0%-2.5% waste out of total yoghurt production from end of shelf life for French retailers is
somewhat higher than WRAP’s corresponding estimate of 1.4% for UK retailers. As both estimates
have uncertainties they are assessed to carry approximately the same credibility, cf. section 4.1.
The differences are therefore seen as natural variation considering differences in sampling (inter-
view versus measurement), as well as logistics setup, legislation, retailer practices, etc. and both
estimates are included in the analysis.
56 For instance, new paper articles. For France, an article in La Vie Eco mentioned based on interviews with retailers and experts
that return rates for dairy products were 1%-2%. http://lavieeco.com/news/economie/les-industriels-se-plaignent-des-rup-
tures-de-la-chaine-de-froid-dans-la-grande-distribution-33688.html 57 Bauquis, C. (2015). 58 The right baseline is “product ordered” and not “production”. However, in order to keep the same baseline, and since it has
no implications for the results whether “product ordered” or “production” is used, “production” is used as the consistent base-
line.
22
An interview with the Danish retailer Dansk Supermarked, who has around 30% of the retail mar-
ket in Denmark, indicates a total yoghurt waste percentage of 2.3% of production. Assuming that
the Danish retailer’s yoghurt waste has the same composition as the French retailers, yoghurt
waste from end of shelf life is around 1.7% of production, i.e. between the French and the UK esti-
mate.
Since FreshQ® is able to provide longer shelf life for yoghurt, it has the potential to reduce some of
yoghurt waste from end of shelf life causes estimated between 1.4%-2.5% of production.
Household consumers
According to WRAP’s comprehensive study of household consumers’ food waste, the causes of yo-
ghurt waste are 1) not used in time (78%), 2) cooked, prepared or served too much (6%) and 3)
Personal preference, accident (contamination, burnt and spoilt) and other (17%).59
As the avoidable yoghurt at household consumers is estimated to 8.8% of production, cf. section
4.1, this means that 6.8% (78% x 8.8%) of household consumers’ yoghurt waste is due to expira-
tion causes and can potentially be reduced with FreshQ®. WRAP’s study also shows that around
50% of the estimated yoghurt waste was thrown away in unopened packaging with another 11% in
opened packaging indicating the potential from extended date limits through longer shelf life. If the
date on the packaging is longer, then presumably there will be a reduction in the amount of uno-
pened yoghurt waste and if the product lasts longer, then this – and the associated longer date –
can both help the opened yoghurt wasted because it was “not used in time” to be reduced.
Summary of yoghurt waste causes
The identification of yoghurt waste causes indicates a relatively high proportion of yoghurt waste
being linked to reaching its shelf life. Therefore, it is high likely that increasing the shelf life – e.g.
via FreshQ® - will reduce the amount wasted.
Production induced waste at dairy manufacturers are estimated be to around 4.6%-6.4% out of to-
tal production in two Swedish dairies and around 5.0%-6.0% in a Danish dairy. The similarity of
the numbers makes it plausible to take the narrower range of the Danish study. This means a theo-
retical maximum waste reduction potential using FreshQ® of around 5.0%-6.0% of total produc-
tion for dairy manufacturers.
End of shelf life induced waste at retailers are estimated to be around 1.4% for the surveyed UK
retailers and around 2.0%-2.5% for the surveyed French retailers. This means a theoretical maxi-
mum waste reduction potential using FreshQ® of around 1.4%-2.5% of total production for retail-
ers.
Not used in time induced waste for UK households are estimated to be around 6.4%. This means a
theoretical maximum waste reduction potential using FreshQ® of a similar magnitude at household
consumers.
Subject to the uncertainty of having only partial estimates of waste and waste causes from four
countries, this means that FreshQ® has a theoretical waste reduction potential corresponding to
59 Quested, T., & Murphy, L. (2014).
23
around 15%-17% of total production across dairy manufacturers, retailers and household consum-
ers.
4.3 Step 3: Waste reduction potential with FreshQ®
FreshQ® characteristics
FreshQ® protective cultures inhibits the growth of yeast and mould contamination in dairy prod-
ucts. The contaminant growth delaying effect of FreshQ® is dependent on the level of initial con-
tamination and the quality of the cold chain from dairy to consumption.
Therefore, the number of extra shelf life days which can be obtained by using FreshQ® protective
cultures is specific to each dairy and the conditions of the cold chain. In this study, it is assumed
that FreshQ® will enable dairy manufacturers to extend the shelf life of their yoghurt with by seven
days. From CH experience based on hundreds of lab trials, more than three hundred customer field
trials and extensive customer feedback, we consider seven days a conservative average estimate
when considering a yoghurt product produced by an average European dairy and sold in average
European cold chain conditions.
One of the important objectives of this study is to determine the optimal allocation of these seven
extra shelf life days among the key stakeholders in the yoghurt value chain, i.e. dairy manufactur-
ers, retailers and household consumers. Optimal in the sense that the allocation of extra shelf life
days provides sufficient financial incentive for all stakeholders to engage in waste reduction of yo-
ghurt and optimal in the sense that the allocation does not discourage consumers from buying yo-
ghurt with longer shelf life, i.e. the extension does not conflict with consumers’ preferences for
fresh products to such a degree that profit loss from demand reductions is bigger than the savings
from reduced yoghurt waste.
Dairy manufacturers
As described in section 4.2, dairy manufacturers’ yoghurt waste mainly comes from production,
while waste from product return of yoghurt from retailers is more uncertain and volatile varying
from less than 0.1% and up to around 2.0%.
Production waste is closely related to the number of production batches as production waste in-
creases with the frequency of the production batches. Thus, as mention in section 4.2, each new
production batch requires either cleaning, rinsing or pushing, with cleaning producing the relatively
biggest amount of waste and pushing producing the relatively lowest amount of waste, cf. section
4.2.

24
Table 4.1: Batch frequency, shelf life and waste re-
duction, two Swedish dairies
On the basis of case studies of two
Swedish dairy manufacturers, Berlin
& Sonesson (2008) show that optimi-
sation of batch sequence with the aim
of reducing the number of batches
per product reduces waste signifi-
cantly, cf. Table 4.5. Thus, reducing
the batch frequency from two to
three per week to two per week re-
duces waste 24%-26%. In addition,
Berlin & Sonesson (2008) assess that
a Future A scenario also is possible,
where the batch frequency is further
reduced to one per week and waste is
reduced more than 50%.
Today Goal A Difference
Dairy A
Production batches (week): 2-3 2.0 -20%
Production (tons/week): 219,000 219,000 0%
Waste (tons/week): 12,194 9,301 -24%
% waste in production: 6.7% 5.1% -24%
Dairy B
Production batches (week): 2-3 2.0 -20%
Production (tons/week): 182,000 182,000 0%
Waste (tons/week): 11,715 8,698 -26%
% waste in production: 5.3% 4.0% -26%
Source: Berlin, J., & Sonesson, U. (2008).
The results of Berlin & Sonesson (2008) are interesting as they document the relationship between
batch size and frequency and waste reduction, but they do not show how batch size and frequency
is related to shelf life days and as such how FreshQ® can reduce waste in connection with batch
frequency. This knowledge has therefore been obtained directly from dairy manufacturers.
Figure 4.5: Batch frequency, shelf life and
waste reduction, one Danish dairy
According to an interview with a German
dairy manufacturer reducing the number of
production batches by one per week will re-
quire a minimum of five extra shelf life
days. The five days are necessary in order
for the dairy manufacturer to be able to
still meet retailer’ shelf life days’ require-
ments despite fewer production batches
per week. How this reduction in batches
will impact production waste not disclosed
by the German dairy manufacturer. Accord-
ing to an interview with a Danish dairy
manufacturer, reducing the number of pro-
duction batches per week from three to two
would require a minimum of four extra
shelf life days and would reduce production
waste by around 33%, cf. Figure 4.5.
Source: Interview with Danish Dairy.

25
Overall, Berlin & Sonesson (2008) and the Danish dairy manufacturer
estimate that reducing batch frequency by one batch per week can re-
duce production waste by 33%-50%. Further, the German and Danish
dairy manufacturers estimate that reducing batch frequency with one
batch per week requires an extra four to five shelf life days.
Applying these estimates means that dairy manufacturers potentially
can reduce their production waste from the current level of around
5.5% out of total production, cf. section 4.2, to an estimated around
2.8%-3.7% by reducing batch frequency to one batch per week
through an extra four to five shelf life days.
With its ability to extend shelf life of yoghurt, FreshQ® can help dairy
manufacturers achieve such waste reductions. Actually, even though
dairy manufacturers need four to five extra shelf life days to reduce
batch frequency, they do not use these extra days in the dairy itself.
As described, dairy manufacturers primarily need the date on the yo-
ghurt containers to be longer in order to meet retailers’ requirements
to available shelf life days, cf. section 4.2
According to interview with a Danish dairy manufacturer, only one of the four extra shelf life days
required to reduce batch frequency will be used in the dairy itself while the remaining days can po-
tentially benefit retailers and/or consumers.
Thus, out of the seven extra shelf life days provided by FreshQ®, one or perhaps two days are
used at the dairy manufacturers, the remaining five to six days can potentially benefit retailers and
household consumers. How retailers and household consumers potentially can benefit from extra
shelf life days is described in the next sections.
Retailers
The field study of French retailers included Carrefour, E. Leclerc, Intermarche, Casino, Zero Gachis,
Auchan and Systems U.60 The objective was to determine the possibilities and likely benefits of ex-
tending yoghurt shelf life as well as characteristics of retailer yoghurt waste such as waste causes,
types of waste and current countermeasures to avoid waste.
The study includes two shelf life case studies, where the percentages of yoghurt left on the shelves
were monitored for an increasing number of shelf days. The case studies show that at a certain
date threshold, one retailer had 2.0% yoghurt left out of the original amount of yoghurt placed on
the shelves, while another retailer had 2.5% yoghurt left on the shelves. After that threshold, the
two retailers pursued different strategies for dealing with the remaining yoghurt., cf. Figure 4.6 and
Figure 4.7 below.
60 Bauquis, C. (2015).

26
Figure 4.6: First retailer case One retailer donated the yo-
ghurt to charity and in turn in-
curred 2% loss out of the orig-
inal amount of yoghurt placed
on the shelves.61 Even though
donation to charity probably
prevents the yoghurt from be-
ing wasted, it is still a financial
loss for the retailer that will in-
fluence the incentives for
waste reduction. According to
the field study, this retailer is
presumably one of the only
French retailers donating to
charity.
Source: Bauquis, C. (2015).
Figure 4.7: Second retailer case The other retailers use rebates
to get rid of yoghurt with few
remaining shelf life days.
After the threshold date, the
retailer started introducing re-
bates (of around 25%) and af-
ter seven more days on the
shelves, around 0.8% of the
original amount of yoghurt
placed on the shelves remained
and was subsequently thrown
out as it had reached the expi-
ration date.
Source: Bauquis, C. (2015).
The case studies provide empirical observation sets consisting of 1) percentages yoghurt left on the
shelves and 2) the number of shelf days. In order to establish a tool for assessing the impact of
longer shelf life days on the percentage yoghurt left on the shelf, these discrete observation sets
have been approximated by a continuous linear function. This way it is possible to assess how the
percentages of yoghurt left on shelf develop as one extra shelf life day is added to the total shelf
life.
The continuous linear function is simple assuming that yoghurt has a constant probability (p) of be-
ing sold on each day it is on the shelf. The ex-ante probability of yoghurt being sold within day t
(day t included), called P(t), is given by:
𝐸𝑥 𝑎𝑛𝑡𝑒 𝑝𝑟𝑜𝑏𝑎𝑏𝑖𝑙𝑖𝑡𝑦 𝑓𝑜𝑟 𝑦𝑜𝑔ℎ𝑢𝑟𝑡 𝑏𝑒𝑖𝑛𝑔 𝑠𝑜𝑙𝑑 𝑤𝑖𝑡ℎ𝑖𝑛 𝑑𝑎𝑦 𝑥 = 𝑃(𝑡) = 1 − (1 − 𝑝)𝑡
61 In France, donating to charity triggers a tax deduction.

27
The underlying logic is that on each day yoghurt has an ex ante probability of being sold equaling p
minus the accumulated probability that the yoghurt has not been sold on a previous day. It follows
that the accumulated probability of a yoghurt being sold within day t (included) can be calculated
as one minus the probability that the yoghurt has not been sold. On day one the ex-ante probabil-
ity of the yoghurt not being sold is 1-p. The probability of the yoghurt not being sold on day two
either is (1-p) * (1-p), which by rearranging leads to the accumulated probability of the yoghurt
being sold as stated in the equation above.
As there for each day is an increased probability that the yoghurt has been sold, the ex-ante prob-
ability that the yoghurt will be sold on day t diminished as t increases. From section 4.2, it follows
that that 1.4% – 2.5% of the yoghurt will not be sold within the expiration date and given a dis-
tinct shelf life, the daily probability of the yoghurt being sold can be calculated. Assuming that the
waste rate is given by a percentage w and that the total shelf life is n, the daily probability can be
calculated as:
(1 − w) = 1 − (1 − 𝑝)𝑛 =>
𝑝 = 1 − √1 − (1 − 𝑤)𝑛
By assuming that p is a function of store design, filling of shelves etc., the waste reduction (meas-
ured in percentage points) from increasing shelf life from t to t+x can then from p be calculated as
P(t+x) – P(t). This way of modelling the effect on retail waste from increasing the shelf life gener-
ates a continuous linear approximation to the discrete observations on the two retailer cases, cf.
Figure 4.6 and Figure 4.7 above.
Figure 4.8: The probability (p) is determined from
1) the percentage of yoghurt left on
the shelves out of the original amount
of yoghurt placed on the shelves and
2) the available shelf life days for the
yoghurt. In UK, these set of numbers
are assessed to be around 1.4%
waste62 and 13.7 shelf life days63 and
in France, they are assessed to be
around 2.0%-2.5% waste 64 and 18
shelf life days65. Based on these sets
of observations, it is possible to as-
sess how yoghurt waste develops as
additional shelf life days are added to
the available shelf life, Figure 4.8.
Source: Interview with Danish Dairy.
This flexibility is then used when assessing the optimal distribution of the additional shelf life days
provided by FreshQ®.
62 See section 4.2. 63 See Lee, P., Osborn, S., & Whitehead, P. (2015), p. 19. 64 See section 4.2. 65 Bauquis, C. (2015).

28
Household consumers
In 2013, WRAP published a study on simulating household consumers’ food waste.66 The study uses
a so-called milk model developed to simulate waste of milk at home as a function of consumer be-
haviour given in terms of shopping and consumption patterns. Depending on the amount of milk
purchased in the supermarket and the probability of drinking milk at meals and in between meals,
the model estimates households’ waste of milk using discrete event simulation.
As milk and yoghurt shares many similarities, the milk model has been adapted to fit the shopping
and consumption patterns of yoghurt in order to estimate household consumers’ waste of yoghurt.
The adaptation of the milk model to yoghurt includes changing shopping patterns to less top-up
shopping and extension of average shelf life from 8.1 to 13.7 days67. The consumption pattern was
also changed with the primary probability being in the morning, cf. Table 4.2 and Table 4.3 below.
Table 4.2: The milk model (original) Table 4.3: The yoghurt model (adapted)
As it has not been possible to find documentation to substantiate yoghurt shopping and consump-
tion behaviour from e.g. consumer research, the chosen shopping and consumption patterns in the
adapted yoghurt model are purely layman work based on personal knowledge and experience.
However, with the illustrated setup, the adapted yoghurt model generates 6.8%-7.3% waste out of
total production, which approximately correspond to WRAP’s 6.8% estimate of yoghurt waste at
the household consumers, cf. section 4.1.
With this setup functioning as today’s situation (in UK), the adapted yoghurt model was then used
to estimate how household consumers’ waste develops as the average number of shelf life days of
yoghurt increases one day at the time. This way the model could illustrate the impact of longer
shelf life enabled by FreshQ® on household consumers’ waste.
The adapted yoghurt model generates relatively stable results. After four model simulations, where
the number of yoghurt shelf life days is gradually increased by one day at the time, the model had
a standard deviation between 0.05% and 0.19% in its waste percentage estimates for each extra
shelf life day added, cf. Figure 4.9 below.
66 Quested, T. (2013). 67 Average available shelf life of yoghurt in shops are 13.7 days. Lee, P., Osborn, S., & Whitehead, P. (2015), p. 16.
Total amount purchased in main shop (litres) 4 2 bottles
Total amount purchased in top-up shop (litres) 4 2 bottles
Is the fridge checked and a shopping list made? No 1 litres
If so, purchased quantity can vary in step sizes of: (litres) 1
Average shelf-life of millk 8.1 3 days
Standard Deviation 1.9
…bought as
…bought as
Once opened use
within
Trigger for top up
shop
Milk Purchasing
Total amount purchased in main shop (litres) 2 2 bottles
Total amount purchased in top-up shop (litres) 0 0 bottles
Is the fridge checked and a shopping list made? Yes 1 litres
If so, purchased quantity can vary in step sizes of: (litres) 1
Average shelf-life of yoghurt 13.7 5 days
Standard Deviation 3
…bought as
…bought as
Once opened use
within
Trigger for top up
shop
Yoghurt Purchasing
Tea/Coffee Cereal Cooking Drinking Total
No. opportunities to consumer (per day) 16 4 2 4
Probability of consumption for each occasion 0.5 0.5 0.15 0.35
Amount consumed on each occasion (ml) 20 150 600 150
Average number of consumption events (per day) 8.0 2.0 0.3 1.4
Average consumption (litres per household per day) 0.16 0.30 0.18 0.21 0.85
Average consumption (litres per household per wk) 1.12 2.10 1.26 1.47 5.95
Milk demand
Tea/Coffee Cereal Cooking Drinking Total
No. opportunities to consumer (per day) 1 1 1
Probability of consumption for each occasion 0.319 0.74 0.1
Amount consumed on each occasion (ml) 150 200 100
Average number of consumption events (per day) 0.3 0.7 0.1 0.0
Average consumption (litres per household per day) 0.05 0.15 0.01 0.00 0.21
Average consumption (litres per household per wk) 0.33 1.04 0.07 0.00 1.44
Yoghurt demand
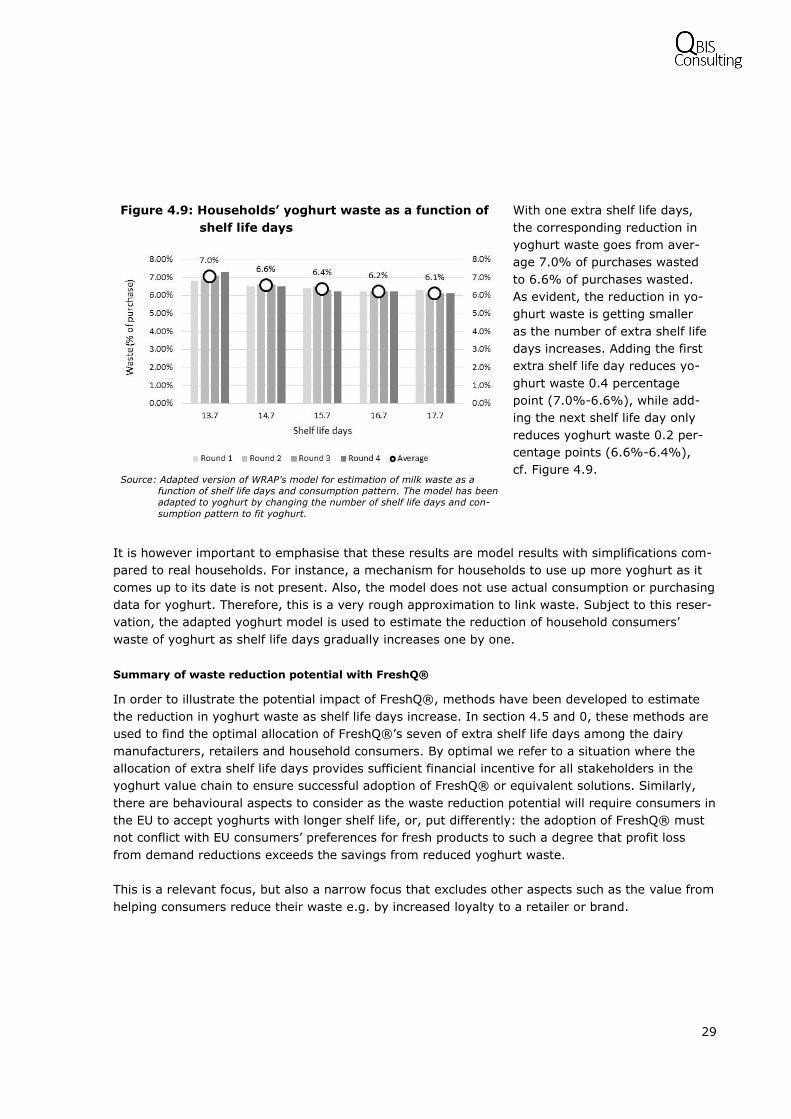
29
Figure 4.9: Households’ yoghurt waste as a function of
shelf life days
With one extra shelf life days,
the corresponding reduction in
yoghurt waste goes from aver-
age 7.0% of purchases wasted
to 6.6% of purchases wasted.
As evident, the reduction in yo-
ghurt waste is getting smaller
as the number of extra shelf life
days increases. Adding the first
extra shelf life day reduces yo-
ghurt waste 0.4 percentage
point (7.0%-6.6%), while add-
ing the next shelf life day only
reduces yoghurt waste 0.2 per-
centage points (6.6%-6.4%),
cf. Figure 4.9. Source: Adapted version of WRAP’s model for estimation of milk waste as a
function of shelf life days and consumption pattern. The model has been
adapted to yoghurt by changing the number of shelf life days and con-
sumption pattern to fit yoghurt.
It is however important to emphasise that these results are model results with simplifications com-
pared to real households. For instance, a mechanism for households to use up more yoghurt as it
comes up to its date is not present. Also, the model does not use actual consumption or purchasing
data for yoghurt. Therefore, this is a very rough approximation to link waste. Subject to this reser-
vation, the adapted yoghurt model is used to estimate the reduction of household consumers’
waste of yoghurt as shelf life days gradually increases one by one.
Summary of waste reduction potential with FreshQ®
In order to illustrate the potential impact of FreshQ®, methods have been developed to estimate
the reduction in yoghurt waste as shelf life days increase. In section 4.5 and 0, these methods are
used to find the optimal allocation of FreshQ®’s seven of extra shelf life days among the dairy
manufacturers, retailers and household consumers. By optimal we refer to a situation where the
allocation of extra shelf life days provides sufficient financial incentive for all stakeholders in the
yoghurt value chain to ensure successful adoption of FreshQ® or equivalent solutions. Similarly,
there are behavioural aspects to consider as the waste reduction potential will require consumers in
the EU to accept yoghurts with longer shelf life, or, put differently: the adoption of FreshQ® must
not conflict with EU consumers’ preferences for fresh products to such a degree that profit loss
from demand reductions exceeds the savings from reduced yoghurt waste.
This is a relevant focus, but also a narrow focus that excludes other aspects such as the value from
helping consumers reduce their waste e.g. by increased loyalty to a retailer or brand.

30
4.4 Step 4: Waste reduction costs with FreshQ®
An important first step in determining the net financial incentive for investing in reducing yoghurt
waste with FreshQ® is to assess whether dairy manufacturers will benefit or lose from such invest-
ment. Dairy manufacturers are the stakeholders that shall initiate the waste reduction by applying
FreshQ® in their production and are therefore a gatekeeper to change. If they stand to lose, it is
difficult to imagine FreshQ®’s waste reduction potential materialising.
Dairy manufacturers’ net return has been investigated by estimating the potential cost savings
from lower production batch frequency and comparing them to the costs of applying FreshQ®.
CH states that the average costs of FreshQ® is 0.017 EUR per kg of yoghurt. The estimated sav-
ings from applying FreshQ® to reduce batch frequency is 1.8%-2.7% of production, cf. section 4.3.
Using the market knowledge and experience of CH sales staff to roughly assess retail profit margin
and dairy manufacturing profit margin as well as annual reports to determine production costs out
of revenue for selected dairy manufacturer, the 1.8%-2.7% waste reduction can be translated into
production cost savings of 0.015-0.022 EUR per kg of yoghurt cf. Table 4.4 below.
Table 4.4: Estimated costs of reducing yoghurt waste for dairy manufacturers
No. Prices, costs and savings Low High Calculation
1. Price, consumers, EU-28 - weighted across both types of yoghurt, (EUR/kg) 1.3751 1.3751
2. Mark-up, retail to consumers, (% of consumer price) 30%2 30%2
3. Price, manufacturer to retail, (EUR/kg) 0.963 0.963 1.* (1 - (2.))
4. Production costs out of revenue, manufacturing, (% of revenue) 83%4 83%4
5. Production costs, manufacturing, (EUR/kg) 0.801 0.801 4. * (1 - (5.))
6. Waste reduction savings, (% of production) 1.8%5 2.7%5
7. Waste reduction savings, (EUR/kg) 0.015 0.022 6. * 7.
8. Production costs minus waste reduction saving, (EUR/kg) 0.786 0.779 6. - 8.
9. Costs of FreshQ®, (EUR/kg) 0.0176 0.0176
10. Production costs minus waste reduction saving plus FreshQ®, (EUR/kg) 0.803 0.796 9. - 10.
11. Net difference, (EUR/kg) -0.002 0.005 6. - 11.
1 PRODCOM, 2014, 10515241: Curdled milk, cream, yoghurt and other fermented products
10515245: Flavoured liquid yoghurt or acidified milk (curdled milk; cream; yoghurt and other fermented
products flavoured or containing added fruit; nuts or cocoa). 2 Assumption based on interviews with Chr. Hansen’s sales staff and dairies. 3 Assumption based on interviews with Chr. Hansen’s sales staff and dairies. 4 Calculated on the basis of annual reports from Danish dairies Arla and Thise. 5 See section 3.3. 6 CH.
As illustrated in Table 4.4, only if production waste is reduced 2.7%, i.e. the high estimate, will
dairy manufacturers get a net positive return from using FreshQ® to reduce their production. The
financial incentive for dairy manufacturers is therefore not necessarily present from the beginning.
Whether this is also the case for retailers and household consumers is discussed in the next sec-
tion.
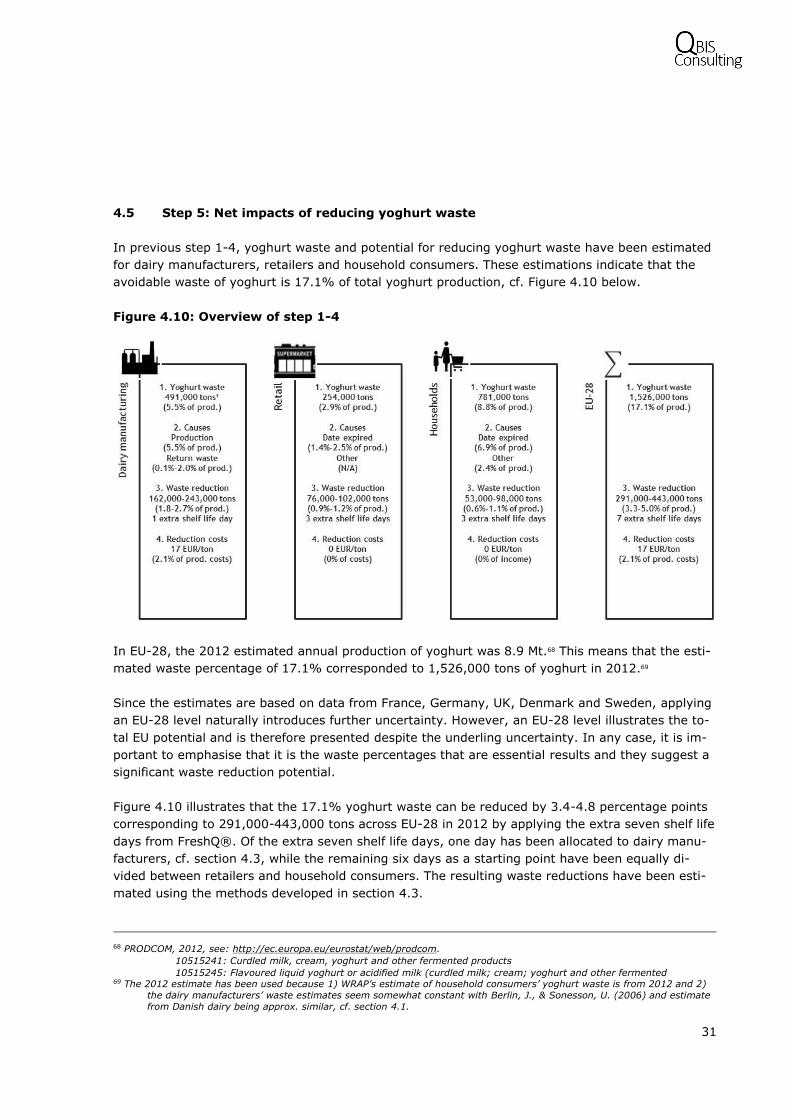
31
4.5 Step 5: Net impacts of reducing yoghurt waste
In previous step 1-4, yoghurt waste and potential for reducing yoghurt waste have been estimated
for dairy manufacturers, retailers and household consumers. These estimations indicate that the
avoidable waste of yoghurt is 17.1% of total yoghurt production, cf. Figure 4.10 below.
Figure 4.10: Overview of step 1-4
In EU-28, the 2012 estimated annual production of yoghurt was 8.9 Mt.68 This means that the esti-
mated waste percentage of 17.1% corresponded to 1,526,000 tons of yoghurt in 2012.69
Since the estimates are based on data from France, Germany, UK, Denmark and Sweden, applying
an EU-28 level naturally introduces further uncertainty. However, an EU-28 level illustrates the to-
tal EU potential and is therefore presented despite the underling uncertainty. In any case, it is im-
portant to emphasise that it is the waste percentages that are essential results and they suggest a
significant waste reduction potential.
Figure 4.10 illustrates that the 17.1% yoghurt waste can be reduced by 3.4-4.8 percentage points
corresponding to 291,000-443,000 tons across EU-28 in 2012 by applying the extra seven shelf life
days from FreshQ®. Of the extra seven shelf life days, one day has been allocated to dairy manu-
facturers, cf. section 4.3, while the remaining six days as a starting point have been equally di-
vided between retailers and household consumers. The resulting waste reductions have been esti-
mated using the methods developed in section 4.3.
68 PRODCOM, 2012, see: http://ec.europa.eu/eurostat/web/prodcom.
10515241: Curdled milk, cream, yoghurt and other fermented products
10515245: Flavoured liquid yoghurt or acidified milk (curdled milk; cream; yoghurt and other fermented 69 The 2012 estimate has been used because 1) WRAP’s estimate of household consumers’ yoghurt waste is from 2012 and 2)
the dairy manufacturers’ waste estimates seem somewhat constant with Berlin, J., & Sonesson, U. (2006) and estimate
from Danish dairy being approx. similar, cf. section 4.1.

32
However, even a significant potential does not materialise unless the responsible stakeholders have
sufficient incentive. Bioprotection solutions such as FreshQ® are readily available to dairy manu-
facturers and their shelf life extending effects well-documented. Nevertheless, bioprotection solu-
tions are not used to their full potential. This is mainly due to the (somewhat justified) perception
by dairies and retailers that European consumers will not readily accept longer shelf lives in their
fresh dairy products. Similarly, if shelf life of fresh dairy products in EU is extended and household
consumers’ waste are reduced, dairy producers and retailers will, all else being equal, sell less, un-
less consumers start consuming (or paying) more.
As a result, dairy producers and, to some extent, retailers in the EU currently do not have strong
economic incentives to experiment with shelf life enhancing food technologies such as FreshQ®. If
the waste reduction potential illustrated in this study is to be fully realized, there is therefore a
need to carefully consider how each of the main actors in the value chain – from dairy manufactur-
ers to retailers and consumers - can maximize their individual gains.
Consequently, the net impacts of applying FreshQ® for each of these stakeholders have been as-
sessed by considering cost savings from waste reduction, costs of applying FreshQ®, saved house-
hold income due to less waste and lost profit due to less consumer waste. As a starting point, one
extra shelf life day has been allocated to dairy manufacturers while the remaining six shelf life days
have been equally divided between retailers and household consumers. The results are illustrated
using yoghurt prices and volumes for EU-28, but can just as easily be calculated for a single coun-
try, cf. Table 4.5 below.70
Table 4.5: Net impacts of reducing yoghurt waste with FreshQ® in EU-28 – the baseline
scenario
Manufacturers Retailers Consumers Total
Low High Low High Low High Low High
Waste reduction (% of prod.) 1.8% 2.7% 0.9% 1.2% 0.6% 1.1% 3.3% 5.0%
Waste reduction (1,000 tons) 162 243 76 102 53 98 291 443
CO2 (1,000 tons) 178 267 95 129 67 123 341 520
Waste reduction savings (million EUR) 130 195 73 99 0 0 203 293
Costs of FreshQ (million EUR) -152 -152 0 0 0 0 -152 -152
Saved income (million EUR) 0 0 0 0 100 183 100 183
Lost profit (million EUR) -10 -18 -30 -55 0 0 -40 -73
Net savings (million EUR) -32 25 43 44 100 183 111 251
Source: Qbis.
A first observation is that consumers and society will benefit significantly from reducing yoghurt
waste. Even though consumer only get three extra shelf life days, they benefit significantly through
saved income. Also, since shelf life is only extended with three days, it is quite likely that consum-
ers will not notice the extension, which in turn can prevent consumers from substituting away from
yoghurt and a subsequent drop in demand.
70 Yoghurt prices and volumes are available at PRODCOM. See: http://ec.europa.eu/eurostat/web/prodcom

33
A second observation – and perhaps more surprising - is that retailers also will benefit from reduc-
ing yoghurt waste. Even though they lose profit due to declining demand caused by reduced house-
hold consumer waste, the cost savings from reduction of their own yoghurt waste more than off-
sets the lost profit. This is however not necessarily the case for the dairy manufacturers. Even
though they save more costs from reduction of their waste than retailers, the costs of FreshQ®,
which they alone bear, can result in negative net savings. However, as illustrated below, if some of
the retailers’ costs savings are passed on to the dairy manufacturers by means of less product re-
turn, the net impacts change rapidly.
A third observation is that there are huge environmental benefits from reducing yoghurt waste. The
total CO2 emissions from producing, distributing and storing one kilo of yoghurt is around 1.2 to
1.3 kilo CO2 depending on type of yoghurt.71 This means that the potential waste reduction of
291,000-443,000 tons in turn can reduce CO2 emissions by 341,000-520,000 tons.
In summary, the only value chain stakeholder that does not necessarily benefit from reducing yo-
ghurt waste is the dairy manufacturers. Since they are the ones that shall initiate the waste reduc-
tion by applying FreshQ® in their production, this is critical both from an economic as well as an
environmental perspective. However, there are a number of reasons why the above baseline as-
sessment might not be the most likely situation to materialise. This is discussed in the next sec-
tion.
4.6 Step 6: What it takes to create financial incentives for dairy manufacturers,
retailer and consumers
Baseline: Consumers and retailers get 3 more shelf days each
As just described, the baseline assessment does not provide financial incentives for all stakeholders
as the medium estimate (average between high and low estimates) suggests a net loss of EUR 3
million from the waste reduction provided by FreshQ®, cf. Baseline figure below.
Lever 1: Consumers get one extra shelf life day and retailers get five extra shelf life days
One way to create financial incentive all stakeholders including dairy manufacturers is to chance
the baseline’s split with three extra shelf life days to both retailers and household consumers. If
less than three shelf life days are allocated to the household consumers, the lost profit due to de-
clining demand caused by reduced household consumer waste will be reduced and in turn improve
the financial incentives for retailers and dairy manufacturers. By varying the allocation extra shelf
life days across the value chain stake holder, it is evident that it is necessary to allocate five extra
shelf life days to retailers and just one extra shelf life day to household consumers in order to
achieve positive net savings for all stakeholders, cf. Lever 1 below. This new allocation actually in-
creases the overall waste reduction percentage slightly from 4.1% to 4.2% out of total production,
which means that financial incentive can be created without impairing overall waste reduction for
society. This is due to the analysis’ assessment of a more modest reduction in yoghurt waste for
71 Research Institute of Organic Agriculture (FIBL), see: https://www.fibl.org/fileadmin/documents/de/oesterreich/ar-
beitsschwerpunkte/Klima/Presentation_Schader_Biofach_1002.pdf and Ministry of Environment and Food of Denmark, see:
https://naturerhverv.dk/fileadmin/user_upload/NaturErhverv/Filer/Tvaergaaende/Foedevarernes_klimaaftryk_tabel_1.pdf

34
household consumers than retailers when given more shelf life days, cf. section 4.3. As this assess-
ment is subject to uncertainty, the status quo result for society can easily change to a situation
with less overall waste reduction.
Baseline: Consumers and retailers get 3
more shelf life days each
(4.1% waste reduction)
Lever 1: Consumers get 1 more shelf life
day and retailers get 5 more shelf
life days (4.2% waste reduction)
Source: Qbis Source: Qbis
Lever 2: 10% of the retailers’ waste reduction savings are reallocated to the dairy manufacturers
In addition to changing the allocation of extra shelf life days, another factor might also change the
distribution of the net savings among the value chain stakeholders in the baseline estimation. Ac-
cording to interviews with CH sales people and dairy manufacturers, waste due to product return to
dairy manufacturers from retailers’ warehouses seems to be quite common in UK, France, Germany
and Denmark, even though the waste generated from this arrangement varies greatly correspond-
ing to around 0.1%-2.0% of total yoghurt production.
It is therefore possible that reallocating of some of the retailers’ savings from waste reduction to
the dairy manufacturer can improve the financial incentive of dairy manufacturers. The analysis
shows that if just 10% of the retailers’ waste reduction savings are reallocated to the dairy manu-
facturers in the baseline assessment corresponding to 0.1% of total yoghurt production, the dairy
manufacturers will have a positive net saving from using FreshQ®, cf. Lever 2 below.
Lever 3: Maximum waste reduction for consumers with 6 more shelf life days
Will creating financial incentive for all stakeholders mean a loss for society in terms of less than op-
timal waste reduction from FreshQ®? This issue has been addressed by allocating all off the six
available extra shelf life days to consumers and zero days to retailers. While this allocation in-
creases consumers’ saved income from EUR 141 million to EUR 238 million and reduces retailers’
waste reduction saving to zero, it does not create additional benefits to society. Actually, the over-
all net savings are reduced from EUR 181 million to EUR 154 million, cf. Lever 3 below.
This is because consumers waste reduction savings are assessed to have a relatively modest pro-
gression as extra shelf life days are added to their yoghurts’ total shelf life, cf. section 4.3. As this
progression is predicted by the adapted milk model and as such is the result of model simulations

35
rather than real life measurements, the result can turn out to be inaccurate in which case creating
financial incentives for all stakeholders can result in a price for society in terms of less than optimal
waste reduction from FreshQ®.
Lever 2: 10% product return arrange-
ments in baseline
(4.1% waste reduction)
Lever 3: Maximum waste reduction for con-
sumers with 6 more shelf life days
(3.7% waste reduction)
Source: Qbis Source: Qbis
What about prices?
When demand changes, it is important to investigate what happens to prices. However, probability
of higher prices is assessed as low because the mini-consumer survey and existing market experi-
ence suggest that consumers will not be willing to pay higher prices for yoghurt with longer shelf
life. Similarly, the probability of lower prices is also assessed as low given the above scenarios con-
sider situations with one or three extra shelf life days to consumers. Thus, with one extra shelf life
day, demand is expected to be reduced 0.3%-0.8% and with three extra shelf life days, demand is
expected to be reduced 0.6%-1.1%. I.e. both very modest demand reductions. In addition, it has
not been possible to find studies of demand price elasticities for yoghurt in the European markets.
The closest is a 2010 US study estimating price elasticities to -0.16 for refrigerated yoghurt and -
0.60 for drinkable yoghurt.72 This would in turn mean very low price reductions. Finally, considering
price mark-up is assessed 10% for dairy manufacturers and 30% for retailers, the corresponding
profit loss is a tenth and a third of the price reduction. On the basis of these considerations, price
reactions have not been included in the analysis. It will however be important to include price reac-
tions, if demand changes more than anticipated in the above scenarios or if other waste reduction
measures are investigated.
Summary of supply chain incentives for reducing yoghurt waste
The objective of the further development of the baseline assessment is to illustrate what it will take
to create financial incentive for all value chain stakeholders including dairy manufacturers when us-
ing FreshQ® to reduce yoghurt waste as well as to investigate a possible trade-off of creating fi-
72 See: http://ageconsearch.umn.edu/bitstream/139041/2/Davis_41_2.pdf
36
nancial incentive. It shows that extra shelf life days to retailers and fewer to the household con-
sumers or 10% product return from retailers to dairy manufacturers both will improve the net sav-
ings for dairy manufacturers sufficient to create financial incentive for all value chain stakeholder.
Hopefully, these further developments of the baseline assessment can bring new perspectives and
lead to new discussions about the feasibility of reducing yoghurt waste among dairy manufacturers,
retailers and also consumers. Such discussion with value chain stakeholders would also be valuable
in the sense that they would test the validity of the underlying estimations and assumptions in the
study and as such substantiate or alter the findings. Also, such discussions could lead to new sce-
narios as the four presented in no way cover the many possible outcomes when reducing yoghurt
waste.
Assumptions and uncertainty factors in the analysis and results
When using the results, it is important to do so with caution. The analysis and its results are based
on a number of assumptions and generalisations that will generate uncertainty, notably:
- Data is not complete and it has been necessary to assume that waste percentages and
waste causes observed at stakeholders in one country also are valid for other stakeholders
in other countries. For instance, household consumers’ waste percentages and waste
causes in the UK are assumed representative for household consumers in other EU coun-
tries. Similar generalisations have been applied to dairy manufacturers’ and retailers’ waste
percentages and waste causes.
- Apart from dairy manufacturers, assessment of the value chain stakeholders’ response to
longer shelf life days is based on studies from just one country. For the retailers’ response
to longer shelf life days, it is a case study from France and for the household consumers’
response to longer shelf life days, it is a behavioural model from the UK.
These factors will lead to uncertainty and it is therefore important to use the findings as indications
of the potential of reducing waste rather than hard facts given the uncertainty associated with such
assessments.

37
4.7 Results of the mini-consumer survey
In addition to financial incentives, consumer preferences can be important barriers to reducing yo-
ghurt waste with longer shelf life. As mentioned, dairy manufacturers and retailers are often con-
vinced that European consumers will not readily accept longer shelf lives in their fresh dairy prod-
ucts as this implies reduced freshness. Consequently, extending shelf life with three days as pro-
posed could risk reducing demand simply due to consumer preferences for perceived freshness and
in turn undermine the potential positive net savings. Alternatively, the fear of this happening could
prevent dairy manufacturers from even considering reducing yoghurt waste via longer shelf life.
It is therefore paramount to test consumers’ preferences for freshness generally as well as specifi-
cally in the light of the potential for reducing their food waste. Such testing would ideally require
measuring waste and purchases before and after a change in shelf life. This is unfortunate outside
the scope of this study, but in order to provide at least some sort of indication of consumers’ pref-
erences, a mini-survey has been carried out. It was conducted in Denmark, where preferences for
freshness generally are ranked high among consumers, and the approach was simply to ask con-
sumers a number of questions regarding yoghurt before entering one of the shops of three of the
biggest retailers in Denmark.73 A total of 70 respondents participated in the survey and they could
answer by agreeing or disagreeing with different statements. The levels of agreement and disa-
greement went from one to ten with one being in full agreement and 10 being in complete disa-
greement.
Question 1 was whether consumers always try to find the yoghurt with the longest remaining shelf
life when buying yoghurt. The answers to that questions were relatively unambiguous with 53 an-
swers in agreement (1-5) out of a total of 63 answers, cf. Question 1 below.
Question 2 was whether consumers always would buy a yoghurt longer shelf life than their normal
yoghurt, if they could save money. Consumers were evenly divided to that question with approx.
one half being in agreement (1-5) and the other half being in disagreement (6-10), cf. Question 2
below.
Question 3 was whether consumers wanted to buy yoghurt with longer shelf life than their normal
yoghurt, if it enables them to reduce food waste. Similar to question 2, consumers were evenly di-
vided to that question with approx. one half being in agreement (1-5) and the other half being in
disagreement (6-10), cf. Question 3 below.
Question 4 was whether it was important to consumers that their yoghurt is natural, and does not
include artificial additives (E-numbers) to prolong shelf life. Similar to question 1, the answers were
relatively unambiguous with 49 answers in agreement (1-5) out of a total of 67 answers, cf. Ques-
tion 4 below.
73 The shops were Netto and Føtex (owned by Dansk Supermarked w. approx. 30% market share) and Superbrugsen (owned
by COOP w. approx. 42% market share).
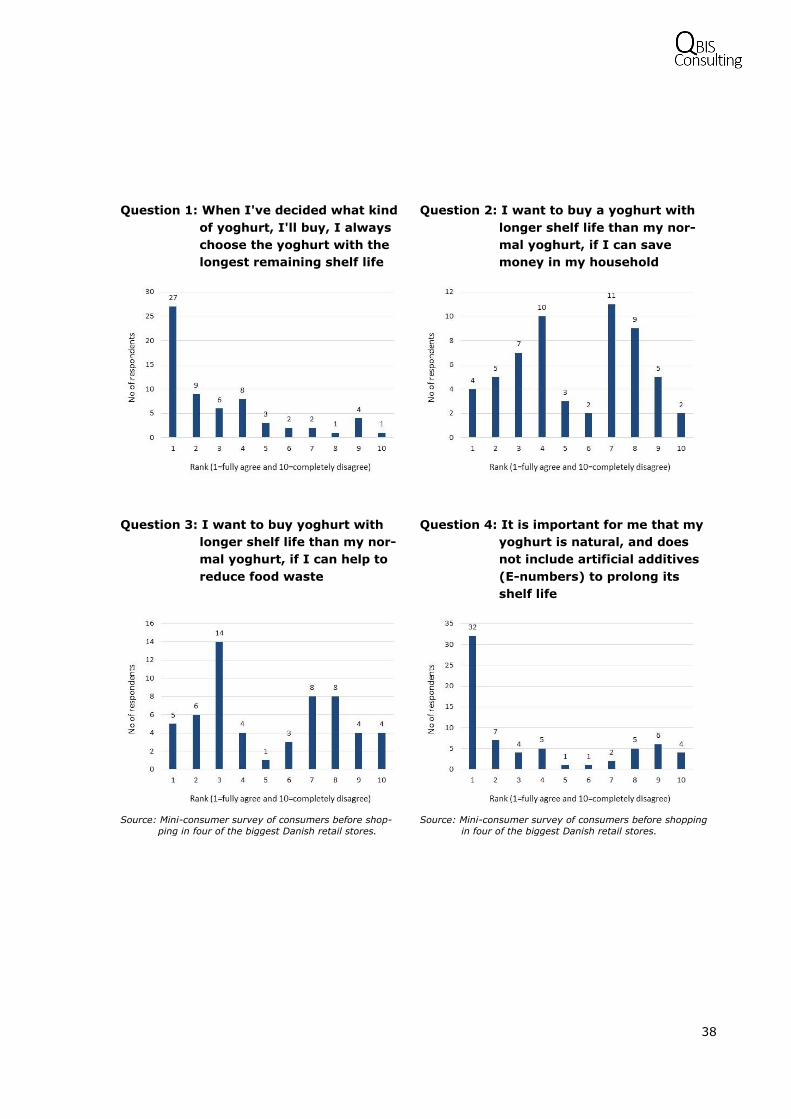
38
Question 1: When I've decided what kind
of yoghurt, I'll buy, I always
choose the yoghurt with the
longest remaining shelf life
Question 2: I want to buy a yoghurt with
longer shelf life than my nor-
mal yoghurt, if I can save
money in my household
Question 3: I want to buy yoghurt with
longer shelf life than my nor-
mal yoghurt, if I can help to
reduce food waste
Question 4: It is important for me that my
yoghurt is natural, and does
not include artificial additives
(E-numbers) to prolong its
shelf life
Source: Mini-consumer survey of consumers before shop-
ping in four of the biggest Danish retail stores.
Source: Mini-consumer survey of consumers before shopping
in four of the biggest Danish retail stores.
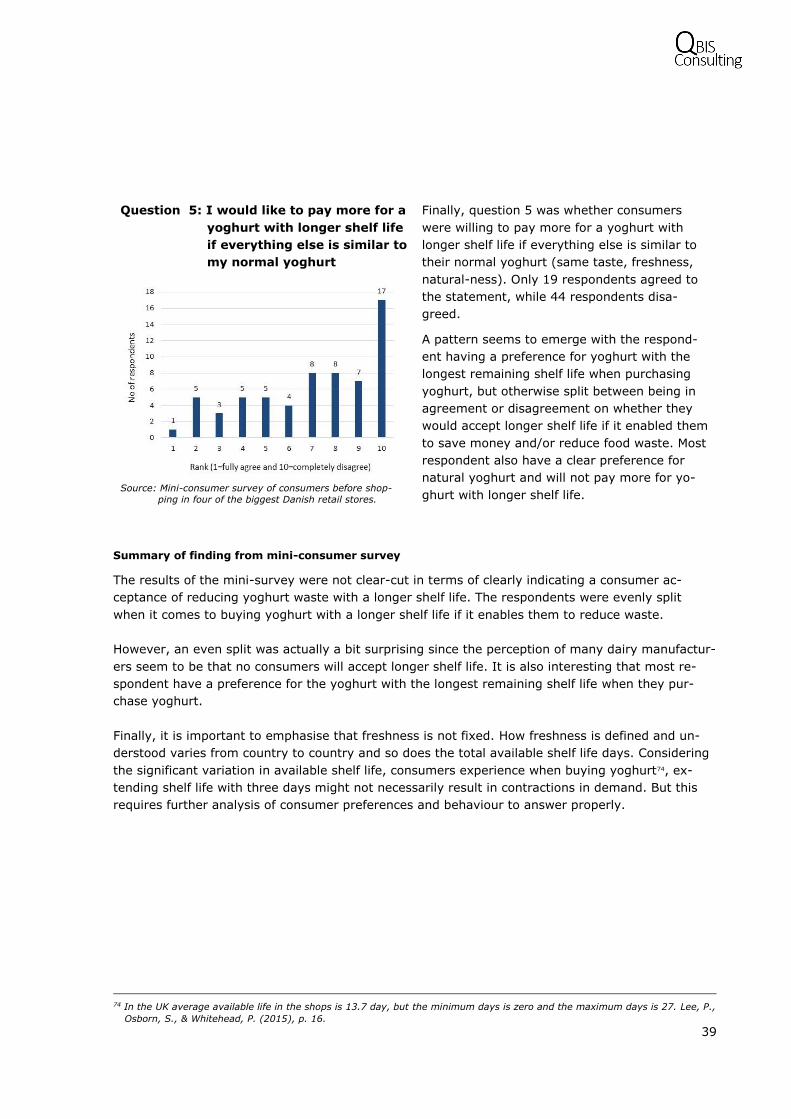
39
Question 5: I would like to pay more for a
yoghurt with longer shelf life
if everything else is similar to
my normal yoghurt
Finally, question 5 was whether consumers
were willing to pay more for a yoghurt with
longer shelf life if everything else is similar to
their normal yoghurt (same taste, freshness,
natural-ness). Only 19 respondents agreed to
the statement, while 44 respondents disa-
greed.
A pattern seems to emerge with the respond-
ent having a preference for yoghurt with the
longest remaining shelf life when purchasing
yoghurt, but otherwise split between being in
agreement or disagreement on whether they
would accept longer shelf life if it enabled them
to save money and/or reduce food waste. Most
respondent also have a clear preference for
natural yoghurt and will not pay more for yo-
ghurt with longer shelf life.
Source: Mini-consumer survey of consumers before shop-
ping in four of the biggest Danish retail stores.
Summary of finding from mini-consumer survey
The results of the mini-survey were not clear-cut in terms of clearly indicating a consumer ac-
ceptance of reducing yoghurt waste with a longer shelf life. The respondents were evenly split
when it comes to buying yoghurt with a longer shelf life if it enables them to reduce waste.
However, an even split was actually a bit surprising since the perception of many dairy manufactur-
ers seem to be that no consumers will accept longer shelf life. It is also interesting that most re-
spondent have a preference for the yoghurt with the longest remaining shelf life when they pur-
chase yoghurt.
Finally, it is important to emphasise that freshness is not fixed. How freshness is defined and un-
derstood varies from country to country and so does the total available shelf life days. Considering
the significant variation in available shelf life, consumers experience when buying yoghurt74, ex-
tending shelf life with three days might not necessarily result in contractions in demand. But this
requires further analysis of consumer preferences and behaviour to answer properly.
74 In the UK average available life in the shops is 13.7 day, but the minimum days is zero and the maximum days is 27. Lee, P.,
Osborn, S., & Whitehead, P. (2015), p. 16.

40
5 List of references
Articles, journals and reports
Agriculture and Agri-Food Canada (2015). Dairy Products, Western Europe. Global Analysis Report.
Bauquis, C. (2015). Study on the retail sector – How French retailers look at the value of shelf life
for dairy products? Master’s thesis, not published.
Berlin, J. (2005). Environmental Improvements of the Post-Farm Dairy Chain: Production Manage-
ment by Systems Analysis Methods. Thesis for Degree of Doctor of Philosophy. Department
of Energy and Environment, Chalmers University of Technology, Göteborg.
Berlin, J., & Sonesson, U. (2006). Minimising Environmental Impact by Sequencing Cultured Dairy
Products: Two Case Studies. Journal of Cleaner Production, 16(4), 483-498.
Bundesministerium für Ernährung und Landwirtschaft (2015). Deutschland, wie es isst – Der BMEL-
Ernährungsreport 2016. Berlin.
Buzby, J. C., Wells, H. F., & Hyman, J. (2014). The Estimated Amount, Value, and Calories of Post-
harvest Food Losses at the Retail and Consumer Levels in the United States. U.S. Depart-
ment of Agriculture, Economic Research Service.
Chapagain, A., & James, K. (2011). The water and carbon footprint of household food and drink
waste in the UK. WRAP & WWF.
Clune, S., Crossin, E., & Verghese, K. (2016). Systematic review of greenhouse gas emissions for
different fresh food categories. Journal of Cleaner Production.
Eriksson, M. (2014). Retail Food Wastage: A Case Study Approach to Quantities and Causes. Fac-
ulty of Natural Resources and Agricultural Sciences, Department of Energy and Technology,
Uppsala.
European Commission, Directorate C (2003). On a generic approach to the safety assessment of
micro-organisms used in feed/food and feed/food production.
European Parliamentary Research Service, Briefing (2014). Tackling food waste: The EU's contribu-
tion to a global issue.
Foster, C., Green, K., Bleda, M.. Dewick, P., Evans, B., Flynn, A., & Mylan, J. (2006). Environmen-
tal impacts of food production and consumption. Manchester Business School. DEFRA, Lon-
don.
FUSIONS (2015a). Food waste data set for EU-28 – New Estimates and Environmental Impact.
FUSIONS (2015b). Criteria for and baseline assessment of environmental and socio-economic im-
pacts of food waste.
FUSIONS (2014). Drivers of current food waste generation, threats of future increase and opportu-
nities for reduction.
FUSIONS (2016). Estimates of European food waste levels.
General Directorate for Risk Prevention (2011). Food wastage study mid-term report. Ministry of
Ecology, Sustainable development, Transport and Housing, France.
Gustavsson, J., Cederberg, C., & Sonesen, U. (2011). Global Food Losses and Waste – Extent,
causes and prevention. Food and Agriculture Organisation of the United Nations
41
Hamerschlag, K. (2011). Meat Eater’s guide to climate change + health. Environmental Working
Group/EWG.
Ingrediensforum (2013). Fødevareingredienser – En dansk styrkeposition. Instituttet for Fødevare-
studier & Agroindustriel Udvikling (IFAU).
Landbrug & Fødevarer (2015). MADSPILD I DANMARK – Et overblik over undersøgelser og igang-
værende projekter om madspildet i Danmark. Copenhagen.
Lee, P., Osborn, S., & Whitehead, P. (2015). Reducing food waste by extending product life. WRAP.
Lyndhurst, B. (2011). Consumer insight: date labels and storage guidance. WRAP.
MacBean, R. D. (2010). Packaging and the Shelf Life of Yoghurt. Chapter 8 in Food Packaging and
Shelf Life – A Practical Guide by Robertson, G. CRC Press, 143–156
Marbjerg, M., Dvinge, C., & Høyrup, J. F. (2016). Madspild: Forstudie af forbrugeradfærd med hen-
blik på nudging. Undgå affald, stop spild, 10. Miljø- og Fødevareministeriet, København.
Monier, V., Escalon, V., & O’Connor, C. (2010). Preparatory study on food waste across EU 27. BIO
Intelligence Service, European Commission.
Okawa, K. (2015). Market and Trade Impacts of Food Loss and Waste Reduction. OECD Food, Ag-
riculture and Fisheries Papers, 75
Oliver Wyman (2014). Reducing food waste - how can retailers help? Marsh & McLennan Compa-
nies.
Parfitt, J., Barthel, M. & Macnaughton, S. (2010). Food waste within food supply chains: quantifica-
tion and potential for change to 2050. Philos Trans R Soc Lond B Biol Sci, 27, 3065–3081.
Parfitt, J., Woodham, S., Swan, E., Castella, T., & Parry, A. (2016). Quantification of food surplus,
waste and related materials in the grocery supply chain. WRAP.
Priefer, C., Jörissen, J., & Bräutigam, K.R. (2013). Technology options for feeding 10 billion people
– Options for Cutting Food Waste. Science and Technology Options Assessment (STOA),
Brussels.
Quested, T., Ingle, R., & Parry, A. (2013). Household Food and Drink Waste in the United Kingdom
2012. WRAP.
Quested, T., & Murphy, L. (2014). Household food and drink waste: A product focus. WRAP.
Quested, T. (2013). The Milk Model: Simulating Food Waste in the Home. WRAP.
Rutten, M., Verma, M., Mhlanga, N., & Bucatariu, C. (2015). Potential impacts on sub-Saharan Af-
rica of reducing food loss and waste in the European Union - A focus on food prices and
price transmission effects. FAO and LEI Wageningen, Rome.
Rutten, M. (2013). What economic theory tells us about the impacts of reducing food losses and/or
waste: implications for research, policy and practice”, Agriculture & Food Security, 2:13.
Sedghi, A. (2015). UK tops chart of EU food waste. Retrieved June 27, 2016, from
http://www.theguardian.com/world/2015/may/22/uk-tops-chart-of-eu-food-waste
Sonigo, P., Bain, J., Tan, A. Mudgal, S., Murphy-Bokern, D., Shields, L., Aiking, H., Verburg, P.,
Erb, K., & Kastner, T. (2012). Assessment of resource efficiency in the food cycle. BIO In-
telligence Service, EU Commission.
Stenmarck, Å., Hanssen, O. J., Silvennoinen, K., Katajajuuri, J., & Werge, M. (2011). Initiatives on
prevention of food waste in the retail and wholesale trades. IVL, Swedish Environmental
Research Institute, Stockholm.

42
Sundh, I., Wilcks, A., & Goettel, M. S. (2012). Beneficial microorganisms in agriculture, food and
the environment: safety assessment and regulation. CABI, United Kingdom.
Vanham, D., Bouraoui, F., Leip, A. Grizzetti, B., % Bidoglio, G. (2015). Lost water and nitrogen re-
sources due to EU consumer food waste. Environmental Research Letters, 10, 8.
Venkat, K. (2011). The Climate Change and Economic Impacts of Food Waste in the United States.
Int. J. Food System Dynamics, 2 (4), 431-446.
Ventour, L. (2008). The food we waste. WRAP.
Whitehead, P., Parfitt, J., Bojczuk, K., & James, K. (2013). Estimates of waste in the food and drink
supply chain. WRAP.
WRAP research brief. Estimates of Food and Packaging Waste in the UK Grocery Retail and Hospi-
tality Supply Chains. Publication year and authors unknown. Retrieved from WRAP’s web-
site.
Websites and links
2014/15 Annual Report, Chr. Hansen A/S. Retrieved from http://d1p5pqcd07w67z.cloud-
front.net/_/media/461c9571afdc492cbffdf176513c8019.pdf?la=en-us&vs=1
2014/15 Corporate Social Responsibility Report, Chr. Hansen A/S. Retrieved from
http://d1p5pqcd07w67z.cloudfront.net/_/media/files/chrhansen/home/cards/down-
loadable-cards/csr/reporting-and-disclosure/communication-on-progress-1415.pdf?vs=1
A cultures and enzymes Q&A. Retrieved June 27, 2016, from http://www.dairyfoods.com/arti-
cles/89607-a-cultures-and-enzymes-qa
Cultures and enzymes can increase yields. Retrieved June 27, 2016, from
http://www.dairyfoods.com/articles/90522-cultures-and-enzymes-can-increase-yields
DuPont Nutrition & Health Introduces a New Generation of Protective Dairy Cultures. Retrieved
June 27, 2016, from http://www.dairyfoods.com/articles/89970-dupont-nutrition-health-
introduces-a-new-generation-of-protective-dairy-cultures
EUROSTAT. Retrieved June 27, 2016, from http://ec.europa.eu/eurostat
FAOSTAT. Retrieved June 27, 2016, from http://faostat3.fao.org/home/E
Global Food Waste: The Numbers Behind the Problem. FAO. Retrieved June 27, 2016, from
http://insinkerator.co.uk/uk/page/global-food-waste-stats
Key facts on food loss and waste you should know! FAO. Retrieved June 27, 2016, from
http://www.fao.org/save-food/resources/keyfindings/en/
Making sense of dairy cultures. Retrieved June 27, 2016, from http://www.dairyfoods.com/arti-
cles/91213-making-sense-of-dairy-cultures
New yoghurt process extends shelf life. Retrieved June 27, 2016, from http://www.nutraingredi-
ents-usa.com/Ingredients/Dairy-based-ingredients/New-yoghurt-process-extends-shelf life
UN Sustainable Development Goals. Retrieved June 27, 2016, from https://sustainabledevelop-
ment.un.org/?menu=1300

43
Appendix A: Expert review
Review by Tom Quested from WRAP
I have reviewed the white paper Reducing food waste and losses in the fresh dairy supply chain.
The initial review was on a version of the paper dated 23rd September 2016, with a subsequent
check of the version on the 30th September.
The paper contains an analysis of the potential impact of introducing a bio-protective culture to yo-
ghurt, which increases the shelf life of the product. The resultant effect on waste levels within the
following is assessed: diary manufacturers, retailers, households. It examines the changes in waste
levels and the associated economic impacts for each of these three groups to understand how in-
centives are distributed. Furthermore, it explores a number of ‘levers’ – different ways of distrib-
uting the extra shelf-life and savings – to find situations in which all the sectors studies have a pos-
itive outcome.
The authors have used existing information from a wide range of sources effectively. In addition,
they have obtained new information where necessarily and feasible. The analysis conducted ap-
pears robust and the results of this analysis support the conclusions made. With studies of this
type, assumptions have to be used. Those used in this study are reasonable and have been de-
scribed in the report. Their implications on the results acknowledged.
The initial review of the paper highlighted a small number of areas for improvement, relating to de-
tails of the analysis and the presentation of the results. These suggestions were acted upon and
were incorporated into the later version of the paper seen.
Currently studies examining the potential for and implications of food-waste reduction are limited –
they do not cover the wide range of products and sectors that could potentially generate less food
waste. Of the existing studies, there are very few examining yoghurt waste and none that I am
aware of that take a whole chain approach (for any product). As such, this paper represents a posi-
tive contribution to the existing evidence base. Furthermore, by focusing on a practical question
about incentives, it should help facilitate real change with a positive environmental and economic
impact.
Tom Quested, WRAP
30th September 2016