milk and dairy products, post-harvest losses and food
TRANSCRIPT

FAO Prevention of Food Losses Programme Milk and Dairy Products, Post-harvest Losses and Food
Safety in Sub-Saharan Africa and the Near East.
FA
FI
AT P A N
IS
O
A Review Of The Small Scale Dairy Sector – Kenya
H.G. Muriuki June 2003
1

Acronyms ASAL Arid and Semi-arid Lands CBOs Community based Organisations CBS Central Bureau of Statistics CCPs Critical Control Points CPC Coliform Plate Count DALP Director of Agriculture and Livestock Production ECF East Coast Fever FAO Food and Agricultural Organization of the United Nations GDP Gross Domestic Product HMPL High and Medium Potential Lands ILRI International Livestock Research Institute KCC Kenya Cooperative Creameries Limited KDB Kenya Dairy Board KEBS Kenya Bureau of Standards LME Liquid Milk Equivalent LPS Lactoperoxidase System MoALD Ministry of Agriculture and Livestock Development MoALD&M Ministry of Agriculture, Livestock Development & Marketing MoARD Ministry of Agriculture and Rural Development MoLD Ministry of Livestock Development NGO Non-governmental Organisations PH Public Health SDP Smallholder Dairy Project SDDLP Senior Deputy Director of Livestock Production SHG Self Help Group
2

TABLE OF CONTENT Page
Executive Summary ................................................................................................. 5 Introduction .................................................................................................................. 8 Background ................................................................................................................ 10 Current situation of the Smallholder dairy sector in Kenya .............. 11
Policy........................................................................................................................... 11 Relevant Dairy Institutions and their Roles....................................................... 14 Dairy production....................................................................................................... 16 Milk marketing and marketing channels............................................................ 19 Post harvest losses.................................................................................................... 21 Milk Consumption and consumer preference ................................................... 22 Public Health risk posed by milk and dairy products ..................................... 26 Dairy information systems..................................................................................... 29 Kenya dairy industry Strengths, Weaknesses, Opportunities and Threats (SWOT) ...................................................................................................................... 32
Strengths ................................................................................................................... 33 Weaknesses ............................................................................................................... 34 Opportunities............................................................................................................. 37 Threats....................................................................................................................... 39
Future of the Kenya dairy industry and the role of the small scale dairy farmers.............................................................................................................. 40
Potential for Small Scale Dairy Farmers and their organisations ................ 40 The informal sub-sector and improvement programmes in the dairy industry ....................................................................................................................... 41 Reduction of post harvest losses of milk and dairy products........................ 44 Critical points in the dairy industry where quality and safety can be improved..................................................................................................................... 46 Identification of Critical Control Points (CCPs) .............................................. 47
Risk factors in market channels ................................................................................ 47 Critical Control Points for Adulteration ................................................................... 47 Critical Control Points for Total Plate Counts.......................................................... 47 Critical Control Points for Coliform Counts............................................................. 47 Critical Control Points Brucellosis and M. Bovis ..................................................... 48 Critical Control Points for Antimicrobials................................................................ 48 Critical Control Points in consumer milk purchase points ....................................... 48 Consumer perceptions and practices to reduce milk-borne health risks................... 49
Results and Recommendation from Kenya National dairy sub-sector Assessment ................................................................................................... 50
Policy & Legal Framework ................................................................................... 50 Post Harvest milk losses......................................................................................... 50
3

Critical points in the dairy chain .......................................................................... 51 Dairy information systems..................................................................................... 51
Recommendations and possible project interventions.......................... 52 Informal sector Training and Technology transfer (based on CCPs) ......... 52
Farm level Training................................................................................................... 52 Co-operatives/Groups and Large scale traders ......................................................... 52 Milk bars, Kiosks and Shops .................................................................................... 52 Mobile traders ........................................................................................................... 53
Common ground and issues................................................................................... 53 Technology transfer................................................................................................. 53 Awareness raising on Dairy products safety ..................................................... 54 Information needs for the Kenya dairy industry .............................................. 54
References................................................................................................................... 56
4

Executive Summary
Kenya has about 31 million people and growing at a rate of 2.5 percent per year (CBS 2001). Agriculture contributes over 25 percent of the GDP. Close to 80 percent of the population live in the rural areas and derive much of their livelihood from land i.e. crops and livestock. Sixteen percent of the country is High and Medium Potential Land (HMPL) while the remaining 84 percent, supporting about 25 percent of the human population, is classified as Arid and Semi-Arid Land (ASAL) areas where livestock is almost the sole source of livelihood for the communities living in the area. Livestock contributes about 50 percent of Agricultural GDP and over 10 percent of the national GDP. Dairy production, the largest contributor to the livestock GDP, accounts for an estimated 33 percent of the agricultural GDP (Staal et al., 2003). Dairy production in Kenya is smallholder dominated. Market-oriented dairying dates back to the early 20th century but indigenous Kenyans were only allowed to engage in commercial dairy after the Swynnerton Plan of 1954 (Conelly 1998). There was a rapid transfer of dairy cattle from the settler farms to the smallholders soon after independence in 1963. The government policy mix that followed, combined with direct intervention and statutory control of production and market activities, benefited smallholder dairy production and marketing. These highly subsidised interventions were however not sustainable and by the 1980s, the quality of livestock services provided by the government had declined, prompting it to adopt reforms such as structural adjustment and economic restructuring (Ngigi M.W. 2002). The success of dairy production by smallholders is also a result of presence of a significant dairy cattle population, the importance of milk for most Kenyan communities, a suitable climate and an enabling policy and institutional environment (Conelly 1998; Thorpe et al. 2000). The first direct and comprehensive dairy policy was published in 1993, emphasising gradual phasing out of Government interventions (MoALD, 1993). Reforms have however faced a lot of difficulties including disharmony between the pronounced and the written policies. Over the last 10 years, dairy policy emphasis has been on liberalisation and reform of both the KCC and KDB. The main thrust in KDB reform is to focus more on dairy industry development, regulation and promotional activities (MOARD, 2001). Issues of raw milk sales and itinerant traders (hawkers) remains contentious despite the fact that direct raw sales from producer to consumer comprise about 36 percent and small milk traders handle another 28 percent of marketed raw milk (Staal et al, 1999). The dairy industry, dominated by small-scale, is the most developed of the livestock sub-sectors in Kenya and is comparatively well developed relative to the dairy industries of other countries in sub-Saharan Africa. Development of smallholder dairy production systems in the Kenya highlands has been marked by declining farm size, upgrading to dairy breeds and an increasing reliance on purchased feeds, both concentrates and forage (Staal et al. 1997). The major milk
5

production constraints are the level of dairy cattle feeding, disease challenges and animal genetics to some extent. Less than 15 percent of marketed milk flows through milk processors (Thorpe et al. 2000). The rest is sold as raw milk through direct sales to consumers by farm households (58 percent) and milk collected by dairy co-operative societies, self help groups and individual milk traders who also sell some directly to consumers. The magnitude of post harvest losses in Kenya is not well documented. Milk losses through co-operative societies may be at between 1 to 5 percent on average but can go up to over 10 percent in the wet season when delivery rejections are common. Lack of market for the milk above home needs can also be termed as a loss and estimates for the “forced consumption” depend on seasons and can go up to as high as 50 percent (MoLD, 1991). Little is known about the real demand for milk and milk products in Kenya but consumption of dairy products is principally in the form of liquid milk, mainly raw (after boiling), with higher amounts of milk consumed in some rural areas compared to urban areas. Kenya is however self sufficient in milk and milk products except during extreme weather conditions and given the current economic situation, where real income levels seem to be declining, and going by the past trends, supply and demand balance is not expected to change significantly in the near future. Since the liberalization of the dairy industry in Kenya there has been public concern and debate on health risks posed by the sale of raw milk by small traders. A Public Health Risks study to address the lack of accurate information on milk-borne health risks, and the need to define practical steps to optimise milk quality, was commissioned in 1998. From the results, consumers are not any more at risk by the sale of raw milk by small traders than through other milk market channels. The presence of anti-microbial residues, which are not destroyed by heat treatment, though not predominant, is however of concern. The agricultural information base in Kenya, including information on dairy, is relatively large, but as a study on Assessment of information needs (MoALD&M, 1998) noted, it is both scattered and exists in as ‘grey’ literature in a variety of locations. There has been effort by FAO and others to develop a regional dairy information network but with no success to date. The SDP (Smallholder Dairy (R&D) Project) is also planning a website. Kenya’s strength in dairy arise from its possession of a dairy herd of over 3 million dairy cattle, which is over 85 percent of the dairy cattle population in Eastern Africa (Table 8) and over 70 percent of dairy cattle in Eastern and Southern Africa (Thorpe et al, 2000 b). Weakness can however arise from the small scale of milk output, 10kg per farm per day (Bebe, 2003), which can result in low bargaining power and limited ability to capture scale economy in the market (Muriuki H.G., 2002), the poor rural infrastructures, reliance on rainfall for production and the poor milk markets.
6
Kenya has great opportunities deriving from its developed smallholder dairy production system. This creates tremendous opportunity for marketing of the dairy germplasm and products to the region.
A major threat to the Kenya dairy industry is likely to come from globalisation, if global trade agreements are not properly managed, although internal problems can also be sources of threats.
With a large dairy herd, which significantly contributes to the livelihoods of rural communities and their economy, dairying has a great potential and future. About 90 percent of marketed milk in Kenya is sold to consumers through informal milk markets (Omore et al., 2000) despite policies and legal framework that discourage these markets. Consumers in Kenya prefer raw milk, traded mainly through the informal channel, than other dairy products (Ouma et al., 2000). It is therefore important to include the informal sub-sector in the improvement programmes to take advantage of the large proportion of milk market they command. Measures to incorporate the informal market into the formal sub-sector will however need to be multi-faceted and should include training, promotional campaigns and policy and legal framework reforms. There are already efforts towards training on milk hygiene mainly by FAO and Land O’Lake through ILRI, and KDB, all in collaboration with the Smallholder Dairy Project, a MoALD/KARI/ILRI collaborative project. It is apparent that the major source of milk losses in Kenya is the seasonal imbalance between supply and demand and problems of milk collection associated with poor infrastructure such as rural roads, water and sources of power to service and maintain a cold chain. Although some of the losses, like forced consumption, will require a long term investment planning, use of quality assurance measures along the whole milk market chain will significantly reduce the losses in the short run. Milk borne hazards such as antibiotics and excessive load of bacteria can enter the milk chain at many points along the market depending on handling and ethical attributes of the actors along the chain. An analysis of critical control points (CCPs) in the Kenya milk marketing channel, using an OLS regression, has been done (Omore et al., 2001) and is presented at the end of this document. However, a focused market chain CCPs analysis will be required to complement the results by Omore et al.
7

Introduction
Kenya’s population is currently at about 31 million people (28.7 million during 1999 census - CBS 2001) and growing at a rate of 2.5 percent per year. The country’s total area is 582,646 km2, of which 11,230 km2 is under water (CBS 1999). About 16 percent is of High and Medium Potential Land (HMPL) while the remaining 84 percent is classified as ASAL areas supporting about 25 percent of the human population. Kenya’s climate varies from warm and humid in the coastal areas to cool temperate in the highlands (Figure 1). The annual rainfall ranges from less than 200 to over 2000 mm in some parts of the highlands. Kenya’s economy is largely based on agriculture, which contributes over 25 percent of the GDP. Agriculture and the rural development sector provide over 80 percent of employment and 60 percent of national income. Close to 80 percent of the population live in the rural areas and derive much of their livelihood from land i.e. crops and livestock. Agriculture also provides raw materials for agro-industries, accounting for about 70 percent of all industries. Livestock contributes over 40 percent of the agricultural GDP or about 10 percent of the national GDP. Dairy is the largest contributor of the livestock GDP. The importance of livestock to the economy is most appreciated in the drier parts of the country where it is almost the sole source of livelihood for the communities living in those areas.
8

1 0 0 0 100 200 Miles
A g r o cl i m m a t i c Z o n e s L . V i c t o r i a H u m i d S u b - H u m i d S e m i - H u m i d S e m i - H u m i d t o S e m i-AridS e m i - A r i d A r i d V e r y A r i d
K e n y a n D i s t r i c t s N
Figure 1: Agroclimatic zones of Kenya
Kenya’s land productivity potential can broadly be divided into three regions (Ominde, 1988):
1. High potential areas with an annual rainfall of more than 750 mm, spreading from central Kenya through to the central Rift Valley to western Kenya and the coastal strip.
2. Medium potential areas with an annual rainfall of more than 625 mm but less than 750 mm, located in parts of central-eastern Kenya and neighbouring the high potential coastal strip.
3. Low potential areas with an annual rainfall of less than 625 mm, stretching from north and north-eastern Kenya to the southern parts bordering Tanzania.
9

The land productivity potential is closely related to the agro-climatic zones. Commercial dairy production is concentrated in the high potential areas or the highlands.
Background
Dairy production in Kenya is predominantly smallholding. Market-oriented dairy farming in Kenya, based on exotic cattle, dates back to the early 20th century when European settlers introduced dairy cattle breeds and other exotic forms of agriculture from their native countries. Improved dairy cattle production by indigenous Kenyans was not until after the Swynnerton Plan of 1954, which allowed them to engage in commercial agriculture (Conelly, 1998). By 1963, when Kenya attained independence, the dairy herd had increased to about 400,000 exotic cattle largely in the hands of the settlers. After independence, there was a rapid transfer of dairy cattle from the settler farms to the smallholders resulting in a decline in the cattle population on large-scale farms to 250,000 head by 1965. To encourage dairy production by smallholders, the government effected a number of changes in the provision of livestock production and marketing services, resulting in highly subsidised services. In 1971, and following some recommendations from the Dairy Commission of Inquiry (Government of Kenya (Kibaki report, 1965), the government abolished the quota system of dairy marketing to Kenya Co-operative Creameries (KCC) to allow for the inclusion of smallholder producers. In 1966 the government had also reduced the cost of A.I. to the farmer. Reduction of cost of AI and its accessibility to the small-scale dairy farmers up to mid ’80s (1987), when the government could no longer sustain free services, is credited with the success of dairying in Kenya amongst other government interventions. The government strategy of a combination of direct intervention and statutory control of production activities and markets greatly benefited the smallholder dairy production and marketing, through subsidies on production inputs and market guarantees. While the strategy was justifiable, it was clearly not sustainable as was evident during the economic crisis of the late 1970s and early 1980s, which coincided with global changes regarding the extent of government control of and intervention in the production and marketing process (Ngigi M.W. 2002). The continued provision of highly subsidised livestock and other services by the government proved unsustainable mainly due to budgetary and other constraints. By the late 1980s, the quality of livestock services provided by the government had declined, prompting it to adopt reforms such as structural adjustment and economic restructuring which, among other changes, included liberalisation of the dairy industry in 1992 with a view to increasing the role of the private sector (Omore et al. 1999). In 1993, the government published a dairy policy “A strategy towards Development of self-sustaining Dairy Sector “, aimed at giving direction to the industry’s liberalisation.
10

In the period preceding the 1980s, parastatal and other quasi-government institutions such as KCC and Kenya Farmers Association played major roles in marketing and delivery of agricultural commodities, services and inputs. With their collapse, there has been increased reliance on the private sector, including community-based organisations (CBOs), for delivery of livestock and other agricultural services formerly in the government domain. Several factors, which include the presence of significant dairy cattle populations, the importance of milk in the diets of most Kenyan communities, a suitable climate for dairy cattle and a conducive policy and institutional environment, have been contributing factors to the success of dairy production by smallholders in Kenya (Conelly, 1998; Thorpe et al. 2000). The success is also attributable to the fact that milk sales provides a continuous stream of cash throughout the year for households growing cash crops whose income is realised only once or twice a year.
Current situation of the Smallholder dairy sector in Kenya
Policy
Before decontrol of the milk price in 1992 and the subsequent liberalisation of the dairy industry, the government development policy strategy was based on interventions and statutory control of milk production and marketing. Due to severe budgetary constraints, the resulting social-economic crisis in the late 1970s and early 1980s (Ngigi W. N., 2002) and the global pressure to the developing countries to implement policy and institutional reforms and restructuring, the government had no choice but to implement reforms in the national economy. Some of the major reforms in the dairy sub-sector included (a) implementation of cost recovery in the sale of veterinary drugs in 1988, (b) decontrol of animal feed prices, (c) transfer of cattle dips management in 1989 to local communities, (d) privatisation of A.I. services in 1991, (e) decontrol of milk prices in 1992 and (f) privatisation of clinical services in 1994 (Omiti J. 2001). While the dairy policy environment has changed towards less government interventions and control since late 1970s, the documented policies and regulations have not kept up with these changes. The reforms have also been faced with a lot of implementation difficulties include disharmony between the pronounced and the written policies. Dairy industry policies are contained in various government documents, which include written policies, legislation, development plans, sessional papers, legal notices and many others. Other policies include pronouncements by government through cabinet ministers and the president on various issues of the moment. The first direct and comprehensive dairy policy was published in 1993 after the 1992 decontrol of milk prices. The main emphasis of the 1993 policy was that the Government should gradually phase out its intervention activities and be concerned with activities of public goods nature in the industry (MoALD, 1993). The policy document
11
contained policy changes in provision of A.I. and clinical services, liberalisation of prices and marketing and proposals for institutional changes in the operations of KCC and KDB. The policies contained in the 1993 policy paper had generally been attained or rendered irrelevant through the changes in the industry by 1995. In 1996 the government initiated a process of policy and legislation review by appointing a Task Force and a sub-committee to review and revise the Dairy Industry Act (CAP 331) and the 1993 policy document in tune with prevailing liberalized economic environment. While the onus of formulating and revision of the policies and legislation is traditionally with the government, local and global events demanded that the dairy industry stakeholders be fully involved in policy and legislation formulation. The dairy industry review committee therefore incorporated a wide representation of stakeholders, which included a representative of the university, a processor, KDB, a farmer (commercial), donor and government representatives. For the policy revision or formulation to be complete and for it to be a national policy, it has to go to the cabinet and for it to be a sessional paper, to the National Assembly (Parliament). The difference between a sessional paper and a government policy is in the process and that if the policy is only approved at the Cabinet level, it is strictly a government policy while if it is a sessional paper, it involves people’s representatives or the Parliament. Whereas the Dairy Development policy review and revision was complete by 1997 it has not yet been tabled to the cabinet. In an initiative to complete the review process, the policy and the Dairy Industry Bill were presented to the Parliamentary Committee on Agriculture, Lands and Natural Resources way back in 2000 and to a National Consultative Workshop in March 2001. The main aim of the workshop which was chaired by the Minister and chaired by Permanent Secretary (PS) was to fine tune the revised policy and Dairy Industry Act (Bill), and as a final consultative forum before the two documents are tabled to the cabinet and finally to Parliament for finalisation. This never happened due to the fact that by the time the two documents were to be tabled to the Parliamentary Committee for their final direction before sending them to cabinet, the country was gripped by the national election fever. Whereas the new Minister for Agriculture and Livestock Development has promised to facilitate the finalisation of the process as soon as possible, it requires time for a new team to familiarise itself with the documents and gain confidence to present them to the cabinet and the Parliament. It however has transpired of late that Minister will be able to move faster than has happened previously after changes of the top Ministry administration. The Minister has, in May 2003, presented both the revised Dairy Development Policy and the Dairy Industry Bill (both dated 2001, when they were last edited, although they will be given new dates after Cabinet approval) to the Cabinet for their approval and direction. If approved, the policy paper may immediately be published as a Government policy as approved or will be sent to Parliament as a sessional paper for further debate. The Bill will be handed over to the Attorney General’s office for that office to table it in Parliament for finalisation.
12

One course of delay in the finalisation of the revised dairy policy has been the high turnover in critical offices i.e. in the offices of SDDLP, DALP, PS and the Minister. Other than the DALP, other offices have had more than five occupants since the revision process started in 1996. Each time there is a change in any of these offices, the policy finalisation/development process has to be halted to allow the new occupant understand, accept and build confidence to take it to the next stage. The changes in these offices are however not simultaneous but nevertheless change in one affects and interrupts the whole policy process. Whereas the main objective of the 1993 dairy development policy i.e. to guide the industry towards a liberalised market economy (MoARD, 2000), has largely been achieved, there are a number of policies that either have been rendered irrelevant or proved difficult to implement. Such policies include: (i) Availability of credit to dairy farmers to enable them cull low productivity cattle
and replace them with fewer high yielders, thereby intensifying dairy production and releasing land for either fodder or crop production.
(ii) Intensification of fodder production, use of fodder trees, utilization of crop residues, intensification of extension messages on on-farm feed processing and use and promotion of alternative sources of dairy industrial feeds such as cassava.
(iii) Harmonisation of breeding services (activities) through creation of one organisation.
(iv) Involvement of KDB in dairy research prioritisation as the focal point of dairy development in Kenya.
(v) Improvement of dairy feeder roads. (vi) Locating milk coolers, where they can be utilised by farmers and form part of
national milk collection “grid system” to bring milk from surplus to deficit areas. (vii) Improvement of the dairy co-operative management in performing integrated and
broader role in serving the dairy farmer. (viii) Decentralisation of school milk programme by opening competition through
allowing co-operative and private sector distribute the school milk. (ix) Maintenance of strategic reserve by the government through MoALD and KDB. The 1993 Dairy Development Policy document is technically the one in force but it is acknowledged that it has been overtaken by events following significant changes in government policies on the dairy and other sub-sectors and their impact on the economic environment (MoARD, 2000). The draft Dairy Development policy (MoARD, 2000) has been revised to supersede the policies contained in the 1993 document. It is therefore expected that the policies contained in 1993 and not yet achieved forms the basis of the revised draft. It is difficult to assess the level of implementation of dairy policies in Kenya based on the written or documented ones. As noted earlier, the implemented policies are at times not consistent with the written or documented policies. It can be observed that in most cases policy implementation is short term and a reaction to prevalent issues of political concern and budgetary relevance. It is therefore possible that the documented policies are implemented selectively to suit above stated conditions.
13

The main national policy objectives in Kenya have focussed on equity, growth and participation. Other common themes include self-sufficiency and food security, increased food supply, growth in agricultural and rural employment, expansion in exports and of late, resource conservation. During the last decade, dairy policy emphasis has been on liberalisation and reform in both the KCC and KDB. KCC has been privatised although there appear to be renewed concerns about its status. KDB reform is on going. The main thrust in KDB reform is to focus more on dairy industry development, regulation and promotional activities, away from pre-liberalisation controls (MOARD, 2001). Other policy areas of interest in reformed KDB are the election of Board of Directors, industry representation and the role of the Minister in the implementation of the legislation. Most of the policies on KDB have been achieved but those requiring inclusion in the legislature like Board representation, election of the directors and the role of the Minister are yet to be implemented due to delays in the revision process. The issue of raw milk sales and the itinerant traders (hawkers) remains contentious despite the fact that direct raw sales from producer to consumer comprise 36 percent and itinerant traders (small milk traders) handle another 28 percent of marketed milk which is sold raw (Staal et al, 1999). The draft dairy policy acknowledges the importance of the small mobile or itinerant traders in milk (liquid) market but denounces the way they go about in their business, without however offering solutions.
Relevant Dairy Institutions and their Roles
Several institutions are involved in the dairy sector. They include regulatory, input suppliers, service providers, market agents, research and development organisations and farmer groups. The Kenya Dairy Board (KDB) is the lead parastatal among the dairy regulatory institutions. It was established in 1958 under the Dairy Industry Act (CAP 336) to organise, regulate and develop the dairy industry in Kenya, mainly for the settler farmers. The main role of the Board was then to ensure efficient production, marketing, distribution and supply of milk and dairy products having regard to consumer preferences. Its role also included ensuring stable prices, improvement of dairy produce quality, promotion of market research and private enterprise in production, processing and marketing of dairy produce. It has however been observed that over the years, KDB, like other regulatory institutions, concentrated its effort in policing the activities of milk marketing (Mburu B.N., 2002). With the liberalisation of the economy and the decontrol of milk process in 1992, the role of KDB in the dairy industry has changed and focuses more on dairy development, regulation and promotional activities (MoARD, 2000). According to the Managing Director of KDB, the “Board is mandated to efficiently and sustainably develop, promote
14

and regulate the dairy industry and create an enabling environment for increased private sector entrepreneurship in milk production, processing and marketing” (Ngurare V.K., 2003). The new roles are however not adequately backed by legal instrument since the legislation (CAP 336) has not been changed to reflect the changed roles. Other institutions, which have a role in the regulation of the Kenya dairy industry, are the Kenya Bureau of Standards (KEBS), the Public Health Division (PH) of the Ministry of Health and the Police Department. The KEBS is the statutory body that is involved with the setting and enforcement of standards for all products and services including those of the dairy sub-sector. The main role of the Public Health Division, both under the Ministry of Health and local authorities, is the maintenance of hygiene. The regulatory institutions are better known for their enthusiasm in cessing and enforcing the policing functions of their mandates. These regulatory bodies are however constrained by lack of resources in terms of personnel and equipment although there have been attempts to improve the situation. Input suppliers and service providers to the dairy industry include shopkeepers at various urban centres, animal health practitioners, both legal and illegal, extension officers, dairy NGOs and farmers’ groups such as co-operatives and self-help groups (SHG). The main role of input suppliers is to offer quality inputs in the market at competitive prices. They should keep pace with new technologies and ensure proper practices and use of inputs. Most of the inputs and service providers, other than government extension officers and farmers’ groups are in business and are in essence motivated by profits. There are a lot of issues in the input and service provision especially in the case of veterinary services arising from lack of adequate supervision. The dairy sector research receives inadequate resource (Omiti J. 2001). Because of this and other problems, there is inadequate research on dairy in Kenya especially on productivity and policy. Extension services have borne mixed results. The extension farmer ratio is low, government budgetary provision for extension services have dwindled and private extension is yet to fill the gap. Co-operatives and other farmer groups such as self-help groups (SHG) are formed to assist farmers to acquire credit and inputs and sell their produce such as milk in case of dairy co-operative societies. There are about 330 dairy societies (co-operatives) out of about 9,880 societies and unions in Kenya (CBS, 2002). Dairy co-ops have in the past significantly contributed to the development of the smallholder milk marketing and provision of farm inputs and services at a relatively lower cost (Omiti et al., 2000). Dairy co-operatives found themselves under threat after the liberalisation of the dairy industry as a result of many factors which include competition from other traders especially those of raw milk, inability to change with times, loss of huge amount of money owed by KCC in some cases and poor management among others. The processors play the role of transferring and transforming milk from rural production area to different consumer dairy products sold in urban centre or milk deficit areas. The
15

processing institutions have also been threatened by competition from the raw milk traders although the number of processors rose from 3 (KCC, Meru Dairy and Kitinda Dairy) after liberalisation to 45. The number has dropped to 30 (Ngurare V.K., 2003). The processing sector handles less than 15 percent of the marketed milk. While the competition is from raw milk trade, the problem may be associated with consumer preference and to the size of processing margins. There are only a few Agricultural credit institutions in Kenya. Through credit, farmers can start dairy activities or make improvement to existing operations. The one major agricultural credit institution is the Agricultural Finance Corporation which is nevertheless in trouble and almost insolvent. Other sources of credit include commercial banks, whose credit seem unsuitable to farming conditions and micro-finance institutions, which are not many. A major limitation to use of available commercial credit is the cost of credit or interest rate, collateral requirements and inadequate grace period in case of dairy farming.
Dairy production
The dairy industry is the most developed of the livestock sub-sectors in Kenya and is comparatively well developed relative to the dairy industries of other countries in sub-Saharan Africa. The dairy sub-sector, like other agricultural sub-sectors, is predominantly smallholder. Milk in Kenya is produced primarily from cattle (the main source of marketed milk), camels and goats, which contribute 84, 12 and 4 percent, respectively (see Table 1). Table 1: Estimated population of milk animal species/breeds and percentage contribution to annual milk production (2001).
Species Breed type
Estimated number (× 103)
Estimated annual milk production (× 106 Kg)
Milk production (% contribution)
Cattle Improved dairy type Zebu
32888457
1997.5 444
71.515.9
Camels Camelus dromedarius 819 257 9.2Goats Indigenous (East African)
Improved dairy type 10,845
11593.1 4.0
3.30.1
Source: Developed from MoALD (Ministry of Agriculture and Livestock Development) Animal Production Division 2001 Annual Report.
16

About 60 percent of total milk production in Kenya takes place in less than 10 percent of the country's landmass in the central districts of the Rift-Valley and Central Province where 80 percent of exotic and cross-bred dairy cattle are found (Omore et al., 1999) (see Table 3). Cattle production systems in Kenya and production parameters within them have been extensively described by various authors and summarised by Peeler and Omore, (1997). The dairy and indigenous cattle production systems can be divided into 4 broad classes (2 large scale and two small scale systems) reflecting the genotype, the major product(s) or objectives of production and the physical (climate), biological (flora and fauna) and socio-economic (market orientation and management input) environments (see Table 2). Table 2: Dairy and indigenous cattle production systems in Kenya
Production System Geno-type
Major Product(s)
Agro-Climate/ Farming System
Purpose Manage-ment
Major Production Regions
Large Scale 1. a) Intensive dairy Exotic dairy humid to semi-
humid/ (ACZ 1-3) crops-livestock
entirely market-oriented
intensive
b) Semi-intensive dairy
Exotic/ crosses
dairy humid to semi-humid/ (ACZ 1-3) crops-livestock
entirely market-oriented
Semi-intensive
Central Rift valley
2. Extensive dairy-meat
Zebu dairy-meat semi-arid to arid/ (ACZ 5-7) livestock only
mostly pastoralism
extensive North and South Rift Valley, Eastern and Coast
Small Scale 1. a) Intensive dairy-
manure Exotic/ crosses
dairy-manure
humid to semi-humid/ (ACZ 1-3) crops-livestock
mostly market-oriented
Mostly intensive
b) Semi-intensive dairy-manure
Exotic/ crosses
dairy-manure
humid to semi-humid/ (ACZ 1-3) crops-livestock
mostly market-oriented
Semi- intensive
Central Province, Central Rift Valley, Coast.
2. Semi-intensive dairy-meat-draught-manure
Zebu/ few crosses
dairy-meat-draught-manure
humid to semi-arid (ACZ 1-5) crops-livestock
mostly subsistence
semi-intensive
Nyanza, Western, Coast, Eastern, Rift Valley
Source: Omore et al. The Kenya Dairy Sub-sector; A rapid appraisal. Smallholder Dairy (Research and Development) Project, 1999. (Modified) The major types of cattle kept for milk production are the improved exotic breeds and their crosses (collectively called ‘dairy cattle’) and the indigenous (zebu) cattle, which provide milk for communities in the drier parts of the country. The improved dairy cattle contribute about 72 percent and the zebu cattle about 16 percent of the national milk output (Table 1). Market-oriented dairy farming in Kenya, where exotic cattle are dominant, is concentrated in the crop–dairy systems of the high potential areas where feed supply and disease control are much better than in the arid and semi-arid lands (ASALs) of the country. Zebu cattle, which constitute about 70 percent of the total
17

population of cattle in Kenya, are, however, widely distributed and are found in all agro-ecological zones of the country due to their adaptation to highly diverse environments. About 70 percent of the herd is found in the ASALs of the country. The dairy herd is mainly composed of purebred Friesian–Holstein, Ayrshire, Guernsey, Jersey and their crosses. The crosses constitute over 50 percent of the total herd while the Friesian–Holstein and Ayrshire dominates the pure breeds. Table 3: Estimated Dairy Cattle population by Province; 1998-2001 ('000')
Province 1998 1999 2000 2001
R/Valley 1,742 1,704 1,652.08 1651.21
Western 127 145 151.67 155.81
Nyanza 151 174.6 216.46 188.06
Central 833 871 855.35 877.62
Eastern 343 413.8 344.28 321.83
Coast 69 68.82 73..39 76.08
N/Eastern 0.19 0.16 0.15 0.21
Nairobi 17 16.06 17.19 17.51
Total 3,282 3,393.6 3,310.42 3,288.33 Source: MoALD (Ministry of Agriculture and Livestock Development) Animal Production Division Annual 2001 Report. Dairy production systems in Kenya however can largely be classified as large- or small-scale instead of the above four classes. Small-scale producers (the smallholders) dominate dairy production owning over 80 percent of the 3.3 million dairy cattle, producing 56 percent of the total milk production and contributing 80 percent of the marketed milk (Peeler and Omore 1997). In a study by the Smallholder Dairy (R&D) Project (SDP) (Staal et al. 1999), covering most of the milk producing regions in the country, majority of those surveyed were smallholders and 73 percent of these had dairy cattle. These findings confirmed the importance of dairy in Kenya’s agricultural sector and the country’s economy. The study also confirmed that dairy production is conducted on small farms with crossbred herds, which range in size from one to three head, and that production is based on close integration of livestock and crops. Dairying is a multi-purpose cattle system providing milk, manure and a capital asset to the farmer. Development of smallholder dairy production systems in the Kenya highlands has been marked by declining farm size, upgrading to dairy breeds and an increasing reliance on purchased feeds, both concentrates and forage (Staal et al., 1997). In areas such as Kiambu District, purchased fodder has become very important in dairying. The area planted with fodder for sale is equal to the area planted with maize, the staple food crop.
18

Dairy production by smallholders is a multi-purpose cattle system, producing milk and manure and serving as a capital asset. It is characterised by small crop–livestock farms, each comprising a few acres.. An important feature of the smallholder system is that milk is a cash enterprise for households who generally grow cash crops and use manure to fertilise food and cash crops. Cash crops in these farms may include coffee, tea, market vegetables, pyrethrum, and in some cases, cut flowers. The main food crop is maize, but others include beans, sweet potatoes, potatoes, vegetables (such as kale) and in a few cases, wheat. The major cattle feeds are natural grass and planted fodder, mainly Napier grass. Other feeds, which depend on area and availability, include maize crop residues, compounded feeds, milling by-products and weeds. Where farms are small, cattle are confined and fed through a cut-and-carry system in which feed materials are brought to the animals (Baltenweck et al. 1998; Staal et al. 1999). The importance of manure in dairy adoption has largely been overlooked. Studies by the Smallholder Dairy Project (Lekasi et al., 1998) have shown that nutrient cycling through dairy animals and use of manure is a key driving force to dairy adoption and to sustaining smallholdings. In some cases dairy cattle have been kept mainly to supply manure for coffee plants and food crops. Cattle breeding in the smallholder sub-sector depends on the availability and cost of artificial insemination (AI) services and/or bull service. Use of AI was very popular when it was provided almost free-of-charge by the government but use of bulls has been increasing since the collapse of the government AI services, following their liberalisation. There has been increased reliance on the private sector, including CBOs, to provide AI and other livestock services in place of the collapsed government services. However they have not yet been able to fill the gap. Either because of this or other circumstances, calving intervals are long, with an official national estimate of 450 days and some studies indicating an average of 590 days in Kiambu (Staal et al. 1998a). There have been discussions, at the policy level, on how the change from a government controlled to a liberalised economy, including dairy sub-sector, should have been managed to avoid disruptions of service provision to the farmers. Nevertheless, no concrete plans have been put in place to address the issues discussed. Milk production in the smallholder sector is constrained by a number of factors, the major ones being the level of dairy cattle feeding, animal genetics and disease challenges. Disease challenge has become more important where dairy production practices have spread into less productive areas because of the need for more agricultural land. In these areas, grazing systems dominate and disease risks are high. Disease challenge, especially of tick-borne diseases e.g. East Coast fever (ECF), is equally important in the high potential areas as a result of the collapsed government services and failure of the private sector to fill the gap.
Milk marketing and marketing channels
As mentioned earlier, milk production in Kenya is based on several different species of livestock but for marketed milk, the most important species is cattle.
19

It is estimated that of the 2.8 million tonnes of milk produced annually from all species, cattle produce about 2.4 million tonnes, of which about 2 million tonnes is from the dairy herd and mainly from the smallholders. On-farm consumption (non-marketed milk) accounts for about 40 percent of milk and the remaining 60 percent is marketed through various channels (see Figure 2). Less than 15 percent of marketed milk flows through milk processors (Thorpe et al. 2000), who include Brookside, Spin Knit, Premier, KCC and other smaller private processors. The balance of marketed milk is sold as raw milk. Non-processed milk marketing channels include: direct milk sales to consumers by farm households (58 percent); and milk collected by dairy co-operative societies, self help groups and individual milk traders who also sell either directly to consumers or to processors.
Farm Production (Smallholder)
60% 40% Marketed Milk Milk Retained at Home 58% (34.8%) 38% (22.8%) 4% (2.4%) Co-op + SHG + Traders 75%(17.1%) 25% (5.7%) 70% (28%) 30% (12%) Processors 86.5% (52%) 13.5% (8%) Marketed Consumption Household Consumption Calf Consumption
Total Consumption Note: percentages in the parenthesis indicate the proportions from the total production and the others from the source; SHG = self help groups; KCC = Kenya Co-operative Creameries. Source: Modified from Omore et al. (1999). Figure 2. Milk marketing channels.
20

Differences in milk marketing channels exist between and within the country’s various regions. Until mid 1990s, marketing through KCC dominated in areas with high production and low consumer concentration or few alternative market outlets. Nairobi city and its environs, which is the largest single market in the country, accounts for over 60 percent of the formally marketed milk whilst Coast Province and parts of Western Province are among the milk deficit areas in the country. Women and school age children contribute greatly to labour for dairy activities especially to milk production and marketing, which involve waking up very early in the morning to feed and milk cows, and to take the milk to market. This labour input has not received adequate attention and credit, raising concern relating to gender imbalances in labour distribution at the farm level.
Post harvest losses
Post harvest losses in the dairy industry can be described as losses at the farm level after milking and through the market chain up to the consumption. This is the milk, either raw, fresh or in its various products forms that gets spoilt due to poor handling and lack of cooling facilities. In Kenya, information on post harvest losses is minimal and where available it is not backed by scientific analysis. Losses can either be through spillage and/or spoilage. The spillage losses are most likely on the minimum side. Most of the milk is lost through spoilage. Consultation with field officers indicate that at the smallholder farm level, the losses may be negligible but there is a category of loss that is commonly referred to as “forced consumption”, which occurs due to limited market opportunities. In most places, farms are only able to sell their milk in the morning. The afternoon or evening milk has to be used by the family, the calves, if there are any, and sold or given to the neighbour. In most cases, the family may be consuming more than it would normally require hence the forced consumption. The “forced consumption” is prominent in the milk surplus areas. The Dairy Master Plan report (MoLD, 1991) indicated that the ”forced consumption” is critical in the estimation of supply response, especially where it is assumed that provision of cooling facilities will draw forth the evening milk and where the general assumption is that if evening milk could be collected, total marketed milk could rise by 40 to 50 percent. This, however, may not be true. Provision of over 60 coolers to societies in early and mid 1980s on the assumption of losses of the evening milk did not succeed in drawing the milk. The Rapid Appraisal study (Omore et al., 1999) reports that a Ministry of Agriculture report estimated that 30 percent of milk production from these districts is lost annually due to the poor state of roads. At the market level a study on milk borne health risks to consumers in Kenya (Omore et al., 2001) indicate that post harvest losses incurred in the market may be roughly assessed through the fate of leftover milk from previous day sales. The study indicate that on average, one in every 4 traders of all cadres recorded leftovers of about 7 percent of the volume of previous days milk sales. However, only 2 percent of traders recorded leftover milk that was thrown away from previous days milk collection. Most of the leftover was
21

used by family or sold. It is known that most of the milk bars will allow the leftover to ferment and sell it as mala (fermented milk). Milk losses at the market level vary with seasons. Generally, rejection of farmers’ milk by either the co-operatives or the processors are negligible during the dry season but can climb to very high levels during the wet season. Press reports put the rejection to as high as 35 percent. In some instances when there is unexpected supply glut like the case of December of 2001 and January/February 2002, milk rejection reached its climax. The main processors were receiving milk for 3 days in a week. There were claims that even the days they were receiving, they rejected more than half of a consignment. The claims were however not authenticated. Within the co-operative milk chain, milk loss is estimated at between 1 to 5 percent on average but can go up to over 10 percent in the wet season when delivery rejections are common. Losses at processing at the factory level are most likely below 2 percent. Most processors are not willing to discuss their operations. Post harvest losses in the dairy industry in Kenya don’t seem to get attention beyond the issue of what is seen as unfair milk rejections by the processors especially during the wet season. Despite the lack of interest on the post harvest milk losses, there has been concern over the health risk to the consumers from unprocessed milk. It is estimated that over 80 percent of milk sold in Kenya does not pass through processors. This is the proportion that is either sold directly from farms to the consumer (neighbours and others), through itinerant traders (hawkers or small traders) or through co-operatives, milk bars and shops. The quality of raw milk will deteriorate with time especially where chilling facilities are not in use. Similarly, bacterial counts in milk reflect the temperature of milk, time elapsed since milking and the level of hygiene (Omore et al, 2000). Most raw milk found in urban markets has a high proportion of unacceptable total plate count and coliform count. A smallholder Dairy project study (Omore et al, 2001) showed high proportions of milk from urban areas had unacceptable total plate (TPC) count and coliform plate count (CPC) of 61 – 84 percent and 39 – 69 percent respectively. These are proportions with over 2 million cfu/ml (cfu – colony forming units) and over 50,000 cfu/ml TCP and CPC respectively. The significance of this is, despite the low KEBS standards (TCP > 2m), there is generally very high proportion of raw milk in the market that does not achieve those standards and if they were to be enforced, probably over 50 percent of the raw milk in the market would convert to losses. Lack of cold chain may be a major factor contributing to this (Omore et al, 2001). It has been argued that for the Kenyan condition, the KEBS standards are unsuitable for the local circumstances but considering international standards, these standards are however on the low side.
Milk Consumption and consumer preference
22

Kenya has largely been self sufficient in milk and dairy products, except in years of extreme bad weather. The dairy products in the Kenya market can be grouped into two; processed and unprocessed. The processed products include pasteurised milk, ultra heat treated (UHT) long life milk, cultured milk (mala & yoghurt), cheese, butter, ghee and milk powder. The unprocessed products mainly comprise of raw and fermented milk. Consumption of dairy products in Kenya is principally in the form of liquid milk in both urban and rural areas, with higher milk consumed in rural areas compared to urban areas. In the rural areas, this largely takes the form of raw milk while in the urban areas it comprises both pasteurised and raw milk. In Nairobi for instance, 64 percent of the total volume of dairy products consumed per household is in the form of pasteurised milk while 23 percent is raw milk (Ouma et al., 2000) (Table 4). Consumption of the highly processed dairy products is limited to a few households, either because they are unaffordable or because of taste and preferences of consumers. The high prices of processed products are due to the added costs of processing and packaging, which has to be passed on to consumers. Table 4. Levels of dairy products consumption Litres (LME)/HH*/month
Milk Type Nairobi (n=210)
Nakuru Urban (n=74)
Nakuru Rural (130)
Raw 5.5 22.5 24.3 Pasteurised 15.6 3.8 0.2 Processed (LME) 3.1 1.2 0.4 Total Products (LME) 24.2
(4.8)** 27.5
(4.6)** 24.9
(4.2)** - HH* - Household - ** Per capita dairy products consumption (litres/person/month) - Kenya Dairy Master Plan report (MoLD 1991) estimated annual per capita consumption of marketed milk at 125 kg/year in the urban areas and 19 kg/year in the rural. Conversion factors of various milk products to liquid milk equivalent (LME):
Liquid milk: Butter = 1: 6.6 Liquid milk: Yoghurt = 1:1
Liquid milk: Ghee = 1: 8 Liquid milk: Ice cream = 1: 0.75
Liquid milk: Cheese = 1: 4.4 Liquid milk: Milk powder = 1:7.6 Source: Various SDP presentations and publications. Little however is known about the real demand for milk and milk products. Available statistics show that milk production in Kenya nearly doubled from about 1.3 million tonnes in 1981 to about 2.5 million tonnes in 1990, but has since stagnated (MoARD, Dairy Development Policy Proposal, 2000). The Kenya Dairy Master Plan report (MoLD 1991) estimated that per capita consumption of marketed milk was 125 kg/year in the urban areas and 19 kg/year in the rural areas. Milk producing rural areas, however were reported to have a higher per capita consumption. Results of a study carried out in Nairobi and Nakuru by the Smallholder Dairy Project indicate higher levels of consumption and a reversal of the urban–rural levels of consumption, with Nakuru rural areas having higher levels of consumption per capita than both Nakuru and Nairobi urban centres (Ouma et al., 2000).
23

The Dairy Master Plan (MoLD, 1991) also predicted a national milk surplus (i.e. higher marketed supply than consumption) by the year 2000. Nevertheless, using KCC data for intake and sales, another study (Muriuki H.G., 1991) predicted a possible shortfall in marketed milk by the same year. The main reason for the predicted shortfall was the observation of a continued rise in demand for marketed milk as human population continued to grow, especially in the urban centres, while the observed growth in milk production was slow. Another factor that could increase demand for milk is growth in personal incomes. However, per capita income in Kenya has been declining; thus, no increase in the demand for milk is expected from this source. Furthermore, the demand for dairy products in the rural areas in Kenya is said to be income inelastic. Past statistics in Kenya may have underestimated both milk production and consumption. This possibility is confirmed by the results of recent studies by the Smallholder Dairy Project, which confirm underestimation in both cattle numbers and milk consumption levels (Table 5 & 6). Table 5: A comparison of ground truthing survey Dairy cattle population estimates
with estimates from the ministry of Agriculture
District Division
Estimated dairy cattle population (Ground truthing survey)
Estimated dairy cattle population (MALRD figures)
Ratio of ground truthing survey to MALRD the dairy cattle population
Maragwa Kandara 65477 35000 1.9 Maragwa 33876 12790 2.6 Makuyu 1672 5320 0.3 Nakuru Bahati 34013 25950 1.3 Kuresoi 16754 18015 0.9 Mbogoini 11051 7400 1.5 Rongai 1818 30234 0.1 Nandi Kaptumo 14166 10820 1.3 Kilibwoni 58940 61020 1.0 Kosirai 41788 33130 1.3 Tinderet 20044 8750 2.3 Nyamira Nyamira 34870 6814 5.1 Manga 30962 11830 2.6 Ekerenyo 45007 2600 17.3 Rogoma 21009 9376 2.2 Vihiga Sabatia 22855 3818 6.0 Tiriki East 13601 1004 13.5 Tiriki West 12354 1695 7.3 Vihiga 13922 2059 6.8
Source: Smallholder Dairy Project Ground truthing survey report The consumer study (Ouma et al., 2000) also reveals evidence of consumer preference for raw milk vis a vis processed milk. The former is preferred due to perceived high butterfat content, appealing taste and affordability. The study shows that raw milk is generally 20 to 50 percent cheaper than pasteurised milk, thus providing the majority of the poor Kenyans access to milk. Since the informal market does not incur value-adding costs, the marketing margins between producers and consumers are usually low, resulting
24

in low retail prices to consumers. Consumers are unwilling and or are not able to pay for the added costs resulting from processing, and hence prefer to process the milk themselves through boiling to increase shelf life and eliminate public health risks (Smallholder Dairy Project policy brief, unpublished). Table 6: A comparison of District Dairy cattle populations using data from
the Characterization and ground truthing survey’s and also the Ministry of Agriculture
District
Characterization survey Dairy cattle population
Ground truthing Survey Dairy cattle population
Ministry year 2000 Dairy cattle population
Characterization Survey dairy cattle population divided by ministry year 2000 population
Ground truthing Survey dairy cattle population divided by ministry year 2000 population
Characterization Survey dairy cattle population divided by Ground truthing survey two population
Maragua 136116 136649 79850 1.7046462 1.711321 1.003916 Nakuru 747056.5 281848 210258 3.5530468 1.340486 0.377278 Nandi 454458.8 373059 232370 1.9557551 1.605453 0.820886 Nyamira 133998.1 148712 50684 2.6437958 2.934101 1.109806 Vihiga 110986.1 95843 12726 8.7212046 7.531275 0.863559 Mean 3.7156897 3.024527 0.835089
Source: Smallholder Dairy Project ground truthing survey. Milk demand is expected to continue to increase due to growth of the human population for which the highest rate of growth is expected in the urban centres. It has been estimated that annual consumption of milk and dairy products in developing countries will be more than double between 1993 and 2020, from approximately 168 to 391 million tonnes (Thorpe et al. 2000). Population growth, urbanisation and increased purchasing power are expected to drive this increase in consumption. Estimated growth in the consumption of milk and dairy products in developing countries is 3.3 percent. This compares with the 2.6 percent annual growth reported by Leaver et al. (Leaver et al., 1998) for developing countries in the short term. In Kenya, the 3.3 percent projected annual growth in consumption seems to be in line with the country’s 2.5 percent per year population growth and the continued urbanisation. It is, however, doubtful whether this growth will be achieved in the near future, especially the proportion of growth in consumption expected from increased purchasing power, since the economic trend in the country indicates otherwise. On the other hand, demand for dairy products in the rural areas is said to be income inelastic (Staal et al., 2000). On the supply side, most of the increase in marketed milk has been based on continued increase in size of the dairy cattle population. This population has, however, stagnated over the last decade. The milk yield per cow has been very low, with an annual yield of 1300 kg/cow, which has been revised (MoARD, 2001) to 1500kg/cow. Lactation averages are also low for the officially recorded herds, comprised of the national dairy cow elite mainly owned by large-scale farmers. Available information from the Dairy Recording Services of Kenya (formerly the Kenya Milk Records) for the year 2000 show an average lactation (305 days) yield of 4477 kg for the Friesian–Holstein, which was the
25

highest for all the dairy breeds recorded (Esther Gicharu, Dairy Recording System of Kenya, personal communication). Considering the above scenario, indications are that both demand and supply have the potential to increase. On the demand side, per capita income especially for the urban population will be critical, while on the supply side, many factors will be in play: feeds and feeding, market infrastructure, relative milk price, production systems etc. Given the current economic situation, where real income levels seem to be declining and going by the past trends, supply and demand balance is not expected to change significantly. Even with the prevailing economic conditions, Kenya is self-sufficient in milk and milk products; this situation is likely to persist for some time to come unless the economic and market situations change. Nonetheless, if any change does occur the situation is more likely to move towards shortfalls in milk production than production of a surplus.
Public Health risk posed by milk and dairy products
There has been public concern and debate on health risks posed by the sale of raw milk by small traders (hawkers or itinerant traders) since the liberalization of the dairy industry in Kenya. The issue was more important when it became necessary to formulate post liberalization policy to harmonize the written policies and statutes with the prevailing market environment. There existed a strong mind set biased towards market control where the consumer has to be protected against all imaginable risk hazards. Sale of raw milk, especially by the hawkers was not permissible not even imaginable. All this bias was however without quantified support or information. The Smallholder Dairy Project started around the same time. The project purpose was then “Required actions for the creation of a supportive operational environment for smallholders supplying the Nairobi milk market” later revised to “Improved access by smallholder dairy farmers to technologies, advice and information”. The project offered to quantify the health risk posed by milk and dairy products to allow for informed debate on the topic and the formulation of the dairy policy. It was not only the information about health risks that was missing but the extent of raw milk sales was also not appreciated at the time. A Public Health Risks study to address the lack of accurate information on milk-borne health risks, and the need to define practical steps to optimise milk quality was commissioned in 1998. To assess the risks, the study quantified the major milk-borne public health hazards associated with raw and/or informal milk marketing pathways by: - determining the extent of and evaluating the public health hazards of bovine brucellosis, tuberculosis and other bacteria (including faecal coliforms and entero-pathogenic E. coli 0157:H7 in particular) transmitted through milk in target study sites and by extrapolating the impact to other areas; determining the extent of and evaluating the public health hazards of anti-microbials in marketed milk; evaluating the milk handling and hygiene practices of farmers, market agents and consumers; and, estimating the risk for each of anti-microbials, zoonotic organisms (Brucella abortus and Mycobacterium bovis) and other bacteria in the main unpasteurized milk market pathways (Omore et al., 2001).
26

According to Kenya Bureau of Standards (KEBS) standards, milk containing a total bacterial count of up to 1 million per millilitre is classified as very good; 1 million to 2 million as good; 2 million as bad and above 5 million as very bad. Similarly, milk containing coliform counts up to 1000 per millilitre is classified as very good; 1000 to 50,000 as good; 50,000 to 500,000 as bad and over 500,000 as very bad (Omore et al., 2001). Eighty six (86) percent of the milk samples in Nairobi and 88 percent in Nakuru urban had total counts of over 2 million/ml with no significant difference between the two towns (Table 7). In Nakuru rural a fairly high proportion of milk, but relatively less than that from Nairobi and Nakuru urban, had total counts over 2 million/ml. The results of the coliform counts showed a picture similar to total counts in both urban and rural areas. In Nairobi, over 46 percent of the milk had coliform counts over 50,000/ml and in Nakuru urban over 45 percent. The high counts show that milk bought by households for consumption in the two urban centres is of poor bacteriological quality. By contrast, only 12 percent of the milk from Nakuru rural had coliform counts over 50,000/ml showing that most of the milk was of relatively good quality. This maybe because time spent from producer to consumer was generally shorter than in the urban centres especially in Nakuru. The high number of bacteria in raw milk is a reflection of poor production and handling hygiene during milking, transportation to the market, storage at selling points and even at home. Initial loads at the production stage may be high. Unsanitary handling during transportation from source to sale points may add to the contamination. Coupled with these, long holding times in warm tropical weather by vendors and even by households before pasteurisation or boiling encourages rapid microbial multiplication. In the urban centres, milk goes through a number of handling stages without adequate control of hygiene or cooling and this favours contamination and multiplication of bacteria in the milk before the household buys it. The distances travelled and/or the time spent on the way from producer to consumer is sometimes long. All these factors contribute to the poor bacteriological quality of the milk. Overall prevalence of brucellosis at consumer and the informal market level as determined in the study were between 2.4 percent and 4.9 percent as determined using different methods. Informally traded bulked raw milk from dairy co-operatives and milk bars had the highest proportion of positive samples. Nearly all these samples were from Narok District where extensively grazed pastoralist zebu herds predominate. Two consumer households in Nakuru reported having had a member diagnosed with brucellosis in the previous one year. The test results generally reflect previous findings indicating higher farm-level prevalence of brucellosis in extensive and/or communal grazing areas than in smaller stall-fed herds. Human brucellosis is more common where extensive cattle production systems predominate.
27
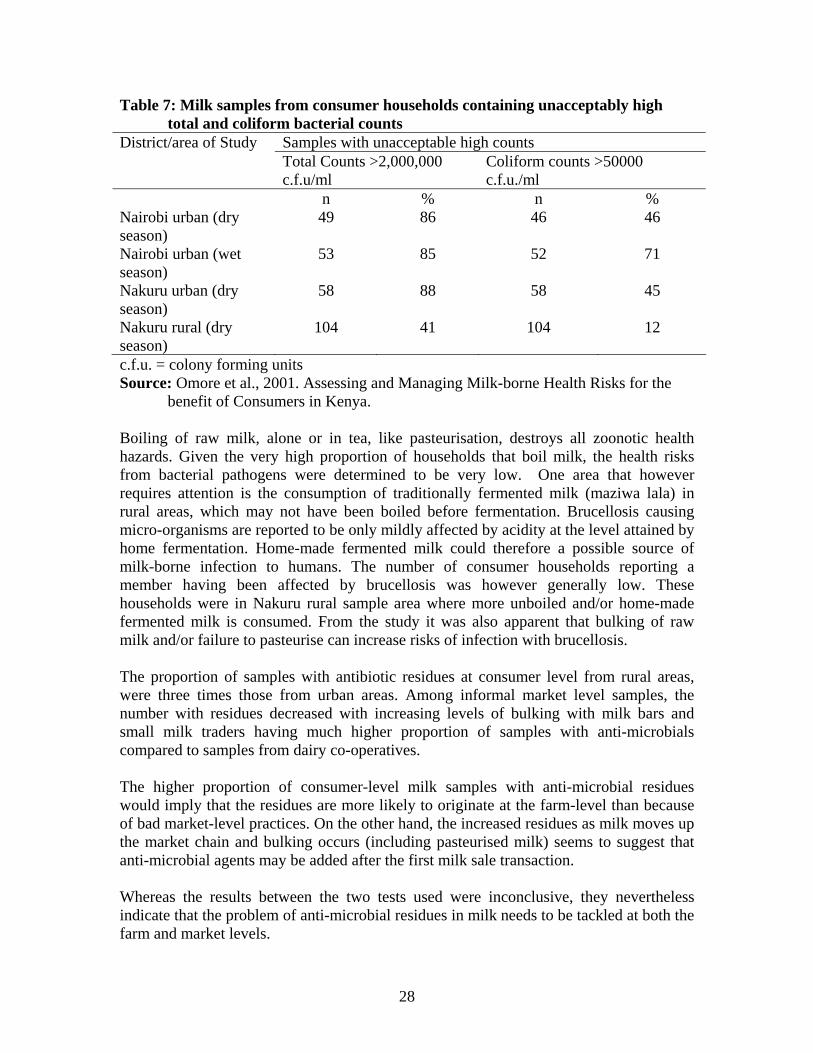
Table 7: Milk samples from consumer households containing unacceptably high total and coliform bacterial counts District/area of Study Samples with unacceptable high counts Total Counts >2,000,000
c.f.u/ml Coliform counts >50000 c.f.u./ml
n % n % Nairobi urban (dry season)
49 86 46 46
Nairobi urban (wet season)
53 85 52 71
Nakuru urban (dry season)
58 88 58 45
Nakuru rural (dry season)
104 41 104 12
c.f.u. = colony forming units Source: Omore et al., 2001. Assessing and Managing Milk-borne Health Risks for the benefit of Consumers in Kenya. Boiling of raw milk, alone or in tea, like pasteurisation, destroys all zoonotic health hazards. Given the very high proportion of households that boil milk, the health risks from bacterial pathogens were determined to be very low. One area that however requires attention is the consumption of traditionally fermented milk (maziwa lala) in rural areas, which may not have been boiled before fermentation. Brucellosis causing micro-organisms are reported to be only mildly affected by acidity at the level attained by home fermentation. Home-made fermented milk could therefore a possible source of milk-borne infection to humans. The number of consumer households reporting a member having been affected by brucellosis was however generally low. These households were in Nakuru rural sample area where more unboiled and/or home-made fermented milk is consumed. From the study it was also apparent that bulking of raw milk and/or failure to pasteurise can increase risks of infection with brucellosis. The proportion of samples with antibiotic residues at consumer level from rural areas, were three times those from urban areas. Among informal market level samples, the number with residues decreased with increasing levels of bulking with milk bars and small milk traders having much higher proportion of samples with anti-microbials compared to samples from dairy co-operatives. The higher proportion of consumer-level milk samples with anti-microbial residues would imply that the residues are more likely to originate at the farm-level than because of bad market-level practices. On the other hand, the increased residues as milk moves up the market chain and bulking occurs (including pasteurised milk) seems to suggest that anti-microbial agents may be added after the first milk sale transaction. Whereas the results between the two tests used were inconclusive, they nevertheless indicate that the problem of anti-microbial residues in milk needs to be tackled at both the farm and market levels.
28

The study showed an overall 4.7 percent and 10.4 percent of samples from consumer households and market agents, respectively, had specific gravity below 1.026kg/litre and therefore suspicious of adulteration by added water. Adulteration by addition of water to milk may introduce chemical and microbial health hazards as well as reducing the nutritional and processing quality, palatability, and market value of the milk. The number of samples to which water had been added varied widely by season and by area of sampling and there was no obvious effect of the type of market agent. There were also indications that there was addition of solids particularly in Nakuru where up to 9 percent of samples in the wet season had a specific gravity over 1.032 Given the very high proportion of households that boil milk, the health risks from bacterial pathogens, including brucellosis, were determined to be very low. Boiling attains a higher temperature and duration and therefore destroys all milk-borne pathogens. This practice should be encouraged, especially in rural / pastoral areas. The presence of anti-microbial residues, which are not destroyed by heat treatment, is however of concern.
Dairy information systems
The Kenya agricultural information base, including information on dairy, is relatively large, but as a study on Assessment of information needs and options for information management (MoALD&M, 1998) noted, it is neither here nor there and it is all over in known and unknown places. The study defined information as “a tangible entity that provides a basis for planning for the future”. Information has of late been recognized as one of the factors of production in addition to the traditionally known factors such as land, labour and capital. The same study identified types of information as: static, referral, dynamic and emergency information. Static information refers to that information that does not change or if it does, the change is relatively slow e.g. details in maps etc. The referral information is generated widely in routine activities and stored for possible future use. Dynamic information mirrors the ongoing disease and pest outbreaks. This observation on agricultural information is applicable to dairy industry information system. Dairy industry information in the country does not seem to exist in what can be described as an information system. Most of the information is available in the files and other documentation systems in institutions dealing with dairy. Assessment of sources and needs of agricultural information for the Ministry of Agriculture at a workshop (MoALD&M, 1998) listed the sources as follows: - a) Donor and intergovernmental organizations
- USAID (Bulletins, technical reports) - World Bank (working papers, bulletins, technical reports, library) - GTZ (working papers, bulletins, technical reports, library, publications,
posters, pamphlets, manuals)
29

- JICA (posters, leaflets) - FAO (publications, reports, leaflets, posters, videos, technical guidelines,
library) - ODA – now DFID (Adaptive research, agricultural information centre, mass
media activities) - SIDA (publications, posters, leaflets, bulletins and mass media) - UNICEF (Publications, technical reports, posters, pamphlets) - Netherlands Government (publications, posters).
b) International Research Centres
- ICIPE (Research reports on pest control, biotechnology, sericulture and bee keeping).
- ILRI (Research reports and information databases on livestock production and disease control).
- ICRAF (Agro forestry research reports and information databases). - ICRISAT (Research reports and information databases on dry land farming
technologies for sorghum and millet) - CIMMYT (Research and information databases on maize). - CIP (Research and information databases on Irish potato).
c) International NGOs
- OXFAM (Publications of technical and general awareness reports on food production and poverty alleviation).
- CARE (Technical reports, posters, pamphlets on agro-forestry, health nutrition and sanitation).
- FFH (Bulletins, posters on nutrition and food security). - ACTION AID (Technical reports, posters on food production). - HEIFER INT’L (Bulletins, technical reports and posters on dairy production). - FARM AFRICA (Technical reports and pamphlets on crop and livestock
production (mainly pastoral communities). - WWF (Publications, technical reports, posters, pamphlets on wildlife
management). - CAB INT’L (Publications, technical reports, research in sustainable
development of agriculture, forestry, human health & natural resource management).
- NRI (Publications, technical reports on environmental conservation and natural products).
d) Regional Organisations
- PTA (Periodic bulletins and pamphlets on marketing of agricultural produce, early warning on drought and famine, adaptive research reports and infrastructural logistics).
- IGADD (same as above). - FARMESA (same as above). - COMESA (same as above). - E. AFRICAN COOPERATION (same as above).
30

(d) National Organisations
- KARI (Research reports, bulletins, pamphlets and posters on crops, livestock and farming technologies).
- KIRDI (Research reports, bulletins and pamphlets on agro-industrial processing).
- KETRI (Research reports, bulletins and pamphlets on livestock disease control).
- KEMRI (Research reports, bulletins and pamphlets on human health). - KEFRI (Research reports, bulletins and pamphlets on forestry and agro-
forestry). - UNIVERSITIES (Pedagogic materials, research reports, bulletins on
agricultural production). - TRF (Research reports, bulletins and pamphlets on tea production and
processing). - COFFEE BOARD (Research reports, bulletins, pamphlets and posters on
coffee production, processing & marketing). - PYRETHRUM BOARD (Research reports and pamphlets on pyrethrum
production, processing and marketing). - KENYA SUGAR AUTHORITY (Periodic bulletins on sugar production and
marketing). - FISHERIES DEPT. (Bulletins, pamphlets and posters on fish production and
marketing). - CENTRAL BUREAU OF STATISTICS (Periodic inventory reports on
national and district-level crop production and marketing). - AGRICULTURAL INFORMATION CENTRE (Pamphlets and bulletins on
agricultural research, extension and production). - DEPT OF RESOURCE SURVEYS & REMOTE SENSING (Research
reports, bulletins and databases on crop, livestock and wildlife production trends).
- NATIONAL ENVIRONMENTAL SECRETARIAT (Technical reports, bulletins, pamphlets and posters on environmental impact and biodiversity).
- KENYA METEOROLOGICAL DEPT. (Daily and periodic weather measurements and forecasts).
- NATIONAL MUSEUMS OF KENYA (Research reports, bulletins, pamphlets, herbarium and museum collections of indigenous plants and animals).
- KENYA BUREAU OF STANDARDS (Bulletins and standard specifications for agricultural products).
From the list above the sources of information seems to be overwhelmingly large. The list is not even exhaustive and can be added other donors, inter-governmental and international organizations such as DANIDA, CIDA, FINNIDA, French International Aid Agency, OAU, IBAR etc.
31

Dairy information, as agriculture information, can be found in most of these organizations, especially those dealing with one form of dairy development or another. The same study on information needs for agricultural sector (MoALD&M, 1997) recognized one information requirement as “information on where to find information”. This is also true for dairy sub-sector. Dairy information base is also large and all over but there is no system of interlinking all the sources of information. Information is found in the Ministry of Agriculture and Livestock Development through its many branches and libraries and those specifically with dairy development mandate including various projects, donor, international development agencies and NGOs. International Aid and Development agents like WB, FAO, DANIDA, SIDA and others, have a collection of their own dairy information required to verify and assess aid and development needs in form of projects and for monitoring and prioritisation of new projects. Within the local institutions, dairy information can be sourced from KDB, KEBS, CBS, Government printers, Agriculture Information and Resource Centre and various dairy development programmes and projects such as the Smallholder Dairy Project. The Smallholder Dairy Project may probably be the leader, with the most up to date and scientific Kenya dairy industry data and information.
An FAO/GOK project (TCP/KEN/0167) has recognized the need of information system in strengthening the Kenya Dairy Board (Mugah, 2002) to play its role in the dairy industry effectively. At the moment, KDB information activities are scanty and not focused. The KDB is in the process of developing a dairy industry information system including database of dairy farmer’s organizations, service providers, milk sales centres, processors and sales intermediaries/vendors (Mugah, 2002). The information database should also include other dairy industry information such as dairy cattle statistics, milk and dairy products supply and demand, prices, policy and legal instruments, dairy research and extension activities, dairy import and export and linkages with related institutions.
There has been effort by FAO and others to develop a regional dairy information network but with no success to date. The Smallholder Dairy Project is also planning a website. Its design will aim at creating links to other related institutions like KARI, KDB, etc. It has already started to consult and discuss with partners the design and the content of the proposed web site.
Kenya dairy industry Strengths, Weaknesses, Opportunities and Threats (SWOT)
32

Strengths With over 3 million dairy cattle, Kenya hold over 85 percent of the dairy cattle population in Eastern Africa (Table 8) and over 70 percent of dairy cattle in Eastern and Southern Africa, including Zimbabwe and South Africa (Thorpe et al, 2000 b). This strengthens its position as the leader in dairying in Sub-Sahara Africa. The widespread adoption of dairy cattle in Kenya is a result of several interacting factors: conducive policy and institutional environments provided by successive governments in the country; the presence of a significant dairy population, owned by white settlers before independence; a suitable sub-tropical geography, the highlands, suitable for dairy cattle; smallholder communities who have a tradition of keeping cattle; and a large population who have milk as an important part of their diet (Thorpe et al, 2000 b). Table 8. Cattle numbers and milking cows in Sub-Saharan Africa and in selected countries in Eastern Africa, 1985 and 1998.
Total Cattle (000) Milking Cows (000)Sub-Saharan Africa and selected countries in Eastern Africa 1985 1998 1985 1998 Sub-Saharan Africa: 154,630 192,586 24,310 31,967Ethiopia 28,000 34,514 3,567 4,507Kenya 12,727 13,418 3,209 4,494Somalia 4,454 5,433 1,158 1,413Sudan 20,536 33,119 3,510 6,083Tanzania, U. Rep of 12,593 14,163 2,680 3,267Uganda 5,064 5,438 1,013 1,358
Source: Tambi et al. (2001). ILRI (International Livestock Research Institute). 2002. Proceedings of a South–South workshop held at NDDB, Anand, India, 13–16 March 2001 (modified).
The country has a potential to even widen its lead in milk production. Milk production has in the past increased through increase in cattle population. Production level per dairy cow per day is estimated at 4 to 8 litres (Staal et al., 2001) on average. Future increase in total milk production need not continue to depend on enlarged dairy herd. About half of the over 3 million head are mature cows, annual total milk production can be increased by about 500 million litres over the current level by increasing the daily production per cow by only one litre a day above the current level. Through improved feeding, adoption of improved production technologies such as use of planted fodder, purchased concentrates and minerals, higher total milk productivity per unit land and per cow can be achieved. According to Bebe (Bebe, 2003), milk production can be increased through keeping more cows (14-47 percent), upgrading the local Zebus (8-47 percent), producing more feeds (24-38 percent) and through other measures such as extension, advice, purchase of more feeds and improved disease control. Another source of strength in the Kenya dairy industry is the large and increasing population. Increased production can be absorbed in the market by increasing milk consumption in Kenya through consumer campaigns to encourage higher per capita consumption although Kenya has one of the highest per capita consumption in Sub-Sahara Africa (Muriuki H.G. and Thorpe W., 2002). Due to the high number of the dairy
33

cattle and other dairy species such as camel and goats, Kenya’s per capita milk availability is almost at the FAO/WHO recommended target of 100 kg (PFL Inception report, 2003) at 85 kg in 1998 estimate (Bebe, 2003). Annual per capita milk availability estimates of 106 litres (LME) have also been estimated (Thorpe et al., 2000 b) (Table 9).
Kenya with over 85 percent of the dairy cattle in the region can benefit from the regional combined human population of over 150 million (Kenya, Tanzania, Uganda and Ethiopia), not to mention other neighbouring countries like Sudan, Somalia, Rwanda and Burundi, where surplus production can be readily marketed. This however will depend on efficiency of production and marketing and on global activities such the elimination of subsidies. Table 9. Dairying in Eastern Africa: cattle, milk production and per capita milk availability. Parameter KENYA TANZANIA UGANDA ETHIOPIA
9,860 13,500 4,060 31,000Cattle (‘000) Zebu Dairy 3,045 250 150 <100Total annual milk prod. (‘000 MT)
3,075 814 455 738
Annual per capita milk availability, Litres LME
106 28 22 14
Sources: Thorpe et al, 2000 b.
There have been opposing views on whether Kenya’s policies should aim at self-sufficiency in milk and dairy products or should combine self-sufficiency and surplus production for export to the region taking its current strength and advantage of its large dairy cattle population (gene pool). Weaknesses
The mainly small-scale milk production and marketing in Kenya can be a source of weakness. The scale of milk output, 10kg per farm per day (Bebe, 2003), for which a quarter is retained for home consumption, can result in low bargaining power and limited ability to capture scale economy in the market (Muriuki H.G., 2002). To overcome this, the smallholders have developed strategies, which include selling milk directly through informal markets, use of milk traders for bulking and distribution, and forming collective groups such as self-help groups (SHG), co-operative societies and other farmer groups to sell their milk.
Rural infrastructures, especially the roads and sources of water are very poor and are another source of weakness in the Kenya dairy industry. The poor road infrastructure negatively affects milk price and profitability. Each additional kilometre of poor feeder road separating a farm from the main road will reduce milk price by about 3 percent per kilometre (Figure 3).
34

20
21
22
23
24
25
26
27
28
29
1 11 21 31 41 51 61 71
Distance (km)
Milk
pric
e (K
Shs/
L)
Informal market
Formal market
Figure 3: Effects of road infrastructure and distance on milk prices in the formal and informal milk markets in Kenya. (Estimated distance decay functions for change in farmer milk price with distance from largest city by tarmac road, formal and informal milk markets).
Source: Staal et al., 2003. Costs of milk production in Kenya (draft)
There have been attempts to introduce milk roads, as the case of tea and coffee roads. A proposal, in the early 1990s, by the Ministry of Agriculture and Livestock Development to develop rural dairy roads on a pilot basis did not materialize. A Dairy Development Project proposal by FAO (FAO, 1993) had a roads component to rehabilitate about 660 kilometres of roads in parts of Kericho (now in Bomet) and Nyandarua districts. The project was never implemented. Initial ideas were to first address the rural road sections that are impassable during the wet season but not to build or rebuild the whole rural road network. The design work for the FAO project were however for rebuilding whole rural road network in project areas. This could have been prohibitively expensive and the reason the project was a non-starter. The idea of dairy rural roads should be given prominence in the dairy policy and should be considered for future development efforts.
Milk production by smallholders in Kenya is based on forage, with very little use of concentrate or commercial feeds. The high dependence on rainfall for feeding dairy animals is a weakness. Kenya rainfall is bimodal with the long rains coming in March-June and the short rains in September-November. The reliance on rainfall results in supply fluctuations, which can be expensive to the industry. The problem of supply fluctuations does not seem to get a lot of policy attention other than at times when the processing sector is unable to absorb the over supply that occurs in the wet season. A lot
35

of losses due to over supply occur at this period and some estimate of losses put the loss at over 50 percent.
Supply fluctuations in the era of controls were managed through Kenya Co-operative Creameries (KCC), a quasi-government institution, whose policy, as imposed by government, was to accept all milk delivered in good condition. It had two milk driers to deal with excess intake and to make powder when necessary. After the liberalization, KCC, with its many problems, could not undertake this public role and the new entrants into milk processing sub-sector have no incentive to dry milk.
The management of seasonal surplus has been confused with the issue of strategic reserves and as is now the case in the proposed Dairy Development Policy, costs of processing surplus milk to various products i.e. milk powder and butter oil, is required to be borne by the government as part of food security management. While there is need to manage the supply fluctuation, this should not be confused with the issue of strategic food reserves. There are two possible ways of managing the supply fluctuation:
a) Throughout the year adequate cattle nutrition. This requires supplementation during the dry period. Prices should be compensatory as an incentive to supplemental feeding. Current common feeding practices are to supplement a milking cow with 2 kg of concentrate a day without regard to production level, body condition or quality of the roughage. Under nutrition in the early part of lactation can also have a negative effect on total milk produced in per lactation per head (Romney et al, 2000). Proper feeding, especially at early lactation, will increase the total milk production and will address the seasonal supply fluctuation problem.
b) Supply fluctuation can be addressed at the market place by converting the surplus milk to long life products such as milk powder, UHT, cheese etc. Milk powder is more preferable to others as a means of managing the surplus production since it can be reconstituted and has a longer life than the others. It however requires a larger capital outlay for its manufacture.
The proposed dairy policy has recognized that for the time being, the private sector may not have incentives to dry surplus milk and has therefore suggested this role be public and hence government responsibility. There is however no infrastructure for the government to take up this role. The driers with KCC, which is now a private company, as KCC 2000, are outdated and inefficient.
Almost 60 percent of Kenyans lives below the poverty line, i.e. below one US$ a day. This can have negative effects on total national consumption of milk and therefore total demand for milk and dairy products although the demand for dairy products in the rural areas is income inelastic (Staal et al., 2000). A milk price increase would result in lower milk consumption, as is manifest in the price elasticity for raw milk, which is over 80 percent of marketed milk. One per cent change in the price of raw milk results in 0.12, 0.26 and 0.93 percent change, in the opposite direction, in the quantity consumed for low, middle and high-income groups.
36
The high level of liquid milk consumption, over 90 percent of marketed milk (Omore et al., 2001), is also a weakness by itself. Milk is bulk and about 87 percent is water. Consumption of dairy products such as cheese and other concentrated products as Mawa and Paneer, favoured by communities of Asian origins (Mburu B.N, 2002), can tremendously increase per capita consumption, hence total milk (LME) consumption. It requires 10 kg of milk to make 1 kg of cheese on average. Fermented products such as yoghurts use milk powder to increase their solids level. Milk consumption in Kenya can therefore be increased through broadening the dairy products mix in the market and promoting the consumption of concentrated products.
Dairy markets and market institutions are weak and not reliable. Milk market can be defined as including formal and informal market pathways (Omore et al., 2001). The SDP Rapid Appraisal report (Omore et al., 1999) indicates that only 12 percent of the total marketed production passes through the formal channel or the processing channel (see Figure 2). The remainder, 88 percent, goes through direct sales to consumers (58 percent) and through co-operatives, self-help groups, hawkers, milk bars and kiosks (30 percent). The dairy market and institutions have been very dynamic since the liberalization in 1992. The processors had reached about 45, at one time, but the latest tally is 30 processors and only about 3 of them receive over 100,000 litres a day each or over half of the total (about 650,000 litres) daily delivery to processors (Ngurare, 2003). Marketing through co-operative societies and self-help groups would be the best way forward but co-operatives are not well regarded in Kenya due to corruption and inefficiencies while self-help groups are usually too small to exploit the economies of scale which is the incentive for collective action. The co-operative sector has been undergoing reforms, like other dairy sub-sectors, but the pace has been very slow. There is need for the country to move faster to reform all the policy and legal framework related to dairy. It has been suggested that Kenya require only one policy and legal framework instrument for dairy industry. This however may not be practical considering the number of institutions that have an interest in the dairy industry. Policy and legislative reforms are however a must in order to strengthen the dairy markets and marketing institutions. Opportunities
From a point of weakness, opportunities can be derived. A programme drawn to address the weaknesses discussed above would tremendously boost the dairy industry in Kenya.
Other than exploiting the opportunities derived from the weaknesses, the country has great opportunities deriving from its dairy industry strength in the region. The large dairy population creates tremendous opportunity for marketing of the dairy germplasm and products.
Little effort towards improvement of farm dairy management by small-scale dairy farmers can result to large amounts of milk output and hence to the market, assuming that home consumption is at its optimum, at the current level of about 40 percent of total production, and any increment from current production will be marketable. A production increase of a litre a day from the 625,000 smallholder dairy farmers would result to almost the amount of milk delivered to the processors today.
37

Dairy production receives more attention than most other agricultural enterprises, apart from cash crops such as coffee, tea and horticultural (floriculture) crops. This provides the industry with an opportunity to attract private, donor and government support in reform and development efforts within the sub-sector. The dairy sub-sector current potential to create rural employment (Table 10) and to boost farmers’ income can be improved. It performs better than other agricultural enterprises in terms of providing regular cash flow and liquidity, essential for household daily needs such as salt, cooking fat etc. This creates an opportunity for the dairy production and marketing technologies uptake and should result to accelerated adoption of market-oriented dairying. Increased human population also creates an opportunity for dairy production and marketing. In the past, increase in national herd size has come from continued sub-division of land for the increased farm household as a result of human population growth. This however has a limit and the potential for increased milk production will in the future depend on increased efficiency and productivity.
Dairy production and marketing in Kenya is not only an important source of livelihood to the over 625,000 dairy smallholder farmers and their households, it also creates off-farm employment opportunities. A joint ILRI Market Oriented Smallholder Dairy program and FAO Animal Production and Health Division study reported an overall number of both direct and indirect jobs created totalled to 2 and 0.3 for every 100 litres of milk traded depending on enterprise type (Omore et al, 2001 b) (Table 10). Raw milk sales by the mobile traders create more employment per 100 litres traded than the other pathways. For the economy to gain from employment in this sub-sector, policy and legal environment have to be reformed to accommodate this sub-sector. This does not in any way mean condoning= of sub-standard quality milk in the market but allowing innovative ways of internalising the sub-sector to bring them into the formal sub-sector. Bureaucratic mindset will also need to change since as of now the Kenya dairy industry is still, by and large, dominated by the pre-liberalization mindset.
According to the current dairy industry regulations, based on the views in the written legal framework, the mobile traders are illegal and are alleged to trade unhygienic milk which poses a health hazards to consumers. While their milk is not the best, it is not any worse than milk marketed through other channels (Omore et al., 2001). The approach should be setting standards for which the sub-sector should attain and be made to pay all the relevant taxes.
Table 10. Number of jobs created for every 100 litres of milk traded in by small- scale dairy marketing and processing in Kenya Enterprise type Direct jobs Indirect jobs Total Mobile milk trader 1.7 0.3 2.0Milk bar 1.1 0.3 1.4
38
Small processor 0.2 0.1 0.3Source: Omore et al., 2001 b. Employment Generation Through Small-Scale
Dairy Marketing and Processing: Experiences from Kenya, Bangladesh and Ghana
Threats
A major threat to the Kenya dairy industry would come from globalisation. As mentioned earlier, the Kenya dairy industry is dominated by the smallholders who control over 56 percent of production and over 80 percent of marketed milk (Peeler and Omore, 1997). The economies of scale may not favour this type of enterprise, relative to large-scale. However, due to availability of cheap labour, both family and hired, there may not be an immediate threat on the scale of dairy production. Smallholder dairy production is competitive and does not only benefit from cash sales but also from non-marketed outputs such as manure. Any dairy enterprise has other functions such as asset building and capital savings. For these reasons, the global threat through competitiveness may not be real. An SDP Cost of Milk Production Report notes that combined, the tangible and intangible non-marketed benefits of keeping dairy cattle could contribute significantly to farmer welfare, and in the long term to competitiveness of smallholder dairy systems in particular (Staal et. al., 2003). The results of analysis by the SDP, using 1997 to 2000 data set, show clearly that smallholder Kenyan dairy producers are able to capture useful profits, and are likely to continue to be competitive.
Producer and export subsidies and non-tariff barriers may also pause some threat to the Kenya dairy industry. This challenge is however minimized by the fact that, through WTO negotiations and agreement, participating countries are moving towards eliminating these subsidies. The WTO negotiations and agreements should be sustained to ensure competitiveness.
Although imported milk powder (LME) in Kenya may be cheaper than locally procured milk, the actual amounts of imports are still insignificant. Total milk powder imports for 3 years, 1999 to 2001, were about 5,400 tones half of which was for 1999 (Kiptarus J., 2002). This is equivalent to about 18 million litres (LME) per year which is less than 1 percent of annual production from the dairy herd, estimated at about 1,998 million litres in 2001. The threat of imports is however real to the farmers who sell through the formal market since imports of subsidized milk powder by processors for reconstitution makes economic sense. The current level of tariffs, 60 percent duty on all dairy imports outside COMESA and East Africa Community (Ngurare V.K., 2002), is prohibitive and eliminates any threats.
The disease situation in the country has been of concern. The prevalence of tick borne disease such as Foot and Mouth, East Coast Fever and others affects productivity through immediate and direct reduction of the animal productivity and in the long run. The level of disease control deteriorated after the liberalization of veterinary services in the 1980s (Omiti J., 2002). The private sector that was expected to be the alternative to the government services did not exist and has not adequately evolved. Private sector should be encouraged to evolve and provide these services. This will require full withdrawal of
39

Government veterinary services where there are private practitioners and commercialisation of the smallholder dairy sub-sector among other actions.
The smallholder dairy farmer and the small milk traders, who dominate the industry, do not have opportunities to be heard at the policy level. Most of the dairy stakeholders’ forums, where industry policies and other issues of concern to dairy are discussed, articulated and agreed are dominated by the large-scale commercial farmers and traders (processors) where policies and actions in their favour dominate. This threatens the growth of the smallholder sub-sector since most government policies and institutional arrangement will tend to favour the more vocal, large-scale system. There has been effort since 1996 to reform the dairy policy and legal framework but the progress has been very slow. The process should be accelerated and at the same time deliberate effort to accommodate policy that also favours the smallholder dairy farmers and milk traders be taken, without compromise on quality and growth of the industry.
Future of the Kenya dairy industry and the role of the small scale dairy farmers
Potential for Small Scale Dairy Farmers and their organisations
As has been indicated earlier, in Kenya, dairy production and marketing is dominated by the smallholder farmers and small milk traders. Smallholder dairy farmers own over 90 percent of the dairy herd estimated at 3.3 million head (MoALD, 2001). The dairy herd in the large-scale farms is estimated at below 150,000 head, down from 250,000 in 1965 when the total national dairy herd was at about 500,000 (Omore et al., 1999). Kenya dairy production and marketing is not likely to go large scale in the near future. Dairy production play a significant part of the rural economy, accounting for estimated 33 percent of the agricultural GDP (Staal et al., 2003) and is a major source of livelihood for over 625,000 smallholder farm families (Omore et al., 1999). The importance of dairy in the rural Kenya and its role as a provider of livelihood in many of rural households, where, about 80 percent of the Kenyan population lives is therefore not questionable. The contribution of dairying to sustenance of smallholder crop-dairy systems through its nutrient cycling and regular cash generation ability, employment creation and farm household nutrition ensures its sustainability and places it in a position to continue playing a major role in rural development in Kenya both now and in the future. With the current productivity level and the genetic potential in the smallholding, it is possible to increase total dairy output through adoption of improved technologies such as targeted feeding and more intensification of the production systems. Farmers’ organisations such as dairy co-operative societies have contributed significantly to the development of the smallholder dairy through milk marketing and provision of other services at relatively low costs (Owango et al., 1998). The performance of many co-operatives however declined in the 1990s due to liberalisation of the dairy industry
40

and the resulting competition, political interference and mismanagement. Dairy farmers contribution to the management of the co-operative societies is minimal and limited to election of the committee members. Due to the perception of helplessness in the management of their dairy societies and the mismanagement common to these societies, some degree of mistrust has developed in the past and the farmers have tended to move towards formation of self-help groups (SHG) which are smaller and where members have more influence on their activities. Self-help groups, although more popular than co-operative societies, have inherent problem due to their inability to borrow arising from their legal status. Co-operatives, dairy co-operatives included, have been undergoing a turbulent period trying to adjust to the liberalisation of the economy. According to the National Development Plan (2002 – 2008) and the Economic Survey (2002) there were over 9,000 co-operative societies that had been registered in 1999 out of which, 46 percent (about 4,200) were agricultural. About 330 Dairy Societies have been registered (CBS, 2002). Most of the co-operatives are dormant. Even with the active societies, only about 50 percent of members are active (Omore et al., 1999). Despite the problems in the co-operative societies, they are better placed for the collective interest of the dairy sector development (Omiti et al., 2000) if their governance problems are resolved. Some co-operatives process milk. Meru Central Co-operative Societies was among the first to start milk processing in 1984 followed by Kitinda Society (1986) and Limuru. Kitinda has been through a lot of difficulties. Meru and Limuru have an inbuilt daily capacity of 50,000 litres but operate at about 70 percent capacity. Co-operative societies and self-help group market only 12 percent (Staal et al., 2001) of the marketed milk. The relative importance of the different milk outlets however varies across the country. In areas with milk surpluses, co-operatives and other farmer groups tend to be more important. Due to advantages associated with scale economies, farmer groups such as co-operative societies and self-help groups are acknowledged as best placed to help farmers sell their milk and procure dairying inputs at low prices. There have been efforts to revise the Co-operatives Act to improve on the co-operative governance through better auditing, stricter supervision, delinking of government from their activities, effectively deal with disputes (Omiti, 2000) and generally make the co-operatives more efficient.
The informal sub-sector and improvement programmes in the dairy industry
The informal milk market or sub-sector can be regarded as that which handle, in most cases, raw milk and other dairy products and may not conform to milk market regulations (Staal et al., 2003). About 90 percent of marketed milk in Kenya is sold to consumers through informal milk markets (Omore et al., 2000) despite policies and legal framework that discourage these markets. In an SDP report (Ouma et al., 2000), it was reported that consumers in Kenya prefer raw milk than other dairy products. Raw milk is mainly traded through the
41

informal channel. It is therefore important to include the informal sub-sector in the improvement programmes to take advantage of the large proportion of milk market they command. This will also benefit both the consumers and producers who receive better prices from this channel. Measures to incorporate the informal market into the formal sub-sector will need to be multi-faceted. The strategy to include the informal sub-sector into improvement programme should include training, promotional campaigns, policy and legal framework reforms. Training should include: -
- Hygienic milk handling through the marketing chain. - Group formation and governance dynamics i.e. participation, management,
ownership and good governance. - Consumer education on milk quality. - Change of mind-set by regulators.
Training for hygienic milk handling will require targeting all the informal milk pathways starting from the farm level. At the farm level, the producer should understand the need and how to produce quality clean milk. From the farm, the informal pathways include: direct to the consumer; through a co-operative or a group to the consumer; or through a mobile and milk bar traders who procures milk either from the farmer or from a secondary sources such as a co-operative or a large milk trader who buys from the producers and bulks the milk before selling it to various customers. Training, especially on quality assurance, should target all these actors. Developing training manuals rather than attempting to have training sessions for everybody, which can be very expensive, should be the goal of the training programmes. The main objective of the training and campaigns should be to promote practices that ensure quality milk through the various informal market pathways. It should be targeted to make illustrations and references relevant to participants. The policy and legal framework will require reforms that will not only recognise the informal milk market pathways but also create a friendly environment for the sub-sector to operate while ensuring quality milk throughout the chain. Specifically the following issues should be addressed in the policy and legal framework reforms: recognition of the informal sub-sector, licensing, specification of how to carry out the trade, taxation, cessing or levying and representation of the informal market actors in the various regulatory institutions. The approach should be friendly and contain recommendations that are not seen like they compromise the quality and hygienic standards of milk and dairy products. Some of the activities should include formulation of quality standards and code of practice for each market channel including the informal pathway. This will ensure focus, targeting and clarity of the issues in those instruments for specific groups. It should not be seen to result to different milk quality standards for various pathways but should be seen as a way of encouraging informal market agents to conform to quality
42

milk and dairy products. To achieve this, the uniqueness of each informal pathway should be exploited. There already are efforts towards milk hygiene training programme mainly by FAO, and Land O’Lake through ILRI, and KDB, all in collaboration with the Smallholder Dairy Project, a MoALD/KARI/ILRI collaborative project. It is critical that the training materials are developed through a participatory approach, which includes the intended beneficiaries of the training program. There have been suggestions that the informal market sub-sector should be encouraged, through some form of regulation, to work with the formal sector, especially the processors, at both ends of the market chain, i.e. in milk collection to deliver to the processors and on the distribution side to sell pasteurised milk from the processors. While this is a good idea, it is counter to the reason the informal sector has thrived in the first place i.e. ability to offer better prices to both the producers and the consumers. This cannot therefore be rational. Trying to force this situation will not work for the same reason the informal sector has thrived, in the present situation where the legal framework discourage them. Prices will play a great role for this arrangement to be tenable. Both the producer and the consumer prices will have to be competitive and attractive to the informal sub-sector. The consumer however will have the final say. It will be therefore important to understand the dynamics of milk and dairy products demand in Kenya. For the policy and legal framework reforms to occur, there is need to develop strategies to influence policy advisors and decision makers. The first line of influencing is to collate the existing information on the informal milk market and develop targeted briefs, based on facts and scientific evidence on issues. To have an impact on the prevailing mindset, there is need to avoid generality and target each level of key policy and legal framework actors. Targeted briefs will have more impacts on various policy formulation and decision-making levels. The policy briefs should be supplemented by different types of forums where presentations are done by experts and are focussed to different audience along the policy formulation and decision chain. Messages should be relevant to each focus group. The strategy to incorporate the informal sector into the dairy sub-sector improvement programs should avoid controversies, while being emphatic, and should convincingly be seen as an improvement program by the key players in the dairy industry otherwise it will be met with resistance. The Lactoperoxidase system (LPS) for enhancement of the milk collection system, in the absence of cold chain, through prolonging milk storage life is an example of how new and good ideas can be scuttled through poor communication. LPS has been met with resistance because of some comments made during Codex Committee meetings. diring which it was mentioned that milk treated with LPS should not be traded internationally. Despite the advantages of LPS and the apparent widespread misuse of the Hydrogen peroxide in the Kenya dairy market, LPS is viewed with suspicion and may not be accepted until this comment is clarified.
43
Reduction of post harvest losses of milk and dairy products
It has been pointed out that the magnitude of the post harvest milk and dairy products losses in Kenya is not adequately documented and available statistics on this are not based on scientific evidence but on assumptions. The losses can occur through spillage and spoilage. Spoilage may be the most common source of losses. At the farm level, it has been speculated that there is a lot of “forced consumption”, especially the evening milk, due to lack of a cold chain and organised collection system. The loss associated with “forced consumption” is income that would have accrued if that milk were marketed. The Daily Master Plan indicated that within the Government, there was an assumption that total milk intake could rise by about 40 to 50 percent if evening milk were collected (MOLD, 1991) implying this amount was “forced consumption”. The SDP Rapid Appraisal Study (Omore et al., 1999) refers to a claim by the MoALD field officers that 30 percent of milk produced is lost annually due to poor roads. Post harvest milk losses of 7 percent through leftovers were reported by a study on health risk (Omore et al., 2001). Verbal communication with MoALD district staff put the losses by the farmers and the co-operative societies at between 5 and 10 percent of the milk marketed through the co-operative pathway. Review of district reports on milk rejects by co-operative societies seem to indicate a much lower percentage loss than this, at below 5 percent. There has also been a claim of a loss of about 45 percent by some societies during wet seasons when the processors impose unilateral rationing or milk quotas of the amount delivered to their processing plants. From the above, it is apparent that the major source of milk losses is the seasonal imbalance between supply and demand and the problems of milk collection associated with poor infrastructure such as rural roads, water and sources of power for servicing and maintenance a cold chain. The seasonal milk supply fluctuation can be addressed through price incentives and through on-farm feeding strategies. Price incentives will encourage on-farm feeding strategies if properly managed. The Kenya Government had attempted to address this in 1985, during the era of price control, by establishing a dry season bonus or premium to be paid by the market monopoly, the KCC (Waithaka et al., 2003), during the months of January to April. This however did not work. Review of the milk intake by KCC did not indicate supply response to the January – April premium. There is no incentive to offer any price premium during the dry season unless this makes economic sense. While the supply fluctuation between the seasons is usually large, the demand side is fairly stable. Another way of stabilising supply and demand is to establish a mechanism for drying the wet season surplus for utilisation in the dry season. This option will only be applicable if it makes economic sense. Losses of milk due to non-collection of evening milk, referred to as “forced consumption”, will require development or setting up cooling facilities for bulking and overnight storage of evening milk to be collected with the morning milk. An assumption by the Government, back in 1980, that the evening milk is collectable turned out to be false. The Government provided 60 coolers between 1981 and 1990 to societies in
44

Central, Eastern, Western, Rift Valley and Nyanza provinces (MoLD, 1991). The cooler utilisation rate in 1991 was: about half were used regularly though not fully, quarter were used reasonably while the other quarter were not used at all (MoLD, 1991). Even the coolers reported to be in regular use were not used at optimal capacity. Farmers have adapted their milking and marketing habits to cater for non-collection or non-delivery of evening milk. It has been observed that farmers will sell most or all the morning milk and use the evening or afternoon milk for household, calf feeding and sale or gift to the neighbourhood. The amount of milk obtained in the afternoon is not the same amount as the morning milk. Milking in the afternoon is done after a shorter interval than between the evening and the mornings milking. It should be noted that use of coolers introduces need for logistics and financial considerations. A cooler requires a source of power either from a power line or from a power generator. Use of generator requires of a reliable and affordable source of fuel. This is an additional cost, which has to be recovered in the product price. Use of coolers can only therefore be possible where the market appreciates the added costs associated with cooling and pays for it. Processors are already paying a premium to those producers who can guarantee a certain minimum of quantity and quality thereby indirectly paying a premium for milk cooling. For milk losses due to spoilage, different management practices are required at different levels. Most losses occurs due to road condition and the time it takes to deliver milk, which is determined and influenced by the road condition and the distance. With proper organisation, control mechanism and agreement between parties involved, and where the distances and road condition result to milk taking more than two to three hours depending on the ambient temperature, an LPS system can be applied. LPS prolongs milk storage life by 7 to 8 hours at 30 – 32oC ambient temperature if it was of good quality at the beginning and if properly handled. LPS is more effective than the hydrogen peroxide and does not mask the original quality of milk. This system does not substitute for cold chain and is only for situation where a cold chain is not practical. It does not also substitute for proper hygienic handling of milk. At the milk bars level, where a loss of about 7 percent through leftover from the previous days milk occur, it can be reduced by hygienic handling and proper management. The milk bar owner should have pasteurising (boiling) and cooling facilities and should be able to determine milk quantities required for a day. Use of quality assurance measures along the whole milk market chain will significantly reduce the losses. Those trading in milk and milk products should be able to use simple quality control measure to determine the wholesomeness of milk. This can be achieved through training the players along the milk chain, on how to handle milk and dairy products and how to assess quality and ensure no contamination occurs at the transaction point.
45

Critical points in the dairy industry where quality and safety can be improved
To identify critical points in the dairy chain where quality and safety can be improved, the milk marketing flow chart on page 18 (Figure 2), which depicts the flow of milk from production point to consumption, can be used. The potential milk borne hazards in the chain include dirt, additions such as water, fats or other solids, excessive load of bacteria and presence of antibiotics. These hazards can enter the milk chain at many points along the market chain depending on handling and the ethical attributes of the actors along the chain. Addition of water or adulteration of milk can occur at the farm and at the market level accidentally or deliberately to increase the volume and earn more cash. At the market level, this can happen when raw milk traders may want to stretch their profitability. Accidental water adulteration can also occur at the processing level, in the cleaning and sterilisation system. The problem with adulteration it is not only that it is cheating the purchaser but also that bacterial and other contaminants can be introduced into the milk chain through dirty and contaminated water. The same applies for other substances such as margarines, which may be introduced at the market level. Critical points for antibiotics or antimicrobials are at the farm level due to none compliance with drug manufacturers withdrawal recommendations and at the market level where it has been alleged that some traders add antimicrobials in the milk to increase its shelf life. This however is not supported by evidence. It is also costly to use and may therefore not be the best alternative to prolong milk shelf life. The commonly used product in the milk chain is hydrogen peroxide and there has been claim that it has been detected even in processed milk in the market. Hydrogen peroxide can be introduced at the farm level, at the market level before processing and by any market actor although the practice may be more common with middle-men and mobile traders. Contamination of milk with dirt will most likely occur at the farm level where poor and careless handling can allow mud, dung, dust or other contaminants within the milking area to enter into the milk. A critical hazard to milk chain is the bacteria especially excessive load of bacteria or presence of the pathogenic ones. Most of the hazards explained above can be the source of excessive bacteria load or pathogenic bacteria in milk. A common way through which to introduce pathogenic bacteria in milk are frequent milk transfers by the market agents, contact with unclean surfaces and unclean handlers. This can happen at farm and market level, when apportioning and transferring milk from milking containers to other containers. Contamination is also most likely to occur at different market level when transferring milk between traders and where bulking occurs. An analysis of critical control points (CCPs) in the Kenya milk-marketing channel using an OLS regression was done as part of the assessing and managing milk borne health
46

risks study (Omore et al., 2001). These results are presented below. The results are discussed as risk factors in market channel, consumer outlets and consumer milk purchasing points.
Identification of Critical Control Points (CCPs)
Risk factors in market channels Results of the OLS regression and multivariate analyses were used to identify critical control points (CCPs) along market channels. All market points with coefficients that were significant at p<0.10, and risk factors with weights of 0.5 or more were considered to be potential CCPs.
Critical Control Points for Adulteration The coop to shops/kiosks pathway had significantly higher SNF (indicating non-adulteration). Higher SNF was negatively associated with margin per litre. Similarly, there was also a very significant difference between the means of profit margins of milk traders with dichotomised values for adulteration milk, indicating that addition of water is currently rewarding to those who practice it and that milk quality checks currently practiced are ineffective in limiting the practice. The clustering analysis shows the small group of medium scale milk traders (MSPQHM) are the worst culprits.
Critical Control Points for Total Plate Counts CCPs for relatively high TPCs in milk (compared to the farm-coop pathway) were pathways from farms to shops/kiosks. There were also some significant differences in TPC between contrasting areas of market access. The pathway from farms to milk bars in intensive and high milk market access (IHMA} had milk of significantly worse quality than the same pathway in the extensive and low market access area (EMMA). The use of plastic containers in EMMA was significantly associated with worse bacterial quality than the same practice in IHMA. Time elapsed since collection had a modest association with TPC. Every hour that elapsed increased TPC by 3 percent. Given the average TPC of 39, 800 x 103, every hour that elapses would add another 1,200,000 bacteria to the milk, though this would largely depend on the phase of bacterial growth at the time. The association of wet season and poor quality milk may be related to the increased time that milk takes to reach retail points (perhaps due to bad roads). The clustering analysis shows that those selling milk of the worst quality were the small group of medium scale milk traders (MSPQHM) with up to 90 percent of their milk not meeting current national standards set by KEBS. Boiling of milk will eliminate any bacterial health risks.
Critical Control Points for Coliform Counts The farm to the cooperative pathway had significantly worse milk quality as measured by coliform bacteria than pathways from farm to shops/kiosks and from mobile traders to milk-bars. There were also some significant differences in coliform counts between pathways in different market access areas: The pathway from farm to the cooperative in EMMA sold worse quality milk than the same pathway in IHMA and the pathway from farm to shop/kiosk in IHMA sold worse quality milk than the same pathway in EMMA. Though not significant in the dataset modelled above, high coliform counts were associated with the use of plastic versus metal containers among market agents using the complete dataset and scooping of milk versus pouring was also associated with higher
47

coliform counts. Both handling practices should therefore be discouraged. Non-preservation of milk by cooling was associated with higher coliform counts, reflecting the benefit of cooling. Interestingly, in contrast to the case for TPC, wet season was associated with better quality milk. The use of piped water was associated with higher coliform counts, perhaps because such water is usually not flowing in many areas. Both the small-scale clusters (SSN & SSLM) and the medium scale cluster (MSPQHM) had similar average coliform counts, 53-60 percent of which did not meet standards set by KEBS, compared to only 26 percent of milk samples collected from large-scale cluster that did not meet the same standards. Boiling of milk will eliminate any risks from coliform bacteria.
Critical Control Points Brucellosis and M. Bovis Brucella antibodies were significantly associated with farm to milk-bar pathway with all samples being sourced entirely from extensive grazing systems (EMMA). This has health implications for the small fraction of consumers who may not boil milk before consumption, especially if it is bulked raw milk. The study did not identify any M. bovis and risks from the pathogen are considered non-existent or very low. Boiling of milk will eliminate any risks from all zoonotic organisms.
Critical Control Points for Antimicrobials Antimicrobial residues were significantly associated with farmer to mobile milk trader pathway, milk separation and warm weather. It is more likely that the antimicrobial residues originated at the farm since no agent admitted adding antimicrobials to preserve milk and milk directly sourced from producers in the rural areas had relatively high anti-microbial levels in the consumer survey. More information on causal relationships at the farm-level is needed to devise appropriate farmer education materials that would include advice on withdrawal periods following therapy. Antimicrobial residues in milk were thus considered the most important health risk identified, given that it cannot be dealt with by heat treatment.
Critical Control Points in consumer milk purchase points Risk factors identified in analyses of consumer-level data largely reflected those from market-level analyses (Table 11). Table 11. Descriptors of quality measures in milk collected from consumer outlets, Comparison to market-agents (separate datasets)
Source of milk Geometric mean TPC x 103
Geometric mean CPC x 103
SNF
Consumer Market Consumer Market Consumer MarketFarm/own production 1,590 - 1.0 - 9.1 - Home delivery 15,850 - 10.0 - 8.9 - Farmer group/Coop - 7,940 - 15.8 - 8.6 Shop/kiosk 79,430 39,810 25.1 63.1 8.8 8.6 Milk bar - 79,430 - 100.0 - 8.6 Mobile trader 39,810 39,810 20.0 63.1 8.7 8.6 Local market 251 - 0.6 - 8.8 - NB. Dash (-) = Not applicable
48

Source: Omore et al., 2001. Assessing and Managing Milk-borne Health Risks for the Benefit of Consumers in Kenya. The influence of season and production potential/market access on both total and bacterial counts was similar to what was found with market-level data. The consumer milk retail points with the highest average total bacterial count per ml. were shops and kiosks. Pathways serving these outlets were also identified in the regression analysis of market-level data as CCPs for TPC. Shops and Kiosks also had the highest mean coliform counts. Differences in factors influencing SNF were weak. Consumer perceptions and practices to reduce milk-borne health risks Reports of brucellosis and TB by household respondents were generally low. More consumers in Nairobi (65 percent) were aware of the public health risks associated with raw milk consumption compared to Nakuru rural (23 percent) and Nakuru urban (44 percent). All urban households and 96 percent of household in Nakuru rural boiled raw milk before consumption. About 6 percent of households, mostly from Nakuru rural, consumed home made fermented milk (often un-boiled before fermentation) in the previous one month before each seasonal survey. One area that requires attention is the consumption of traditionally fermented milk (maziwa lala) (consumed by 6 percent of households in rural areas in this survey). This milk is often not boiled before fermentation, which lowers the pH of milk from about 6.8 to about 4.5. Some pathogens may not be affected by fermentation. For example, Br. abortus organisms are only mildly affected by acidity at this level. This would imply that home-made fermented milk could be a possible source of milk-borne infection to humans. The survival of these and other pathogens such as pathogenic E. coli in fermented milk also needs further investigation. It is note-worthy all those who reported a member having a household member having been affected by brucellosis were from the Nakuru rural area where some unboiled and/or home-made fermented milk is consumed. It is also apparent that bulking of raw milk by large-scale raw milk market agents or failures in large-scale pasteurization can increase risks of infection with brucellosis or any zoonotic agent. To address the milk borne health hazard in Kenya, a standard code of hygienic, practice for production, handling and distribution of milk and milk products has been published (KEBS, 2000) and was launched last year (2002) at a high profile meeting. In its preface, it is noted that the liberalisation of the dairy sector resulted in proliferation of sales of milk and milk products of unknown quality under poor hygienic handling practices. This raised concern over the health of consumers who were exposed to milk distributed by personnel of unknown health in vehicles, containers and equipment of questionable cleanliness and under uncontrolled temperatures, which may be contaminated or exposed to conditions likely to prove un-whole or injurious to human health. The Code of Practice therefore outlines the production of milk from health animals, milked by clean personnel, handled, processed and distributed in a hygienic manner to protect the consumer (KEBS, 2000). This sums up the official view of the critical points in the dairy
49

chain and how to improve quality and safety. The analysis by Omore et al., is informed and can be used as a reference point for future amendments of the Code of Practice. To control all the identified milk borne hazards in the Kenya’s dairy chain, a focused market chain CCPs analysis will be required to complement the results by Omore et al., and to design a system of control adequate to ensure quality and safety of milk and dairy products, without being punitive to any group in the milk chain.
Results and Recommendation from Kenya National dairy sub-sector Assessment
Policy & Legal Framework
Major reforms in the dairy sub-sector in the recent past include: 1988 implementation of cost recovery in the sale of veterinary drugs; 1989 decontrol of animal feed prices; 1989 transfer of cattle dips management to local communities; 1991 privatisation of A.I. services; decontrol of milk prices1992; and the 1994 privatisation of clinical services. However the documented policies and regulations have not kept up with these changes. The dairy policy and legislation review and revision process started in 1996 is not yet complete. Recent activities (May 2003) within the Ministry of Agriculture and Livestock Development are however encouraging. The Minister has taken the initiative to table the revised Dairy policy and the Bill with the Cabinet. The Ministry has also resubmitted the 2 documents to the Parliamentary committee concerned with agriculture. However, some policy issues may need immediate address even after publication of the revised policy and legislature. The issues that need address among others are:
– the structure and role of KDB in a liberalized dairy industry and various stakeholders representation in the board of directors;
– the importance of, and how to deal with raw and informal milk marketing which is over 85 percent of marketed milk and considering the sectors contribution to rural employment and the price benefits both to the producer and the consumer;
– the trade-off between potential milk borne health hazards, quality and the welfare benefits derived from the informal milk marketing; and
– rural infrastructure, especially the roads whose improvement can enhance the efficiency of milk market especially in prices.
Post Harvest milk losses
Information on post harvest losses in Kenya is minimal or lacking. At the smallholder farm level, the losses may be negligible, but a category of loss, referred to as “forced consumption” (arising from evening and wet season production) can be large where and
50

when it occurs. Some estimates of losses indicate a loss of as high as 35 percent in wet season, below 5 percent at the co-operatives and almost negligible at the processing. Assumption by the Ministry of Agriculture and Livestock Development that evening milk is collectable and can increase marketed milk by 40 to 50 percent may have been false as demonstrated by the level of usage of coolers that were distributed in the 1980s and 90s. There is therefore need for a study to quantify post harvest milk losses and the level of “forced consumption” which should combine with identification of critical quality control points in the dairy chain (to supplement available information).
Critical points in the dairy chain
Potential milk borne hazards in the chain arise from contamination and poor or unhygienic handling. Additions such as water, fats or solids non-fat, excessive bacterial load and presence of anti-microbial residues are some of possible source of milk borne health hazards. Some critical control points (based on the results of a study by Omore et al.):
– Milk adulteration can occur at all points and pathways but medium scale milk traders have been found to be the worst culprits;
– Medium scale milk traders also sell milk of the worst quality, in terms of bacteria load, with up to 90 percent of their milk not meeting current national standards (TPC) set by KEBS;
– The pathways from farms to shops/kiosks show relatively high TPC;The – Farm to the cooperative pathway show significantly worse milk quality
as measured by coliform bacteria than pathways from farm to shops/kiosks and from mobile traders to milk-bars;
– Brucellosis antibodies were significantly associated with farm to milk-bar pathway and from extensive grazing systems;
– M. bovis has been viewed as a possible milk borne health hazard but it was not identified in the study and risks from the pathogen are considered non-existent or very low; and
– Antimicrobial residues are significantly associated with farmer to mobile milk trader pathway and warm weather and most likely originate from the farm.
Dairy information systems
Information has of late been recognized as a factor of production in addition to the traditional factors i.e. land, labour and capital. It is “a tangible entity that provides a basis for planning for the future”. Dairy information base is large and available from various bodies as the International, Regional and National organizations, NGOs, Donor and Government institutions. It is all
51

over but neither here nor there. There have been doubts on the quality of available information, especially on accuracy. There are efforts by FAO, ILRI, KDB and SDP to develop dairy information system but nothing concrete has been developed. Development of a dairy information system should receive more resources and high priority.
Recommendations and possible project interventions
Informal sector Training and Technology transfer (based on CCPs)
Farm level Training At the farm level, the issues include: “forced consumption”; introduction of anti-microbial residues to milk; presence of Brucellosis; adulteration; and consumption of fermented raw milk (unpasteurised or not boiled). As a result, training for the dairy farmers should cover:
– Potential milk borne hazards; – Potential milk contaminants and how to avoid them; – Proper milking and clean milk production; – Health status of the animal, how to recognise the problem and how to
solve it; and – Proper use of drugs or medicines (according to manufacturers
recommendations) and observation of withdrawal period as recommended.
Co-operatives/Groups and Large scale traders The critical quality control issues with this category of dairy industry stakeholders include: milk bulking; bacterial load build-up; potential for contamination with coliforms due to handling; presence of anti-microbial residues; and Brucellosis. Training for this group should include:
– Hygienic milk collection, transportation and handling; – Quality control and assurance of milk received including minimum tests
before accepting deliveries; – Best and sustainable milk preservation methods including cooling and
storage alternatives; – Potential sources of contamination; and – General cleanliness of the premises.
Milk bars, Kiosks and Shops Some of the issues for this group include: milk adulteration; fermentation of unpasteurised left over milk; holding of raw milk for long time; and high bacterial load
52

Recommended training:
– Simple quality tests of incoming milk; – General cleanliness and proper milk handling; – Milk preservation and storage, pasteurisation (boiling) and cooling; and – Processing of various dairy products.
Mobile traders The milk quality issues with the mobile traders or hawkers include: adulteration, addition of fats and solids non fat, use of Hydrogen peroxide, bacterial load, potential contamination with coliforms, presence of anti-microbial residues, inappropriate containers Recommended training:
– General information on milk and dairy products including good quality assurance practices;
– Simple milk quality tests; – General cleanliness; – Personal hygiene and hygienic milk handling practices; – Use of proper milk containers; and – Keeping and storage options to maintain milk quality.
Common ground and issues
It is observed that some of the issues are common across the milk market pathways. Such issues include:
– Ethical issues – milk adulteration and additions of margarines, wheat flour and other substances not recommended. This is usually cheating and is done to stretch profitability;
– Need for accurate information; – How to deal with the reality over 85 percent of marketed milk which is
sold in raw form in terms of policy, legislature and in consideration of market liberalisation. How to include, give voice, recognise the players in this segment and enhance employment potential; and
– Stakeholder empowerment, especially farmers and small traders, through collective actions (coops/groups), book keeping, lobby for inclusion in policy formulation and decisions
Technology transfer
The technologies required to address and to reduce milk post harvest losses should not only be those applicable at post harvest level. The technologies should also target milk
53

production and supply to control unmanageable surges, which also contribute to losses such as “forced consumption”. Technology transfer should therefore include:
– On-farm feeding strategies aimed at reducing supply fluctuations; – Milk quality preservation and cooling methods, which should be simple
and economical such as charcoal coolers, in-churn water bath, etc. Lactoperoxidase system of milk preservation need to be validated after which it should be disseminated if proved viable and acceptable;
– Milk collection systems that are efficient. A combination of technologies should be tested to shorten distance and time between collection and delivery to plant or consumption point; and
– On-farm processing, cottage industries and/or micro-enterprises to deal with seasonal supply surges through processing of long life dairy products at the village level.
Awareness raising on Dairy products safety
The issues that make it necessary to raise awareness are milk and dairy products consumption levels and habits and the potential for milk borne hazards including the presence of anti-microbial residues. Awareness activities should include:
– Press and electronic media campaigns; – High profile campaigns such as appointed dairy day in a year (June dairy
month); – School targeted activities such as visits to schools to lecture on milk and
dairy products health attributes. This should be by renowned personalities who school children can associate with;
– Development and publication of issues oriented, targeted and focused pamphlets, briefs & newsletters; and
– Generic advertisement focusing more on nutritional aspects of milk The following should be considered and highlighted in the awareness raising campaigns:
– Various milk and dairy standards including the code of practice; – Importance of milk in nutrition especially for young and invalids; – Simple methods of determining wholesomeness of milk and testing of
possible adulteration; – Sourcing of milk. Sourcing from a trusted vendor, where hygiene is
manifest; – Potential milk borne risks and sources of risks; and – The advantages of pasteurisation/boiling of milk meant for consumption
Information needs for the Kenya dairy industry
54

It is established that dairy information is available in many places but there is no system linking the scattered bits of information. The accuracy of some of the basic information such as dairy statistics is suspect. There is need for appreciation of the value for information (quality) by all, especially at the policy level. The dairy industry information needs therefore include:
– Accurate statistics on dairy including information on stakeholders, such as institutions and people involved in the dairy industry, etc., dairy production and marketing statistics, etc., contribution of dairy to economy, etc.;
– Information on where to get information on dairy; and – A dairy industry information system based at KDB to include dairy
industry library with mechanism to link with all dairy information nodes in the country, a documentation system to track and acquire relevant information on Kenya dairy industry and a dairy information website with links to relevant site. The KDB dairy information system should be a sub-system of Kenya agricultural information system and its website should be linked or part of a regional dairy information system.
55

References
Baltenweck I., Staal S.J., Owango M., Muriuki H., Lukuyu B., Gichungu G., Kenyanjui M., Njubi D., Tanner J. and Thorpe W. 1998. Intensification of dairying in the Greater Nairobi milk-shed: Spatial and household analysis. Smallholder Dairy (Research & Development) Project. MoA/KARI/ILRI Collaborative Research Report. ILRI (International Livestock Research Institute), Nairobi, Kenya. Bebe B.O., 2003. Herd dynamics of Smallholder dairy in the Kenya highlands. PhD thesis, Wageningen University, The Netherlands. ISBN: 90-5808-788-3. CBS (Central Bureau of Statistics). 2002. Economic Survey 2002. Ministry of Finance and Planning, Nairobi, Kenya. CBS (Central Bureau of Statistics). 2001. 1999 Population and housing census. Volume I. CBS, Office of the President and Ministry of Planning and National Development, Nairobi, Kenya. CBS (Central Bureau of Statistics). 1999. Statistical abstract 1999. CBS, Office of the President and Ministry of Planning and National Development, Nairobi, Kenya. Conelly W.T. 1998. Colonial era livestock development policy: Introduction of improved dairy cattle in high-potential farming areas of Kenya. World Development 26:1733–1748. FAO (Food and Agriculture Organization of the United Nations). 1993. Kenya Dairy Development Project preparation report. Report 34/93 CP–KEN 33. FAO, Rome, Italy. KEBS (Kenya Bureau of Standards, 2000. Kenya Standard Code of Hygienic Practice for Production, Handling and Distribution of Milk and Milk Products. KS. 67. 020 Kenya Government. 1965. The Dairy Commission of Inquiry (Kibaki) Report. Ministry of Agriculture. (DAIRY/INQ/A/64). Kiptarus J. 2002. Milk marketing – dairy imports/exports. Paper presented at a Kenya Dairy Board-Milk Processors workshop at Fairview Hotel. 22nd October 2002. Leaver J.D., Santos F.J. and Anderson S. 1998. Meeting consumer demands for milk and identifying research priorities. In: Gill M., Smith T., Pollott G.E., Owen E. and Lawrence T.L.J. (eds), Proceedings of a symposium organised by the British Society of Animal Science held at Nairobi, Kenya, 27–30 January 1998. BSAS Occasional Publication 21. BSAS (British Society for Animal Science), Edinburgh, UK. pp. 43–51.
56

Lekasi J.K., Tanner J.C., Kimani S.K. and Harris P.J.C. 1998. Manure management in the Kenya highlands: Practices and potential. The Henry Doubleday Research Association, Brainsdale, Victoria, Australia. 35 pp. Mburu B.N. 2002. A Study on Dairy Micro and Small Enterprises with Potential for growth in Nairobi, Nakuru, Eldoret, Kisumu and Meru Urban Areas. A TechnoServe-Kenya report. MoALD (Ministry of Agriculture and Livestock Development), 2001. Animal Production Division Annual Report. MoALD (Ministry of Agriculture, Livestock Development and Marketing). Kenya Dairy Development Policy 1993. MoARD (Ministry of Agriculture and Rural Development). 1995. Agricultural sector review. ASIP Secretariat, Kilimo House, Nairobi, Kenya. MoARD (Ministry of Agriculture and Rural Development). Kenya Dairy Development Policy proposal 2000. Unpublished. MoALD&M (Ministry of Agriculture, Livestock Development and Marketing), 1998. Assessment of information needs and options for information Management study report. ASIP Secretariat, Kilimo House, Nairobi, Kenya MoLD (Ministry of Livestock Development). 1991. Kenya Dairy Master Plan. Report prepared for the Ministry by the Danish International Development Agency, August 1991. MoLD, Nairobi, Kenya. Mullins G., Wahome L., Tsangari P. and Maarse L. 1996. Impact of intensive dairy production on smallholder farm women in Coastal Kenya. Human Ecology 24:231–253. Muriuki H.G. 1991. Liquid milk supply and demand in the formal (KCC) market in Kenya: A government price fixed market. MSc thesis, University of Illinois at Urbana-Champaign, USA. Muriuki H.G., Thorpe W. 2002. Smallholder dairy production and marketing in eastern and southern Africa: Regional synthesis. ILRI (International Livestock Research Institute). 2002. Proceedings of a South–South workshop held at NDDB, Anand, India, 13–16 March 2001. NDDB (National Dairy Development Board), Anand India, and ILRI (International Livestock Research Institute), (multi-document CD-Rom) Nairobi, Kenya. Ngigi M.W. 2002. An evaluation of the impacts of Transaction Cost and Market Participation of Smallholder Dairy Farmers inCentral Kenya. PhD thesis, Unversity of Nairobi, Kenya.
57

Ngurare V.K. 2003. Introduction to a structured Kenya Dairy Board. A paper presented to a KDB Strategic planning workshop. Unpublished. Omiti J. 2002. Impacts of liberalization in Kenya’s dairy sector. ILRI (International Livestock Research Institute) 2002. Smallholder dairy production and marketing—Opportunities and constraints. Proceedings of a South–South workshop held at NDDB, Anand, India, 13–16 March 2001. NDDB (National Dairy Development Board), Anand India, and ILRI (International Livestock Research Institute), (multi-document CD-Rom) Nairobi, Kenya. Omiti J., Muma M. 2000. Policy and institutional strategies to commercialise the dairy sector in Kenya. IPAR Occasional Paper series. Institute of Policy Analysis and Research, Nairobi, Kenya. Occasional Paper No. 006/2000. Omore A., Arimi S., Kangethe E., McDermott J., Staal S., Ouma E., Odhiambo J., Mwangi A., Aboge G., Koroti E., and Koech R. 2001 a. Assessing and Managing Milk-borne Health Risks for the Benefit of Consumers in Kenya. MoA/KARI/ILRI/UoN/KEMRI Collaborative Research Report, Smallholder Dairy (Research & Development) Project, Nairobi, Kenya. Omore A., Cheng’ole Mulindo J., Fakhrul Islam S.M., Nurah G., Khan M. I., Staal S.J. and Dugdill B.T. 2001 b. Employment Generation Through Small-Scale Dairy Marketing and Processing: Experiences from Kenya, Bangladesh and Ghana. A joint study by the ILRI Market-oriented Smallholder Dairy Project and the FAO Animal Production and Health Division (draft). Omore, A.O., McDermott, J.J., S. Arimi, S.M. and Kang'ethe, E.K. 2000. Analysis of Public Health risks from Consumption of Informally Marketed milk in Kenya. Paper presented at the Faculty of Veterinary Medicine Biennial Scientific Conference. Nairobi, Kenya. Omore A., Muriuki H., Kenyanjui M., Owango M. and Staal S.J. 1999. The Kenya Dairy Sub-sector; A rapid appraisal. Smallholder Dairy (Research and Development) Project Report. Nairobi, Kenya. 51 pp. Ouma E., Staal S.J., Omore A., Wanjohi P., Njoroge L. and Njubi D. 2000. Consumption patterns of dairy products in Kenya. MoA/KARI/ILRI Collaborative Research Report, Smallholder Dairy (Research & Development) Project, Nairobi, Kenya. Owango M., Lukuyu B., Staal S.J., Kenyanjui M., Njubi D. and Thorpe W. 1998. Dairy co-operatives and policy reform in Kenya: Effects of livestock service and milk market liberalisation. Food Policy Journal 23(2):173–185. Peeler E.J. and Omore A. 1997. Manual of livestock production systems in Kenya. 2nd edition. KARI (Kenya Agricultural Research Institute), Nairobi, Kenya. 138 pp.
58

Romney D., Kaitho R., Biwott J., Wambug M., Chege L., Omore O., Staal S.,m Wanjohi P. and Thorpe W. 2000. Technology development and field-testing: Access to credit to allow smallholder dairy farmers in central Kenya to reallocate concentrates during lactation. Proceedings of the 3rd All Africa Conference on Animal Agriculture and 11th Conference of the Egyptian Society of Animal Production, Alexandria, Egypt. 6-9 November 2000: Vol. II, 133-139. SDP (Smallholder Dairy Project), 2003. Policy brief on dairy products preferences and consumption patterns in Kenya (Draft). Staal S.J, Owango M., Muriuki H., Kenyanjui M., Lukuyu B., Njoroge L., Njubi D., Baltenweck I., Musembi F., Bwana O., Muriuki K., Gichungu G., Omore A., and Thorpe W. 2001. Dairy System Characterisation of the Greater Nairobi Milk Shed. Smallholder Dairy (R&D) Project. KARI/MoA/ILRI Collaborative Dairy Research Programme, ILRI, Nairobi, Kenya. Staal,S., Waithaka, M., Njoroge, L., Mwangi, D.M., Njubi, D., Wokabi, A. 2003. Costs of milk production in Kenya (draft). MoA/ KARI/ILRI Collaborative Research Report. Smallholder Dairy (Research and Development) Project, Nairobi, Kenya. Staal S. and Muriuki H. 2000. Policies and the informal sector in the dairy industry. Paper orally presented at a Land O’Lake Round Table Meeting in Malawi. (unpublished). Staal S., Delgado C. and Nicholson C. 1997. Smallholder dairying under transactions costs in East Africa. World Development 25:779–794. Staal S., Chege L., Kenyanjui M., Kimari A., Lukuyu B., Njubi D., Owango M., Tanner J., Thorpe W. and Wambugu M. 1998a. Characterisation of dairy systems supplying the Nairobi milk market: A pilot survey in Kiambu District for the identification of target groups of producers. Smallholder Dairy (R&D) Project. KARI/MoA/ILRI Collaborative Dairy Research Programme, ILRI, Nairobi, Kenya. pp. 85. Staal S., Owango M., Muriuki H., Lukuyu B., Musembi F., Bwana O., Muriuki K., Gichungu G., Omore A., Kenyanjui M., Njubi D., Baltenweck I. and Thorpe W. 1998b. Dairy systems characterisation of the Nairobi milk shed: Application of spatial and household analysis. MoA/ KARI/ILRI Collaborative Research Report. Smallholder Dairy (Research and Development) Project, Nairobi, Kenya. Staal S., Ouma E. and Jabbar M. 2000. Household Demand for Dairy and Food Products in Urban and Rural Kenya. Smallholder Dairy (R&D) Project. Staal S.J., Kruska R., Balteweck I., Kenyanjui M., Wokabi A., Njubi D., Thornton P. and Thorpe W. 1999. Combined household and GIS analysis of smallholder production systems: An application to intensifying smallholder dairy systems in Central Kenya. Paper presented at the third international symposium on Systems Approaches for
59

Agricultural Development (SAAD-III) held at Lima, Peru, 8–10 November 1999, National Agrarian University, La Molina, Lima, Peru. Thorpe W., Muriuki H.G., Omore A., Owango M.O. and Staal S. 2000 (a). Dairy development in Kenya: The past, the present and the future. Paper presented at the annual symposium of the Animal Production Society of Kenya, Nairobi, Kenya, 22–23 March 2000. Thorpe W., Muriuki H.G., Omore A., Owango M.O. and Staal S. 2000 (b). Development of smallholder dairying in Eastern Africa. Paper prepared for the UZ/RVAU/DIAS/DANIDA-ENRECA project review workshop, 10-13 January 2000, Bronte Hotel, Harare, Zimbabwe. Waithaka M., Omore A. Muriuki H., Hooton N., Staal S.J., Odhiambo P. 2003. The Policy Environment in the Kenya Dairy Sub-Sector: A Review (draft). MoA/KARI/ILRI Collaborative Research Report. Smallholder Dairy (Research and Development) Project, Nairobi, Kenya.
60