reduced burden from major diseases due to an increase in
TRANSCRIPT

Reduced burden from major diseases due to anincrease in vegetable intake in Japan: projections ofdisability-adjusted life years, 2017-2040Shiori Tanaka ( [email protected] )
University of TokyoDaisuke Yoneoka
St. Luke's International UniversityAya Ishizuka
University of TokyoPeter Ueda
University of TokyoKeiji Nakamura
Tokyo City UniversityHisayuki Uneyama
Ajinomoto (Japan)Naoki Hayashi
Ajinomoto (Japan)Kenji Shibuya
King's College LondonShuhei Nomura
Keio University
Research Article
Keywords: disability-adjusted life years, vegetable consumption, Japan, future projection, cardiovasculardiseases, cancer, diabetes, kidney diseases
Posted Date: December 18th, 2020
DOI: https://doi.org/10.21203/rs.3.rs-122329/v1
License: This work is licensed under a Creative Commons Attribution 4.0 International License. Read Full License

Version of Record: A version of this preprint was published at BMC Public Health on April 21st, 2021. Seethe published version at https://doi.org/10.1186/s12889-021-10772-2.

1
Title: Reduced burden from major diseases due to an increase in vegetable intake in Japan: projections 1
of disability-adjusted life years, 2017-2040 2
3
Authors: Shiori Tanaka1,2#†, Daisuke Yoneoka1,3,4#, Aya Ishizuka1, Peter Ueda 1,5, Keiji Nakamura6,7, 4
Hisayuki Uneyama7, Naoki Hayashi7, Kenji Shibuya1,8, Shuhei Nomura1,4 5
# Shared first authorship 6
7
Affiliations: 8
1. Department of Global Health Policy, Graduate School of Medicine, The University of Tokyo, 9
Tokyo, Japan 10
2. Epidemiology and Prevention Group, Center for Public Health Sciences, National Cancer Center, 11
5-1-1 Tsukiji, Chuo-ku, Tokyo 104-0045, Japan 12
3. Graduate School of Public Health, St. Luke's International University, Tokyo, Japan 13
4. Department of Health Policy and Management, School of Medicine, Keio University, Tokyo, 14
Japan 15
5. Clinical Epidemiology Division, Department of Medicine, Solna, Karolinska Institute, Stockholm, 16
Sweden 17
6. Graduate School of Environmental and Information Studies, Tokyo City University, Yokohama, 18
Japan 19
7. Ajinomoto Co., Inc., Tokyo, Japan 20

2
8. Institute for Population Health, King's College London, London, UK; Department of Global 21
Health Policy 22
23
†Correspondence: Shiori Tanaka 24
Department of Global Health Policy 25
Graduate School of Medicine, The University of Tokyo 26
7-3-1, Hongo, Bunkyo-ku, Tokyo 113-0033, Japan 27
E-mail: [email protected] 28
Fax: +81-3-5841-3637; Tel: +81-3-5841-3688 29
30
Word count (abstract): 291 31
Word count (main texts): 3941 32
Figure: 3 33
Table: 2 34
Supplementary Figure: 9 35
Supplementary Table: 2 36
Reference: 42 37
3
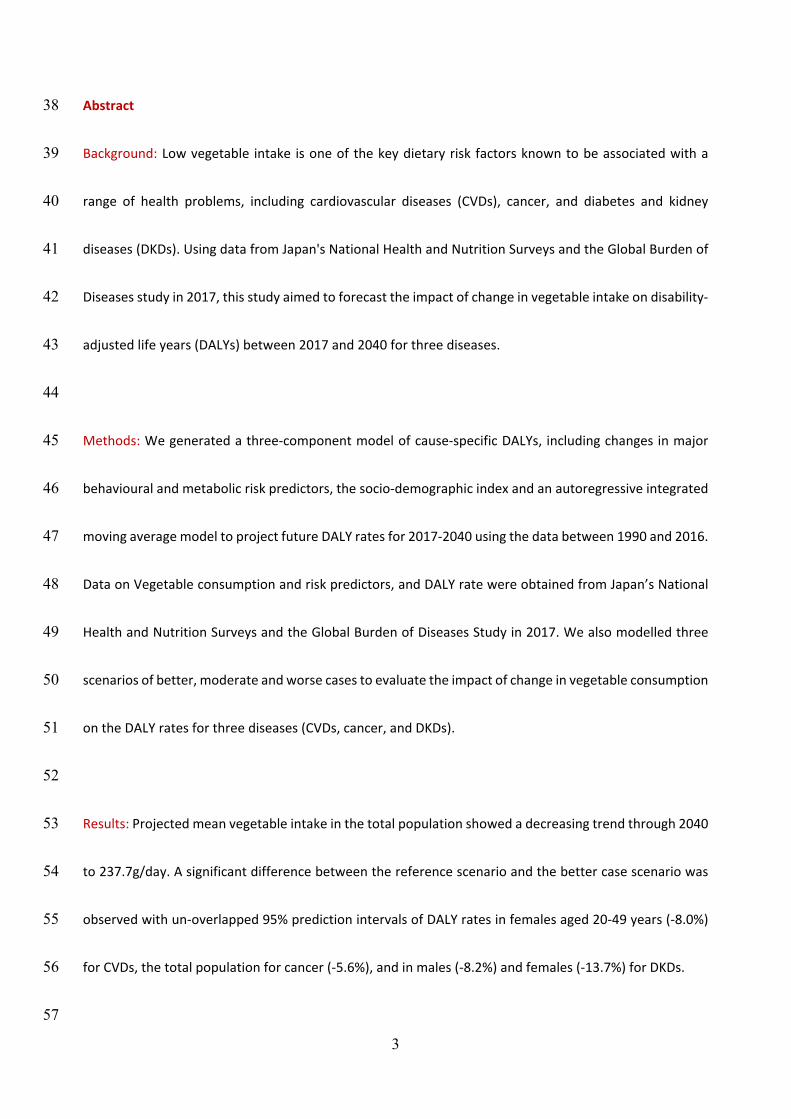
Abstract 38
Background: Low vegetable intake is one of the key dietary risk factors known to be associated with a 39
range of health problems, including cardiovascular diseases (CVDs), cancer, and diabetes and kidney 40
diseases (DKDs). Using data from Japan's National Health and Nutrition Surveys and the Global Burden of 41
Diseases study in 2017, this study aimed to forecast the impact of change in vegetable intake on disability-42
adjusted life years (DALYs) between 2017 and 2040 for three diseases. 43
44
Methods: We generated a three-component model of cause-specific DALYs, including changes in major 45
behavioural and metabolic risk predictors, the socio-demographic index and an autoregressive integrated 46
moving average model to project future DALY rates for 2017-2040 using the data between 1990 and 2016. 47
Data on Vegetable consumption and risk predictors, and DALY rate were obtained from Japan’s National 48
Health and Nutrition Surveys and the Global Burden of Diseases Study in 2017. We also modelled three 49
scenarios of better, moderate and worse cases to evaluate the impact of change in vegetable consumption 50
on the DALY rates for three diseases (CVDs, cancer, and DKDs). 51
52
Results: Projected mean vegetable intake in the total population showed a decreasing trend through 2040 53
to 237.7g/day. A significant difference between the reference scenario and the better case scenario was 54
observed with un-overlapped 95% prediction intervals of DALY rates in females aged 20-49 years (-8.0%) 55
for CVDs, the total population for cancer (-5.6%), and in males (-8.2%) and females (-13.7%) for DKDs. 56
57

4
Conclusions: Our analysis indicates that increased vegetable consumption would have a significant 58
reduction in the burdens of CVDs, cancer and DKDs in Japan. By estimating the disease burden attributable 59
to low vegetable intake under different scenarios of future vegetable consumption, our study can inform 60
the design of targeted interventions for public health challenges. 61
62
Keywords: disability-adjusted life years, vegetable consumption, Japan, future projection, cardiovascular 63
diseases, cancer, diabetes and kidney diseases 64

5
Introduction 65
Epidemiological research has shown that increased vegetable is associated with a reduced risk of several 66
NCDs, including CVDs, high blood pressure, diabetes, cancer and metabolic syndromes (1-5). Furthermore, 67
it has been reported that an optimal amount of vegetable consumption reduces the disease burden of 68
CVDs, cancer and diabetes (6). In the 2017 Global Burden of Disease (GBD) analysis in Japan, assessing the 69
impact of 67 risk factors, including behavioural, metabolic, environmental and occupational factors, on 70
disease burden measured as disability-adjusted life years (DALYs), low vegetable intake was the fifth most 71
significant dietary risk factor affecting DALYs, following diets high in sodium, low in whole grains, fruits, 72
nuts and seeds (7, 8). 73
74
The recommended amount of vegetable consumption varies per country (9). In Japan, the government 75
has set a consumption target for an average of 350g of vegetables per capita by 2023 in their ten-year 76
national health promotion plan “The second term of National Health Promotion Movement in the twenty-77
first century” (Health Japan 21 (the second term)) (10). According to the National Health and Nutrition 78
Survey (NHNS), however, the average vegetable consumption per capita for Japanese adults has steadily 79
been below 300g/day since 1947 (with an exception for 2006)(11, 12). Moreover, the trend points towards 80
a decrease in vegetable consumption in recent years (13), and the consumption target is thus unlikely to 81
be attained. 82
83

6
This study aims to predict the future trend in the vegetable intake and to estimate the disease burden of 84
CVDs, cancer, DKDs under several scenarios of vegetable intake in Japan. By doing so, we aim to provide 85
an empirical basis for future interventions and policies to improve the health of the people in Japan and 86
other countries with low vegetable consumption. 87
88
Methods 89
Overall forecasting model structure 90
We followed the methodological approach of Nomura and Yoneoka et al. (2020) (14). GBD data from 1990 91
to 2016 were used to predict the future values from 2017 to 2040 for DALYs attributable to three disease 92
groups that have been identified to be associated with low vegetable intake. DALYs is a comprehensive 93
measure of disease burden, comprised of years lived with disability and years of life lost due to premature 94
death. The three disease groups were neoplasms, CVDs and DKDs from level 2 in the GBD hierarchical 95
causal structure. The GBD hierarchy causal structure ranges from level 1 of the three basic groups 96
(communicable, maternal and neonatal conditions, and nutritional deficiencies; non-communicable 97
diseases; and injuries) to level 4 of the most detailed 359 diseases groups. 98
99
Following the GBD's prediction methodology (15), we developed a three-component model of cause-100
specific DALYs for the three disease groups. This model included a component explained by changes in 101
major behavioural and metabolic risk predictors including vegetable consumption, which is the main 102
predictor of interest in this project, socio-demographic index (SDI), and an autoregressive integrated 103
7
moving average (ARIMA) model that captures the unexplained components over time. Separate 104
projections models were developed by sex and three age groups (20-49, 50-69, and ≥70 years、and all 105
ages). The 0-19 years age group was not included in the model because of lack of data on risk predictors 106
including smoking and alcohol intake. Further detailed information on data and model formula is described 107
below. 108
109
DALYs and SDI data, 1990-2016 110
We used the estimated DALY rates per 100,000 population for CVDs, all cancers, and DKDs as well as SDI 111
in Japan for the years 1990-2016 reported in GBD 2017 (16). SDI is a composite indicator of development 112
status strongly correlated with health outcomes, wherein a 0 to 1 index value was determined for each of 113
the original three covariate inputs, including total fertility rate under the age of 25, mean education for 114
those aged 15 and older, and lag distributed income(16). An index score of 0 represents the minimum level 115
of each covariate input, while as an index score of 1 represents the maximum level of each covariate. 116
117
Behavioural and metabolic risk predictor data, 1990-2016 118
We used consecutive nationwide data to characterise sex- and age-specific average daily vegetable intake 119
and prevalence of current smoker, current alcohol drinker, and obesity (defined according to the Japanese 120
definition of a body mass index (BMI) of 25 kg/m2 or over) following the design of a previous study(14). 121
The NHNS is a nationally representative household survey, which is conducted annually by the Japanese 122
Ministry of Health, Labour and Welfare in order to capture the distribution of dietary habits, nutrition 123

8
intake and lifestyle at a population level (17). The NHNS consists of three parts: 1) physical examination 124
including a blood test performed by a medical team at community centres; 2) an in-person survey of a 125
weighted single-day dietary record of households investigated by registered dieticians who visit and check 126
the participant's survey compliance; 3) a self-reported lifestyle questionnaire such as smoking status and 127
alcohol consumption. Only those aged 20 years or older were subjects to the lifestyle questionnaire. 128
Details of survey design and procedures of NHNS are available elsewhere (17, 18). The dietary intake 129
survey was conducted on a single designated day by household representatives, usually by those who are 130
responsible for food preparation. Trained interviewers (mainly registered dietitians) instructed household 131
representatives on the measurement of food and beverages consumed by the household members and 132
verified the survey compliance. The proportion of shared dishes, food waste, and foods that were eaten 133
out were also recorded. The nutrient intake and food consumption were estimated using the dietary 134
record and the corresponding food composition list of the Japanese Standard Tables of Food Composition 135
(19) We also obtained individual level data on the intake of green and yellow vegetables, other vegetables, 136
vegetable juices and salted vegetables. The data on food consumption from 1995 was used because 137
individual food consumption values before 1994 were not available. 138
139
In this study, vegetable intake was defined as the intake of green and yellow vegetables, and other 140
vegetables by referring to GBD 2017 definition as follows: average daily consumption of vegetables (fresh, 141
frozen, cooked, canned or dried vegetables excluding legumes and salted or pickled vegetables, juices, 142
nuts and seeds, and starched vegetables such as potatoes or corn) (7). 143

9
This study was performed in accordance with the Declaration of Helsinki. Written informed consent was 144
not required, as this study was a secondary analysis of anonymised data that is collected routinely by the 145
MHLW. Data of GBD 2017 are also secondary, aggregated estimates by country, sex, and age groups. 146
147
ARIMA model for forecast 148
The ARIMA model, one of the most classic methods of time series analysis, was employed to forecast 149
future DALY rates adjusting for several risk predictors. It is a moving average (MA) model combined with 150
an autoregression (AR) model to fit the temporal dependence structure of a time series using the shift and 151
lag of historical information. 152
153
The Box–Jenkins methodology was adopted to fit the ARIMA (p, d, q) model with orders p, d, q: 154
�1 −�𝛼𝛼𝑖𝑖𝐿𝐿𝑖𝑖𝑝𝑝𝑖𝑖=1 � (1 − 𝐿𝐿)𝑑𝑑𝑦𝑦𝑡𝑡 = �1 + �𝛽𝛽𝑖𝑖𝑞𝑞
𝑖𝑖=1 𝐿𝐿𝑑𝑑�𝜀𝜀𝑡𝑡 , (1) 155
where 𝑦𝑦𝑡𝑡 is the outcome of interest, 𝜀𝜀𝑡𝑡 is an (white noise) error term with an intensity of 𝜎𝜎2 at time 𝑡𝑡, 𝐿𝐿 is 156
time lag operator defined as 𝐿𝐿𝑘𝑘𝑦𝑦𝑡𝑡 = 𝑦𝑦𝑡𝑡−𝑘𝑘 , and 𝛼𝛼𝑖𝑖 and 𝛽𝛽𝑖𝑖 are the coefficient parameters (20). Before 157
constructing the model, the stationary state of observed data in the series must be identified using Dickey-158
Fuller test (20). All variables were log-transformed. If non-stationary is assumed to be plausible, the data 159
was transformed into a stationary time series by taking a suitable difference with order d. The 160
autocorrelation function and the partial autocorrelation function was used to identify the stationary status 161
and the search range for orders of the model. The model estimation was carried out after an initial model 162

10
has been identified; generally, model parameters are estimated by using maximum likelihood methods. 163
Akaike's Information Criterion (AIC) was calculated to select optimal models with the orders. 164
165
We used a two-step approach to forecast the DALY rates: the first step was to independently forecast the 166
values of each predictor from 1995 until 2040 using Equation (1), and then the second step was to forecast 167
the log-scaled DALY rates 𝑦𝑦𝑡𝑡 by using the following Equation (2) with the predicted values of the above 168
predictors: 169
170
�1 −�𝛼𝛼𝑖𝑖𝐿𝐿𝑖𝑖𝑝𝑝𝑖𝑖=1 � (1 − 𝐿𝐿)𝑑𝑑𝑦𝑦𝑡𝑡 = �𝛾𝛾𝑗𝑗𝐿𝐿𝑑𝑑𝑥𝑥𝑡𝑡𝑗𝑗4
𝑗𝑗=1 + �1 + �𝛽𝛽𝑖𝑖𝑞𝑞𝑖𝑖=1 𝐿𝐿𝑑𝑑�𝜀𝜀𝑡𝑡 , (2) 171
172
where 𝑥𝑥𝑡𝑡𝑗𝑗 was the value of 𝑗𝑗th predictor at time 𝑡𝑡 and 𝛾𝛾𝑗𝑗 was a coefficient parameter for 𝑗𝑗th predictor. All 173
analyses were conducted by STATA version 16 using the ARIMA procedure. The parameters in Equation 174
(2) were separately estimated by age and sex groups. 175
176
Future scenario analysis for vegetable consumption 177
We assumed three scenarios of better, moderate and worse cases to evaluate the impact of change in 178
vegetable consumption on the DALY rates for three diseases (CVDs, cancer, and DKDs) for 2017-2040 using 179
the smoothed data between 1995 and 2016. A reference forecast was set as the current trend was 180
maintained, namely the projected vegetable consumption during 1995-2040 derived from the ARIMA 181

11
model in Equation (1). The better case scenario considered achieving the target daily vegetable 182
consumption (350g/ day) in 2023 as per Health Japan 21 (the second term), which the guideline provides 183
as the recommendation and goals of lifestyle to improve population health defined by the Japanese 184
government. This scenario assumed a constant monotonic increasing function from 2017 to 2023 and a 185
constant level of 350g/day after 2023. The moderate case scenario assumed that the target vegetable 186
consumption would be achieved in 2040 rather than in 2023 with the monotonic increase function. As 187
such, vegetable consumption as of 2040 was the same values in the better and moderate case scenarios. 188
The worse case scenario assumed a constant monotonic decrease in vegetable consumption from 2017 to 189
2040 by the level of 2004 when the lowest consumption was recorded in decades because of higher 190
vegetable prices. By inserting values derived from assumed alternative scenarios into the Equation (2) as 191
a predictor, we predicted the final value of DALY rates until 2040 for each scenario. The DALY rates in the 192
better and the moderate case scenarios mathematically converged to the almost same values in 2040 193
since both scenarios would meet the same level of vegetable consumption by 2040. 194
195
Results 196
The sex- and age- group specific characteristics of the study are as shown in Table1. The mean vegetable 197
intake, the prevalence of current smokers and the prevalence of current alcohol drinkers declined over 198
time, whereas SDI and the prevalence of obesity increased. 199
200
(Table 1 here) 201

12
202
The observed (1995-2016) and predicted (2017-2040) vegetable consumption for reference and different 203
scenarios were as summarised in Table 2. There was a marked difference in vegetable intake by sex- and 204
age- group. In particular, younger females (20-49 years old) had the lowest vegetable intake; conversely, 205
older males (≥70 years old) were more likely to consume an increased amount of vegetables over time. A 206
projected mean vegetable consumption of the total population showed a decreasing trend through 2040 207
to 237.7g/day, which was lower than the lowest level of consumption observed in 2004 (Table 2). Similarly, 208
the levels of vegetable consumption in the reference forecast were lower than those of the worse scenario 209
forecasts for males aged 20-49 years, males aged 50-69 years, females aged 20-49 years, and females aged 210
50-69 years. 211
212
(Table 2 here) 213
214
Future trends of DALY rates for cardiovascular disease, cancer, and diabetes and kidney diseases 215
Cardiovascular disease 216
The best combination of parameters (p, d, and q) in the ARIMA models derived from Equation (2) with 217
corresponding AIC values are provided in Supplementary Table 1. Estimated DALY rates of CVDs for all age 218
by sex and scenarios are shown in Figure 1 and for age-sex specific groups are shown in Supplementary 219
Figure 1-3, respectively. In all four scenarios, the projected DALY rates during 2017-2040 continued to 220
increase among the total population, females, and females aged ≥70, whereas the rate decreased for the 221

13
rest of the groups. The difference in the trends between the age group-specific estimates and all-age 222
estimates is that the latter was greatly affected by the ageing of the population. 223
224
Exact values of sex-age specific groups' DALY rates for the three diseases under each scenario in 2040 are 225
presented in Supplementary Table 2. In the reference forecast, the greatest decline in DALY rates was 226
forecasted in the 20-49 years old age group, with an average decline rate of 35.6%, 40.4% and 30.9% for 227
males, females and sex-combined during 2017-2040, respectively. Significant differences between 228
scenarios were observed among younger females (20-49 years old) with un-overlapped 95% prediction 229
intervals of DALY rates (95% PIs) between 298.8 (290.5 – 307.4) for reference and 274.8 (267.2 – 282.7) 230
for both better and moderate case scenarios with a decline rate of 8.0%. Similarly, significant differences 231
were shown in the 50-69 years old group between 2027 and 2033 with the most decline of 85.8 (84.6 – 232
87.1) per 100,000. Meanwhile, there was an increasing trend for all-age DALY rates in contrast to the trend 233
for each age group, suggesting that the population ageing may influence future DALY rates. 234
235
(Figure 1 here) 236
237
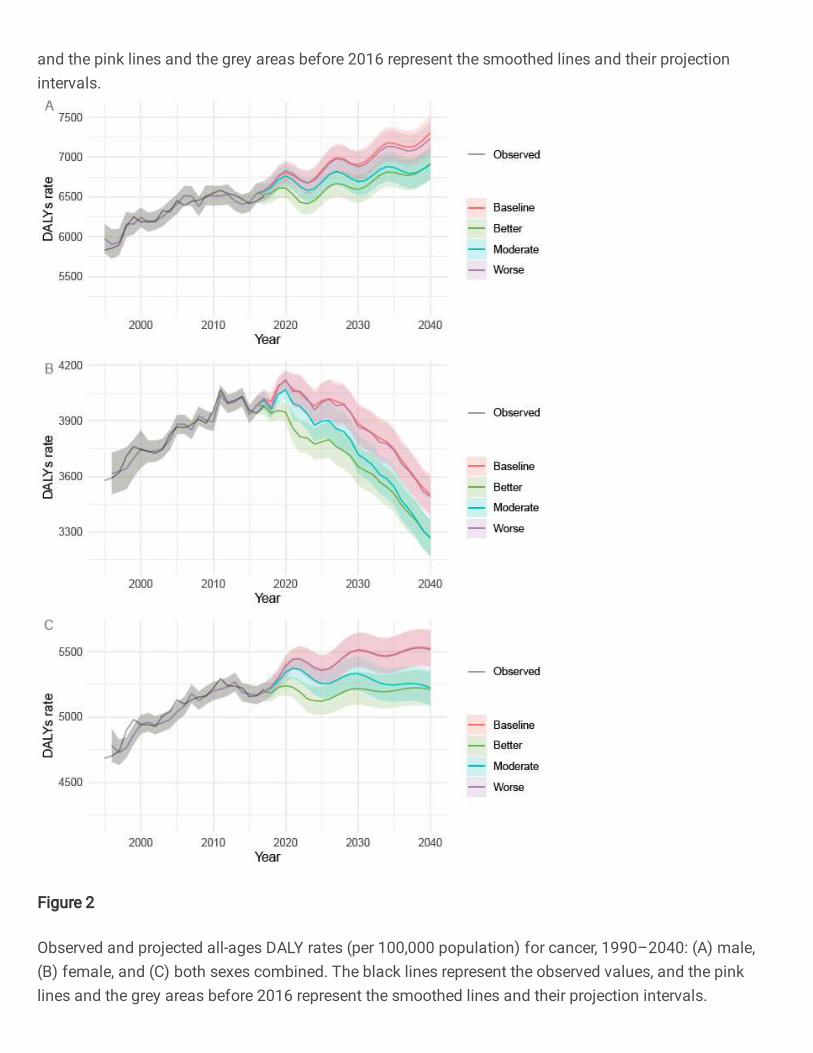
Cancer 238
The DALY rates of cancer for by sex and scenarios are shown in Figure 2. In all scenarios, there were upward 239
trends in the DALY rates among males and the total population, while the rate decreased among females. 240
In contrast to the trend for each age-group, there is an upward trend for all-age DALY rates, suggesting 241

14
that the ageing of the population may have significant effects on cancer. Significant differences between 242
scenarios were observed among the total population with un-overlapped 95% PIs of DALY rates (95% PIs) 243
between 5510.8 (5372.1 – 5653.2) for reference and 5201.5 (5070.5 – 5335.9) for both better and 244
moderate case scenarios. The forecasted DALY rates in the better case scenario dropped sharply in 2023 245
compared to the reference forecast. Overall, a decline of 5.6% in DALY rates was forecasted for the total 246
population in both the better and the moderate case scenarios in comparison to the reference forecast. 247
248
DALY rates by age and sex groups show a continuous decline to 2040 in most groups except for females 249
aged 50-69 (Supplementary figure 4-6). In the reference forecast, the greatest expected decline in DALY 250
rates was observed in the group aged 20-49, with an average decline of 40.2%, 44.2% and 11.4% for males, 251
females and sex-combined groups during 2017-2040, respectively. Significant differences between the 252
reference and the better and moderate case scenarios were found in females aged 20-49, females aged 253
50-69, and both sexes aged 50-69. Compared to the reference forecast, the largest decline rate was 254
observed in females aged 20-49 (-14.3%), while the most change in DALY rates was observed in males aged 255
70 and older with a decline of 852.7 (828.1 – 878.0) per 100,000 from 2017 to 2040 in both the better and 256
the moderate case scenarios. 257
258
(Figure 2 here) 259
260
Diabetes and kidney diseases 261

15
Figure 3 shows the trends of DALY rates for DKD through 2040 by sex and different scenarios. The DALY 262
rates increased through 2040 among females and the total population, while the rate decreased among 263
males. Significant differences between the reference and the better and moderate case scenarios were 264
observed in both sex-specific groups with un-overlapped 95% PIs of DALY rates (95% PIs) between 1965.9 265
(1928.3 – 2004.4) and 1804.2 (1769.6 – 1839.5) for males, and DALY rates (95% PIs) between 2765.0 266
(2727.3 – 2803.3) and 2386.0 (2353.4 – 2419.0) for females, that is, 8.2% and 13.7% of decline rate in 267
males and females, respectively. 268
269
DALY rates by age and sex groups were shown in Supplementary figure 7-9. In the reference forecast, a 270
significant upward trend in DALY rates was observed for most age- and sex-specific groups, except in males 271
aged 50-69 and ≥70. In particular, the DALY rates in 2040 showed 1.5 times increase than that of 2017 for 272
the younger group (20-49). The largest decline was observed in females aged 20-49 (-35.7%), while the 273
most change in the DALY rates was observed in females aged 50-69 with a decline of 213.1 (210.7 – 215.5) 274
per 100,000 from 2017 to 2040. 275
276
Discussion 277
Based on a future forecast of DALY rates and probable scenarios, we estimated a 'case for change' in the 278
level of vegetable consumption on the disease burden attributable to the different disease through 2040. 279
In Japan, the current level of vegetable consumption is far from the target of the government guidelines 280
and will not be achieved by 2040 if the current trend in vegetable consumption continues. Our analysis 281

16
indicates that increased vegetable consumption would lead to a significant reduction in the burden of 282
CVDs, cancer and DKDs. 283
284
In the reference forecast, all-age DALY rates were forecasted to continue increasing for CVDs, cancer, and 285
DKDs, while age group-specific DALY rates showed different trends. There was no difference between the 286
reference forecast and the worse case scenario in the DALY rates for all sex and age groups of the three 287
diseases with overlapping PIs given that there was little difference in the vegetable intake of those 288
scenarios. On the other hand, one of the greatest gaps of the estimated DALY rates between the reference 289
and scenario forecasts was found among females ages 20-49, specifically between the reference forecast 290
and both better and moderate case scenarios for all three diseases. This is in part due to the projection of 291
younger females consuming fewer vegetables in the future, which also resulted in the widest gap between 292
the estimated and the ideal level of vegetable consumption. By targeting this group for a public health 293
intervention related to vegetable consumption, we can expect the greatest impact of reducing disease 294
burden in Japan. 295
296
In accordance with previous studies, our study showed the benefits against CVDs by increased vegetable 297
intake among younger female (20-49 years) and 50-69 year old age group (21, 22). Various nutrients in 298
vegetables also demonstrate to protect against CVDs through a variety of mechanisms; a decrease of 299
atherosclerosis in the blood vessel and blood pressure, and a lowering of the risk of oxidative damage (23). 300
However, increasing vegetable intake was expected to benefit to a limited age group in this study. Another 301

17
study suggested that 400 ±30 g/ day of vegetable intake was set as a minimum theoretical risk of exposure 302
to low vegetable intake against CVDs, indicating that our scenarios' vegetable consumption level might be 303
slightly short for obtaining significant health benefits (24). 304
305
By increasing the vegetable intake at the total population level, the DALY rates for cancer decreased by 306
5.6%. Our estimates suggest 50-69 year old age group was expected to have the greatest benefits on 307
reducing the burden from cancers if this age group consumed the ideal level of vegetables. Around 70% of 308
total cancer cases were reported from over 65 years (25), indicating a vigorous intervention to middle-309
aged population may effectively help to reduce the burden from cancers. A report from World Cancer 310
Research Fund suggests that low vegetable intake is associated with specific cancer risks including 311
aerodigestive cancer (probable), and lung, breast, and colorectal cancers (limited suggestive) (26). 312
Vegetables are also protective against certain types of cancers by blocking the action of and/ or 313
suppressing carcinogens. For example, cruciferous vegetable and types of yellow vegetables contain 314
protease inhibitors, isothiocyanates and carotenoids prevent the initial formation of cancer and/or 315
oxidative damage of deoxyribonucleic acid (6, 23). 316
317
Similar to the scenarios in cancer, DALY rates of DKD can possibility decrease by 8% for males and 13% for 318
females. Although very limited evidence suggests a possible link between vegetable intake and type 2 319
diabetes in Japan (27), there is a growing body of evidence on various type of diets that may prevent adult-320
onset diabetes (28). 321

18
322
Internationally, Japan was ranked 62nd in the world by vegetable intake per capita in 2011 (29). China was 323
ranked first in the world, consuming over three times more vegetables than Japan on a per capita basis. 324
The tendencies that younger population compared to older people, and females compared to males 325
consume less vegetable were, however, similar to other countries (6, 30). WHO's report found barriers to 326
increasing vegetable intake as social, environmental, and economic reasons, including a lack of knowledge 327
of the recommended dietary intake, personal and family eating habits, limited availability of vegetables, a 328
lack of required vegetable for cooking due to less time for preparation, and a lack of intervention for 329
promoting healthy eating (31, 32). Another study indicated that low socio-economic status consumed 330
fewer quantities and varieties of vegetables in relation to vegetable prices (33). These factors influence 331
food choice and dietary intake across individuals, countries and cultures. 332
333
The barriers above mentioned are relevant in the Japanese context as well. Japanese society today faces 334
a general increase in preference for westernised diet and lifestyle, an increase in the availability of cooked 335
and processed foods, and an increase the vegetable prices due to a consumption tax increase and repeated 336
natural disasters in the recent years (34, 35). In addition, there is a reduced vegetable supply attributable 337
to the ageing population of farmers and decrease in farming areas from urbanisation, resulting in the 338
number of farmer decrease over the last decades (34, 36). It should be noted that climate change is also 339
the main driver to influence the reduction in vegetable supply (37). In Japan, the multiple natural disasters 340

19
damaged farms and led to a soaring price of vegetables in 2004, resulting in the lowest vegetable 341
consumption in all-age-sex groups (38). 342
343
The government enacted the Dietary Guidelines for the Japanese to enhance the balanced diet and 344
promote nutritional education at the community level (39). This guideline was effective to translate the 345
knowledge on the daily recommended diet to the general population. However, to tackle the diseases 346
associated with low vegetable consumption, a combination of social, environmental and economic barriers 347
must be addressed. For instance, it would be important to invest in policies which drive an increase in 348
consumption first, including interventions to increase supply and access to vegetable. A report from 349
Australia simulated that the high vegetable intake would reduce CVDs and some cancers would result in 350
long-term benefits by saving government health expenditure of about one million dollars and translating 351
it into producer return (40). As such, a comprehensive package and frames of policies are needed to 352
encourage people to eat adequate quantities of vegetables. These include improvements in the food 353
environment, food systems, and behaviours change communication across the life course. 354
355
Several limitations should be noted as in any forecasting study. First, our models may not have addressed 356
enough to adjust possible risk predictors associated with the target disease. For example, the level of 357
physical exercise and socio-economic status, which are well-known factors to influence the disease burden 358
of NCDs, were unavailable. However, we put SDI into the models as a substitute for individual SES data. 359
Second, although a change in vegetable intake and health outcomes may be explained in part of health 360

20
performance, social determinants and environmental factors, including the price change of vegetables (34), 361
were not assessed. Other dietary factors, which may also have influenced the change in vegetable 362
consumption(41), were not included in the models to avoid over-adjustment. Third, while DALYs is an 363
excellent measure to capture disease burden in the population level and a piece of key information for 364
policymaking, DALYs itself cannot indicate what kind of and how much investment are needed to improve 365
the health outcomes (42). Lastly, because the dietary data from the NHNS was based on a weighted single-366
day dietary record, our analysis may not have captured the real trend of long-term nor seasonal changes 367
in dietary patterns. Despite some limitations, our study uses the best available data that represents the 368
Japanese population's dietary pattern over time. Simple models as ours have advantages in allowing for a 369
prompt exploration of dietary risk factors and relevant disease burden forecasts. 370
371
Conclusions 372
This study provided a ‘case for change’ of the level of vegetable intake accompanying with associated 373
disease burden by different scenarios, allowing for a better understanding of possible target populations 374
and a certain qualification of the range of policy impacts. A key challenge remains to translate these 375
findings into public health policy. We believe our findings may open-up a discussion on effective, targeted 376
interventions for public health challenges attributable to low vegetable diet in Japan. 377

21
List of abbreviations 378
AIC: Akaike's Information Criterion 379
ARIMA: autoregressive integrated moving average 380
BMI: body mass index 381
CVDs: cardiovascular diseases 382
DALYs: disability-adjusted life years 383
DKDs: diabetes and kidney diseases 384
GBD: Global Burden of Disease 385
NHNS: National Health and Nutrition Survey 386
PIs: prediction intervals 387
SDI: socio-demographic index 388
WHO: World Health Organization 389
390
Declarations 391
Ethical approval and consent to participate 392
Ethical approval for the study was granted by the ethics committee of The University of Tokyo (11964). 393
Written informed consent was not required, as this study was a secondary analysis of anonymised data 394
that is collected routinely by the MHLW. Data of GBD 2017 are also secondary, aggregated estimates by 395
country, sex, and age groups. 396
397

22
398
Consent for publication 399
Not applicable. 400
401
Availability of data and materials 402
All data generated or analysed during this study are included in this published article [and its 403
supplementary information files]. 404
405
Competing interests 406
K.S. and S.N. report grants from Ajinomoto Co., Inc. and the Ministry of Education, Culture, Sports, Science 407
and Technology of Japan. S.T., D.Y., A.I., P.T., K.S. and S.N. declare no competing interests. K.N., H.U., and 408
N.H. declare that they are employed by Ajinomoto Co., Inc. and have no other competing interests. This 409
does not alter the authors' adherence to the journal policies on sharing data and materials. The study was 410
approved by the appropriate ethics review board. We have read and understood your journal's policies, 411
and we believe that neither the manuscript nor the study violates any of these. 412
413
Funding 414
This manuscript is an original work that has not been submitted for consideration or published elsewhere. 415
This study is partially supported by a joint research grant from Ajinomoto Co., Inc., and Grants-in-Aid for 416
Scientific Research from the Ministry of Education, Culture, Sports, Science and Technology of Japan 417

23
(MEXT). K.N., H.U., and N.H. are employed by the commercial founder, Ajinomoto Co., Inc. The commercial 418
funder provided support in the form of salaries for K.N., H.U., and N.H., but did not have any additional 419
role in the study design, data collection and analysis, decision to publish, or preparation of the manuscript. 420
The specific roles of these authors are articulated in the 'author contributions' section. The other funder 421
(MEXT) also had no role in the study design, data collection and analysis, decision to publish, or preparation 422
of the manuscript. 423
424
Authors’ contributions 425
S.N. led the study. S.T., D.Y., and S.N. conceived and designed the study. All authors took responsibility for 426
the integrity of the data and the accuracy of the data analysis. S.T., D.Y., S.N. and K.S. acquired the data. 427
S.T., D.Y., and S.N. analysed and interpreted the data. S.T. and D.Y. conducted the statistical analysis. S.T. 428
and A.I. drafted the article. All authors made critical revisions to the manuscript for important intellectual 429
content and gave final approval of the manuscript. The opinions, results, and conclusions reported in this 430
paper are those of the authors and are independent of the funding bodies. 431
432
Acknowledgements 433
None. 434
435
436
437

24
References 438
1. Wang X, Ouyang Y, Liu J, Zhu M, Zhao G, Bao W, et al. Fruit and vegetable consumption 439
and mortality from all causes, cardiovascular disease, and cancer: systematic review and dose-440
response meta-analysis of prospective cohort studies. BMJ. 2014;349:g4490. 441
2. Yokoyama Y, Nishimura K, Barnard ND, Takegami M, Watanabe M, Sekikawa A, et al. 442
Vegetarian diets and blood pressure: a meta-analysis. JAMA Intern Med. 2014;174(4):577-87. 443
3. Muraki I, Imamura F, Manson JE, Hu FB, Willett WC, van Dam RM, et al. Fruit consumption 444
and risk of type 2 diabetes: results from three prospective longitudinal cohort studies. BMJ. 445
2013;347:f5001. 446
4. World Cancer Research Fund / American Institute for Cancer research. Food, Nutrition, 447
Physical Activity and the Prevalence of Cancer: a Global Perspective. Washington DC: AICR; 2007. 448
5. Tian Y, Su L, Wang J, Duan X, Jiang X. Fruit and vegetable consumption and risk of the 449
metabolic syndrome: a meta-analysis. Public Health Nutr. 2018;21(4):756-65. 450
6. Lock K, Pomerleau J, Causer L, Altmann DR, McKee M. The global burden of disease 451
attributable to low consumption of fruit and vegetables: implications for the global strategy on 452
diet. Bull World Health Organ. 2005;83(2):100-8. 453
7. Collaborators GBDD. Health effects of dietary risks in 195 countries, 1990-2017: a 454
systematic analysis for the Global Burden of Disease Study 2017. Lancet. 2019;393(10184):1958-455
72. 456

25
8. Collaborators GBDRF. Global, regional, and national comparative risk assessment of 84 457
behavioural, environmental and occupational, and metabolic risks or clusters of risks for 195 458
countries and territories, 1990-2017: a systematic analysis for the Global Burden of Disease Study 459
2017. Lancet. 2018;392(10159):1923-94. 460
9. World Health Organization. Regional Office for E. Food-based dietary guidelines in the 461
WHO European Region. Copenhagen : WHO Regional Office for Europe; 2003. 462
10. MHLW. A basic direction for comprehensive implementation of National Health 463
Promotion Tokyo: Ministry of Health, Labour and Welfare; 2012 [Available from: 464
https://www.mhlw.go.jp/file/06-Seisakujouhou-10900000-Kenkoukyoku/0000047330.pdf. 465
11. Katanoda K, Matsumura Y. National Nutrition Survey in Japan--its methodological 466
transition and current findings. J Nutr Sci Vitaminol (Tokyo). 2002;48(5):423-32. 467
12. Ministry of Health L, and Welfare. Outline for the Results of the National Health and 468
Nutrition Survey Japan, 2012. Tokyo: National Institute of Health and Nutrition 2012. 469
13. MHLW. The National Health and Nutrition Survey in Japan, 2016. Tokyo: Ministry of Health, 470
Labour and Welfare; 2017. 471
14. Nomura S, Yoneoka D, Tanaka S, Ishizuka A, Ueda P, Nakamura K, et al. Forecasting 472
disability-adjusted life years for chronic diseases: reference and alternative scenarios of salt 473
intake for 2017-2040 in Japan. BMC Public Health. 2020;20(1):1475. 474
15. Foreman KJ, Marquez N, Dolgert A, Fukutaki K, Fullman N, McGaughey M, et al. 475
Forecasting life expectancy, years of life lost, and all-cause and cause-specific mortality for 250 476

26
causes of death: reference and alternative scenarios for 2016-40 for 195 countries and territories. 477
Lancet. 2018;392(10159):2052-90. 478
16. GBD 2017 DALYs and HALE Collaborators. Global, regional, and national disability-adjusted 479
life-years (DALYs) for 359 diseases and injuries and healthy life expectancy (HALE) for 195 480
countries and territories, 1990-2017: a systematic analysis for the Global Burden of Disease Study 481
2017. Lancet. 2018;392(10159):1859-922. 482
17. Ikeda N, Takimoto H, Imai S, Miyachi M, Nishi N. Data Resource Profile: The Japan National 483
Health and Nutrition Survey (NHNS). Int J Epidemiol. 2015;44(6):1842-9. 484
18. Katanoda K, Matsumura Y. National Nutrition Survey in Japan 485
Its Methodological Transition and Current Findings. Journal of Nutritional Science and 486
Vitaminology. 2002;48(5):423-32. 487
19. MEXT. Standards tables of food composition in Japan – 2015 (seventh revised edition) 488
Tokyo: Ministry of Education, Culture, Sports, Science and Technology; 2015 [Available from: 489
http://www.mext.go.jp/en/policy/science_technology/policy/title01/detail01/sdetail01/sdetail490
01/1385122.htm. 491
20. Hamilton JD PUP. Time Series Analysis: Princeton University Press; 1994. 492
21. Hartley L IE, Holmes J, Flowers N, Thorogood M, Clarke A, Stranges S, Hooper L, Rees 493
K. . Increased consumption of fruit and vegetables for the primary prevention of cardiovascular 494
diseases. . Cochrane Database of Systematic Reviews 2013(6). 495

27
22. Mo X, Gai RT, Sawada K, Takahashi Y, Cox SE, Nakayama T, et al. Coronary heart disease 496
and stroke disease burden attributable to fruit and vegetable intake in Japan: projected DALYS to 497
2060. BMC Public Health. 2019;19(1):707. 498
23. Lock K PJ, Cause L, McKee M. Comparative quantification of health risks, Global and 499
regional burden of disease attributable to selected major risk factors. Geneva: World Health 500
Organization; 2004. 501
24. Gan Y, Tong X, Li L, Cao S, Yin X, Gao C, et al. Consumption of fruit and vegetable and risk 502
of coronary heart disease: a meta-analysis of prospective cohort studies. Int J Cardiol. 503
2015;183:129-37. 504
25. NCC. Cancer Registry and Statistics (Monitoring of Cancer Incidence in Japan (MCIJ)). In: 505
Service CI, editor.: National Cancer Center, Japan 506
26. World Cancer Research Fund and American Institute for Cancer Research. Diet, Nutrition, 507
Physical Activity and Cancer: a Global Perspective: The Third Expert Report London, UK: World 508
Cancer Research Fund; 2018 [Available from: 509
https://www.wcrf.org/sites/default/files/Wholegrains-veg-and-fruit.pdf. 510
27. Kurotani K, Nanri A, Goto A, Mizoue T, Noda M, Kato M, et al. Vegetable and fruit intake 511
and risk of type 2 diabetes: Japan Public Health Center-based Prospective Study. Br J Nutr. 512
2013;109(4):709-17. 513
28. Yip CSC, Chan W, Fielding R. The Associations of Fruit and Vegetable Intakes with Burden 514
of Diseases: A Systematic Review of Meta-Analyses. J Acad Nutr Diet. 2019;119(3):464-81. 515

28
29. FAO. FAOSTAT Statistical Database: Food and Agriculture Organization of the United 516
Nations.; 2013 [Available from: http://www.fao.org/faostat/en/?#home. 517
30. Pomerleau J, Lock K, McKee M. The burden of cardiovascular disease and cancer 518
attributable to low fruit and vegetable intake in the European Union: differences between old 519
and new Member States. Public Health Nutr. 2006;9(5):575-83. 520
31. WHO. Prevention of cardiovascular disease : guidelines for assessment and management 521
of total 522
cardiovascular risk. Geneve, Switzerland 2007. 523
32. WHO/FAO. Diet, nutrition and the prevention of chronic diseases: report of a joint 524
WHO/FAO expert 525
consultation, Geneva, 28 January -- 1 February 2002. Geneva, Switzerland: World Health 526
Organization; 2002. 527
33. Giskes K, Turrell G, Patterson C, Newman B. Socio-economic differences in fruit and 528
vegetable consumption among Australian adolescents and adults. Public Health Nutr. 529
2002;5(5):663-9. 530
34. MAFF. Situation over vegetables Japan: Japanese Ministry of Agriculture Forestry and 531
Fisherie; 2018 [Available from: http://www.maff.go.jp/j/seisan/ryutu/yasai/index.html. 532
35. MAFF. Current situation surrounding fruits demand and consumption Japan: Japanese 533
Ministry of Agriculture Forestry and Fisheries; 2015 [Available from: 534
http://www.maff.go.jp/j/seisan/engei/ryutu_kako/pdf/siryou4.pdf. 535

29
36. MAFF. Situation over fruits Japan: Japanese Ministry of Agriculture Forestry and Fisheries; 536
2018 [Available from: http://www.maff.go.jp/j/seisan/ryutu/fruits/index.html. 537
37. Tuomisto HL, Scheelbeek PFD, Chalabi Z, Green R, Smith RD, Haines A, et al. Effects of 538
environmental change on population nutrition and health: A comprehensive framework with a 539
focus on fruits and vegetables. Wellcome Open Res. 2017;2:21. 540
38. Ministry of Health L, and Welfare. Outline for the Results of the National Health and 541
Nutrition Survey Japan, 2004. Tokyo: National Institute of Health and Nutrition 2004. 542
39. Melby MK, Utsugi M, Miyoshi M, Watanabe S. Overview of nutrition reference and dietary 543
recommendations in Japan: application to nutrition policy in Asian countries. Asia Pac J Clin Nutr. 544
2008;17 Suppl 2:394-8. 545
40. Economics DA. The impact of increasing vegetable consumption on health expenditure: 546
Deloitte; 2016 [Available from: 547
https://www2.deloitte.com/content/dam/Deloitte/au/Documents/Economics/deloitte-au-548
economics-increasing-vegetable-consumption-health-expenditure-impact-040716.pdf. 549
41. Okuda N, Miura K, Okayama A, Okamura T, Abbott RD, Nishi N, et al. Fruit and vegetable 550
intake and mortality from cardiovascular disease in Japan: a 24-year follow-up of the NIPPON 551
DATA80 Study. European Journal of Clinical Nutrition. 2015;69(4):482-8. 552
42. Anand S, Hanson K. Disability-adjusted life years: a critical review. Journal of Health 553
Economics. 1997;16(6):685-702. 554
555
556

30
Figure legends 557
Figure 1: Observed and projected all-age DALY rates (per 100,000 population) for cardiovascular 558
diseases, 1990–2040: (A) male, (B) female, and (C) both sexes combined. The black lines represent the 559
observed values, and the pink lines and the grey areas before 2016 represent the smoothed lines and 560
their projection intervals. 561
562
Figure 2: Observed and projected all-ages DALY rates (per 100,000 population) for cancer, 1990–2040: 563
(A) male, (B) female, and (C) both sexes combined. The black lines represent the observed values, and 564
the pink lines and the grey areas before 2016 represent the smoothed lines and their projection 565
intervals. 566
567
Figure 3: Observed and projected all ages DALY rates (per 100,000 population) for diabetes and kidney 568
diseases, 1990–2040: (A) male, (B) female, and (C) both sexes combined. The black lines represent the 569
observed values, and the pink lines and the grey areas before 2016 represent the smoothed lines and 570
their projection intervals. 571

31
Table 1: Sex- and age- group specific DALY rates, SDI, and behavioural and metabolic risk predictor data 572
GBD 2017 data NHNS data
All ages DALY rates per
100,000 population (16)
SDI
(%)
Number of
NHNS
participant
Mean age
(SD)
Obesity
(%)
Current smoker
(%)
Current
alcohol
drinker (%) Year Sex Cardiovascular
diseases Cancer
Diabetes
and
kidney
diseases
1990 Male 4,649.6 5130.2 950.8 80.3 6,182 47.4 (16.1) 22.3 53.1 52.1
Female 3,674.8 3280.9 828.1 80.3 7,025 48.7 (16.8) 21.8 9.7 6.1
Both sexes combined 4,154.1 4190.1 888.4 80.3 13,207 48.1 (16.5) 22.0 28.5 26.0
1995 Male 4,626.0 5832.0 1014.7 82.3 4,976 47.8 (16.5) 23.9 52.7 54.4
Female 3,573.7 3578.8 839.4 82.3 5,766 49.0 (17.3) 20.9 10.7 7.4
Both sexes combined 4,090.4 4685.2 925.5 82.3 10,742 48.4 (17.0) 22.2 28.2 27.0
2000 Male 4,523.5 6185.2 1058.0 83.4 4,513 50.1 (17.0) 26.8 47.4 50.8
Female 3,344.3 3745.2 844.3 83.4 5,149 51.7 (17.5) 21.3 11.5 9.0
Both sexes combined 3,922.2 4940.9 949.0 83.4 9,662 50.8 (17.2) 23.8 27.0 27.0
2005 Male 4,646.2 6454.1 1097.6 84.4 3,591 52.5 (17.5) 28.6 39.3 36.7
Female 3,313.6 3866.9 841.7 84.4 4,155 54.5 (17.8) 22.0 11.4 7.4
Both sexes combined 3,964.9 5131.4 966.8 84.4 7,746 53.6 (17.7) 24.9 24.3 20.9
2010 Male 4,664.1 6549.9 1228.5 85.3 3,740 53.9 (17.5) 30.4 32.2 35.4
Female 3,300.7 3954.5 934.3 85.3 4,239 55.6 (17.8) 21.1 8.4 7.0
Both sexes combined 3,965.6 5220.2 1077.8 85.3 7,746 54.8 (17.7) 25.3 19.5 20.3
2016 Male 4,590.3 6449.7 1235.0 86.3 12,132 56.6 (17.6) 31.7 30.5 34.0
Female 3,400.8 3957.2 1003.6 86.3 14,010 58.1 (18.0) 21.3 7.6 7.5
Both sexes combined 3,980.4 5163.1 1116.4 86.3 26,142 57.4 (17.8) 25.9 18.2 19.8
GBD: Global Burden of Disease study; NHNS: National Health and Nutrition Survey of Japan; DALYs; disability-adjusted life years; SDI: socio-demographic index; 573
SD: standard deviation. Note that we used data for each year, but the table lists only selected years.574
575

32
Table 2: Observed and predicted vegetable consumption (g/day) for reference forecast and three alternative scenarios 576
Age category 20–49
Sex Male Female Both sexes combined
Scenario R 1 2 3 R 1 2 3 R 1 2 3
Observed
period
1995 269.8 269.8 269.8 269.8 252.8 252.8 252.8 252.8 263.9 263.9 263.9 263.9
2000 279.1 279.1 279.1 279.1 254.7 254.7 254.7 254.7 264.5 264.5 264.5 264.5
2004 228.2 228.2 228.2 228.2 207.4 207.4 207.4 207.4 217.0 217.0 217.0 217.0
2010 245.2 245.2 245.2 245.2 217.6 217.6 217.6 217.6 228.9 228.9 228.9 228.9
2016 240.0 240.0 240.0 240.0 217.1 217.1 217.1 217.1 229.5 229.5 229.5 229.5
Predictio
n period
2023 231.9 350.0 269.7 234.1 203.2 350.0 254.6 213.0 221.6 350.0 263.0 224.2
2030 216.3 350.0 302.7 231.7 192.3 350.0 293.9 210.7 202.2 350.0 298.8 221.2
2035 208.9 350.0 326.4 229.9 184.9 350.0 321.9 209.0 198.2 350.0 324.4 219.1
2040 199.6 350.0 350.0 228.1 177.8 350.0 350.0 207.4 189.8 350.0 350.0 217.0
Age category 50-69
Sex Male Female Both sexes combined
Scenario R 1 2 3 R 1 2 3 R 1 2 3
Observed
period
1995 311.2 311.2 311.2 311.2 289.5 289.5 289.5 289.5 299.0 299.0 299.0 299.0
2000 324.8 324.8 324.8 324.8 324.9 324.9 324.9 324.9 327.5 327.5 327.5 327.5
2004 267.0 267.0 267.0 267.0 259.1 259.1 259.1 259.1 262.8 262.8 262.8 262.8
2010 277.7 277.7 277.7 277.7 278.5 278.5 278.5 278.5 280.9 280.9 280.9 280.9
2016 273.4 273.4 273.4 273.4 267.3 267.3 267.3 267.3 271.2 271.2 271.2 271.2
Predictio
n period
2023 294.4 350.0 302.5 278.3 267.4 350.0 294.3 268.9 262.0 350.0 292.4 267.0
2030 295.7 350.0 322.1 273.6 248.1 350.0 316.0 265.0 245.8 350.0 316.1 265.2
2035 295.9 350.0 336.0 270.3 247.0 350.0 331.4 262.3 240.6 350.0 333.1 264.0
2040 295.9 350.0 350.0 267.0 238.1 350.0 346.9 259.6 229.9 350.0 350.0 262.8
Age category ≥70
Sex Male Female Both sexes combined
Scenario R 1 2 3 R 1 2 3 R 1 2 3
Observed
period
1995 260.9 260.9 260.9 260.9 250.7 250.7 250.7 250.7 253.8 253.8 253.8 253.8
2000 324.3 324.3 324.3 324.3 303.0 303.0 303.0 303.0 301.9 301.9 301.9 301.9
2004 252.2 252.2 252.2 252.2 240.0 240.0 240.0 240.0 245.3 245.3 245.3 245.3
2010 283.1 283.1 283.1 283.1 272.8 272.8 272.8 272.8 276.8 276.8 276.8 276.8
2016 287.0 287.0 287.0 287.0 272.5 272.5 272.5 272.5 279.1 279.1 279.1 279.1

33
Predictio
n period
2023 287.3 350.0 303.2 274.7 271.1 350.0 291.7 259.6 279.8 350.0 296.9 266.4
2030 290.3 350.0 322.5 265.4 268.6 350.0 315.7 251.5 277.1 350.0 318.8 257.7
2035 289.3 350.0 336.2 258.8 266.8 350.0 332.8 245.7 274.5 350.0 334.4 251.5
2040 284.8 350.0 350.0 252.2 267.6 350.0 350.0 240.0 275.7 350.0 350.0 245.3
Age category All ages
Sex Male Female Both sexes combined
Scenario R 1 2 3 R 1 2 3 R 1 2 3
Observed
period
1995 284.1 284.1 284.1 284.1 265.8 265.8 265.8 265.8 272.2 272.2 272.2 272.2
2000 302.4 302.4 302.4 302.4 287.0 287.0 287.0 287.0 294.2 294.2 294.2 294.2
2004 247.9 247.9 247.9 247.9 233.7 233.7 233.7 233.7 240.2 240.2 240.2 240.2
2010 264.9 264.9 264.9 264.9 255.5 255.5 255.5 255.5 259.9 259.9 259.9 259.9
2016 266.6 266.6 266.6 266.6 253.2 253.2 253.2 253.2 259.3 259.3 259.3 259.3
Predictio
n period
2023 256.5 350.0 284.9 255.1 251.9 350.0 282.3 248.4 252.4 350.0 285.3 253.2
2030 246.4 350.0 311.7 252.1 236.4 350.0 310.2 242.3 246.2 350.0 311.9 247.9
2035 239.6 350.0 330.8 250.0 235.2 350.0 330.1 238.0 241.9 350.0 331.0 244.1
2040 230.9 350.0 350.0 247.9 229.3 350.0 350.0 233.7 237.7 350.0 350.0 240.2
*Observed: 1990–2016; predicted: 2017–2040 577
R: reference forecast; 1: better case scenario; 2: moderate case scenario; 3: worse case scenario 578
579

34
Supplementary Figure 1: Observed and projected DALY rate (per 100,000 population) in the 20–49 age 580
group for cardiovascular diseases for reference forecast and three alternative scenarios, 1990–2040: 581
(A) male, (B) female, and (C) both sexes combined. The black lines represent the observed values, and 582
the pink lines and the grey areas before 2016 represent the smoothed lines and their projection 583
intervals. 584
585
Supplementary Figure 2: Observed and projected DALY rates (per 100,000 population) in the 50–69 age 586
group for cardiovascular diseases for reference forecast and three alternative scenarios, 1990–2040: 587
(A) male, (B) female, and (C) both sexes combined. The black lines represent the observed values, and 588
the pink lines and the grey areas before 2016 represent the smoothed lines and their projection 589
intervals. 590
591
Supplementary Figure 3: Observed and projected DALY rates (per 100,000 population) in the ≥70 age 592
group for cardiovascular diseases for reference forecast and three alternative scenarios, 1990–2040: 593
(A) male, (B) female, and (C) both sexes combined. The black lines represent the observed values, and 594
the pink lines and the grey areas before 2016 represent the smoothed lines and their projection 595
intervals. 596
597
Supplementary Figure 4: Observed and projected DALY rates (per 100,000 population) for cancer in the 598
20–49 age group for reference forecast and three alternative scenarios, 1990–2040: (A) male, (B) 599

35
female, and (C) both sexes combined. The black lines represent the observed values, and the pink lines 600
and the grey areas before 2016 represent the smoothed lines and their projection intervals. 601
602
Supplementary Figure 5: Observed and projected DALY rates (per 100,000 population) in the 50–69 age 603
group for cancer for reference forecast and three alternative scenarios, 1990–2040: (A) male, (B) 604
female, and (C) both sexes combined. The black lines represent the observed values, and the pink lines 605
and the grey areas before 2016 represent the smoothed lines and their projection intervals. 606
607
Supplementary Figure 6: Observed and projected DALY rates (per 100,000 population) in the ≥70 age 608
group for cancer for reference forecast and three alternative scenarios, 1990–2040: (A) male, (B) 609
female, and (C) both sexes combined. The black lines represent the observed values, and the pink lines 610
and the grey areas before 2016 represent the smoothed lines and their projection intervals. 611
612
Supplementary Figure 7: Observed and projected DALY rates (per 100,000 population) in the 20–49 age 613
group for diabetes and kidney diseases for reference forecast and three alternative scenarios, 1990–614
2040: (A) male, (B) female, and (C) both sexes combined. The black lines represent the observed values, 615
and the pink lines and the grey areas before 2016 represent the smoothed lines and their projection 616
intervals. 617
618

36
Supplementary Figure 8: Observed and projected DALY rates (per 100,000 population) in the 50–69 age 619
group for diabetes and kidney diseases for reference forecast and three alternative scenarios, 1990–620
2040: (A) male, (B) female, and (C) both sexes combined. The black lines represent the observed values, 621
and the pink lines and the grey areas before 2016 represent the smoothed lines and their projection 622
intervals. 623
624
Supplementary Figure 9: Observed and projected DALY rates (per 100,000 population) in the ≥70 age 625
group for diabetes and kidney diseases for reference forecast and three alternative scenarios, 1990–626
2040: (A) male, (B) female, and (C) both sexes combined. The black lines represent the observed values, 627
and the pink lines and the grey areas before 2016 represent the smoothed lines and their projection 628
intervals. 629
630
Supplementary Table 1: Estimated sets of parameters in ARIMA (p, d, q) and Akaike Information 631
Criteria (AIC) 632
633
Supplementary Table 2: Observed and projected DALY rates (per 100,000 population) in GBD 2016 and 634
in the 2040 reference forecast and three alternative scenarios 635
GBD: Global Burden of Disease study; PIs: prediction intervals 636

Figures
Figure 1
Observed and projected all-age DALY rates (per 100,000 population) for cardiovascular diseases, 1990–2040: (A) male, (B) female, and (C) both sexes combined. The black lines represent the observed values,
and the pink lines and the grey areas before 2016 represent the smoothed lines and their projectionintervals.
Figure 2
Observed and projected all-ages DALY rates (per 100,000 population) for cancer, 1990–2040: (A) male,(B) female, and (C) both sexes combined. The black lines represent the observed values, and the pinklines and the grey areas before 2016 represent the smoothed lines and their projection intervals.

Figure 3
Observed and projected all ages DALY rates (per 100,000 population) for diabetes and kidney diseases,1990–2040: (A) male, (B) female, and (C) both sexes combined. The black lines represent the observedvalues, and the pink lines and the grey areas before 2016 represent the smoothed lines and theirprojection intervals.

Supplementary Files
This is a list of supplementary �les associated with this preprint. Click to download.
Supplementaryinformation.docx