redefine wealth management's monthly market commentary
TRANSCRIPT

1700 Lincoln Street, Suite 2260 | Denver, Colorado 80203 | (303) 495-5540 | [email protected]
ReDefine Wealth Management's
Monthly Market Commentary
04-30-2019 April 30, 2019

IMPORTANT INFORMATION REGARDING THIS REPORT
This material is for your general information only and is not an offer or solicitation to buy or sell any security.
You should not consider the contents of this report as financial or other advice. ReDefine Wealth Management (“RWM”)and its employees do not provide tax or legal advice. Investors are strongly urged to consult their tax or legal advisers.Strategies discussed herein may not be suitable for all investors, and such discussions are provided for informational
purposes only. The information presented in this report is the opinion of RWM. The information contained herein, includingbut not limited to research, market valuations, calculations, estimates and other material obtained from RWM and othersources are believed to be reliable. The information provided is not guaranteed as to accuracy or completeness and is
subject to change without notice and may or may not be updated. RWM does not accept any responsibility to update anyopinion, analyses or other information contained in the material. It is RWM’s policy to have written investment advisory
agreements. An investment advisory relationship between RWM and any entity or person will commence upon executionof the advisory agreement. RWM will not provide advice or enter into an advisory relationship until a written advisory
contract is signed by the client.
Past Performance is No Guarantee of Future Results
References to market or composite indexes, benchmarks or other measures of relative market performance (indexes) overa specified period are provided for your information only and do not imply that a portfolio will achieve similar returns,
volatility or other results. An index’s performance does not reflect the deduction of transaction costs, management fees, orother costs which would reduce portfolio returns.
Please contact us with any questions.
1700 Lincoln Street, Suite 2260 | Denver, Colorado 80203 | (303) 495-5540 | [email protected]

Page 3 of 12Private and Confidential
1 MO. Q1 19 YTD 2018 1 YR. 3 YR.MSCI All Country World (Total Return) 3.43% 12.33% 16.18% (8.93%) 5.63% 11.96%
MSCI World (Total Return) 3.60% 12.65% 16.70% (8.20%) 7.08% 12.02%
MSCI EAFE (USD) (Total Return) 2.91% 10.13% 13.33% (13.36%) (2.73%) 7.77%
MSCI Emerging Markets (Total Return) 2.12% 9.95% 12.29% (14.24%) (4.68%) 11.66%
Dow Jones Industrial Average (Total Return) 2.66% 11.81% 14.79% (3.48%) 12.63% 17.16%
S&P 500 (Total Return) 4.05% 13.65% 18.25% (4.38%) 13.49% 14.87%
NASDAQ (Total Return) 4.77% 16.81% 22.38% (2.84%) 15.82% 20.58%
Russell 2000 (Total Return) 3.40% 14.58% 18.48% (11.01%) 4.61% 13.60%
Nikkei 225 Stock Average (JPY) (Total Return) 4.97% 6.89% 12.20% (10.29%) 1.15% 12.30%
STOXX Europe 600 Euro (Total Return) 3.91% 13.18% 17.61% (10.22%) 5.13% 8.26%
FTSE 100 (Total Return) 2.33% 9.49% 12.04% (8.73%) 3.15% 10.33%
DAX 30 (Total Return) 7.10% 9.16% 16.91% (18.26%) (2.13%) 7.13%
Shanghai Composite (0.40%) 23.93% 23.43% (24.59%) (0.13%) 1.56%
Barclays Global Treasury (Total Return) (0.63%) 1.60% 0.96% (0.38%) (0.24%) 0.19%
Barclays US Treasury (Total Return) (0.28%) 2.11% 1.83% 0.86% 4.77% 0.98%
Barclays Global Aggregate (Total Return) (0.30%) 2.20% 1.90% (1.20%) 0.94% 0.94%
Barclays US Aggregate (Total Return) 0.03% 2.94% 2.97% 0.01% 5.29% 1.90%
Barclays Global High Yield (Total Return) 0.84% 6.33% 7.23% (4.06%) 3.48% 6.43%
Barclays US Corporate High Yield (Total Return) 1.42% 7.26% 8.78% (2.08%) 6.74% 7.69%
S&P Leveraged Loan Index (Total Return) 1.67% 3.96% 5.70% 0.47% 4.22% 5.55%
Barclays Emerging Markets (Total Return) 0.40% 5.43% 5.85% (2.46%) 5.88% 4.88%
USD DXY 0.20% 1.16% 1.36% 4.40% 6.14% 1.55%
Dow Jones US Real Estate Index (Total Return) (0.03%) 17.08% 17.04% (4.03%) 19.06% 8.69%
Bloomberg Commodity Index (0.42%) 6.32% 5.88% (11.25%) (8.03%) (0.66%)
S&P GSCI Gold (0.99%) 1.34% 0.34% (2.14%) (2.54%) (0.12%)
S&P GSCI Precious Metals (Total Return) (0.82%) 0.55% (0.27%) (3.58%) (3.79%) (1.57%)
Global Equities (USD, % chg.)
Country Equities
(Local, % chg.)
Global Fixed Income
(USD, % chg.)
Real Assets (USD, % chg.)
WORLD
MARKETS
Market Performance Roundup As of 04-30-2019
Page 4 of 12Private and Confidential
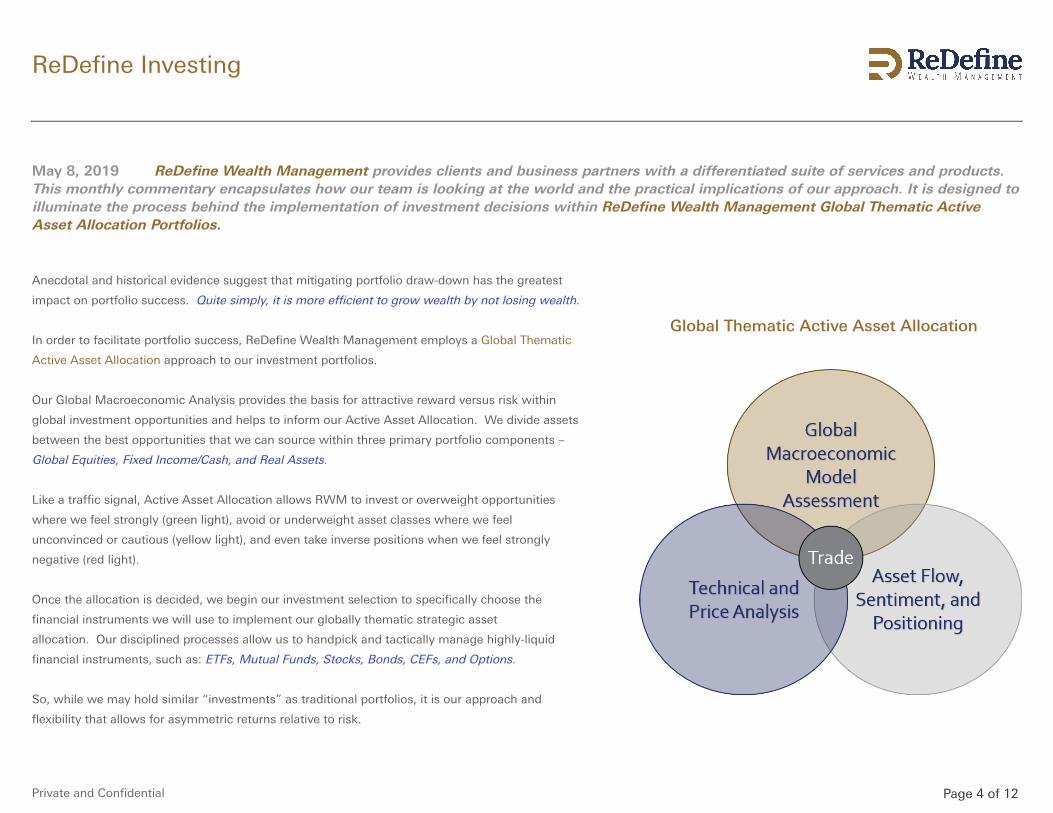
May 8, 2019 ReDefine Wealth Management provides clients and business partners with a differentiated suite of services and products.This monthly commentary encapsulates how our team is looking at the world and the practical implications of our approach. It is designed toilluminate the process behind the implementation of investment decisions within ReDefine Wealth Management Global Thematic ActiveAsset Allocation Portfolios.
Anecdotal and historical evidence suggest that mitigating portfolio draw-down has the greatest
impact on portfolio success. Quite simply, it is more efficient to grow wealth by not losing wealth.
In order to facilitate portfolio success, ReDefine Wealth Management employs a Global Thematic
Active Asset Allocation approach to our investment portfolios.
Our Global Macroeconomic Analysis provides the basis for attractive reward versus risk within
global investment opportunities and helps to inform our Active Asset Allocation. We divide assets
between the best opportunities that we can source within three primary portfolio components –
Global Equities, Fixed Income/Cash, and Real Assets.
Like a traffic signal, Active Asset Allocation allows RWM to invest or overweight opportunities
where we feel strongly (green light), avoid or underweight asset classes where we feel
unconvinced or cautious (yellow light), and even take inverse positions when we feel strongly
negative (red light).
Once the allocation is decided, we begin our investment selection to specifically choose the
financial instruments we will use to implement our globally thematic strategic asset
allocation. Our disciplined processes allow us to handpick and tactically manage highly-liquid
financial instruments, such as: ETFs, Mutual Funds, Stocks, Bonds, CEFs, and Options.
So, while we may hold similar “investments” as traditional portfolios, it is our approach and
flexibility that allows for asymmetric returns relative to risk.
Global Thematic Active Asset Allocation
ReDefine Investing

Page 5 of 12Private and Confidential
Fundamental Global Macroeconomic Backdrop
It is important to remember that the S&P 500 is sitting
near the same levels it was in January 2018 and
September 2018 - right before two quick and painful
corrections. Earnings are close to the levels of those
times as well, but the economic data is now weaker -
both in the US and abroad. Exhibit 1.
The ever-evolving China Trade Deal.
This ongoing saga has led to some volatility and price
declines recently, and quite frankly talk of a deal has
taken on a life of its own, not unlike the Brexit fiasco.
The China trade deal was originally forecasted to be
settled six months ago. In the ensuing time period,
news the trade deal has been used by President Trump
seemingly as way to prop up the market and dampen
volatility. President Trump has been promising the
American people (as well as global trade partners) that
any negative data points are temporary because a
US/China trade deal will solve the world’s economic
problems and put the US in its proper place as the
dictator of trade terms.
We tend to believe that a US/China trade deal will be
done, and that Trump and Xi will trumpet the deal as a
game changer, however several factors may make the
deal potentially weaker than expected. Historically,
Monthly Market Commentary
Exhibit 1. Source: BMO CM &Macrobond as of April 30, 2019
China tends to set policy that is long-term in nature,
whereas the US tends to set policy feverishly before an
election cycle. This may aid China in negotiations as
they have the wherewithal to “wait out” Trump in
hopes he will be defeated in 2020, and potentially
usher back in the era of sweetheart deals with demo-
cratic leaders. China has developed their global
economic power on the backs of incredible and often
one-side trade deals that take advantage of their status
as a “developing” economy. It is difficult to believe that
they will stray from their proven methods in order to
strike a trade deal that would benefit the US in a
significant way.
We tend to believe it is more likely that the deal will
take more time and economic consequence than
Trump is willing to endure this close to an election. A
likely scenario is that of President Trump (or one of his
many surrogates) rushing to a microphone touting an
impending deal anytime the US markets show volatility
or downward pressure. We remain under the
assumption that a significant deal will not be made in
the near future, yet we remain hopeful that Trump with
defy the odds and use his current leverage to get a
more mutually beneficial deal done.
In last month’s letter, De’ja Vue All Over Again?, we
wrote about how the markets seemed to be setting up
in a similar way as they did twice last year - which
ended in 12% and 20% declines respectively. We
attempted to show the “setup” using a few charts that
demonstrated the divergences in several key areas.
These included the S&P 500 vs the 10-yr yield. The S&P
500 equity prices vs associated equity earnings. And
multiple economic gauges, and company specific
metrics (Apple stock specifically) vs the Semiconductor
Index Price (SOX).
Our hope was that by examining stock earnings reports
and key monthly economic data we would be able see
these divergences come back together. Hopefully

Page 6 of 12Private and Confidential
illuminating if the data warrant these high stock valuations.
Unfortunately, the aforementioned divergences actually widened
even more for each of the cases we shared. The problem is not
that the data didn’t provide the evidence we were hoping to see,
but rather that markets did understand the evidence yet continued
to ignore it.
The divergence between stock prices and the 10-year US Treasury
yield has historically been a short-term phenomenon, as the 10-yr
yield is typically a reflection of the underlying economic strength
or weakness of the US economy. As mentioned, this divergence
has continued to widen and thus we feel more confident that the
yield is the more accurate gauge as of this writing. Exhibit 2.
For example, economic data is much weaker than what one would
expect after the Q1 market run-up. Some market pundits point out
that the GDP grew 3.2% in the first quarter, which was indeed
much better than anticipated. And they would be correct. That
said, closer examination of the components that make up the GDP
number calls into question the number’s validity. Specifically,
inventories grew substantially over the last three quarters, which
will work to inflate the number. Then when we mix-in other one-
time factors, our calculations subtract roughly 2% off the 3.2%
GDP calculation. Not overly impressive when considering the
stock market added over 1% to the number with its >10% upward
move.
GDP is the gauge used in determining economic recession.
Monthly Market Commentary
Fundamental Global Macroeconomic Backdrop (cont.)
When blending the GDP data with an economic statistic that we
have a bit more faith in – the ISM Manufacturing Index (ISM) - a
much clearer picture of the current economic environment
emerges. The ISM recently reported its lowest number in two and
half years. Rising inventories and decreasing sales have conspired
to steer the ISM lower. If these inventories don’t (at least begin to)
sell off soon, they may have a more visible adverse impact on
future GDP numbers. History shows us that stock prices tend to
react very negatively once talk of “pricing in” a recession begins
and considering the current price levels falling GDP numbers may
prove especially painful for certain segments of the market.
Exhibit 2. Source Bloomberg as of April 30, 2019
way of “propping up” stock prices and stockpiling inexpensive
debt… and unfortunately, potentially hiding underlying
weaknesses. When flat-to-declining earnings are combined with
questionable economic data, that typically points to the potential
of unstable economic footing. That is not certain, however we feel
certain that the combination probably does not warrant a huge
market bounce from the December lows.
Let’s take a moment to consider Apple.
Apple bought back more shares in the first quarter than they did in
the entirety of 2018. On January 3, 2019 Apple announced to
analysts they were “slashing” their future earnings, revenues, and
IPhone sales projections. Recently Apple reported Q1 earnings
that were in line with the January estimates and the markets
celebrated by pushing Apple shares up over $10 from the close
(just 30 minutes prior). Apple’s earnings, sales, and market share
are significantly lower year-over-year. And to put a cherry on top,
they lowered their second quarter forecast and announced
revenues will drop another 5-6% in the next quarter.
Apple’s revenue declined by 5% over the past year which equates
to the exact level they were 4 years ago. IPhone sales, the largest
contributor to revenues, dropped 17% year-over-year and are
estimated to decline into late 2020 or 2021. Their global market
share in smartphones has dropped from roughly 23% four years
ago, to 11.7%. Further, sales to China and their services business,
were also down for the quarter with China sales down 22% over
Stock earnings have been deteriorating in the face of rising stock
prices. According to a favorite unbiased data group, FactSet, with
about 80% of first quarter 2019 earnings reported, quarter over
quarter earnings will be negative. And considering the tailwind of
record-breaking stock buybacks in Q1 this is somewhat alarming.
Many companies have used buybacks over the last decade as a

Page 7 of 12Private and Confidential
Monthly Market Commentary
Fundamental Global Macroeconomic Backdrop (cont.)
sales over the prior quarter. Exhibit 3. These weak global sales
were confirmed by World Semiconductor Trade Statistics (WSTS)
which showed semiconductor sales declined by 20% on a quarter-
to-quarter basis (3-month moving average). This has happened
two other times in the last 25 years.
And you may ask, what happened after those two occurrences?
From 2007-2008, the semiconductor index dropped roughly 70%.
And 2001-2002 the index shed almost 85% from its highs in 2000.
These drops in global semiconductor sales preceded the last two
precipitous drops in the index and foreshadowed two recessions.
We openly wonder if the recent rally in the SOX, against declining
sales is going to end poorly for the global stock markets. We tend
to believe markets are at extreme price levels and we question
Exhibit 4. Source MI2 Partners, Bloomberg as of April 30, 2019
last 4 years, with the headwind of a negative underlying growth
rate and corporate debt rising to over $100 billion.
It wasn’t long ago bellwethers GE and IBM were experiencing
similar headwinds. GE now trades under $10 and is grappling with
paying down $111 billion in debt – which over $40 billion was
incurred with stock buybacks. IBM has announced the cessation
of their stock buyback program in order to attempt to pay down
their debt. IBM’s stock price has been on a steady decline (roughly
36%) over the last six years. As of this writing, we worry that
Apple may be finding itself on a similar path as GE and IBM. Those
three companies are simply behemoth examples of a pervasive
corporate trend that has developed over the last decade -
companies adding cheap debt to fund stock buybacks, and in
some cases to give the appearance of earnings growth. We will
have more on this subject later in the year.
The real question remains: How will this balance sheet jujitsu
playout for the market as a whole?
We continue to closely monitor the semiconductor market, which
tends to serve as a leading indicator of global market health and
breadth. We were expecting to see a bounce in global
semiconductor sales because the semiconductor index (SOX up
~26% YTD) was leading both the tech sector and markets higher
thus far in 2019. However, the largest semiconductor companies
such as Intel and Texas Instruments have been reporting weak
what could be the catalyst that may trigger a sudden
and potentially large correction.
Our hope was that key economic and earnings data would
decrease the aforementioned divergences and help place the
markets on stable footing. However, the markets continue to
ignore all the warning signs of potentially repeating sudden
volatility shocks and lower prices.

Page 8 of 12Private and Confidential
As of this writing, the trend higher is in place and no matter how questionable
the underlying fundamentals and technical factors may be, the market seems to
want to continue higher. We believe the Fed’s continued easy monetary policy
comments - not actions - along with the nearly omnipresent jawboning from the
White House have been the primary factors in the rally in stock prices since the
late December 2018 lows. We do question how long the markets will acquiesce
to words and hollow gestures and continue to drive higher, despite very high
valuations and weakening economic conditions. We continue to seek out a
potential catalyst for a sudden and potentially large correction. The US/China
Trade Deal could be a factor in the near term if it looks like both sides are at an
impasse and they openly back away from the table.
However, despite all of the questions and concerns we have for US markets, we
are still of the opinion that we would rather be invested in the US then abroad.
Europe, especially Germany of late, continues to print weak economic numbers,
with a handful of countries either in or approaching recession territory. One
large contributor to Europe’s economic weakness is demand from emerging
markets. Countries like Germany had become European giants by exporting
goods to China and its neighbors. At this time, exporters like Germany are
reporting weakening demand for their goods. Recently South Korea joined the
list of powerful exporters that are reporting weakening demand for goods and
weakening economic numbers. We continue to believe that foreign markets –
specifically emerging markets - will remain relatively weak in the face of a
strong or strengthening US dollar. So as long as the US dollar remains elevated
or continues to move higher, we will continue to avoid emerging market equities
and most international equities. However, we do believe that it is a “when” not
an “if” that the US dollar will reverse its course and begin to weaken. Until then,
we believe it prudent to remain on the sidelines outside of US equities.
Monthly Market Commentary
Global Equities
Year-to-Date Global Equity Performance
Jan '19 Feb '19 Mar '19 Apr '19(5%)
0%
5%
10%
15%
20%
S&P 500 DJIA Russell 2000 MSCI EAFE MSCI EM
1 MO. YTD 2018
S&P 500 Index (TR) 4.05% 18.25% (4.38%)
Dow Jones Industrial Average (TR) 2.66% 14.79% (3.48%)
Russell 2000 Index (TR) 3.40% 18.48% (11.01%)
MSCI EAFE Index (TR) 2.91% 13.33% (13.36%)
MSCI Emerging Market Equity Index (TR) 2.12% 12.29% (14.24%)

Page 9 of 12Private and Confidential
If history is any guide and the underlying US economy is as strong as the
US stock market would indicate, we should be experiencing rising yields.
That is not the case currently. We continue to believe the US Federal
Reserve Board (FED) is going to be forced to eventually cut short-term
rates. When that occurs, we tend to believe that action will set-up a
reflation trade that will eventually move longer rates higher. Interestingly,
we continue to hear rumblings from the White House and some Fed
officials attempting to justify significant rate cuts, while at the same time
the same actors are crowing about the US economy’s strength. Those two
opinions are difficult to reconcile.
A strong economy would not require a 1% rate cut. In fact, that stimulus
would serve to possibly cause a strong economy to overheat and lose
stability. Perhaps the White House and the FED are actually worried about
that the US economy is indeed weakening and desperately in need of
preemptive stimulus. An early warning sign that we are watching for is
another (and protracted) inversion of the yield curve.
Time will separate the winners from the losers; however, we remain of the
belief that there is value in certain sectors of US fixed income.
Monthly Market Commentary
Global Fixed Income
Year-to-Date Global Fixed Income Performance
Jan '19 Feb '19 Mar '19 Apr '19(1%)
0%
1%
2%
3%
4%
5%
6%
7%
8%
9%
UST 1-3yr US AGG Global AGG US HY EM Debt
1 MO. YTD 2018
US 1-3 YR Treasury Index (TR) 0.20% 1.20% 1.56%
US Aggregate Bond Index (TR) 0.03% 2.97% 0.01%
Global Aggregate Bond Index (TR) (0.30%) 1.90% (1.20%)
US Corporate High Yield Bond Index (TR) 1.42% 8.78% (2.08%)
Emerging Market Bond Index (TR) 0.40% 5.85% (2.46%)

Page 10 of 12Private and Confidential
Year-to-Date Global Real Asset Performance
Jan '19 Feb '19 Mar '19 Apr '19(5%)
0%
5%
10%
15%
20%
MLP Commodities US REIT US Dollar Gold
1 MO. YTD 2018
Alerian MLP Index (TR) (1.33%) 15.27% (12.42%)
Bloomberg Commodity Index (TR) (0.42%) 5.88% (11.25%)
Dow Jones US REIT Index (TR) (0.03%) 17.04% (4.03%)
US Dollar Index (TR) 0.20% 1.36% 4.40%
GSCI Gold Index (TR) (0.99%) 0.34% (2.14%)
Commodities were mostly unchanged, but oil continued its upward
march on strengthening bullish sentiment and had the strongest start to a
year since 2002. Oil is also the best-performing asset so far in 2019
(followed by Chinese equities).
Commodities on the whole seem to be stuck in a range and will most
likely continue this course until we see the US dollar begin to weaken and
break below the $95-$96 range. As of this writing, the US dollar trades
around $97.50.
We continue to build positions in precious metals. We believe gold, silver,
and platinum stand to be significant beneficiaries of a secular trend of a
weakening dollar (eventually), however precious metals status as a
“safety asset” could allow them to hold their own if the dollar rises due to
a market correction, as they did in the 4Q of 2018.
Monthly Market Commentary
Global Real Assets

Page 11 of 12Private and Confidential
It is important to remember that the S&P 500 is sitting near the same levels it was in January 2018 and September
2018 - right before two quick and painful corrections. Earnings are close to the levels of those times as well, but the
economic data is now weaker - both in the US and abroad.
We tend to believe the equity markets are overvalued at these levels, especially when considering the underlying
economic data. We continue to believe that the risk of the economic numbers not improving swiftly enough to
justify the current valuations is very strong and the probability of another sharp equity correction is quickly
becoming heightened. That said, we feel confident in our overall portfolio allocations - specifically our allocations to
high quality, lower duration US fixed income - as well as our allocations to market volatility trades and increasing
allocations to cash & cash equivalents.
Our 2019 Market Outlook favors high-quality equities and bonds, U.S. and EM equities, value over
growth, active versus passive, and real asset strategies.
Our four major Global Investment Themes
and general market assumptions for 2019
Volatility and Global Political Unrest Will
Continue to Rise
Commodity Prices Will Rise and the US Dollar
Will Begin to Decline
US Interest Rates and Global Inflation Will Move
Sideways
Balance Sheets Matter Again - Value Over
Growth, Quality Over Credit
This material is for your general information only and is not an offer or solicitation to buy or sell any security.
You should not consider the contents of this report as financial or other advice. ReDefine Wealth Management (“RWM”) and its employees do not provide tax or legal advice. Investors are strongly urged to consult their tax or legal
advisers. Strategies discussed herein may not be suitable for all investors, and such discussions are provided for informational purposes only. The information presented in this report is the opinion of RWM. The information
contained herein, including but not limited to research, market valuations, calculations, estimates and other material obtained from RWM and other sources are believed to be reliable. The information provided is not guaranteed as
to accuracy or completeness and is subject to change without notice and may or may not be updated. RWM does not accept any responsibility to update any opinion, analyses or other information contained in the material. It is
RWM’s policy to have written investment advisory agreements. An investment advisory relationship between RWM and any entity or person will commence upon execution of the advisory agreement. RWM will not provide advice
or enter into an advisory relationship until a written advisory contract is signed by the client.
Past Performance is No Guarantee of Future Results
Monthly Market Commentary
Conclusion

Page 12 of 12Private and Confidential
Disclosures
INVESTMENT RETURNS PRESENTED IN THIS STATEMENT ARE NOT AUDITED RETURNS. INVESTOR PERFORMANCE MAY DIFFER DUE TO FACTORS SUCH AS THE TIMING OF
INVESTMENTS, TIMING OF WITHDRAWALS, CUSTODIAL AND OTHER FEES.
Investment returns are compared to the performance of several indexes shown herein. Broad-based securities indices are unmanaged and are not subject to fees and expenses
typically associated with managed accounts or investment funds. The number and types of securities found in the index can differ greatly from that of the accounts held in the
strategy shown. Investments cannot be made directly in an index. Diversification does not guarantee a profit nor protect against loss. The investment portfolio does not seek to
replicate or correlate with these indices. Market conditions vary between the investment portfolios and the indices, and the indices do not include reinvestment of capital as to
the investment portfolios. Furthermore, investment portfolios invest in strategies and positions not included in these indices.
The standard deviations, information ratios and allocation targets may be higher or lower at any time. There is no guarantee that these measurements will be achieved. The
information provided should not be considered a recommendation to purchase or sell a particular security. Any specific securities identified do not represent all of the securities
purchased, sold or recommended for advisory clients, and may be only a small percentage of the entire portfolio and may not remain in the portfolio at the time you receive this
report.
Past performance is not indicative of future results. Different types of investments involve varying degrees of risk, and there can be no assurance that any specific investment will
either be suitable or profitable for a client or prospective client’s investment portfolio. Historical performance results for investment indices and/or custodial charges, the
deduction of an investment management fee, nor the impact of taxes, the incurrence of which would have the effect of decreasing historical performance results. Therefore, no
current or prospective client should assume that future performance of any specific investment, investment strategy (including the investments and/or investment strategies
recommended by ReDefine Wealth Management) or product made reference to directly or indirectly by ReDefine Wealth Management will be profitable or equal the
corresponding indicated performance level(s).
The Addepar Privacy Policy can be located at https://addepar.com/privacy-policy/