red meat sector operating environment july 2015
DESCRIPTION
ÂTRANSCRIPT

The Red Meat Sector Operating Environment
Half-yearly review: July 2015
Iain Macdonald Economics Analyst Quality Meat Scotland 0131 472 4040 [email protected]

2
Executive Summary
Although the UK economy grew more slowly at the beginning of 2015, this seems likely to be a short-lived blip given that most of the economic data has pointed to a self-sustaining economic expansion. Firm consumer and business confidence have underpinned spending on consumption and investment. The labour market has moved closer to normal conditions.
Inflation has fallen well below the Bank of England’s (BoE) 2% target due to lower global commodity prices and heightened retail competition. Since pay growth rose strongly during the first quarter of 2015 (Q1), real wages grew at their fastest rate in a number of years.
Though overall bank lending has remained weak, the flow of credit to UK businesses has reportedly
improved. Increased access to credit has supported the rise in consumer spending.
Food retail sales have continued to lag growth in overall consumer spending.
The monetary stance has continued to support UK economic activity. The slower pace of economic growth and lower inflation expectations have pushed expectations for the first interest rate increase back to early 2016. On the fiscal side, the tax threshold was raised for the 2015/16 financial year but there is the potential for significant cuts to in-work benefits payments to low paid workers.
In the Euro Area, economic growth picked up at the beginning of 2015. There were particularly promising signs from Italy and France which had previously been lagging behind. Unemployment continued edging lower, but remained elevated. European Central Bank (ECB) action to cut interest rates, offer cheap financing to banks and to purchase government bonds improved the flow of credit and lowered the value of the euro. In addition to supporting export competitiveness, a lower exchange rate helped return the inflation rate to positive territory following a period of falling prices (deflation) which had posed significant risks to the recovery through its potential impacts on wage setting and debt burdens. Public investment is likely to remain weak but there have been moves towards coordinating fiscal policy to achieve a better balance at the aggregate level.
Sterling rose sharply in value against the euro during Q1 2015 after the ECB announced and then implemented a programme of government bond purchases. With the euro trading at around 71-73p in recent months, sterling has been around 12-14% stronger than a year earlier. As a consequence, it has become very difficult for UK red meat exporters to compete in price sensitive markets, limiting export volumes and consequently adding to domestic supplies.
The UK economic outlook continues to look positive. Inflation is expected to pick up in the second half of the year as last year’s fall in food and fuel prices begin to fall out of the annual comparison. However, it is likely to remain below both the BoE target and the level of wage inflation, resulting in a period of significant disposable income growth. The labour market is expected to show further improvements. Exchange rates and an economic slowdown in the emerging markets imply subdued UK export demand, leaving the UK economic expansion reliant on domestic demand.
On the red meat side, increased supplies have placed pressure on retail and producer prices this year. With pig and sheep producer prices sliding significantly, there may be some scope for retail prices to fall back to stimulate consumption. However, with prices for most alternative proteins also flat or falling, it may be difficult for red meat to gain market share.
Going forwards, while domestic production of sheepmeat and pigmeat is likely to remain ahead of year earlier levels, beef production is expected to trail 2014 levels. Imports of beef and lamb may ease back due to lower production in Ireland and New Zealand, respectively, while strong domestic production may result in lower pigmeat import requirements. Due to the exchange rate, exports for all three species are likely to remain difficult; though higher value cuts may see less of an impact given that demand will be less sensitive to prices.

3
Contents Executive Summary ....................................................................................................................................................... 1 What is happening in the UK economy? ................................................................................................................ 4
Macroeconomic Indicators ............................................................................................................................................ 4 Economic Activity: ..................................................................................................................................................... 4 Inflation: ..................................................................................................................................................................... 6 Labour Market: .......................................................................................................................................................... 8 Money & Credit: ...................................................................................................................................................... 11 Money Holdings ....................................................................................................................................................... 11 Credit Availability .................................................................................................................................................... 11
Consumer Indicators ................................................................................................................................................... 12 What has been happening to economic policy in the UK? ............................................................................ 15
Monetary policy: ...................................................................................................................................................... 15 Fiscal Policy: ............................................................................................................................................................ 15
What has been happening in the European economy? .................................................................................. 16 Economic Activity .................................................................................................................................................... 16 Inflation: ................................................................................................................................................................... 17 Labour market: ........................................................................................................................................................ 18 Consumer Trends: .................................................................................................................................................. 20
What has been happening to economic policy in the EU? ............................................................................. 21 Monetary Policy: ...................................................................................................................................................... 21 Fiscal Policy: ............................................................................................................................................................ 22
A focus on exchange rate movements ................................................................................................................. 23 What factors have been influencing the €:£ exchange rate? ........................................................................... 23 What influence does movement in the €:£ have on the red meat industry? ................................................. 23 What has been happening to the $:£ exchange rate and why does it matter? ............................................ 25 What has been happening to the NZ$:£ exchange rate and why does it matter? ....................................... 25
Economic Outlook ........................................................................................................................................................ 26 UK .................................................................................................................................................................................. 26
General Economic Climate:.................................................................................................................................... 26 Economic Activity: ................................................................................................................................................... 26 Inflation: ................................................................................................................................................................... 26 Labour Market: ........................................................................................................................................................ 26 Monetary Policy: ...................................................................................................................................................... 26
EUROPE ......................................................................................................................................................................... 27 Exchange Rate Movements ........................................................................................................................................ 29
€:£ ............................................................................................................................................................................. 29 $:£ ............................................................................................................................................................................. 29 NZ$:£ ........................................................................................................................................................................ 29
What has been happening in the red meat sector? ......................................................................................... 30 Food Price Inflation: ............................................................................................................................................... 30 Beef: ......................................................................................................................................................................... 30 Lamb: ........................................................................................................................................................................ 31 Pork: ......................................................................................................................................................................... 31 Bacon:....................................................................................................................................................................... 31
Review and Outlook for Meat Supplies ................................................................................................................ 32 Beef: ......................................................................................................................................................................... 32 Sheepmeat:.............................................................................................................................................................. 34 Pigmeat: ................................................................................................................................................................... 36
Red Meat Sector Outlook .......................................................................................................................................... 38 Sources ............................................................................................................................................................................ 39 Statistical Appendix .................................................................................................................................................... 40
UK Economic Indicators ......................................................................................................................................... 41 Retail Price Index: meat & other food items ...................................................................................................... 42 Scottish Monthly Average Retail Prices of Selected Cuts .................................................................................. 43 UK Farm-to-Retail Price Spreads .......................................................................................................................... 44 EU Economic Indicators ......................................................................................................................................... 45
4
What is happening in the UK economy? Macroeconomic Indicators
Economic Activity:
Economic Growth Rates Source: ONS
Q1 2015 Q4 2014 Q3 2014 2014
q/q y/y q/q y/y q/q y/y y/y
Scotland (GDP1)
n/a n/a +0.6% +2.8% +0.6% +2.9% 2.6%
UK (GDP) +0.3% +2.4% +0.6% +3.0% +0.6% +2.8% 2.8%
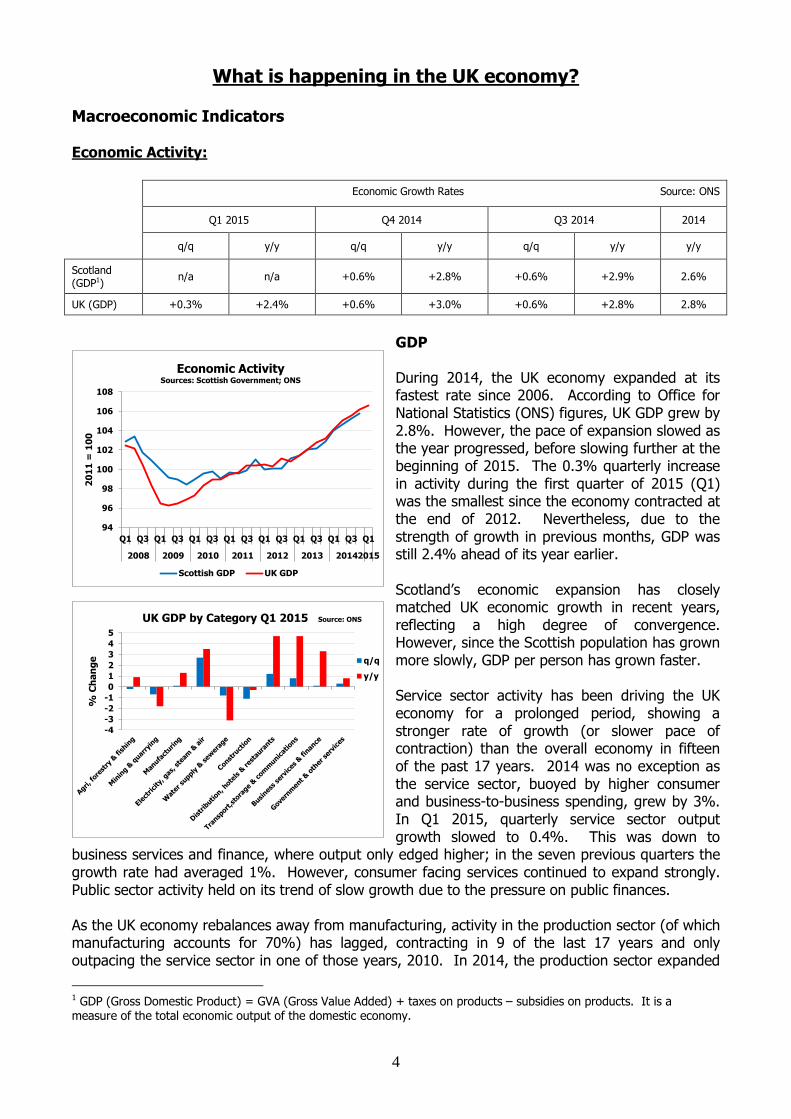
GDP During 2014, the UK economy expanded at its fastest rate since 2006. According to Office for National Statistics (ONS) figures, UK GDP grew by 2.8%. However, the pace of expansion slowed as the year progressed, before slowing further at the beginning of 2015. The 0.3% quarterly increase in activity during the first quarter of 2015 (Q1) was the smallest since the economy contracted at the end of 2012. Nevertheless, due to the strength of growth in previous months, GDP was still 2.4% ahead of its year earlier. Scotland’s economic expansion has closely matched UK economic growth in recent years, reflecting a high degree of convergence. However, since the Scottish population has grown more slowly, GDP per person has grown faster. Service sector activity has been driving the UK economy for a prolonged period, showing a stronger rate of growth (or slower pace of contraction) than the overall economy in fifteen of the past 17 years. 2014 was no exception as the service sector, buoyed by higher consumer and business-to-business spending, grew by 3%. In Q1 2015, quarterly service sector output growth slowed to 0.4%. This was down to
business services and finance, where output only edged higher; in the seven previous quarters the growth rate had averaged 1%. However, consumer facing services continued to expand strongly. Public sector activity held on its trend of slow growth due to the pressure on public finances. As the UK economy rebalances away from manufacturing, activity in the production sector (of which manufacturing accounts for 70%) has lagged, contracting in 9 of the last 17 years and only outpacing the service sector in one of those years, 2010. In 2014, the production sector expanded
1 GDP (Gross Domestic Product) = GVA (Gross Value Added) + taxes on products – subsidies on products. It is a measure of the total economic output of the domestic economy.
-4
-3
-2
-1
0
1
2
3
4
5
% C
ha
ng
e
UK GDP by Category Q1 2015 Source: ONS
q/q
y/y
94
96
98
100
102
104
106
108
Q1 Q3 Q1 Q3 Q1 Q3 Q1 Q3 Q1 Q3 Q1 Q3 Q1 Q3 Q1
2008 2009 2010 2011 2012 2013 20142015
20
11
= 1
00
Economic Activity Sources: Scottish Government; ONS
Scottish GDP UK GDP

5
by 1.6% as a strong year for manufacturing (+2.9%) was partially offset by weaker utilities output. However, as sterling strengthened against the euro, exporting became less profitable in the second half of 2014 and acted as a drag on manufacturing. Moving into Q1 2015, a further strengthening of sterling dampened manufacturing and output grew by just 0.1% quarter-on-quarter, and by 1.3% year-on-year. The production sector grew at the same quarterly rate of just 0.1%. This left its output only 0.6% higher than a year earlier. The smaller sectors of construction and agriculture, forestry & fishing also slowed during Q1 2014. Construction output decreased by 1.1% on the quarter and by 0.3% year-on-year. Though agricultural output edged lower on the quarter, it remained nearly 1% higher than in early 2014. Purchasing Managers Index (PMI)
A more up-to-date measure of private sector activity comes courtesy of the PMI – a monthly survey of private sector firms. As can be seen in the chart, business activity has continued to exceed the 50 level of no change, signalling growth. However, growth slowed in the second half of 2014 in both manufacturing and services, and has remained on this lower trend. Construction has continued trending downwards. The May survey suggested that service sector
growth slipped to a five month low, having shown strength in March and April. However, at 56.5, the index remained in positive territory; and the three-month rolling average was above the annual average for 2014. Businesses reported growing orders as new services were being offered and marketing campaigns were launched. In addition, production was unable to keep up with demand, leading to increased backlogs of work. It was also noted that the election result had reduced uncertainty and confidence remained strong. Indeed, more than half of the surveyed firms expected increased orders in the year ahead compared with just 7% expecting a decline. Though still growing, manufacturing activity has been subdued since last summer. In May, the index edged up to 52. It was reported that while domestic orders held firm, the export trade was proving difficult as a stronger sterling made it harder to export profitably into the Euro Area; though conversely, a weaker sterling against the US dollar had assisted trade with the rest of the world. The construction sector has cooled sharply in 2015. In part, activity was held back by uncertainty over the outcome of the General Election. After the Election, activity was reported to have picked up, though at 55.9, the PMI was still at its second lowest level since June 2013. Although activity has been more sluggish in 2015, the PMI surveys have continued to report high levels of business confidence and ever-expanding order books. As a result, firms have continued to invest in upgrading their processes, technology and premises. Further evidence has come from the ONS which estimated that business investment picked up by 1.7% during Q1, having slipped back at the end of 2014. This kept it 3.7% above year earlier levels. Summary The previously strong pace of economic recovery in the UK dipped at the turn of the year, mainly down to slower growth in the key business services and finance sector. However, consumer facing industries continued to perform well, helping to offset the difficulties of trading with the Euro Area. With businesses continuing to invest due to a strong outlook, economic growth looks self-sustaining and the poor first quarter may have been a short-lived blip.
40
45
50
55
60
65
70
J F M A M J J A S O N D J F M A M J J A S O N D J F M A M
2013 2014 2015
Dif
fusio
n I
nd
ex
(5
0 =
no
ch
an
ge
)
UK PMI Source: Markit
Manufacturing Services Construction
6
Inflation:
UK Rates of Inflation (y/y) Source: ONS
Feb to Apr 2015 Nov 2014 to Jan 2015 2014
CPI 0.0% 0.6% 1.5%
Core inflation2 1.0% 1.3% 1.6%
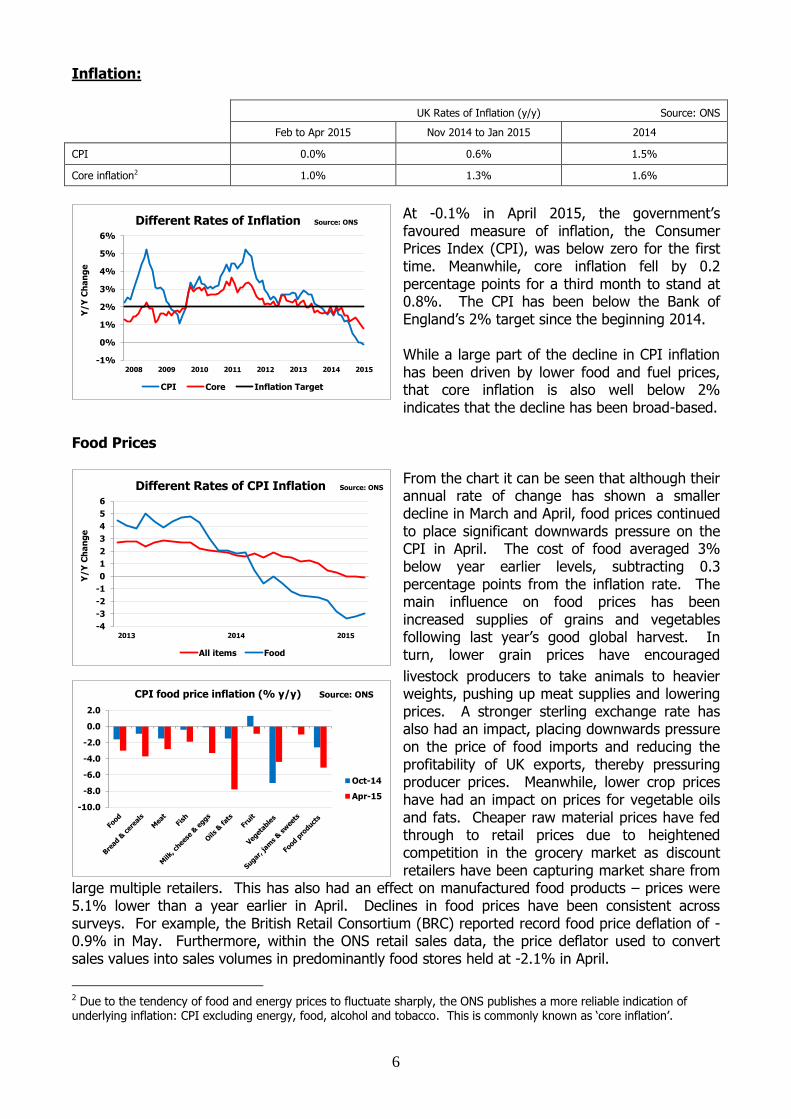
At -0.1% in April 2015, the government’s favoured measure of inflation, the Consumer Prices Index (CPI), was below zero for the first time. Meanwhile, core inflation fell by 0.2 percentage points for a third month to stand at 0.8%. The CPI has been below the Bank of England’s 2% target since the beginning 2014. While a large part of the decline in CPI inflation has been driven by lower food and fuel prices, that core inflation is also well below 2% indicates that the decline has been broad-based.
Food Prices
From the chart it can be seen that although their annual rate of change has shown a smaller decline in March and April, food prices continued to place significant downwards pressure on the CPI in April. The cost of food averaged 3% below year earlier levels, subtracting 0.3 percentage points from the inflation rate. The main influence on food prices has been increased supplies of grains and vegetables following last year’s good global harvest. In turn, lower grain prices have encouraged
livestock producers to take animals to heavier weights, pushing up meat supplies and lowering prices. A stronger sterling exchange rate has also had an impact, placing downwards pressure on the price of food imports and reducing the profitability of UK exports, thereby pressuring producer prices. Meanwhile, lower crop prices have had an impact on prices for vegetable oils and fats. Cheaper raw material prices have fed through to retail prices due to heightened competition in the grocery market as discount retailers have been capturing market share from
large multiple retailers. This has also had an effect on manufactured food products – prices were 5.1% lower than a year earlier in April. Declines in food prices have been consistent across surveys. For example, the British Retail Consortium (BRC) reported record food price deflation of -0.9% in May. Furthermore, within the ONS retail sales data, the price deflator used to convert sales values into sales volumes in predominantly food stores held at -2.1% in April.
2 Due to the tendency of food and energy prices to fluctuate sharply, the ONS publishes a more reliable indication of underlying inflation: CPI excluding energy, food, alcohol and tobacco. This is commonly known as ‘core inflation’.
-10.0
-8.0
-6.0
-4.0
-2.0
0.0
2.0
CPI food price inflation (% y/y) Source: ONS
Oct-14
Apr-15
-4
-3
-2
-1
0
1
2
3
4
5
6
Y/Y
Ch
an
ge
Different Rates of CPI Inflation Source: ONS
All items Food
-1%
0%
1%
2%
3%
4%
5%
6%
Y/Y
Ch
an
ge
Different Rates of Inflation Source: ONS
CPI Core Inflation Target

7
Fuel & Energy Prices The CPI has also fallen back due to a decline in fuel and household energy prices. Although the oil price has picked up since reaching a low point in January, it has remained around 35% below year earlier levels in sterling terms. As a consequence, transport fuels have fallen in price and were around 12% below year earlier levels in April. The shift in the oil market has been attributed to a significant change in the balance between supply and demand. Indeed, increased shale oil production in the US has raised global oil production, while a strong US dollar and a slower rate of economic growth in China have led to downward adjustments in expected demand. Meanwhile, the combination of falling futures prices and political pressure on energy companies led energy companies to cut their prices at the end of 2014. In April, electricity was slightly cheaper to buy than a year earlier, while gas prices were down by 4%. Consumer Goods Prices
As noted earlier, it is not just the more volatile food and energy prices that have contributed to the slowdown in UK inflation. A significant influence has come from consumer goods. Indeed, during April, prices for durables, semi-durables and non-durables decreased by 2.3%, 0.5% and 0.3%, respectively. Looking more closely at the CPI data showed numerous categories of consumer prices in deflation. These included clothing (-0.3%); footwear (-1.1%); furniture (-1.3%); textiles (-1.4%); sports equipment (-1.2%) and financial services
(-3%). Further evidence came from the BRC survey for April which found non-food prices to be 2.5% lower than a year earlier. In the ONS retail sales dataset, deflators (inflation rates) for textile, clothing & footwear stores and household goods stores stood at -0.9% and -2.2% respectively. A number of factors have been placing pressure on the prices of consumer goods. According to the PMI surveys, lower input costs at manufacturing firms, due to lower commodity prices and a stronger sterling, have been passed on to output prices as a consequence of strong competition in the retail sector. Consumer Services Prices In the service sector, it has been a different story, however. Indeed, the April CPI showed an average 2% increase in prices across the service sector. It should be noted, however, that services price inflation had previously been running at around 2.5%. In April, tight housing supplies saw rents average 2.7% higher than a year earlier. Other services to show above average increases included car maintenance (2.5%) and hotels (3.8%), but cafe and restaurant price increases dipped back to 1.9%. According to PMI surveys, services prices have been pushed up by relatively firm demand which has allowed increased wage costs to be passed on to consumers. Summary To sum up, it appears that inflation has fallen below target due mainly to the pass through of businesses lower raw material costs. These have mostly been driven by global factors, such as lower commodity prices and exchange rates; though strong competition across the domestic retail sector will have contributed to the pass-through effect. Service providers have maintained more pricing power, reflecting the higher level of labour costs within their overall cost of production.
-2.8
3.0
-0.4 0.5
-0.5
2.0
-2.81.0
-0.4
10.0
2.0-0.1
-4
-2
0
2
4
6
8
10
12
% c
ha
ng
e y
/y
CPI by Category April 2015 Source: ONS

8
Labour Market: Employment
According to the ONS Labour Force Survey, UK employment grew by 0.7% on the quarter and by 1.8% year-on-year to reach a new record high of almost 31.1m during Q1 2015. This was the eighth successive quarter of employment growth and the quarterly increase was the fastest in a year and second quickest of the previous two years. Due to the fast pace of job creation, the UK employment to population ratio has now
returned close to its pre-2008 recession peak of just over 60%. Having stagnated at around 59.5% in the final three quarters of 2014, the ratio lifted to 60% in early 2015. This was the highest since Q2 2008. Rising employment has been a function of increased vacancies. During Q1 2015, there were 745,000 outstanding positions in the UK economy. Compared with Q4 2014, this was a rise of more than 4.5%, while they were up by a fifth year-on-year. The number of job openings recovered to its pre-2008 recession level at the end of 2014 and has since grown significantly further. This has given employees increased bargaining power in negotiations over pay and conditions.
Regular private sector surveys of labour market conditions have been broadly supportive of the official figures. In recent months, the PMI surveys have indicated strong job growth across manufacturing, services and construction. This has reportedly been the consequence of order growth outpacing output and leading to backlogs of work, requiring additional staff. Although the Bank of England’s (BoE) monthly Agents’ summary has reported slower rates of
employment growth in 2015, hiring intentions did lift in April across business services, consumer services and manufacturing. In the services sector, the strongest employment growth was reported to have been in IT, as the world moves increasingly towards online enterprise, plus professional services, which includes law and accountancy. By contrast, multiple retailers had reduced staffing levels. Manufacturing was reported to have seen slower employment growth than services. The summary also reported that firms had found it harder to secure the right staff as the labour market had tightened. This was most notable in lower skilled positions where job growth has been particularly strong through 2014 and into 2015. Underemployment A good barometer of the underlying health of the labour market is to look at indicators relating to underemployment, such as the level of part-time, temporary and self-employed work. In terms of full-time versus part-time roles, both had shown increases at a similar pace to overall employment. This meant that 73% of those in employment were in full-time positions. This has not shown any significant increase during the past couple of years of strong job growth, having fallen back from 74-75% following the 2008 recession. This may reflect a shift in the structure of the labour market, with one example being older people re-joining the labour force. Government efforts to increase
28.0
28.5
29.0
29.5
30.0
30.5
31.0
31.5
08 09 10 11 12 13 14 15
57.0
58.0
59.0
60.0
61.0
62.0
63.0
64.0
Nu
mb
er
of
UK
re
sid
en
ts in
wo
rk (
m)
% o
f th
ose
ag
ed
16
-64
in
wo
rk
UK Employment Source: ONS
Employment/Population Ratio (RHS) Total Employment (LHS)
46
50
54
58
62
66
70
J M M J S N J M M J S N J M M J S N J M M J S N J M
2011 2012 2013 2014 2015
Dif
fusio
n I
nd
ex
(5
0 =
no
ch
an
ge
)
Labour Market Barometer Source: Markit
Scotland (Bank of Scotland Labour Market Barometer)
UK (KPMG/REC Report on Jobs)
9
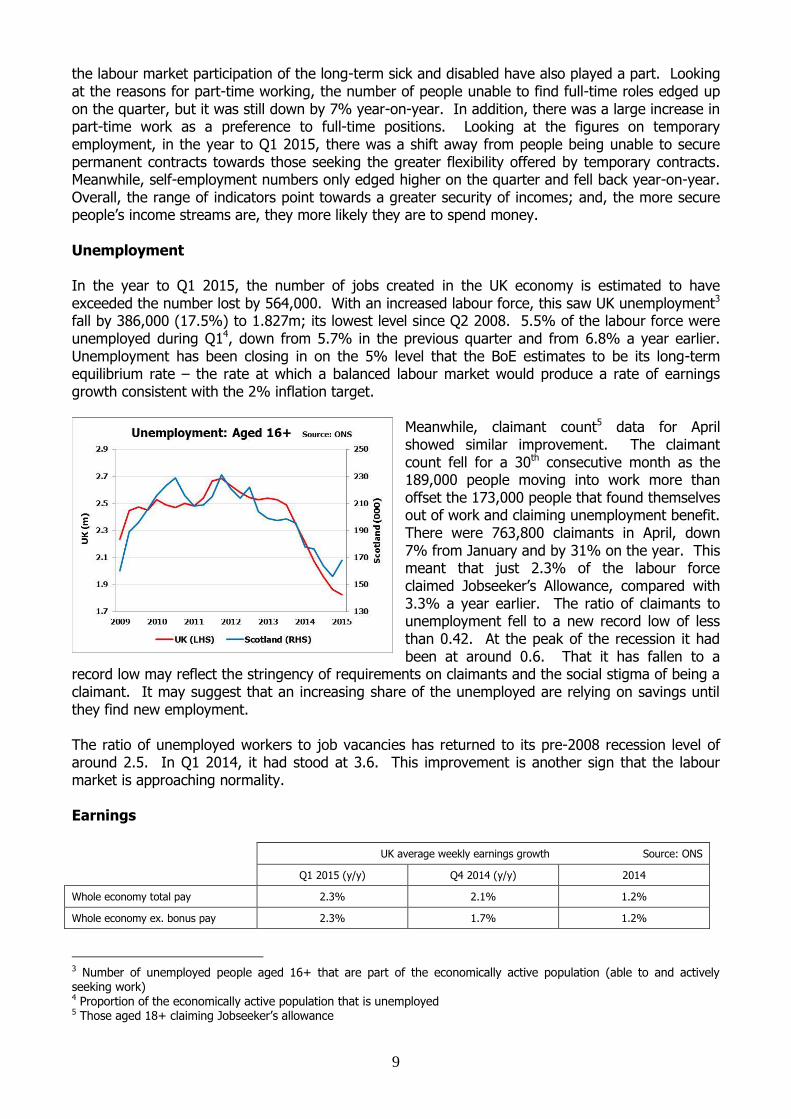
the labour market participation of the long-term sick and disabled have also played a part. Looking at the reasons for part-time working, the number of people unable to find full-time roles edged up on the quarter, but it was still down by 7% year-on-year. In addition, there was a large increase in part-time work as a preference to full-time positions. Looking at the figures on temporary employment, in the year to Q1 2015, there was a shift away from people being unable to secure permanent contracts towards those seeking the greater flexibility offered by temporary contracts. Meanwhile, self-employment numbers only edged higher on the quarter and fell back year-on-year. Overall, the range of indicators point towards a greater security of incomes; and, the more secure people’s income streams are, they more likely they are to spend money. Unemployment In the year to Q1 2015, the number of jobs created in the UK economy is estimated to have exceeded the number lost by 564,000. With an increased labour force, this saw UK unemployment3 fall by 386,000 (17.5%) to 1.827m; its lowest level since Q2 2008. 5.5% of the labour force were unemployed during Q14, down from 5.7% in the previous quarter and from 6.8% a year earlier. Unemployment has been closing in on the 5% level that the BoE estimates to be its long-term equilibrium rate – the rate at which a balanced labour market would produce a rate of earnings growth consistent with the 2% inflation target.
Meanwhile, claimant count5 data for April showed similar improvement. The claimant count fell for a 30th consecutive month as the 189,000 people moving into work more than offset the 173,000 people that found themselves out of work and claiming unemployment benefit. There were 763,800 claimants in April, down 7% from January and by 31% on the year. This meant that just 2.3% of the labour force claimed Jobseeker’s Allowance, compared with 3.3% a year earlier. The ratio of claimants to unemployment fell to a new record low of less than 0.42. At the peak of the recession it had been at around 0.6. That it has fallen to a
record low may reflect the stringency of requirements on claimants and the social stigma of being a claimant. It may suggest that an increasing share of the unemployed are relying on savings until they find new employment. The ratio of unemployed workers to job vacancies has returned to its pre-2008 recession level of around 2.5. In Q1 2014, it had stood at 3.6. This improvement is another sign that the labour market is approaching normality. Earnings
3 Number of unemployed people aged 16+ that are part of the economically active population (able to and actively seeking work) 4 Proportion of the economically active population that is unemployed 5 Those aged 18+ claiming Jobseeker’s allowance
UK average weekly earnings growth Source: ONS
Q1 2015 (y/y) Q4 2014 (y/y) 2014
Whole economy total pay 2.3% 2.1% 1.2%
Whole economy ex. bonus pay 2.3% 1.7% 1.2%

10
Average weekly earnings grew at an annual rate of 2.3% in Q1 2015. Regular pay - which excludes bonus payments - also increased by 2.3%. Both rates have seen notable increases since Q3 2014 and regular pay growth exceeded 2% for the first time since the summer of 2011. During March, regular weekly earnings averaged £461. Meanwhile, bonus payments were at £30, taking total pay to £491 (£25,500 per annum). With pay growth lifting while inflation has fallen sharply, the average worker is now seeing their pay increase in real terms. March was the sixth consecutive month that this was the case and the real terms increase in total pay was at its highest level since December 2007. Prior to October 2014, earnings growth had trailed CPI since September 2009. However, it should be noted that before adjusting for inflation, pay growth has remained well below its average of 4% during the 5 years to Q2 2008. If, as the BoE expects, CPI begins to pick up towards the end of this year, earnings growth will have to rise significantly further if real terms pay is to continue growing strongly. Stronger earnings growth is a further indication of a healthy labour market, suggesting that the previously large pool of available skilled workers from which firms had to draw from has been eroded, thereby bidding up wages through greater competition for staff. Since higher wages are likely to underpin consumer spending, the likelihood of a self-fulfilling positive cycle has increased. One downside for employers, however, is that a tighter labour market makes it harder for firms to find workers with the right skills. In addition to a healthy labour market, higher growth in average earnings may also reflect a shift in employment growth away from the lower end of the wage scale, where the majority of gains had been in 2013/14. Certainly, 72% of the employment growth during the year to Q1 2015 came in the second and third highest skilled categories. However, on the other hand, there was still strong employment growth in the lowest skilled category, while the highest skilled category saw numbers decline.
As can be seen in the average weekly earnings chart, there has clearly been a reversal in growth rates within manufacturing and services. Meanwhile, with public finances under pressure, public sector wages have seen little change in growth rates. In the most recent BoE Agents’ summary, it was noted that lower oil prices had passed through the oil & gas supply chain into wages and that similar developments had occurred in other parts of the manufacturing sector where input costs have fallen. It seems likely that the downturn in export demand
caused by unfavourable exchange rates will also have affected the willingness of firms to pay higher wages. By contrast, the strong performance of consumer-facing service-sector firms is likely to have boosted pay growth; indeed, this has been commented on regularly in the PMI surveys in recent months. At the lower end of the pay scale, a 3% increase in the minimum wage in October 2014 will have had more of an impact in services than in manufacturing. Summary The upturn in the UK economy over the past couple of years has encouraged businesses to take on additional staff to deal with higher levels of orders. Employment growth has outpaced the rise in the UK’s working age population and a wide range of labour market indicators have returned close to their pre-2008 recession levels. With labour market conditions returning to normal, firms have found it harder to find staff to meet their increasing order books and earnings have subsequently picked up; though they have dipped back in manufacturing. As inflation has fallen sharply, real wages have been increasing at their fastest rate since late 2007.
0.0
0.5
1.0
1.5
2.0
2.5
3.0
3.5
11 12 13 14 15
3-m
on
th a
vg
(%
y/y)
Average Weekly Earnings Growth Source: ONS
Regular Pay Public Sector Manufacturing Services
11
Money & Credit:
Money Holdings According to the latest BoE data, the aggregate level of money and credit in the UK economy (M4) stood at £1.81 trillion in April. This was up by more than 4% on a year earlier. This means that there was a significant increase in money sitting in bank accounts. Breaking this down, the money holdings of households (includes sole traders and the non-profit sector) grew at a slightly below average rate of 3.5%. Meanwhile, there was a stronger 9.5% rate of money holdings growth at private non-financial corporations (PNFCs) - non-financial companies and partnerships - and a small increase of just over 1% at financial institutions. BoE statistics show that the overall increase in money holdings was supported by an increase in net lending by UK banks and building societies to both households and the private sector - M4 lending was up by 2.5% on the year. This increase was mainly driven by a jump in lending to the financial sector, which rose by 10%. By contrast, there was no change in the level of outstanding lending to PNFCs. Lending to the household sector, meanwhile, rose by approximately 2.5%. While overall M4 lending to PNFC’s was flat year-on-year, it continued to be held back by real estate firms – a legacy of the 2007/8 financial crisis. Indeed, the latest BoE Inflation Report showed that whereas the total stock of loans outstanding to real estate firms was around 5% below its year earlier level in Q1 2015, lending to other non-financial businesses was nearly 5% higher. Credit Availability
The May BoE Agents’ summary of business conditions reported a further improvement in credit availability during April. The survey suggested that banks were now willing to lend to both large and medium-sized companies and greater competition had resulted in more favourable terms for borrowers. For small firms, credit availability had eased, unless they were in the construction or property sectors. Funding from non-bank sources was widely available; the BoE Inflation Report showed a net increase in non-bank funding of £8.3bn during Q1 2015, of which £2.2bn came from equities and bonds. Consumer Credit The main reason for overall lending to households growing more slowly than money holdings was that mortgage financing rose by less than 2% year-on-year in April and it accounted for 88% of all lending to households. Although mortgage approvals picked up strongly in April 2015, they had fallen through much of 2014 and early 2015 after regulations were tightened in the spring of 2014. By contrast, consumer credit has been growing strongly for a prolonged period and was up by 7% year-on-year in April. 36% of consumer credit was extended through credit cards, and it rose by more than 5%. Other loans to consumers increased by more than 8%. In part, this is likely to reflect rising car sales, which, according to the Society of Motor Manufacturers and Traders (SMMT), grew at an annual rate of 5% in April, driven by the availability of cheap financing. Summary As the foundations of the UK economic recovery have strengthened, banks and other lenders have become increasingly confident to lend and have offered better terms to attract borrowers. In addition, small and medium-sized firms have begun to find it easier to access credit for investment. However, the banking sector has remained more risk averse than in the run-up to the 2008 financial crisis and so alternative sources of finance are being secured to enable investment. Despite real wages returning to growth, there has been no let-up in consumer borrowing.

12
Consumer Indicators
Household Incomes
In the second half of 2014 (H2), real household disposable income grew by 0.9% year-on-year to £551bn. This marks an improvement from the first half of the year when real incomes had only edged higher. Though pre-tax money incomes grew by more than 4% during H2, a higher cost of living lowered this to less than 3% when converted into real terms. There was also a net reduction in incomes due to fiscal policy. Indeed, there was 1.5% reduction in social benefits, while, as a function of a growing economy, the amount of tax and national insurance paid rose by 4.5%. Asda, in conjunction with the Centre for Economic & Business Research, produces a more timely indicator of movements in disposable incomes. As can be seen in the chart, UK households have, on average, seen a sharp increase in the level of income they have available to spend on non-essential items. The strong recovery of 2014 has shown no signs of
letting up in 2015 and has been underpinned by lower prices for essential items such as food and fuel at the same time as average earnings growth has increased. The tracker suggests that disposable income was up by an average of 9.5% year-on-year in the February to April period. Clearly, this has the potential to provide a significant boost to consumer spending; though this will depend on how much of the additional income is saved. However, the monthly household finance survey carried out by Markit shows that, on average, UK
households still feel that their finances have remained under pressure. Although a new record high was recorded in May, more respondents were pessimistic than optimistic about their current financial situation6. Finances were supported by increased labour market participation and incomes. Looking forward, households were, on balance, pessimistic for the first time since September 2014. This was driven by an expectation that the cost of fuel and energy would begin to
increase again. In addition, there was a slight increase in the proportion of respondents expecting the first interest rate increase to come within the next 6 months.
6 The HFI has been running since 2009
30
35
40
45
50
55
2010 2011 2012 2013 2014 2015
Dif
fusio
n I
nd
ex
(5
0=
no
ch
an
ge
)
UK Household Financial Situation Source: Markit
Household Finance Index (HFI) Future Finances Index
155
160
165
170
175
180
185
190
2010 2011 2012 2013 2014 2015
£ p
er
we
ek
Monthly Asda Income Tracker
256
260
264
268
272
276
Q1 Q3 Q1 Q3 Q1 Q3 Q1 Q3 Q1 Q3 Q1 Q3 Q1 Q3 Q1 Q3
2007 2008 2009 2010 2011 2012 2013 2014
£b
n p
er
qu
art
er
Real household disposable income(Source: ONS)

13
Consumer Confidence
Having dipped back in late 2014, there was a lift in UK consumer confidence during the spring of 20157. Although, the May survey showed a fall in confidence from March and April when it had stood at 4, it remained above zero, indicating a net degree of optimism amongst UK consumers. The three point monthly decrease between April and May was mainly driven by a sharp fall in year-ahead expectations for both personal and general economic conditions. This fall may have been influenced by the result of the UK General
Election. However, there were also slight declines for perceptions of personal and general economic conditions over the past year. Meanwhile, respondents felt less confident about purchasing a big-ticket item than in the previous month. Nevertheless, over the past year, consumer confidence has been at historically high levels. Consumer Spending ONS data shows that in real terms, UK household spending increased by 1% during Q3 2014 and then by 0.6% during Q4. The strong quarterly expansions of H2 2014 were reflected in an annual increase in spending of 2.9%. Spending growth exceeded the rise in disposable incomes as more confident consumers saved less of their income. Indeed, the household savings rate decreased to 5.8% from 6.6% in H2 2013. Looking more closely at the spending data shows that the fastest growing category of expenditure during H2 2014 was recreation & culture; it rose by more than 6% year-on-year. Meanwhile, three
other categories posted growth rates of more than 5%: clothing & footwear; miscellaneous8; and
household goods & services. However, expenditure on food declined by 1.5%.
Within the food category, meat was the best performer in H2 2014, as spending rose by 2% year-on-year. All other categories showed declines, including fish - down 3.3% - and milk, cheese & eggs – down 4.1%. Since spending on food decreased while overall spending rose strongly, the share of food in total consumer spending fell significantly, reaching a record low of 7.4% in Q4. In recent years it had held relatively steady at around 7.7-7.9%. Real terms spending on meat continued to hold at 1.7% of total domestic spending and, at 23.3%,
took its highest share of real terms food spend since the beginning of 2008.
7 The overall index is the average score for each of the five survey questions. Respondents are asked to give a score of 1 if there has been a large improvement; 0.5 for a small improvement; 0 for no change; -0.5 for a slight worsening; or -1 for a considerable deterioration. 8 Personal items such as hairdressing, beauty products, watches, insurance, social care and legal fees
-35
-30
-25
-20
-15
-10
-5
0
5
10
2011 2012 2013 2014 2015
Ind
ex
sco
re
UK Consumer Confidence Source: GfK NOP
1.60%
1.63%
1.66%
1.69%
1.72%
1.75%
1.78%
1.81%
7.4%
7.5%
7.6%
7.7%
7.8%
7.9%
8.0%
8.1%
Q1 Q3 Q1 Q3 Q1 Q3 Q1 Q3 Q1 Q3 Q1 Q3
2009 2010 2011 2012 2013 2014
% o
f to
tal d
om
esti
c e
xp
en
dit
ure
% o
f to
tal d
om
esti
c e
xp
en
dit
ure
Household Expenditure on Food Source: ONS
Food (LHS) Meat (RHS)
14
Seasonally adjusted UK retail sales: February to April 2015 Source: ONS
q/q change y/y change
Value Chained volume Value Chained volume
Total -0.5% 0.7% 1.3% 4.6%
Excluding automotive fuel 0.0% 0.7% 2.6% 4.8%
Predominantly food stores -0.7% 0.0% -0.4% 1.6%
Predominantly non-food stores 0.3% 0.9% 4.3% 6.1%
Non-store retailing 1.6% 3.5% 10.7% 14.1%
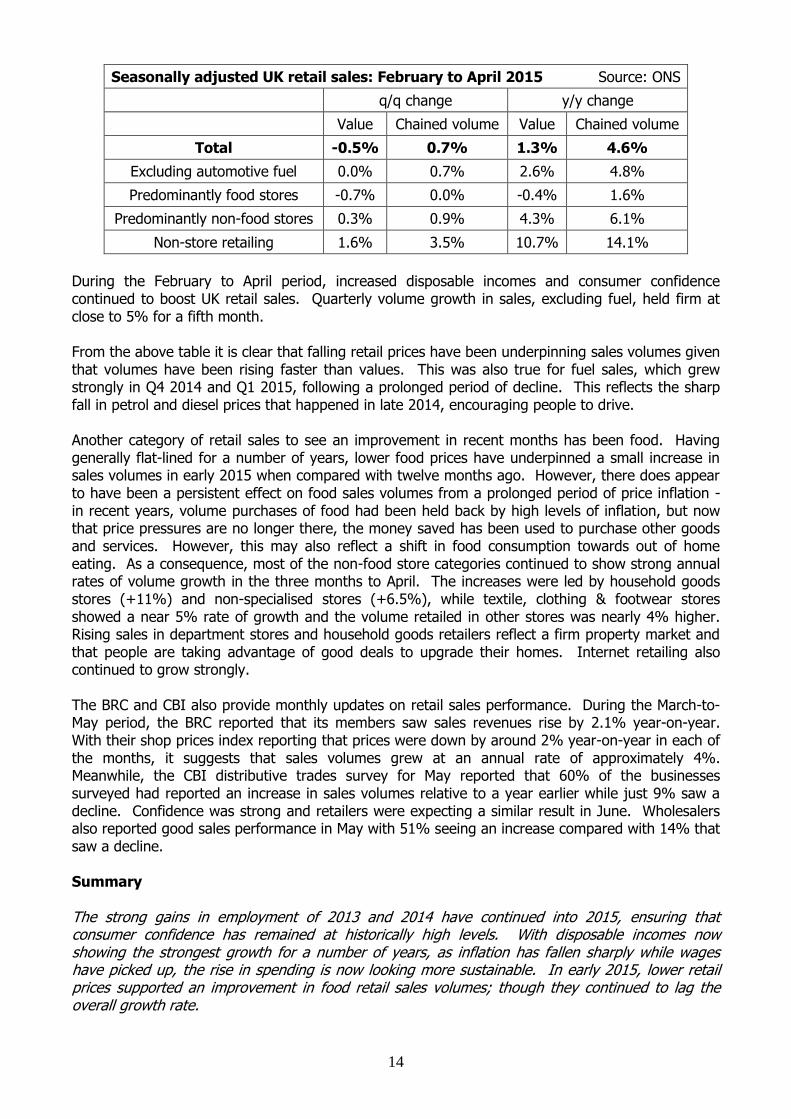
During the February to April period, increased disposable incomes and consumer confidence continued to boost UK retail sales. Quarterly volume growth in sales, excluding fuel, held firm at close to 5% for a fifth month. From the above table it is clear that falling retail prices have been underpinning sales volumes given that volumes have been rising faster than values. This was also true for fuel sales, which grew strongly in Q4 2014 and Q1 2015, following a prolonged period of decline. This reflects the sharp fall in petrol and diesel prices that happened in late 2014, encouraging people to drive. Another category of retail sales to see an improvement in recent months has been food. Having generally flat-lined for a number of years, lower food prices have underpinned a small increase in sales volumes in early 2015 when compared with twelve months ago. However, there does appear to have been a persistent effect on food sales volumes from a prolonged period of price inflation - in recent years, volume purchases of food had been held back by high levels of inflation, but now that price pressures are no longer there, the money saved has been used to purchase other goods and services. However, this may also reflect a shift in food consumption towards out of home eating. As a consequence, most of the non-food store categories continued to show strong annual rates of volume growth in the three months to April. The increases were led by household goods stores (+11%) and non-specialised stores (+6.5%), while textile, clothing & footwear stores showed a near 5% rate of growth and the volume retailed in other stores was nearly 4% higher. Rising sales in department stores and household goods retailers reflect a firm property market and that people are taking advantage of good deals to upgrade their homes. Internet retailing also continued to grow strongly. The BRC and CBI also provide monthly updates on retail sales performance. During the March-to-May period, the BRC reported that its members saw sales revenues rise by 2.1% year-on-year. With their shop prices index reporting that prices were down by around 2% year-on-year in each of the months, it suggests that sales volumes grew at an annual rate of approximately 4%. Meanwhile, the CBI distributive trades survey for May reported that 60% of the businesses surveyed had reported an increase in sales volumes relative to a year earlier while just 9% saw a decline. Confidence was strong and retailers were expecting a similar result in June. Wholesalers also reported good sales performance in May with 51% seeing an increase compared with 14% that saw a decline. Summary The strong gains in employment of 2013 and 2014 have continued into 2015, ensuring that consumer confidence has remained at historically high levels. With disposable incomes now showing the strongest growth for a number of years, as inflation has fallen sharply while wages have picked up, the rise in spending is now looking more sustainable. In early 2015, lower retail prices supported an improvement in food retail sales volumes; though they continued to lag the overall growth rate.

15
What has been happening to economic policy in the UK?
Monetary policy: At its June meeting, the BoE’s Monetary Policy Committee (MPC) left Bank Rate on hold at 0.5%. The stock of asset purchases (Quantitative Easing/ QE) was also left unchanged at £375bn. By implication, the MPC judged that this monetary stance was appropriate to meet the 2% inflation target in 2-3 years’ time while supporting economic growth and employment. The Minutes of the May MPC meeting showed that both decisions were unanimous; though two Members had come close to voting for an increase in Bank Rate to 0.75%.
With inflation falling back to around zero, the MPC would under normal conditions most likely loosen monetary policy by cutting interest rates or engaging in another round of QE, in order to stimulate the economy to prevent the low level of inflation from becoming ingrained and potentially economically damaging. However, the MPC has felt able to hold its monetary stance on this occasion, as its best collective judgment is that the low level of inflation is temporary. Indeed, in the May minutes, the expectation was that since approximately 75% of the difference between CPI (0% in March) and the BoE’s 2% target could be attributed to energy, food and other goods prices, inflation would lift towards the year-end as the past fall in commodity prices would drop out of the year-on-year comparison. By implication, the MPC felt that the current monetary stance would be required to eliminate the remaining 25% of the downwards pressure on the CPI. Fiscal Policy: Despite the rhetoric of fiscal austerity, the UK government continues to run a large budget deficit and it amounted to 4.8% of GDP in the 2014/15 financial year. This was down from 5.7% in the previous year as tax receipts grew by 3.5% while the increase in spending was limited to less than 1%. Public investment rose by of 7% and this will help raise the future growth potential of the UK economy through improved infrastructure. The budget deficit remains high due to the permanently lower tax revenues from the financial sector, plus the large increase in the income tax earnings threshold which has narrowed the tax base over the past 5 years. On the spending side, despite significant efforts to trim spending in most government departments, an ageing population continues to raise the cost of pensions, health and social care. In their election manifesto, the Conservative Party committed to further sharp cuts to spending in non-essential government departments. Since this is coming on the back of sharp cuts in the past 5 years, it seems likely that some departments will offer a significantly reduced service. One area this may have implications for in the red meat industry is export market access.
However, also in the Conservative manifesto were future tax cuts, and, in the current financial year a rise in the income tax threshold to £10,600 had previously been set. For the basic rate taxpayer, this will have boosted post-tax pay by a little over £2 a week. On the other hand, further reductions to in-work benefits payments may more than offset this. As with all policy changes, some households will be net winners and others net losers. Summary The monetary stance has continued to support UK economic activity. The MPC has not altered its stance despite a sharp fall in inflation since it believes that the fall in inflation has been mostly down to temporary factors which will dissipate later this year. On the fiscal side, the UK government continues to run a large budget deficit. To help support disposable incomes, the tax threshold was raised slightly for the 2015/16 financial year; though a number of benefits were cut.

16
What has been happening in the European economy?
Economic Activity:
Economic Activity in Prominent Scottish red meat markets
GDP Growth
(%Q/Q)
GDP Growth
(%Y/Y)
Q1 2015 Q4 2014 Q1 2015 2014
Bel +0.3 +0.2 +0.9 +1.1
Fra +0.6 0.0 +0.7 +0.4
Ger +0.3 +0.7 +1.0 +1.6
Hol +0.4 +0.8 +2.4 +0.9
It +0.3 0.0 0.0 -0.4
Spa +0.9 +0.7 +2.6 +1.4
Euro Area +0.4 +0.3 +1.0 +0.9
Den +0.4 +0.5 +1.7 +1.1
Swe +0.4 +0.8 +2.5 +2.1
UK +0.3 +0.6 +2.4 +2.8
EU28 +0.4 +0.4 +1.4 +1.3
Nor* +0.5 +0.4 +2.9 +2.2
Swi -0.2 +0.5 +1.1 +2.0
Sources: Eurostat; Statistics Norway; Statistics Denmark; SECO
*Mainland GDP (excluding oil & gas)
After a prolonged period of economic stagnation, the signs from the Euro Area are now looking much more promising. Economic activity began to pick up in a number of countries towards the end of 2014 and became more widespread in Q1 2015. Despite notable improvements in the large economies of France and Italy, which had been struggling in recent years, the overall pace of economic growth was still relatively subdued at 0.4%. This is reinforced by the fact that compared to a year earlier output was only 1% higher in the Euro Area as a whole. However, economic performance has picked up more significantly in Holland and Spain. Outside of the Euro Area, the Nordic countries have shown similarly positive signs. However, the previous economic momentum in Switzerland appears to have reversed in early 2015.
According to the monthly Markit PMI surveys, private sector activity growth fell back in the second half of 2014, but has since rebounded. This has been true for both manufacturing and service sector firms; though the pace of expansion has been stronger in services. The recovery in service sector output indicates that domestic demand within the Euro Area has finally improved. Although new orders and confidence slipped to their lowest level of the year-to-date in May, Spain’s service sector continued to show strength
and French activity had picked up. Meanwhile, the fall in the euro, engineered by ECB action to loosen Euro Area monetary policy, has improved the competitiveness of manufacturing exporters and demand has subsequently taken an upturn. In the May survey, the Spanish manufacturing sector led the way, but there were also reports of strong order growth in Holland and Italy. Meanwhile, although French manufacturers continued to struggle, export orders had improved. Looking out-with the Euro Area, the latest PMIs for Sweden pointed to a strong lift in demand for
44
46
48
50
52
54
56
J F M A M J J A S O N D J F M A M J J A S O N D J F M A M
2013 2014 2015Dif
fusio
n I
nd
ex
(5
0 =
no
ch
an
ge
)
Eurozone PMI Source: Markit
Manufacturing Services

17
both manufacturing and services. However, Switzerland and Norway disappointed, posting manufacturing PMI’s below 50, indicating contraction. Latest Eurostat industrial production figures have shown an upturn; output was 1.8% higher than a year earlier in March in the Euro Area and up 2% in the EU28. Furthermore, it has reached its highest level for around four years. Underpinning the overall expansion in the Euro Area were energy - up nearly 4% - and non-durable consumer goods – up nearly 6%. However, production of intermediate and capital goods were flat while consumer durable production fell back. At the wider EU28 level, there was slow growth in intermediate, capital and consumer durables and stronger increases in energy and non-durables. On a country level, Eurostat figures have shown that industrial output trended higher over the year to March in Germany, Denmark, France, Norway, Holland, Italy and Spain. However, most of these countries were showing a modest level of expansion of around 1-2% per annum. By contrast, industrial output fell back in Sweden; contradicting the PMI indicators. Inflation:
Inflation in the Euro Area has rebounded after falling sharply in late 2014 and early 2015. After four months in deflation, the HICP matched year earlier levels in April and is estimated to have
been 0.3% higher year-on-year during May9.
Although the inflation rate reached a 6-month high, it remained well below the ECB’s 1.5%-2% target. Like in the UK, inflation has been held down by more than falling fuel, food and energy prices; core inflation has been running at or below 1% for nearly two years and although it picked up in May, it was still at just 0.9%.
A breakdown of the provisional data indicates that most of the recovery in the inflation rate has been driven by higher prices for unprocessed food. In 2014, the strong global harvest and the Russian trade ban had placed downwards pressure on food prices and they had shown an annual 1% rate of decline around the turn of the year. However, as the euro fell sharply in value during Q1, the cost of imported foodstuffs picked up significantly and unprocessed food prices were 2.1% higher year-on-year in May. The inflation rate has also edged up in non-energy industrial goods due to exchange rate movements; but at just 0.3%, it remained very low in May as producer prices for industrial goods were broadly flat, while relatively weak domestic demand continued to restrict the ability of firms to raise prices and increase their profit margins. Though still declining sharply – by 5% in May as lower oil prices continue to feed through supply chains - energy prices had been falling at an annual rate of 9% at the beginning of 2015 and so the slower rate of decline will also have had an impact on inflation. Services inflation edged up to 1.3% in May, but since it was not significantly different from its level throughout the past year and remained below the ECB target, it was indicative of weak demand. Indeed, the largest upward contribution to the April inflation rate came from cafes & restaurants; and prices were only 1.4% higher than 12 months before. Of the main markets for Scottish red meat exports, inflation rates during April were generally very low. In France, prices edged higher by 0.1% and there were increases of 0.3-0.5% in Belgium, Denmark, Germany and Sweden. However, Dutch prices were unchanged from a year earlier, while Italy, Spain and Switzerland remained in deflation, posting declines of 0.1%, 0.7% and 0.8%, respectively. Norway was the only exception – its inflation rate was at a more positive 1.8%.
9 HICP: Harmonised Index of Consumer Prices – allows international comparison of inflation rates within the EU
-1.0%
-0.5%
0.0%
0.5%
1.0%
1.5%
2.0%
2.5%
J F M A M J J A S O N D J F M A M J J A S O N D J F M A M
2013 2014 2015
Y/Y
Ch
an
ge
Euro Area Inflation Source: Eurostat
HICP Core
18
The weak inflationary trends across the EU reflect the legacy of subdued consumer demand in addition to lower energy and food prices. The low level of inflation is a real danger as inflation greases the wheels of an economy. Once inflation is low, it can be difficult to turn as it leads people to adjust their expectations, and this can reduce the pressure on wages while purchases may be delayed in anticipation of price cuts, risking a downward spiral. In addition, since inflation erodes the real value of debts, low inflation makes it harder for households and businesses to repay loans, placing further pressure on spending power. It also reduces the propensity to take on new borrowing to finance investment projects by reducing the potential return on investment. A similarly low rate of inflation across Europe also makes it harder for a rebalancing of economies to take place. Firstly, the subdued demand implied by low inflation makes it harder for the less-well performing economies such as Italy to recover through exporting to stronger economies like Germany. Secondly, low inflation makes it more difficult for weaker economies to generate an export-led recovery and improve their competitive position in the global market given that wages, and hence production costs, will be growing at a similar pace. Labour market:
Labour market in prominent Scottish red meat export destinations
Total Unemployment Rate Youth Unemployment Rate
April 2015 (%)
Labour Cost Index10
Q4 2014
(% Change y/y) April 2015 (%)
y/y change
(percentage points)
Bel 8.5 +0.1 22.2 0.7
Fra 10.5 +0.4 23.7 1.1
Ger 4.7 -0.3 7.2 1.5
Hol 7.0 -0.7 10.9 1.0
It 12.4 -0.1 40.9 -0.4
Spa 22.7 -2.2 49.6 0.3
Euro Area
11.1 -0.6 22.3 1.1
Den 6.3 -0.1 10.1 1.7
Swe 7.7 -0.3 21.2 2.9
UK 5.4 (Q1) -1.4 15.9 (Q1) 2.1
EU28 9.7 -0.6 20.7 1.5
Nor 4.1 (Mar 15) +0.8 9.2 (Mar 15) 3.0
Swi 4.4 (Q1) -0.4 7.5 (Q1) n/a
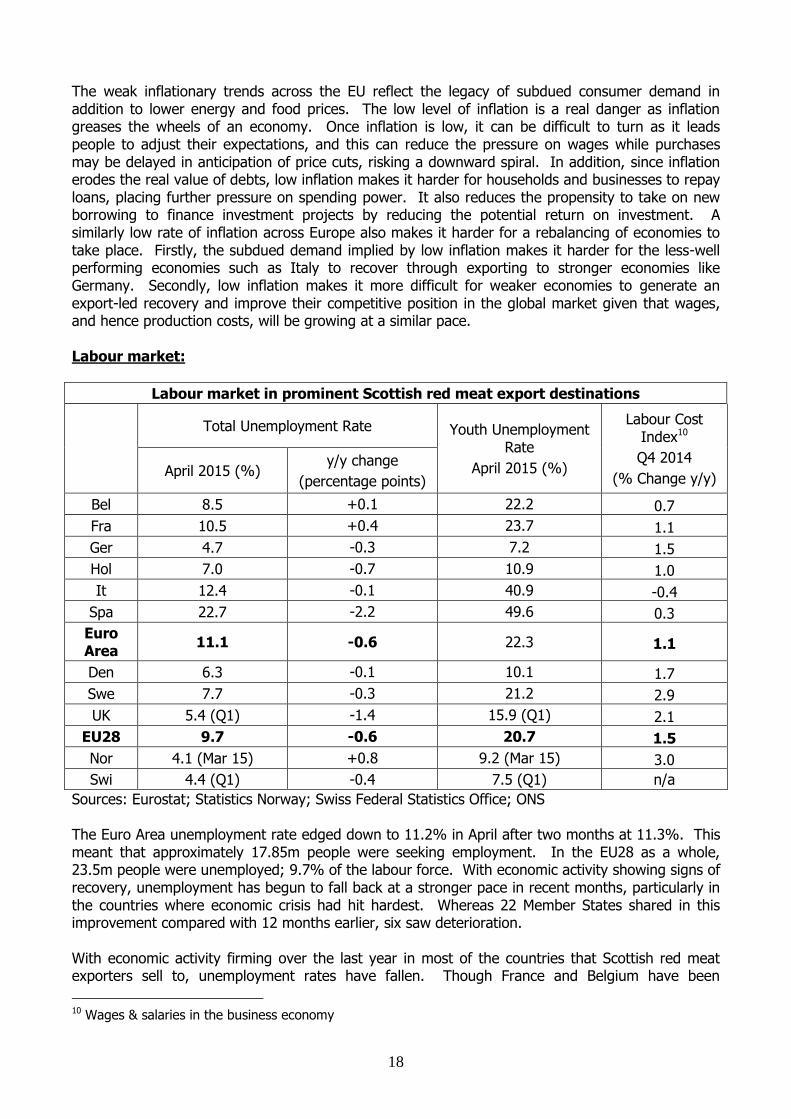
Sources: Eurostat; Statistics Norway; Swiss Federal Statistics Office; ONS The Euro Area unemployment rate edged down to 11.2% in April after two months at 11.3%. This meant that approximately 17.85m people were seeking employment. In the EU28 as a whole, 23.5m people were unemployed; 9.7% of the labour force. With economic activity showing signs of recovery, unemployment has begun to fall back at a stronger pace in recent months, particularly in the countries where economic crisis had hit hardest. Whereas 22 Member States shared in this improvement compared with 12 months earlier, six saw deterioration. With economic activity firming over the last year in most of the countries that Scottish red meat exporters sell to, unemployment rates have fallen. Though France and Belgium have been
10 Wages & salaries in the business economy

19
exceptions, unemployment rates have stabilised in in 2015. In Italy the situation has improved slightly, but the return to economic growth has yet to feed into any significant reduction in unemployment. On a more positive note, there has been a sharp improvement in Spain where unemployment fell by more than half a million in the year to April. Small improvements have been made in Sweden and Denmark, and Holland has continued to make progress after poor performance in 2012 and 2013. Though relatively small improvements have been made in Germany and Switzerland, given that they have come from already low unemployment rates, the progress has been impressive. By contrast, the situation in Norway has deteriorated. On a regional level, there is significant difference in unemployment rates within some of Scotland’s principal trade partners. During 2014, in France, unemployment was at its lowest (7-8%) in the north-west and centre-east, while in Germany, unemployment was extremely low (2-3%) in the south and low in an EU context in the industrial heartlands of the north-west. In Belgium, there was a notable split between Flanders in the north, where rates were around 5%, and the southern Wallonne region, where unemployment averaged nearly 12% in 2014. There was a similar pattern in Italy, where unemployment remained below the EU average in the northern industrial regions (8-9%), but was above 20% throughout much of the south. By contrast, Dutch and Swedish rates were more evenly spread, averaging 5-7% across most of the former, and 7-8.5% in the latter. In addition to the official Eurostat data, labour market trends can also be deducted from the monthly Euro Zone PMI surveys. The surveys carried out in recent months have made good reading. Following a long period of stagnation, the rate of employment growth has picked up strongly in both manufacturing and services as an improvement in order levels has resulted in backlogs building up, leading to increased staffing requirements. Hopefully, this points towards a self-fulfilling upwards cycle where the fall in unemployment generates increased consumer demand and this in turn keeps order books filled and employment levels higher. It is particularly positive that the French private sector has begun to hire workers, after a prolonged period of declines. Moving on to cover wages, the picture looks weaker on the continent than at home as annual increases were lower than in the UK in most of Scotland’s key trading partners. Sweden and Norway were notable exceptions. During Q4, the annual increase across the Euro Area dipped back for a second quarter to its lowest level since Q3 2013. This may reflect that lower inflationary outcomes and expectations across the EU had been factored into pay negotiations. Although this low level of nominal pay growth indicates higher real incomes and better living standards for citizens in employment, if the rate of pay growth has fallen due to the fall in inflation, it would pose problems for consumer demand if food and energy prices begin to show increases towards the end of this year. It would also make it harder for core inflation to return to target. This would be a worrying development, suggesting that the recent improvement in economic activity could run out of steam. In a currency union, relatively low and similar rates of pay growth also limit the ability of the weaker economies to improve competitiveness against the stronger ones. Summary The European economy has shown some promising signs at the beginning of 2015. Some of the economies worst affected by the 2008 crisis have continued to rebound well, and the large economies of France and Italy are now showing more optimistic signs. Indeed, Italy has exited from recession and the French economy grew strongly in Q1 having stalled for 18 months. However, the German economy continued to grow more slowly, and, following a prolonged period of weak economic activity, significant challenges remain. Inflation remains well below the ECBs target and though lower fuel and energy prices may have given a short-term boost to household finances and hence spending, low inflation continues to have a negative impact on expectations and debt burdens; and worryingly, potentially wages. Amidst this difficult economic environment, unemployment has been edging lower, but it remains elevated across much of the continent.

20
Consumer Trends:
Selected statistics - prominent Scottish red meat markets
Retail Sales
Volumes Apr 2014
(% change y/y)
Retail Sales Volumes – food,
beverages & tobacco Apr 2014
(% change y/y)
Consumer Sentiment (% balance)
May 2015 Nov 2014
Bel +0.1 +1.1 -3.1 -14.1
Fra +1.7 +0.6 -17.8 -22.6
Ger +3.7 +2.0 +3.0 -1.6
Hol +2.3 (Mar) +0.9 (Mar) +6.2 +2.8
It +1.8 (Mar) +0.9 (Mar) -8.9 -17.0
Spa +4.2 +1.9 +1.5 -11.8
Euro Area
+2.2 +1.1 -5.5 -11.6
Den +0.4 -0.2 +19.3 +16.7
Swe +2.1 -0.4 +10.2 +13.5
UK +3.3 -2.4 +1.1 +2.6
EU28 +2.6 +0.6 -4.0 -8.1
Nor +3.8 +2.6 +16.9 (Q1) +18.5 (Q3)
Swi -2.8 (Mar) -2.6 (Mar) +1 (April) -11 (October)
Sources: Eurostat; European Commission; Bloomberg; SECO The latest consumer data for the EU points to a small lift in demand. Indeed, after adjusting for inflation, household disposable income per person edged up by 0.1% during Q4 2014, but after stronger growth earlier in the year it was around 1.2% higher than a year earlier. This subdued rate of growth was underpinned by small increases in wages and social benefits. As governments tried to keep their budget deficits within the 3% maximum under the rules of the Stability and Growth Pact, a small increase in taxes placed some pressure on incomes. As a consequence of limited income growth in the Euro Area, real terms household spending also rose by 0.1% on the quarter and by around 1.2% on the year during Q4. With the increase in spending matching income gains, Eurostat figures showed little change in the Euro Area household savings rate. It edged up on the quarter and on the year to 12.9%, but remained close to historically low levels. Move forward six months and the picture looks more promising. The EU Commission’s monthly consumer confidence survey has shown an improvement across most Member States. Indeed, whereas in late 2014 six of Scotland’s main red meat export markets had a net negative balance, by May this had fallen to three; and there had been significant improvements in Belgium and Italy. In France, confidence was slightly better, but it remained firmly in negative territory. In April, retail sales volumes rose by 2.2% year-on-year across the Euro Area and by 2.6% in the EU. However, sales were more subdued in Denmark and Belgium and declined sharply in Switzerland. The overall increase was underpinned by both the rise in consumer sentiment plus falling prices. The strongest growth has been in non-food stores, where the annual increase has consistently been running at around 3%; though textiles, clothing & footwear have underperformed. Retail sales volumes in the food, beverages & tobacco category continued to grow slowly in April; though this may have been artificially low due to the earlier Easter. Markit’s monthly Eurozone Retail PMI surveys pointed to marked improvement in retail sales through the spring, and exceeded the 50 mark of no change for the first time in over a year in May.

21
What has been happening to economic policy in the EU? Monetary Policy: Due to the expected persistence of low inflation in the Euro Area, the ECB has loosened its monetary stance significantly over the past year. At both the June and September 2014 meetings of its Governing Council, the ECB lowered its 3 key interest rates. As a consequence, the deposit rate which the ECB pays banks on their holdings of reserves at the ECB has been in negative territory for a year; and at -0.2% since September. Meanwhile, the refinancing rate, at which banks can borrow from the ECB, has been lowered to just 0.05%11, and the marginal lending rate on overnight borrowing from the ECB is at 0.3%. In theory, interest rate cuts should help stimulate spending and investment, and in turn boost economic activity and move inflation back towards the targeted level of ‘below but close to 2%’. The lowering of the deposit rate below zero was significant as zero tends to be a lower bound on interest rates. However, the ECB felt able to take its deposit rate slightly below zero as the alternative for a financial institution of paying the ECB to hold its excess reserves would be to store the cash; a process that would be costly. As a consequence, banks will have to increase their lending if they want to avoid paying interest on their excess reserves. In addition to lowering interest rates, the ECB also announced that it would launch a new round of targeted long-term refinancing operations (TLTRO)12. These are 4-year loans to financial institutions at low interest rates with the aim of stimulating lending to non-financial private sector firms. The ECB announced that they would be offered to banks in September and December. In a further attempt at lowering borrowing costs, the ECB began purchasing asset-backed securities in October. However, the early signs of these ECB actions were mixed: the level of TLTRO funds accessed disappointed, but bank lending to households and non-financial companies did begin to show some improvement, having contracted consistently for two years. With the inflation rate falling below zero around the turn of the year, the ECB finally made the decision to begin a programme of asset purchases (QE). Ever since the economic crisis, the ECB had stopped short of buying government bonds from banks and investors due to concerns, particularly from Germany, that this would amount to the monetary financing of government borrowing. On January 22, the ECB announced that from March onwards, it would purchase €60bn (£44bn) worth of government bonds each month until at least September 2016. If inflation fails to return to the ECBs target range by September 2016, then it has committed to extending bond buying until this is the case. In addition, it announced that the interest rate charged on TLTRO funding would be cut by 0.1 percentage points. Promisingly, TLTRO take-up exceeded expectations in March and Euro Area money growth (M3) grew at an annual rate of nearly 5% in the three months to April. Over the past six months, a number of non-Euro Area European states have also loosened monetary policy. This has pushed interest rates deeper into negative territory in Denmark and Switzerland, and below zero for the first time in Sweden. In Norway, the main interest rate was cut to 1.5% back in December.
11 These rates were cut by the same degree to maintain the functioning of the money markets. The deposit rate acts as an interest rate floor as if other lenders paid a lower rate, excess reserves would be directed to
the higher rate offered by the ECB. Meanwhile, the refinancing rate acts as a ceiling as if a lender charged more, the borrower would be able to access cheaper funds from the ECB. Since market rates will be
somewhere in between the two, a smaller gap could impair the functioning of interbank lending. 12 The initial LTROs were introduced in the winter of 2011/12 and successfully helped to ease a build-up of financial pressures which were threatening the flow of credit in the Euro Area.
22
Fiscal Policy: While monetary policy has been loosened significantly by the ECB, the European Commission continues to place pressure on Member States to meet the government budget deficit constraints set out in the Stability and Growth Pact. This has committed Euro Area governments to run a maximum budget deficit of 3% of GDP, and 0.5% of GDP once the economic cycle has been adjusted for. Permanent losses of economic capacity and elevated levels of unemployment caused by a prolonged period of economic stagnation make these targets difficult to achieve for a number of countries. By placing pressure on funds available for investment in infrastructure - which should help increase the potential rate of future economic growth while stimulating spending in the short-term – and limiting public sector employment levels and wage increases at a time when the private sector is weak, these limits are a headwind to economic activity. By contrast, the UK government did not sign up to the budgetary pact in November 2011 and continues to run a large budget deficit. In its assessment of draft budgetary plans for the 2015/16 financial year, the Commission stated that fiscal consolidation came to an end in 2014/15 and is likely to remain neutral in 2015/16 as countries react to the low growth environment. However, it also states that a number of countries will have to take further measures to return their budget deficits within the agreed limit. Recent European Council recommendations on economic policy pointed to this context requiring greater coordination between Euro Area countries so that those with room to spend more on public investment do so, while those with high levels of debt and deficit continue to consolidate. This is an attempt at gaining a better overall balance within the Euro Area where the strongest economies make a greater effort to underpin overall demand. In theory, by improving the economic environment it would make consolidation easier and less economically damaging for the weaker economies. A further recommendation was for fiscal policy to be adjusted towards economic growth promotion with lower tax on labour incomes and greater investment. The EU Commission is expecting a slight 0.6% increase in government spending this year. This is higher than the 0.4% expansion expected last autumn – mainly due to Germany committing to a higher level of spending – but down slightly on the 0.7% increase in 2014. Due to the higher projected GDP growth rate, public investment is now forecast to be marginally lower as a share of Euro Area GDP than last year. Given the still weak economic environment in the Euro Area, a neutral fiscal stance overall is likely to reinforce the weak level of demand; and trade channels mean that weak demand in the Euro Area has a negative impact on global economic activity. Tax reform is likely to be a longer-term project. However, it should be noted that in conjunction with the neutral fiscal stance, the new President of the EU Commission, Jean-Claude Juncker, has announced a large-scale investment fund for Europe. It is to work by pledging money from the EU budget and the European Investment Bank, adding in private sector funds and then lending it out for investment projects. Summary After interest rate cuts in 2014, the ECB has loosened its monetary stance further in 2015 in reaction to the persistence of low inflation and inflationary expectations. Interest rates on its cheap financing programme have been cut further while a QE programme commenced in March; both in an attempt to stimulate spending and investment. However, despite weak demand, the fiscal stance has remained neutral and continues to place pressure on the European and global economies. The EU Commission has announced a plan to stimulate investment and has recommended that Euro Area members with room to increase public investment do so.
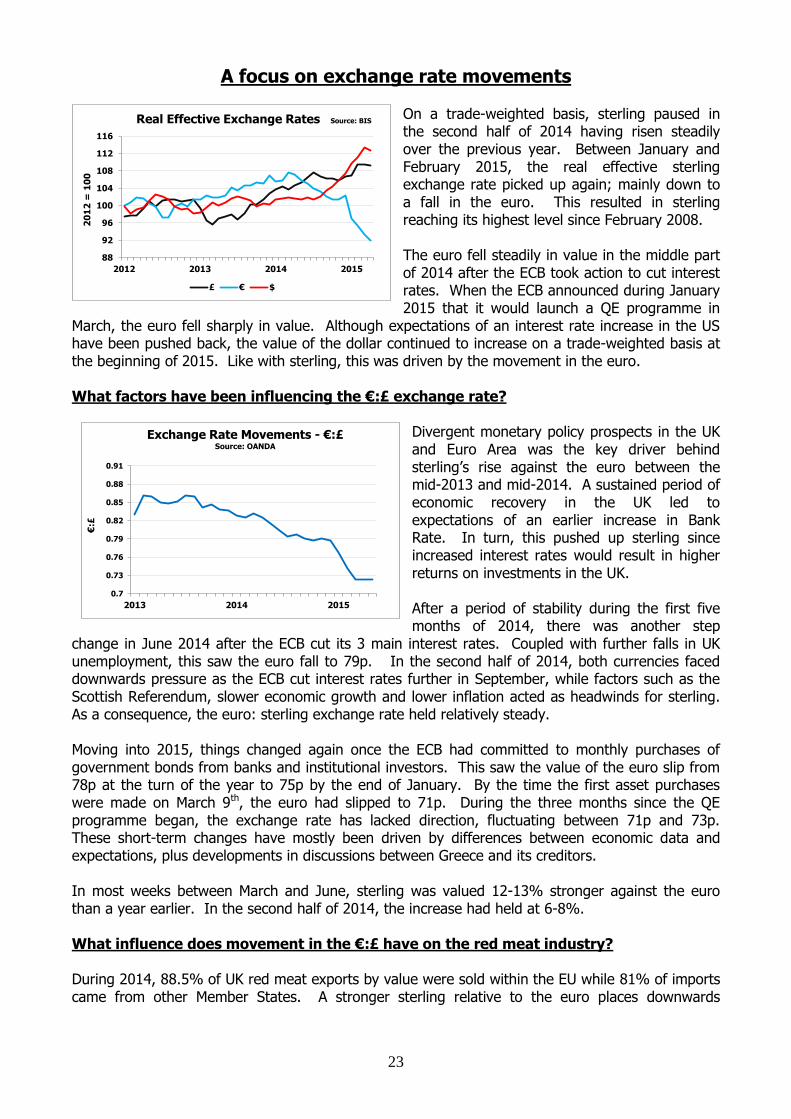
23
A focus on exchange rate movements
On a trade-weighted basis, sterling paused in the second half of 2014 having risen steadily over the previous year. Between January and February 2015, the real effective sterling exchange rate picked up again; mainly down to a fall in the euro. This resulted in sterling reaching its highest level since February 2008. The euro fell steadily in value in the middle part of 2014 after the ECB took action to cut interest rates. When the ECB announced during January 2015 that it would launch a QE programme in
March, the euro fell sharply in value. Although expectations of an interest rate increase in the US have been pushed back, the value of the dollar continued to increase on a trade-weighted basis at the beginning of 2015. Like with sterling, this was driven by the movement in the euro. What factors have been influencing the €:£ exchange rate?
Divergent monetary policy prospects in the UK and Euro Area was the key driver behind sterling’s rise against the euro between the mid-2013 and mid-2014. A sustained period of economic recovery in the UK led to expectations of an earlier increase in Bank Rate. In turn, this pushed up sterling since increased interest rates would result in higher returns on investments in the UK. After a period of stability during the first five months of 2014, there was another step
change in June 2014 after the ECB cut its 3 main interest rates. Coupled with further falls in UK unemployment, this saw the euro fall to 79p. In the second half of 2014, both currencies faced downwards pressure as the ECB cut interest rates further in September, while factors such as the Scottish Referendum, slower economic growth and lower inflation acted as headwinds for sterling. As a consequence, the euro: sterling exchange rate held relatively steady. Moving into 2015, things changed again once the ECB had committed to monthly purchases of government bonds from banks and institutional investors. This saw the value of the euro slip from 78p at the turn of the year to 75p by the end of January. By the time the first asset purchases were made on March 9th, the euro had slipped to 71p. During the three months since the QE programme began, the exchange rate has lacked direction, fluctuating between 71p and 73p. These short-term changes have mostly been driven by differences between economic data and expectations, plus developments in discussions between Greece and its creditors. In most weeks between March and June, sterling was valued 12-13% stronger against the euro than a year earlier. In the second half of 2014, the increase had held at 6-8%. What influence does movement in the €:£ have on the red meat industry? During 2014, 88.5% of UK red meat exports by value were sold within the EU while 81% of imports came from other Member States. A stronger sterling relative to the euro places downwards
0.7
0.73
0.76
0.79
0.82
0.85
0.88
0.91
2013 2014 2015
€:£
Exchange Rate Movements - €:£ Source: OANDA
88
92
96
100
104
108
112
116
2012 2013 2014 2015
20
12
= 1
00
Real Effective Exchange Rates Source: BIS
£ € $
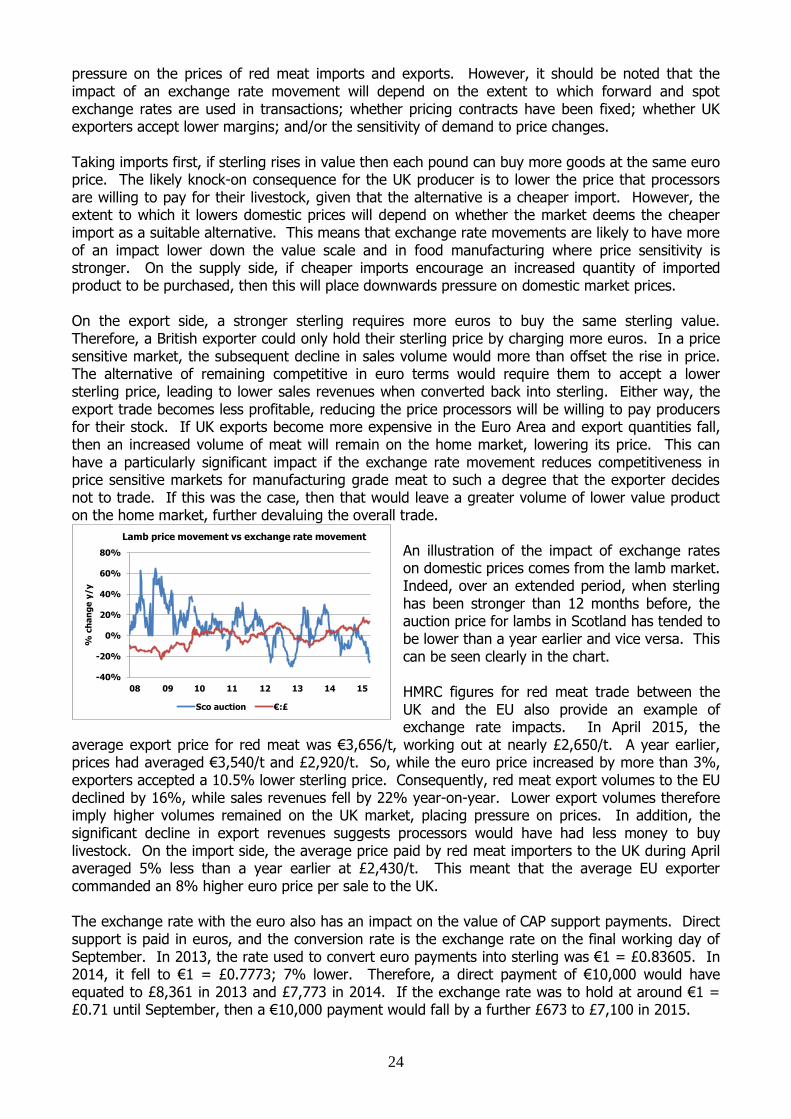
24
pressure on the prices of red meat imports and exports. However, it should be noted that the impact of an exchange rate movement will depend on the extent to which forward and spot exchange rates are used in transactions; whether pricing contracts have been fixed; whether UK exporters accept lower margins; and/or the sensitivity of demand to price changes. Taking imports first, if sterling rises in value then each pound can buy more goods at the same euro price. The likely knock-on consequence for the UK producer is to lower the price that processors are willing to pay for their livestock, given that the alternative is a cheaper import. However, the extent to which it lowers domestic prices will depend on whether the market deems the cheaper import as a suitable alternative. This means that exchange rate movements are likely to have more of an impact lower down the value scale and in food manufacturing where price sensitivity is stronger. On the supply side, if cheaper imports encourage an increased quantity of imported product to be purchased, then this will place downwards pressure on domestic market prices. On the export side, a stronger sterling requires more euros to buy the same sterling value. Therefore, a British exporter could only hold their sterling price by charging more euros. In a price sensitive market, the subsequent decline in sales volume would more than offset the rise in price. The alternative of remaining competitive in euro terms would require them to accept a lower sterling price, leading to lower sales revenues when converted back into sterling. Either way, the export trade becomes less profitable, reducing the price processors will be willing to pay producers for their stock. If UK exports become more expensive in the Euro Area and export quantities fall, then an increased volume of meat will remain on the home market, lowering its price. This can have a particularly significant impact if the exchange rate movement reduces competitiveness in price sensitive markets for manufacturing grade meat to such a degree that the exporter decides not to trade. If this was the case, then that would leave a greater volume of lower value product on the home market, further devaluing the overall trade.
An illustration of the impact of exchange rates on domestic prices comes from the lamb market. Indeed, over an extended period, when sterling has been stronger than 12 months before, the auction price for lambs in Scotland has tended to be lower than a year earlier and vice versa. This can be seen clearly in the chart. HMRC figures for red meat trade between the UK and the EU also provide an example of exchange rate impacts. In April 2015, the
average export price for red meat was €3,656/t, working out at nearly £2,650/t. A year earlier, prices had averaged €3,540/t and £2,920/t. So, while the euro price increased by more than 3%, exporters accepted a 10.5% lower sterling price. Consequently, red meat export volumes to the EU declined by 16%, while sales revenues fell by 22% year-on-year. Lower export volumes therefore imply higher volumes remained on the UK market, placing pressure on prices. In addition, the significant decline in export revenues suggests processors would have had less money to buy livestock. On the import side, the average price paid by red meat importers to the UK during April averaged 5% less than a year earlier at £2,430/t. This meant that the average EU exporter commanded an 8% higher euro price per sale to the UK. The exchange rate with the euro also has an impact on the value of CAP support payments. Direct support is paid in euros, and the conversion rate is the exchange rate on the final working day of September. In 2013, the rate used to convert euro payments into sterling was €1 = £0.83605. In 2014, it fell to €1 = £0.7773; 7% lower. Therefore, a direct payment of €10,000 would have equated to £8,361 in 2013 and £7,773 in 2014. If the exchange rate was to hold at around €1 = £0.71 until September, then a €10,000 payment would fall by a further £673 to £7,100 in 2015.
-40%
-20%
0%
20%
40%
60%
80%
% c
ha
ng
e y
/y
Lamb price movement vs exchange rate movement
Sco auction €:£

25
What has been happening to the $:£ exchange rate and why does it matter?
Over the past couple of years the main driver of exchange rate movements between sterling and the US dollar have been the prospects for monetary policy changes on both sides of the Atlantic. As the first UK interest rate increase moved closer, sterling rose steadily against the dollar until last summer. However, since UK economic data has pointed to a delay in this increase, the dollar has moved higher again, mostly trading at between 65p and 67p in 2015. Exchange rate movements against the dollar
have implications for the cost of energy and imported raw materials. Commodities such as wheat and soybeans, that are imported for animal feed, and oil, which affects fuel, energy and fertiliser costs, generally have their price quoted in dollars. The stronger the dollar, the more expensive they are in sterling terms and the higher the cost of production is for UK businesses. In recent months, this has slowed the pace of decline in the cost of imported commodities. For example, in early June, soyameal futures in Chicago were priced around 38% lower than at the same time last year in dollars, but 32% lower in sterling. What has been happening to the NZ$:£ exchange rate and why does it matter?
With around 70% of UK lamb imports coming from New Zealand, the value of the pound against the New Zealand dollar (NZD) is important in determining import volumes and prices. Having risen strongly after the global financial crisis of 2008, the NZD has been on a weaker trend since the beginning of 2013. Although interest rate increases in H1 2014 saw the NZD briefly rise against sterling, this dissipated after further rate increases failed to materialise. Further downwards pressure followed an intervention in the currency market
by the Reserve Bank of New Zealand (RBNZ), which sold NZD out of its reserves in an attempt at stimulating the country’s export industries. Moving into 2015, after fluctuating around during Q1, the NZD has weakened significantly in Q2. The main driver has been the fall in global dairy prices which have had a considerable impact on one of NZ’s largest export industries. With less money coming into the country to buy milk and related products, the currency has fallen in value. In addition, one of the reasons behind the RBNZs decision to cut interest rates in June was the potential impact of sharply lower cash flows in the dairy sector on the sustainability of borrowing. The reduction in the Official Cash Rate was also linked to falling inflation and an attempt at supporting exporters. With the NZD trading around 15% weaker against sterling in June than a year earlier, this has helped support the country’s exporters of lamb to the UK. Indeed, this means that they could lower their sterling export price by around 15% without having to accept a lower price in NZD.
0.56
0.58
0.6
0.62
0.64
0.66
0.68
2013 2014 2015
$:£
Exchange Rate Movements - $:£Source: OANDA
0.46
0.48
0.5
0.52
0.54
0.56
0.58
2013 2014 2015
NZ
D:£
Exchange Rate Movements - NZD:£Source: OANDA

26
Economic Outlook
UK
General Economic Climate: The UK economic outlook continues to look positive. Although the pace of expansion appears to have slowed somewhat, it remains around its long-term average and business confidence has held firm. As a consequence, investment has held up and rising orders have required increased staffing levels. With the cost of many essential items lower than last year while pay growth has at long last picked up, the expansion in consumer spending has been sustained. The self-fulfilling nature of the economic upturn is likely to support a prolonged period of economic growth.
However, some downside risks do remain. At home, consumer spending growth could be tempered if a fiscal tightening is anticipated. Looking abroad, although the recovery of demand in the Euro Area is promising, the strength of sterling has generated significant headwinds for exporters to the eurozone. Furthermore, PMI figures point to a slowdown in the main emerging economies and both the World Bank and IMF expect slower economic growth in developing countries in 2015/16. They have also warned that the likely US interest rates increase could have consequences for financial stability as capital returns to the US. These trends point to subdued UK export demand and consequently, the UK economic expansion is likely to remain highly reliant on domestic demand. Economic Activity: The UK economy is expected to continue growing strongly due to domestic spending, both from consumers, as real wages pick up, and business investment. The BoE expects quarterly GDP growth to return to its historical average of around 0.6% and for this pace to be sustained in 2016. Inflation: The BoE is expecting the CPI rate of inflation to remain around zero in the coming months. Thereafter, it is expected to gradually pick up as last year’s falls in food and energy prices drop out of the annual comparison. By the year-end, CPI is projected to be slightly over 1%, with a more gradual rise through 2016 taking it closer to the 2% target in late 2016.
Labour Market: The BoE projects that the UK unemployment rate will fall to 5.25% by the year-end. Participation in the labour market is expected to stabilise and average hours worked are anticipated to rise a touch. Earnings growth is expected to reach 2.75% by Q3 2015. Monetary Policy: Financial markets are expecting the BoE to raise Bank Rate to 0.75% in Q1 2016. When Bank Rate does begin to increase, the BoE has communicated that it will rise slowly and to a ceiling of around 2.5%; well below its historical average of around 5%. Financial markets expect it to be at 1.5% in three years’ time.
44
46
48
50
52
54
56
58
60
J F M A M J J A S O N D J F M A M J J A S O N D J F M A M
2013 2014 2015Dif
fusio
n I
nd
ex
(5
0 =
no
ch
an
ge
)
Manufacturing PMI Source: Markit
US China Russia Brazil
50
51
52
53
54
55
56
57
J F M A M J J A S O N D J F M A M J J A S O N D J F M A M
2013 2014 2015
Dif
fusio
n I
nd
ex
(5
0 =
no
ch
an
ge
)
JP Morgan Global Composite PMI Source: Markit
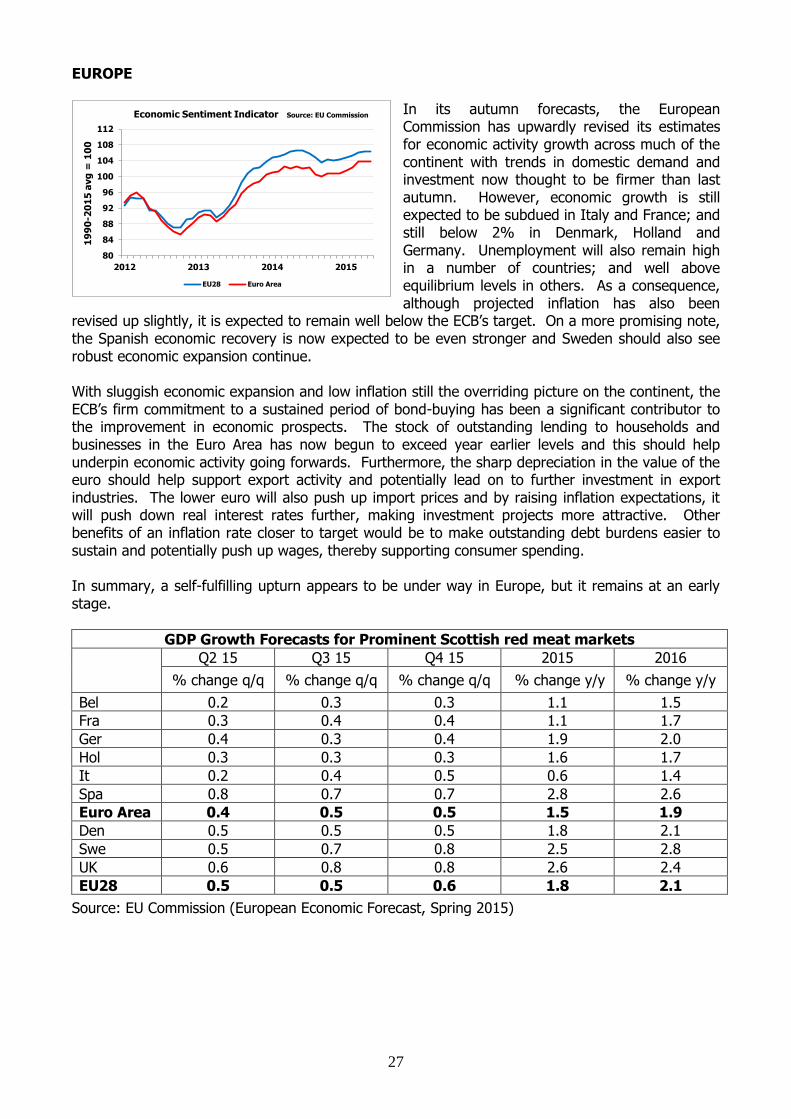
27
EUROPE
In its autumn forecasts, the European Commission has upwardly revised its estimates for economic activity growth across much of the continent with trends in domestic demand and investment now thought to be firmer than last autumn. However, economic growth is still expected to be subdued in Italy and France; and still below 2% in Denmark, Holland and Germany. Unemployment will also remain high in a number of countries; and well above equilibrium levels in others. As a consequence, although projected inflation has also been
revised up slightly, it is expected to remain well below the ECB’s target. On a more promising note, the Spanish economic recovery is now expected to be even stronger and Sweden should also see robust economic expansion continue. With sluggish economic expansion and low inflation still the overriding picture on the continent, the ECB’s firm commitment to a sustained period of bond-buying has been a significant contributor to the improvement in economic prospects. The stock of outstanding lending to households and businesses in the Euro Area has now begun to exceed year earlier levels and this should help underpin economic activity going forwards. Furthermore, the sharp depreciation in the value of the euro should help support export activity and potentially lead on to further investment in export industries. The lower euro will also push up import prices and by raising inflation expectations, it will push down real interest rates further, making investment projects more attractive. Other benefits of an inflation rate closer to target would be to make outstanding debt burdens easier to sustain and potentially push up wages, thereby supporting consumer spending. In summary, a self-fulfilling upturn appears to be under way in Europe, but it remains at an early stage.
GDP Growth Forecasts for Prominent Scottish red meat markets
Q2 15 Q3 15 Q4 15 2015 2016
% change q/q % change q/q % change q/q % change y/y % change y/y
Bel 0.2 0.3 0.3 1.1 1.5
Fra 0.3 0.4 0.4 1.1 1.7
Ger 0.4 0.3 0.4 1.9 2.0
Hol 0.3 0.3 0.3 1.6 1.7
It 0.2 0.4 0.5 0.6 1.4
Spa 0.8 0.7 0.7 2.8 2.6
Euro Area 0.4 0.5 0.5 1.5 1.9
Den 0.5 0.5 0.5 1.8 2.1
Swe 0.5 0.7 0.8 2.5 2.8
UK 0.6 0.8 0.8 2.6 2.4
EU28 0.5 0.5 0.6 1.8 2.1
Source: EU Commission (European Economic Forecast, Spring 2015)
80
84
88
92
96
100
104
108
112
2012 2013 2014 2015
19
90
-20
15
avg
= 1
00
Economic Sentiment Indicator Source: EU Commission
EU28 Euro Area
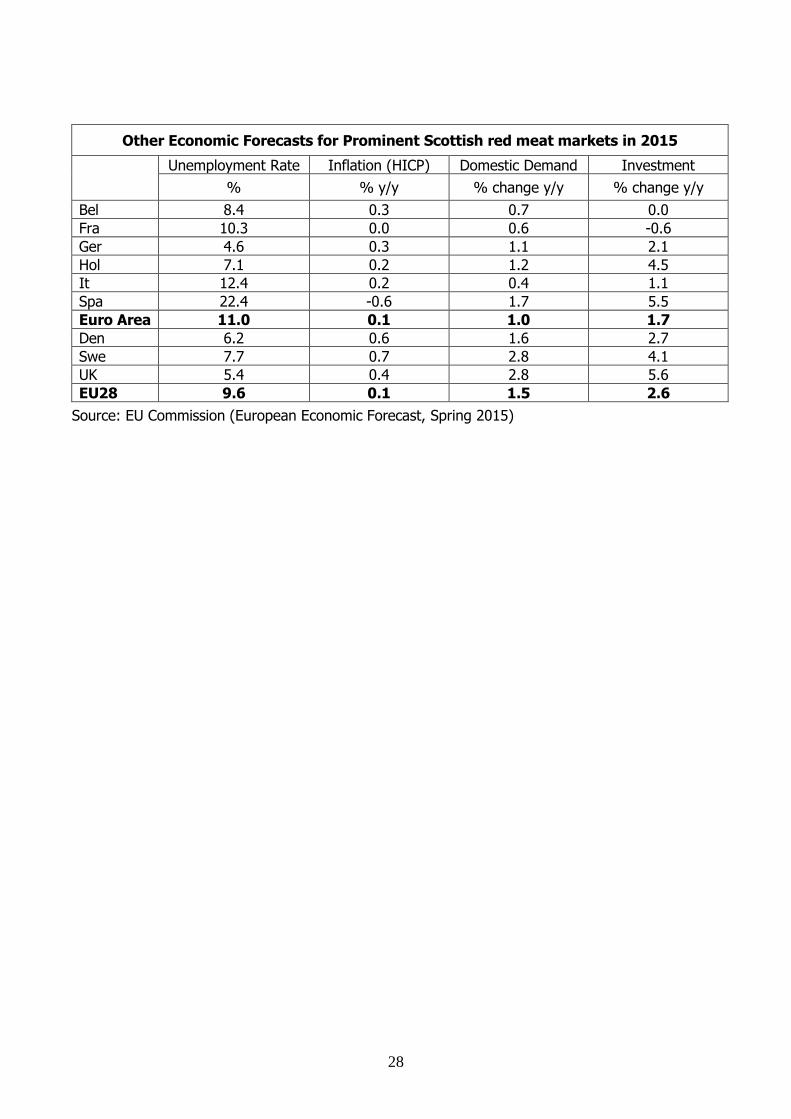
28
Other Economic Forecasts for Prominent Scottish red meat markets in 2015
Unemployment Rate Inflation (HICP) Domestic Demand Investment
% % y/y % change y/y % change y/y
Bel 8.4 0.3 0.7 0.0
Fra 10.3 0.0 0.6 -0.6
Ger 4.6 0.3 1.1 2.1
Hol 7.1 0.2 1.2 4.5
It 12.4 0.2 0.4 1.1
Spa 22.4 -0.6 1.7 5.5
Euro Area 11.0 0.1 1.0 1.7
Den 6.2 0.6 1.6 2.7
Swe 7.7 0.7 2.8 4.1
UK 5.4 0.4 2.8 5.6
EU28 9.6 0.1 1.5 2.6
Source: EU Commission (European Economic Forecast, Spring 2015)

29
Exchange Rate Movements €:£ In the coming months, the most likely scenario is for sterling to continue fluctuating around current levels of around 71-73p. This is based on an expectation that monetary policy will not change in either the Euro Area or the UK, as the ECB monitors the impacts of its QE programme and the BoE waits for wage growth to accelerate and inflation to return closer to target. Potential risks to this scenario would include a Greek exit from the Euro Zone. If this was to occur then it would seem likely that the value of the euro would fall further due to the significant uncertainty it would cause for investors. On the other hand, if a resolution to the Greek debt crisis occurs, then it would potentially support the value of the euro. Other potential drivers of exchange rate movements would be a change in expectations of tighter UK monetary policy, possibly if inflation picks up faster than currently anticipated and this causes MPC members to begin voting for an interest rate increase. By contrast, if economic activity in the UK was to show further signs of slowing, then by pushing back expectations of higher interest rates it could cause sterling to fall in value. In the longer-term, the BoE is almost certain to begin normalising interest rates before the ECB, indicating an upside bias for sterling. Current expectations are for the first interest rate increase to now take place in early 2016; though expectations have consistently been pushed back over the past year. At current exchange rates, imports look attractive while exporting has proved very difficult, so any further appreciation in value of sterling would be a worrying development for the Scottish red meat industry. For the producer, it suggests that the prices paid for their stock at the farm gate will continue to come under pressure. For the exporter, it indicates that there will be few profitable trading opportunities in markets for manufacturing grade red meat at current prices. In turn, this suggests that exports are going to become limited to low volume but higher value cuts. $:£ In the coming months, sterling is expected to edge lower against the USD as interests rates are forecast to rise in the US before they do in the UK. As a consequence, if the prices of imported commodities decline, then they will fall more slowly in sterling terms; if dollar prices increase then they will increase faster in sterling. One risk to this base case is if the slowdown in activity growth in the US indicated by the most recent PMI figures continues. In addition, if the stronger USD and lower oil prices begin to impact more widely on prices throughout the US economy then this may also reduce the pressure on the Federal Reserve to raise US interest rates, placing downwards pressure on the dollar. NZ$:£
The RBNZ is expecting to lower its Official Cash Rate by a further 0.25% at some point over the next year with a number of currency strategists expecting this to occur in the next quarter. As a consequence, it seems likely that the recent downswing in NZD against sterling has further to go. A stronger sterling against the NZD may stimulate import demand for New Zealand lamb by making it easier for NZ exporters to price more competitively in the UK market. It may also have further implications for UK export competitiveness in the Eurozone.

30
What has been happening in the red meat sector?
Food Price Inflation: ONS RPI data for April continued to show food price deflation with prices averaging 2.6% lower than in April 2014. This was the tenth consecutive month to show lower prices than a year earlier. However, the pace of decline slowed slightly from the 2.8% recorded during February and March. Looking at meat prices, pork, bacon, poultry and other meat were all priced significantly below April 2014 levels. However, despite slipping to a six month low, beef prices were fractionally higher on the year. Meanwhile, both home killed and imported lamb were more expensive to buy than a year earlier. The earlier timing of Easter may have had an impact as some pre-Easter discounting will have been brought forward into March this year.
Prices for competing proteins have generally trended lower since early 2014, making it difficult for red meat to gain market share. Cheese prices, which have followed a similar trend to fish, fell at an annual rate of 2.8%. Declining global milk prices suggest that there will be further downwards pressure to come for cheese. Eggs and poultry have seen more significant downturns over the past 18 months. As a consequence, their prices averaged 8.5% and 6.1% below year earlier levels, respectively.
Beef:
On average, UK retail beef prices were up by 0.3% year-on-year in April. As can be seen in the chart, retail prices have been trending relatively flat since September 2013. Retailers like to smooth beef prices to the consumer as much as they can. Lower farmgate prices have allowed the retailers to stabilise their prices and regain the margin lost in late 2012/early 2013 when producer prices were rising at a much faster pace than could be passed on to the retail beef market. With producer prices remaining lower than 12 months ago, there is scope for beef retail prices
to remain on the current trend for a prolonged period. Historically, beef retail prices have shown notably less fluctuation than for other meats. AHDB provides a monthly estimate of the GB producer share of the retail price. Its method breaks down an average carcase into its different retail components. In May, the producer price averaged 47% of the average retail price. This was down by 0.7 percentage points when compared to May 2014 and by 12 percentage points from two years earlier. Nevertheless, it was still above the annual averages for 2002-5 and 2007.
88
91
94
97
100
103
106
109
J F M A M J J A S O N D J F M A M J J A S O N D J F M A
2013 2014 2015
20
13
RP
I =
10
0
Retail prices of competitor proteins Source: ONS
Poultry Fish Cheese Eggs
80
85
90
95
100
105
110
J F M A M J J A S O N D J F M A M J J A S O N D J F M A
2013 2014 2015
20
13
= 1
00
Beef Prices: Retail Vs Producer Source: ONS; AHDB
GB Beef Retail Price GB Beef Producer Price

31
Lamb:
The average retail price for home-killed lamb was 4.6% higher than a year earlier in April. Prior to April, prices had been broadly flat since 2012, so the bounce during April 2015 may reflect less use of promotional offers at Easter. However, it should be noted that in February the ONS adjusted their retail prices basket, replacing loin roasting joints with loin chops/steaks and this may have had some influence on the average retail price. Although at times farmgate prices have shown significant differences to year earlier levels, they have been on a broadly level
trend in recent years. This overall trend has allowed retailers to smooth consumer prices. However, with producer prices falling sharply lower than a year earlier at the beginning of the 2015/16 season, there may be some scope for lamb retail prices to ease in attempt at boosting consumption. According to AHDB, the producer share of the average lamb retail price in May 2015 was 50.5%. This was 8 percentage points lower than in May 2014. It should be noted that AHDB’s estimate of the average retail price for lamb was 7% lower than 12 months before. There estimate for April was nearly 4% lower than in 2014. Due to the change in composition of the ONS index for lamb retail prices, this AHDB estimate may be a more accurate reflection of the current retail market. Pork:
The RPI for pork was 3.7% lower on the year during April. Prices have shown less month-to-month volatility this year, indicating a smaller degree of promotional activity. Since retail consumption data has suggested falling demand for pork, the retail price has held up more than might have been expected, trending only slightly lower. Although the decline in producer prices relative to last year may have begun to pass through the supply chain, it appears that retailers are continuing to repair margins after a difficult 2012 and 2013 when there had been a
significant run-up in the producer price. Nevertheless, with farmgate prices stabilising at around 20% lower than last year through the spring and into summer, there is some room for retailers to lower prices to try and gain market share. Bacon: Since bacon goes through a higher degree of processing than pork, its retail price will be less reflective of the price a processor pays for the raw material. The bacon RPI was down 3% year-on-year in April. After a step-change lower at the beginning of 2015, retail prices were relatively stable during the first four months of the year.
70
80
90
100
110
120
130
140
J F M A M J J A S O N D J F M A M J J A S O N D J F M A
2013 2014 2015
20
13
= 1
00
Lamb Prices: Retail Vs Producer Source: ONS; AHDB
GB Lamb Retail Price GB Lamb Producer Price
75
80
85
90
95
100
105
110
J F M A M J J A S O N D J F M A M J J A S O N D J F M A
2013 2014 2015
20
13
= 1
00
Pork Prices: Retail Vs Producer Source: ONS; AHDB
GB Pork Retail Price GB Pork Producer Price
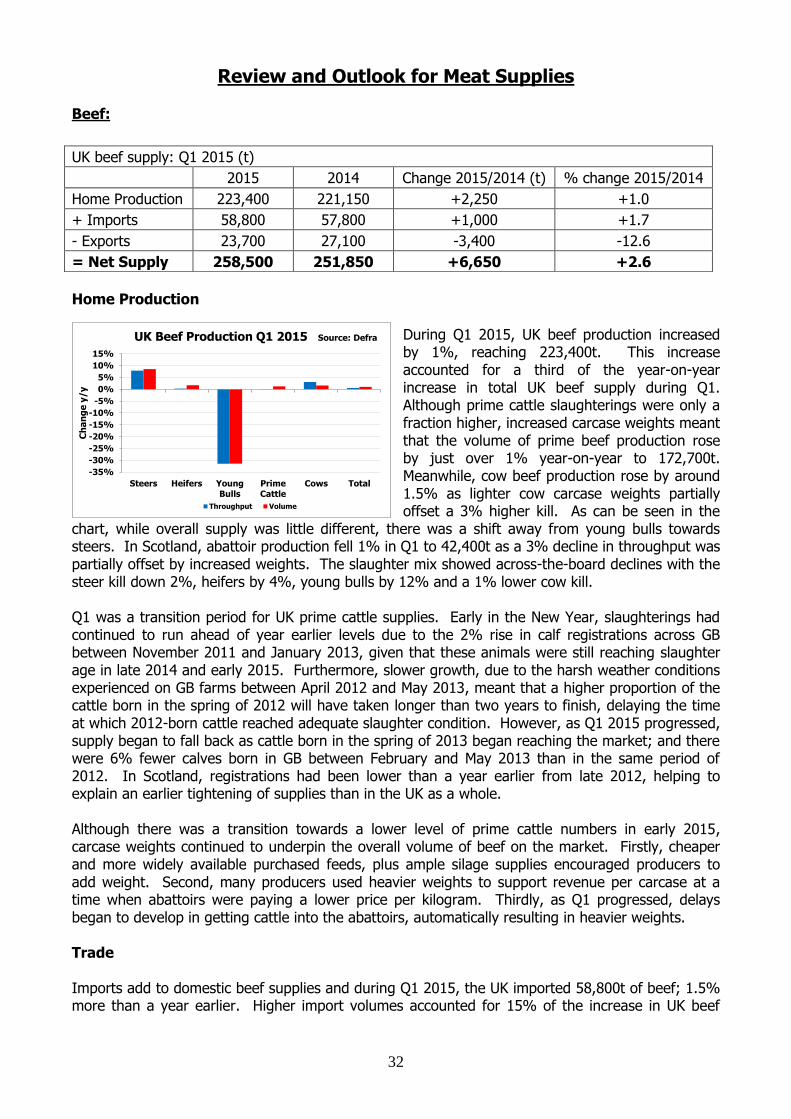
32
Review and Outlook for Meat Supplies
Beef:
Home Production
During Q1 2015, UK beef production increased by 1%, reaching 223,400t. This increase accounted for a third of the year-on-year increase in total UK beef supply during Q1. Although prime cattle slaughterings were only a fraction higher, increased carcase weights meant that the volume of prime beef production rose by just over 1% year-on-year to 172,700t. Meanwhile, cow beef production rose by around 1.5% as lighter cow carcase weights partially offset a 3% higher kill. As can be seen in the
chart, while overall supply was little different, there was a shift away from young bulls towards steers. In Scotland, abattoir production fell 1% in Q1 to 42,400t as a 3% decline in throughput was partially offset by increased weights. The slaughter mix showed across-the-board declines with the steer kill down 2%, heifers by 4%, young bulls by 12% and a 1% lower cow kill. Q1 was a transition period for UK prime cattle supplies. Early in the New Year, slaughterings had continued to run ahead of year earlier levels due to the 2% rise in calf registrations across GB between November 2011 and January 2013, given that these animals were still reaching slaughter age in late 2014 and early 2015. Furthermore, slower growth, due to the harsh weather conditions experienced on GB farms between April 2012 and May 2013, meant that a higher proportion of the cattle born in the spring of 2012 will have taken longer than two years to finish, delaying the time at which 2012-born cattle reached adequate slaughter condition. However, as Q1 2015 progressed, supply began to fall back as cattle born in the spring of 2013 began reaching the market; and there were 6% fewer calves born in GB between February and May 2013 than in the same period of 2012. In Scotland, registrations had been lower than a year earlier from late 2012, helping to explain an earlier tightening of supplies than in the UK as a whole. Although there was a transition towards a lower level of prime cattle numbers in early 2015, carcase weights continued to underpin the overall volume of beef on the market. Firstly, cheaper and more widely available purchased feeds, plus ample silage supplies encouraged producers to add weight. Second, many producers used heavier weights to support revenue per carcase at a time when abattoirs were paying a lower price per kilogram. Thirdly, as Q1 progressed, delays began to develop in getting cattle into the abattoirs, automatically resulting in heavier weights. Trade Imports add to domestic beef supplies and during Q1 2015, the UK imported 58,800t of beef; 1.5% more than a year earlier. Higher import volumes accounted for 15% of the increase in UK beef
UK beef supply: Q1 2015 (t)
2015 2014 Change 2015/2014 (t) % change 2015/2014
Home Production 223,400 221,150 +2,250 +1.0
+ Imports 58,800 57,800 +1,000 +1.7
- Exports 23,700 27,100 -3,400 -12.6
= Net Supply 258,500 251,850 +6,650 +2.6
-35%
-30%
-25%
-20%
-15%
-10%
-5%
0%
5%
10%
15%
Steers Heifers YoungBulls
PrimeCattle
Cows Total
Ch
an
ge
y/y
UK Beef Production Q1 2015 Source: Defra
Throughput Volume

33
supply during Q1. However, the pace of import growth slowed significantly during Q1. Indeed, in Q4 2014, 7% more beef had been imported to the UK than 12 months before. The slowdown was largely down to a transitional period for supply in Ireland, the UK’s principal supplier. Deliveries remained slightly higher in January and February before falling back in March. As a result, Ireland supplied slightly more beef to the UK than a year earlier during Q1, but this worked out at 71.5% of the UK’s beef imports; down by one percentage point from Q1 2014. Other European suppliers to grow sales to the UK included Holland, Poland and Spain; though imports from France and Germany decreased. Meanwhile, quarterly imports from outside of the EU were down by 2% at 5,150t. Exports deduct beef supplies from the UK market. Despite higher levels of both domestic production and imports, export volumes fell sharply at the beginning of 2015. This decline - of nearly 13% - accounted for more than half of the total increase in UK beef supplies in Q1. With a stronger sterling against the euro and a well-supplied European manufacturing grade beef market, UK traders struggled to compete in price sensitive markets. This meant that exports shifted towards higher value products. Outlook
Looking forward into H2 2015, it seems likely that domestic prime cattle supply is going to run behind 2014 levels. Indeed, at the beginning of April, the GB cattle population showed declines for the 12-18, 18-24 and 24-30 month age groups. This has been influenced by lower calf registrations through most of 2013 and into Q1 2014. However, the extent to which overall beef production tightens will depend on the evolution of carcase weights. With producer prices beginning to edge higher and communication from the processing sector that overweight cattle will face pricing penalties, there is likely to be less of an incentive to add weight. It is therefore possible that carcase weights might begin to ease back, reinforcing the tightening of supplies.
On the trade side, Ireland’s December 2014 census pointed to tight supplies with 6% fewer male cattle aged between 1 and 2 years of age and a 2% decline in male cattle less than a year old. This is likely to place some downwards pressure on imports to the UK. Meanwhile, on the export side, sterling is expected to remain strong and domestic supply is likely to remain tight, indicating lower exports than last year; particularly as exports had risen strongly in H2 2014. If we look at potential supplies in volume terms then it seems likely that domestic production and imports are likely to fall back in the second half of 2015. However, a reduction in exports will be an offsetting factor, limiting the potential decline in total supplies reaching the UK market.
GB cattle population: April 2015 Source: BCMS
Still alive Apr 2014 Still alive Apr 2015 y/y Change
Calves registered: head %
<6 months ago 1,028,715 1,099,961 +71,246 +6.9
6-12 months ago 1,337,908 1,362,778 +24,870 +1.9
12-18 months ago 925,850 904,706 -21,144 -2.3
18-24 months ago 990,971 967,500 -23,471 -2.4
24 to 30 months ago 574,835 530,646 -44,189 -7.7
30 to 36 months ago 407,369 401,081 -6,288 -1.5
Total pool 5,265,648 5,266,672 +1,024 +0.0

34
Sheepmeat:
Home Production During Q1 2015, UK abattoirs killed nearly 3m hoggs; 10% more than a year earlier. In addition, ample silage availability coupled with a relatively benign winter supported carcase weights and this pushed prime lamb production volumes up by 12% year-on-year. However, the overall increase in sheepmeat production was limited to 5% because the ewe kill was down by more than a fifth, resulting in a 23% decline in mutton production. Higher home production accounted for a third of the increase in UK sheepmeat supplies in Q1 2015. The main driver of the increased production levels at the beginning of 2015 was the increased 2014 lamb crop – up 5% in Scotland and by 6.5% in England. This had been supported by a much improved winter of 2013/14 after the significant challenges of 2012/13 which led to better ewe condition at mating and with lower mortality rates, productivity recovered. Indeed the June census reported a jump in the lambing percentage from 119% to 125.5% in Scotland and from 124.5% to 131% in England. The consequence of more lambs on the ground was an increased carryover of hoggs into 2015, leading to higher abattoir throughput. By contrast, slaughterings of ewes and rams were down sharply on 12 months before. This had been the case through 2014, despite little change in the November 2013 UK ewe flock, indicating flock rebuilding. This suggests that producer confidence and profitability were relatively strong during 2014 and into the early months of 2015. Trade
With imports adding to UK supplies, an increased quantity of sheepmeat arriving in the UK added to the pressure on the market from increased home production. With imports up by nearly 10%, the extra volume of product accounted for 25% of the increase in UK sheepmeat supplies during the quarter. However, it should be noted that part of the reason for the increase was the timing of Easter which brought some deliveries forward into March. Nevertheless, the main driver of the increase in imports was higher abattoir throughput in New Zealand (NZ). With a drought and the resulting tight grass supplies, NZ producers sold their lambs earlier than usual, pushing up the kill considerably in December and January, leading on to a higher volume of sheepmeat available for export. In addition, demand for NZ sheepmeat from China fell back. These factors resulted in a large increase in sheepmeat arriving in the UK during February and March. Indeed, sheepmeat imports from NZ increased to a 5 year high for the two month period.
With imports and domestic production both rising, it may have been expected that UK sheepmeat exports would also rise significantly. However, the opposite was true during Q1 with volumes down 17%. The consequence was that an additional 4,100t of sheepmeat remained on the home market compared to the same period of 2014. This was more than 40% of the overall increase in UK sheepmeat supply. Reduced sales of cheap cuts of frozen sheepmeat to Hong Kong accounted for 80% of the overall volume decline. However, in terms of the profitability of the export trade, the strong sterling caused significant difficulties as in order to grow export volumes slightly into the EU,
UK sheepmeat supply: Q1 2015 (t)
2015 2014 Change 2015/2014 (t) % change 2015/2014
Home Production 68,800 65,450 +3,350 +5.1
+ Imports 29,750 27,150 +2,600 +9.6
- Exports 19,300 23,400 -4,100 -17.4
= Net Supply 79,300 69,250 +10,050 14.5

35
the sterling price accepted had to fall sharply to stay competitive in euros. In terms of EU markets, volumes decreased into France, Belgium and Germany when compared to Q1 2014, but this was offset by increased sales to Ireland and Italy. Outlook
Looking towards the peak autumn period for UK lamb production, it seems likely that the UK market will prove well supplied. Indeed, the UK female breeding flock increased by 3% year-on-year in the autumn of 2014, suggesting a similar increase in lamb crop relative to 2014; a year when the number of lambs had risen to an 8-year high. The timing of these supplies reaching the market may have a significant influence on the market. With spring grass growth poorer than in 2014, it seems likely that lamb growth rates will be slower, resulting in a delay in spring lambs reaching the abattoir.
Moving on to trade, imports are likely to be lower than in the autumn of 2014. Although the NZ October 2014 lamb crop increased by around 2.5%, Beef + Lamb NZ expect that a higher retention rate will reduce the overall slaughter pool. However, the increased lamb kill during the period of drought in December and January resulted in slaughterings matching year earlier levels during the October 2014 to April 2015 period. If slaughterings are to fall back in 2014/15, this suggests that supplies will be tighter through the summer and into the autumn
of 2015, potentially limiting export deliveries to the UK. Meanwhile, Australia’s lamb production is expected to fall slightly over the coming year and the country’s relatively small quota for the EU places a natural barrier on export shipments to the UK at around 2014 levels. On the export side, it is difficult to see much room for improvement. Although the economic prospects look better in the key French market, lamb consumption has been declining there. In addition, a significant weakening of sterling against the euro seems unlikely, suggesting continued difficulties for exporters attempting to trade in price sensitive markets. Looking further afield, an anti-corruption drive in China has led to blockages in meat supply chains in the Far East, and most notably in Hong Kong, indicating further difficulties for exporters. As a consequence, the most likely situation for the second half of 2015 appears to be one of modestly higher supplies than a year ago. Domestic production is likely to remain above year earlier levels while exports are expected to be lower, but a decrease in imports will offset some of these increases.
0
5
10
15
20
25
Oct Nov Dec Jan Feb Mar Apr May Jun Jul Aug Sep
Mil
lio
n h
ea
d
Cumulative NZ lamb kill Source: Statistics NZ
13/14 14/15

36
Pigmeat:
Home Production Having reached a 12-year high in 2014, UK prime pig slaughterings continued to increase at the beginning of 2015. In the first quarter of the year, UK abattoirs slaughtered 2.58m prime pigs; a year-on-year increase of nearly 3.5%. Cheaper feed costs encouraged producers to add weight, pushing up prime pigmeat production volumes by almost 5% to 213,800t. Total pigmeat production was also nearly 5% higher as a decrease in sow slaughterings was offset by a sharp increase in the average carcase weight.
The principal factor behind the increase in pig supplies has been strong productivity growth. This can be linked to a constant drive for efficiency within the pig sector, which has resulted in significant investment in genetics and herd health which are now paying dividends. Comparing the June 2014 UK sow herd with the annual prime pig kill shows that 25.2 prime pigs were slaughtered for every sow. In 2013, this had been 23.9, suggesting a sow productivity increase of around 5%. As a consequence, a smaller sow herd can produce more prime pigs.
As noted previously, increased carcase weights have also contributed to the rise in domestic production. During Q1, the average prime pig carcase was around 1.2kg heavier than twelve months before at 82.3kg as cheaper feed allowed longer finishing periods and/or greater feed use. Carcase weight increases may also have been influenced by the faster growth rates linked to improvements in pig health. Trade Since imports add to UK supplies, the significant increase in home production during Q1 2015 resulted in reduced import requirements. This was despite the highly competitive prices of European pigmeat, thereby suggesting a lift in demand for home produced pigmeat in the retail and/or manufacturing trade. Although more pigmeat came into the UK from Denmark and Belgium, this was more than offset by decreases in deliveries from France, Germany, Ireland and Holland.
The extent to which domestic production increased meant that, despite lower imports, UK exports would need to increase to balance the market. However, this was not the case during Q1 2015 as export volumes were 4.5% lower year-on-year, resulting in an increased volume of home production remaining on the UK market relative to Q1 2014. The main factor holding back exports will have been the difficulty in competing on EU markets against cheaper priced EU product. In addition to significantly lower producer prices on the continent, the stronger value of sterling against the euro will have made it hard to compete in price sensitive markets. The difficulty of
UK pigmeat supply: Q1 2015 (t)
2015 2014 Change 2015/2014 (t) % change 2015/2014
Home Production 222,700 212,200 +10,500 +4.9
+ Imports 141,350 147,100 -5,750 -3.9
- Exports 48,750 51,000 -2,300 -4.5
= Net Supply 315,300 308,300 +7,000 +2.3
76
77
78
79
80
81
82
83
84
80
100
120
140
160
180
200
220
240
Feed costs vs prime carcase weightsSources: AHDB; Farmers Weekly
Feed Wheat (NE Sco) Carcase Weight

37
trading with European partners is highlighted by the Q1 trade figures which show sales to three of the four major markets declining. Higher sales to Denmark were more than offset by lower exports to Germany, Holland and Ireland. However, it was not just European markets that disappointed as exports to China and Hong Kong were down significantly. Outlook The industry consensus is for prime pig slaughterings to average around 3% higher year-on-year during the second half of 2015. This is based on a stabilisation of the breeding herd plus continuing productivity gains as lower farmgate prices have largely been offset by lower feed costs while the benefits of past investments in health and genetics continue to flow. The lower level of feed costs points towards the upwards trend in carcase weights being maintained. Better herd health should also support carcase weights. As a consequence, the overall increase in prime pigmeat production is likely to be greater than the 3% projected increase in throughput. On the trade side, it seems likely that imports will continue to trail 2014 levels given that domestic production is expected to rise further. However, with EU producer prices still tracking 25-30% below UK levels, it seems likely that imports will hold firm in price sensitive markets where country of origin is less important to the consumer. The export trade is likely to remain difficult during the second half of 2015. Firstly, the difficulty of competing with EU prices is likely to remain given that production remains strong across the EU; the Russian import ban is expected to continue due to the lack of an improvement in diplomatic relations; and there is little prospect of any significant fall in the value of sterling against the euro. In addition, the slowdown in exports to China may well continue since the Chinese economy has shown signs of slowing, and European product will continue to have an advantage in terms of price. The market signals continue to point towards a well-supplied UK pigmeat market during the second half of 2015.

38
Red Meat Sector Outlook
UK economic prospects look good, driven by consumer spending as wage growth outpaces inflation. The European economy made a positive start to 2015 and the signs are pointing to a self-fulfilling upturn in the second half of the year.
Factors influencing the recent declines in food retail prices are unlikely to diminish. A Strong global harvest, increased livestock production in the EU, the Russian export ban and supermarket competition are expected to continue. Red meat will struggle to gain market share against other proteins given that their prices will be facing similar headwinds.
Domestic beef production and imports are likely to trail 2014 levels in the second half of 2015.
However, lower exports will be an offsetting factor, limiting the potential decline in total supplies reaching the UK market.
The UK is likely to remain well-supplied with sheepmeat in the key autumn period due to higher
domestic production and lower exports. However, lower imports will offset some of these increases and home killed lamb may reach the market more slowly than last year.
UK pigmeat production is likely to continue rising on its recent trend due to improving sow
productivity. This indicates that less imported product will be required, particularly as exports are expected to continue facing significant headwinds.
Demand for beef, lamb and pork with UK national or regional identification is likely to remain firm at the higher end of the market as consumers continue to seek traceability, provenance and quality. However, with in-work benefits for the low paid being earmarked for reductions, household purchasing power at the lower end of the income scale is still likely to remain weak, suggesting that overall red meat sales volumes may continue to struggle.
A structural shift in food consumption appears to be underway. Recent trends in this respect are
likely to continue. These include faster growth in out-of-home consumption; meat being used as an ingredient rather than as the centrepiece of a dish; and meat being bought more often but in smaller volumes.
High end markets in the EU remain a potential growth market for Scottish product due to price being less of a factor behind demand and their relatively small current base. Relative economic prospects continue to indicate that the Nordic countries and Germany may offer the most promise. However, France will remain by far Scotland’s largest export market. Optimistically, the economic signals from France are looking much brighter.
The ECB’s QE programme is set to last for at least another 15 months, indicating little prospect of a
stronger euro against the pound. If anything, risk over Greece and a potential interest rate increase in the UK point towards an upside bias for sterling. In turn, export opportunities in price-sensitive red meat products continue to look limited.
Politics and logistics will continue to heavily restrict trade with third countries, making it hard for processors to balance the carcase. A fall in demand from Hong Kong for lower value cuts of meat and fifth quarter product may turn into a prolonged slump for political reasons.

39
Sources AHDB Bank of England Bank for International Settlements BCMS Beef + Lamb New Zealand Bloomberg British Chambers of Commerce British Retail Consortium Confederation of British Industry DEFRA Eurostat European Central Bank European Commission Economic and Financial Affairs European Commission Agriculture and Rural Development Farmers Weekly Interactive Financial Times GfK NOP HGCA IMF HM Revenue & Customs Markit Economics OANDA Office for National Statistics Scotiabank Scottish Government SECO Society of Motor Manufacturers and Traders Statistics Denmark Statistics Norway Swiss Federal Statistics Office

40
Statistical Appendix

41
UK Economic Indicators Sources: ONS; OANDA; Eurostat
Retail Sales Index
UK Inflation:
EU28
Inflation: HICP
Exchange
Rate
Unemployment: Claimant Count
Whole Economy Average Earnings
Total Food
All Items RPIJ All items CPI
000 %
£/week % change y/y
2011 = 100
Jan 87 =
100 % Change
Y/Y 2005 =
100
% Change
Y/Y
% Change
Y/Y
€:£
2007 864.5 2.6
427 4.9
99.6 102.7
199.3 3.9
104.7 2.3
2.4
0.6840
2008 906.1 2.8
442 3.5
100.2 102.3
206.5 3.6
108.5 3.6
3.7
0.7964
2009 1527.7 4.6
441 -0.2
100.4 103.0
204.6 -0.9
110.8 2.2
1.0
0.8917
2010 1496.4 4.5
451 2.3
99.8 101.2
212.8 4.0
114.5 3.3
2.1
0.8589
2011 1534.4 4.7
463 2.7
100.0 100.0
222.3 4.5
119.6 4.5
3.1
0.8678
2012 1585.6 4.7 469 1.3 100.8 99.9 228.1 2.6 123.0 2.8 2.6 0.8112
2013 1421.9 4.2
475 1.3
102.2 99.7
233.6 2.4
126.1 2.6
1.5
0.8489
2014 1037.6 3.0 480 1.1 106.2 100.4
3 month rolling avg
2014 Jan 1215.7 3.5 478 1.3 103.2 98.7 235.4 2.1 126.7 1.9 0.9 0.8277
Feb 1180.8 3.4 479 1.7 104.3 100.4 236.3 2.0 127.4 1.7 0.8 0.8245
Mar 1147.3 3.3 473 1.8 105.0 98.7 236.7 1.8 127.7 1.6 0.6 0.8312
Apr 1114.8 3.2 480 0.7 105.6 101.6 237.4 1.8 128.1 1.8 0.8 0.8251
May 1082.7 3.1 479 0.1 105.9 100.1 237.5 1.7 128 1.5 0.6 0.8157
Jun 1044.4 3.0 477 -0.2 106.0 100.3 237.8 2.0 128.3 1.9 0.7 0.8044
Jul 1010.1 2.9 478 0.6 106.2 100.5 237.5 1.8 127.8 1.6 0.5 0.7931
Aug 974.8 2.8 479 0.7 106.6 99.8 238.3 1.8 128.3 1.5 0.5 0.7975
Sep 956.0 2.8 482 1.0 106.0 100.2 238.8 1.6 128.4 1.2 0.4 0.7911
Oct 934.6 2.7 485 1.5 107.6 100.9 238.9 1.7 128.5 1.3 0.5 0.7880
Nov 908.6 2.6 484 1.8 109.3 101.4 238.3 1.4 128.2 1.0 0.3 0.7901
Dec 881.3 2.6 488 2.1 109.2 102.5 238.6 1.0 128.2 0.5 -0.1 0.7879
2015 Jan 845.6 2.5 485 1.9 109.5 101.7 236.5 0.5 127.1 0.3 -0.5 0.7682
Feb 821.2 2.4 484 1.7 110.1 101.9 237.2 0.4 127.4 0.0 -0.3 0.7413
Mar 806.1 2.3 494 2.3 109.5 102.0 237.4 0.3 127.6 0.0 -0.1 0.7227
Apr 798.3 2.3 493 2.7 110.5 102.1 238.0 0.3 128 -0.1 0.0 0.7232
May 791.8 2.3 110.7 102.8 238.5 0.4 128.2 0.1 0.3 0.7229

42
Retail Price Index: meat & other food items
Source: ONS
Jan 1987 = 100
Beef Lamb Home Killed Lamb imported Pork Bacon Poultry Fish Cheese Eggs All Food Catering All Items
2009 175.4 239.6 214.0 196.2 213.7 130.9 196.8 216.1 255.1 189.1 271.4 213.7
2010 174.6 259.3 218.9 203.2 210.8 130.9 208.8 220.1 264.1 195.0 279.8 223.6
2011 181.8 291.3 284.1 213.8 215.3 138.4 228.0 232.7 266.7 206.6 291.2 235.2
2012 201.7 306.0 280.2 228.6 216.6 139.8 237.7 240.9 262.6 213.3 300.2 242.7
2013 213.4 307.9 261.5 240.6 228.6 145.2 246.8 241.9 259.1 221.2 308.4 250.1 2014 219.1 313.4 262.3 237.7 227.7 144.6 254.1 251.7 252.0 221.3 315.5 256 % Change YoY 2009 8.3 11.1 12.4 7.7 5.0 2.0 5.1 3.9 3.7 5.3 2.7 -0.5 2010 -0.5 8.2 2.3 3.6 -1.4 0.0 6.1 1.9 3.5 3.1 3.1 4.6 2011 4.1 12.3 29.8 5.2 2.1 5.7 9.2 5.7 1.0 5.9 4.1 5.2
2012 10.9 5.0 -1.4 6.9 0.6 1.0 4.3 3.5 -1.5 3.2 3.1 3.2 2013 5.8 0.6 -6.7 5.2 5.5 3.9 3.8 0.4 -1.3 3.7 2.7 3.0 2014 2.7 1.8 0.3 -1.2 -0.4 -0.4 3 4.1 -2.7 0.0 2.3 2.4
2014 Jan 219.0 316.8 257.4 237.3 225.7 145.2 253.4 251.6 266.4 223.7 312.1 252.6 Feb 219.1 324.1 262.2 244.6 230.2 146.5 257.2 252.4 265.1 224.8 312.8 254.2
Mar 221.2 316.9 255.8 230.2 231.3 147.3 260.5 253.4 263.5 224.1 313.8 254.8 Apr 217.6 321.2 246.5 244.1 229.5 145.2 249.1 253.3 254.5 223.0 314.1 255.7 May 219.3 314.0 256.3 239.5 223.2 144.8 258.1 251.6 242.2 220.8 314.7 255.9 Jun 220.4 327.5 261.7 233.0 224.1 144.1 249.7 253.9 243.4 221.2 315.4 256.3 Jul 221.0 308.8 268.1 239.6 222.6 145.6 254.6 249.3 249.7 220.6 316.3 256.0 Aug 217.9 304.5 267.2 240.2 230.3 143.3 254.2 251.7 245.0 219.9 316.4 257.0 Sep 218.8 330.6 269.4 234.5 230.2 142.6 246.5 252.3 250.8 219.6 316.6 257.6 Oct 217.6 307.3 266.6 237.1 229.0 145.1 258.0 245.5 250.1 219.9 317.6 257.7 Nov 218.8 302.3 259.4 235.3 227.7 141.4 252.4 253.6 247.0 218.6 318.1 257.1 Dec 218.5 287.0 277.2 236.6 228.3 144.3 255.4 251.4 246.7 219.5 318.5 257.5
2015 Jan 221.7 310.8 269.4 229.7 221.4 139.9 254.2 252.0 240.0 218.6 318.3 255.4 Feb 222.7 313.7 269.5 233.0 223.1 139.0 254.4 242.6 234.8 218.4 318.8 256.7 Mar 219.3 309.6 267.0 233.0 221.4 138.9 247.5 248.0 232.0 217.8 319.0 257.1 Apr 218.3 336.0 266.3 235.1 222.7 136.4 249.4 246.3 232.8 217.2 319.8 258.0 May 219.4 321.9 268.2 233.8 220.3 136.6 245.1 243.0 233.2 216.8 320.1 258.5 % Change YoY May 0.0 2.5 4.6 -2.4 -1.3 -5.7 -5.0 -3.4 -3.7 -1.8 1.7 1.0
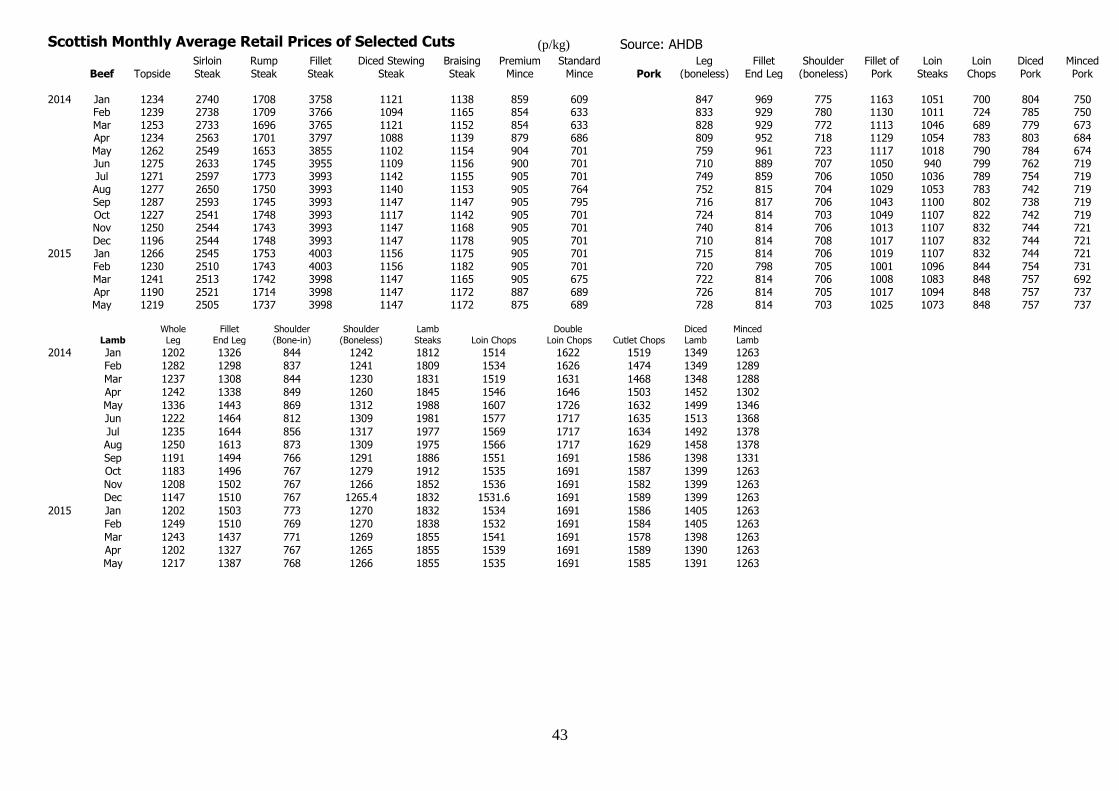
43
Scottish Monthly Average Retail Prices of Selected Cuts (p/kg) Source: AHDB
Beef Topside
Sirloin Steak
Rump Steak
Fillet Steak
Diced Stewing Steak
Braising Steak
Premium Mince
Standard Mince
Pork
Leg (boneless)
Fillet End Leg
Shoulder (boneless)
Fillet of Pork
Loin Steaks
Loin Chops
Diced Pork
Minced Pork
2014 Jan 1234 2740 1708 3758 1121 1138 859 609
847 969 775 1163 1051 700 804 750
Feb 1239 2738 1709 3766 1094 1165 854 633
833 929 780 1130 1011 724 785 750
Mar 1253 2733 1696 3765 1121 1152 854 633
828 929 772 1113 1046 689 779 673
Apr 1234 2563 1701 3797 1088 1139 879 686
809 952 718 1129 1054 783 803 684
May 1262 2549 1653 3855 1102 1154 904 701
759 961 723 1117 1018 790 784 674
Jun 1275 2633 1745 3955 1109 1156 900 701
710 889 707 1050 940 799 762 719
Jul 1271 2597 1773 3993 1142 1155 905 701
749 859 706 1050 1036 789 754 719
Aug 1277 2650 1750 3993 1140 1153 905 764
752 815 704 1029 1053 783 742 719
Sep 1287 2593 1745 3993 1147 1147 905 795 716 817 706 1043 1100 802 738 719 Oct 1227 2541 1748 3993 1117 1142 905 701 724 814 703 1049 1107 822 742 719 Nov 1250 2544 1743 3993 1147 1168 905 701 740 814 706 1013 1107 832 744 721 Dec 1196 2544 1748 3993 1147 1178 905 701 710 814 708 1017 1107 832 744 721
2015 Jan 1266 2545 1753 4003 1156 1175 905 701 715 814 706 1019 1107 832 744 721
Feb 1230 2510 1743 4003 1156 1182 905 701 720 798 705 1001 1096 844 754 731
Mar 1241 2513 1742 3998 1147 1165 905 675 722 814 706 1008 1083 848 757 692 Apr 1190 2521 1714 3998 1147 1172 887 689 726 814 705 1017 1094 848 757 737 May 1219 2505 1737 3998 1147 1172 875 689 728 814 703 1025 1073 848 757 737
Lamb Whole Leg
Fillet End Leg
Shoulder (Bone-in)
Shoulder (Boneless)
Lamb Steaks Loin Chops
Double Loin Chops Cutlet Chops
Diced Lamb
Minced Lamb
2014 Jan 1202 1326 844 1242 1812 1514 1622 1519 1349 1263
Feb 1282 1298 837 1241 1809 1534 1626 1474 1349 1289
Mar 1237 1308 844 1230 1831 1519 1631 1468 1348 1288
Apr 1242 1338 849 1260 1845 1546 1646 1503 1452 1302
May 1336 1443 869 1312 1988 1607 1726 1632 1499 1346
Jun 1222 1464 812 1309 1981 1577 1717 1635 1513 1368
Jul 1235 1644 856 1317 1977 1569 1717 1634 1492 1378
Aug 1250 1613 873 1309 1975 1566 1717 1629 1458 1378
Sep 1191 1494 766 1291 1886 1551 1691 1586 1398 1331
Oct 1183 1496 767 1279 1912 1535 1691 1587 1399 1263
Nov 1208 1502 767 1266 1852 1536 1691 1582 1399 1263
Dec 1147 1510 767 1265.4 1832 1531.6 1691 1589 1399 1263
2015 Jan 1202 1503 773 1270 1832 1534 1691 1586 1405 1263
Feb 1249 1510 769 1270 1838 1532 1691 1584 1405 1263
Mar 1243 1437 771 1269 1855 1541 1691 1578 1398 1263
Apr 1202 1327 767 1265 1855 1539 1691 1589 1390 1263
May 1217 1387 768 1266 1855 1535 1691 1585 1391 1263

44
UK Farm-to-Retail Price Spreads (p/kg) Source: AHDB
Beef Lamb Pork
Average Farm Price
Average Retail Price
Price Spread
Producer Share (%)
Average Farm Price
Average Retail Price
Price Spread
Producer Share (%)
Average Farm Price
Average Retail Price
Price Spread
Producer Share (%)
2005 186.9 421.8 234.9 44.3
250.7 556.4 305.7 45.1
103.9 283.7 179.8 36.6
2006 202.8 427.6 224.8 47.4
258.0 550.2 292.3 47.0
104.8 294.3 189.5 35.6
2007 206.0 453.1 247.2 45.5
235.8 576.6 340.8 40.9
108.0 304.0 196.0 35.5
2008 257.6 518.3 260.7 49.7
291.3 627.6 336.4 46.4
126.0 337.2 211.2 37.3
2009 279.0 558.6 279.5 50.0
358.3 679.7 321.3 52.7
146.2 364.7 219.0 39.9
2010 268.3 564.2 295.8 47.6
390.5 698.9 308.5 55.9
141.8 364.0 222.3 38.9
2011 307.0 584.4 277.4 52.5
433.7 751.9 318.2 57.8
141.6 363.6 222.1 39.3
2012 341.6 633.6 292.0 53.9 412.6 777.5 365.0 53.1 150.2 377.1 226.8 39.8
2013 385.8 668.7 283.0 57.7
417.1 790.6 373.6 52.7
165.5 391.6 226.1 42.2
2014 348.3 701.5 353.2 49.7 421.8 818.8 397.0 51.5 159.7 395.1 235.4 40.4
Jan 14 374.7 691.6 316.9 54.2
400.5 803.4 402.9 49.8
167.9 396.8 228.9 42.3
Feb 14 364.2 704.9 340.7 51.7
415.8 818.1 402.3 50.8
164.2 393.1 228.9 41.8
Mar 14 361.9 704.9 343.0 51.3
453.8 814.4 360.6 55.7
162.8 395.5 232.8 41.2
Apr 14 354.6 707.6 353.0 50.1
480.8 827.6 346.8 58.1
163.5 407.7 244.2 40.1
May 14 336.8 710.9 374.1 47.4
499.0 857.7 358.7 58.2
164.3 399.8 235.6 41.1
Jun 14 326.9 704.9 378.0 46.4
502.4 841.6 339.2 59.7
164.1 388.3 224.2 42.3
Jul 14 325.5 709.6 384.1 45.9
412.0 841.6 429.6 49.0
161.5 398.6 237.1 40.5
Aug 14 333.8 710.9 377.0 47.0 378.7 826.9 448.2 45.8 158.3 397.4 239.1 39.8
Sep 14 345.4 708.9 363.5 48.7 359.2 806.3 447.1 44.5 156.2 392.5 236.3 39.8
Oct 14 349.0 686.9 338.0 50.8 355.2 804.1 448.9 44.2 156.1 390.1 233.9 40.0
Nov 14 351.9 697.6 345.7 50.4 387.9 807.1 419.2 48.1 150.4 393.1 242.8 38.2
Dec 14 354.5 679.0 324.4 52.2 416.6 777.0 360.4 53.6 147.6 388.9 241.2 38.0
Jan 15 363.1 698.3 335.2 52.0 421.2 793.1 371.9 53.1 144.1 388.9 244.8 37.0
Feb 15 359.7 705.6 345.9 51.0 422.6 802.7 380.1 52.6 138.7 388.9 250.1 35.7
Mar 15 354.4 704.9 350.5 50.3 446.2 802.7 356.5 55.6 136.5 386.4 249.9 35.3
Apr 15 339.3 688.9 349.7 49.2 432.9 796.8 363.9 54.3 136.0 390.1 254.1 34.9
May 15 326.1 694.3 368.2 47.0 403.9 799.7 395.9 50.5 136.0 388.9 252.8 35.0

45
EU Economic Indicators Sources: Eurostat; Swiss Federal Statistical Office
Country Q1 2015 Q4 2014 Q3 2014 Q2 2014
Economic
Growth (%)* Unemployment
Rate (%) Inflation Rate (%)
Economic Growth (%)*
Unemployment Rate (%)
Inflation Rate (%)
Economic Growth (%)*
Unemployment Rate (%)
Inflation Rate (%)
Economic Growth (%)*
Unemployment Rate (%)
Inflation Rate (%)
Bel 0.3 8.5 -0.4 0.2 8.6 0.0 0.3 8.6 0.4 0.1 8.4 0.8
Ger 0.3 4.8 -0.1 0.7 4.9 0.4 0.1 5.0 0.8 -0.1 5.0 0.9
Est -0.3 6.1 -0.2 1.0 6.6 0.4 0.2 7.7 0.0 0.8 7.3 0.6
Ire n/a 9.9 -0.4 0.2 10.4 0.1 0.4 11.1 0.5 1.2 11.7 0.4
Gre -0.2 25.6 -2.2 -0.4 26.0 -1.8 0.7 26.2 -0.7 0.3 26.9 -1.7
Spa 0.9 23.1 -1.2 0.7 23.7 -0.6 0.5 24.2 -0.4 0.5 24.7 0.2
Fra 0.6 10.5 -0.2 0.1 10.5 0.2 0.3 10.4 0.5 -0.1 10.1 0.7
Ita 0.3 12.4 -0.1 0.0 12.7 0.1 -0.1 12.7 -0.1 -0.1 12.5 0.4
Cyp 1.5 16.0 -1.0 -0.3 16.4 -0.2 -0.8 16.3 0.6 -0.2 16.1 -0.2
Lat# 0.3 9.7 0.1 0.5 10.4 0.6 0.4 10.9 0.9 0.7 10.6 0.8
Lit -0.6 9.2 -1.3 0.7 10.1 0.2 0.5 10.5 0.3 0.8 11.0 0.2
Lux n/a 5.7 -0.4 n/a 5.8 -0.1 2.3 5.9 0.7 0.5 6.0 1.2
Mal 0.6 5.9 0.6 1.0 6.0 0.6 0.6 5.8 0.7 1.3 5.9 0.5
Hol 0.6 7.1 -0.5 0.9 7.2 0.2 0.4 7.2 0.3 0.7 7.6 0.3
Aus 0.1 5.5 0.6 0.0 5.6 1.2 0.0 5.6 1.5 0.0 5.6 1.6
Por 0.4 13.5 0.0 0.4 13.5 0.0 0.2 13.6 -0.3 0.5 14.4 -0.2
Sln 0.8 9.3 -0.5 0.3 9.5 0.0 0.7 9.7 0.1 1.1 9.7 0.8
Slk 0.8 12.3 -0.5 0.7 12.6 0.0 0.6 13.1 -0.2 0.7 13.3 -0.1
Fin -0.1 9.2 -0.1 -0.1 9.0 1.0 -0.1 8.8 1.2 0.4 8.6 1.1
Euro Area 0.4 11.2 -0.3 0.4 11.4 0.2 0.2 11.6 0.4 0.1 11.6 0.6
Bul 0.9 10.2 -1.7 0.4 10.6 -1.8 0.4 11.4 -1.2 0.3 11.5 -1.6
Cze 3.1 5.8 0.0 0.4 5.8 0.5 0.4 5.9 0.7 0.3 6.2 0.2
Den 0.4 6.2 0.0 0.5 6.3 0.2 0.6 6.6 0.4 0.3 6.4 0.4
Cro 0.0 18.2 -0.3 -0.1 18.0 0.2 0.2 17.0 0.3 -0.1 17.0 0.3
Hun 0.8 7.4 -1.0 0.8 7.3 -0.3 0.6 7.5 0.1 1.0 8.1 -0.1
Pol 1.0 8.0 -1.2 0.8 8.3 -0.4 0.9 8.6 -0.1 0.7 9.2 0.3
Rom 1.6 6.9 0.6 1.0 6.6 1.4 2.2 6.7 1.5 -0.6 6.8 1.3
Swe 0.4 7.8 0.6 0.8 7.8 0.3 0.6 7.8 0.2 0.7 8.0 0.3
UK 0.3 5.5 0.1 0.6 5.6 0.9 0.6 5.9 1.4 0.8 6.3 1.7
EU28 0.4 9.8 -0.3 0.4 10.0 0.2 0.3 10.1 0.5 0.3 10.3 0.7
Nor 0.5 4.0 1.8 0.4 3.8 2.0 0.5 3.6 2.1 1.1 3.3 1.6
Swi -0.2 4.4 -0.3 0.5 4.1 0.0 0.6 4.8 0.0 0.2 4.4 0.1
* % change compared with previous quarter
#Lithuania joined the Euro Area on January 1 2015

46