recruiting from india: market trends and future potential
TRANSCRIPT
Recruiting from India: Market Trends and
Future Potential
SUSHIL SUKHWANI – EDWISE INTERNATIONAL&
ZIPING FENG - THOMPSON RIVERS UNIVERSITY
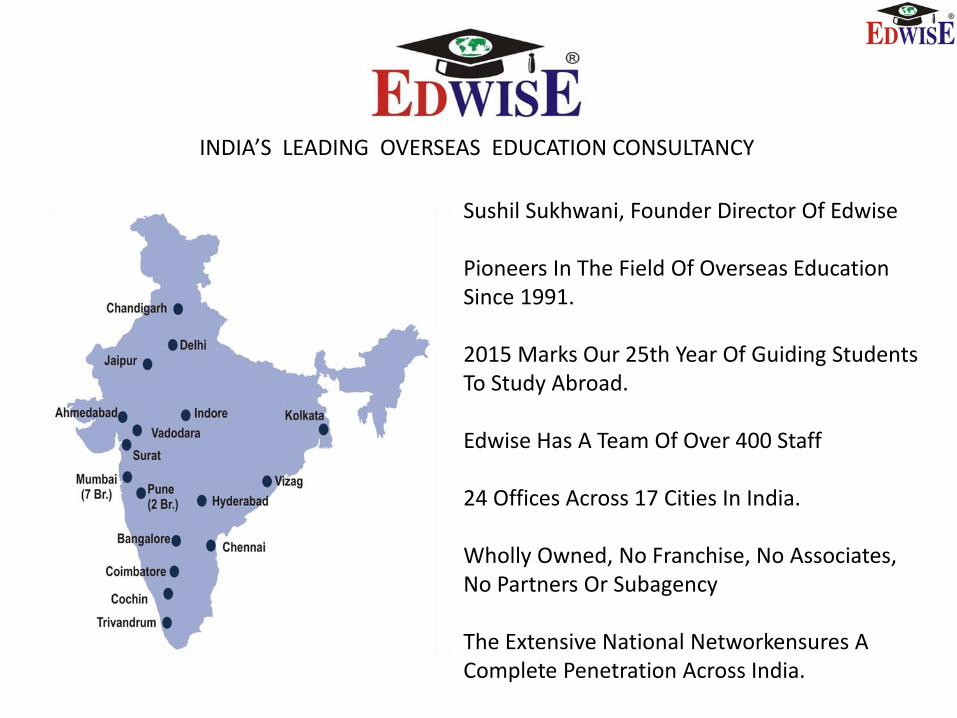
INDIA’S LEADING OVERSEAS EDUCATION CONSULTANCY
Sushil Sukhwani, Founder Director Of Edwise
Pioneers In The Field Of Overseas Education Since 1991.
2015 Marks Our 25th Year Of Guiding Students To Study Abroad.
Edwise Has A Team Of Over 400 Staff
24 Offices Across 17 Cities In India.
Wholly Owned, No Franchise, No Associates, No Partners Or Subagency
The Extensive National Networkensures A Complete Penetration Across India.
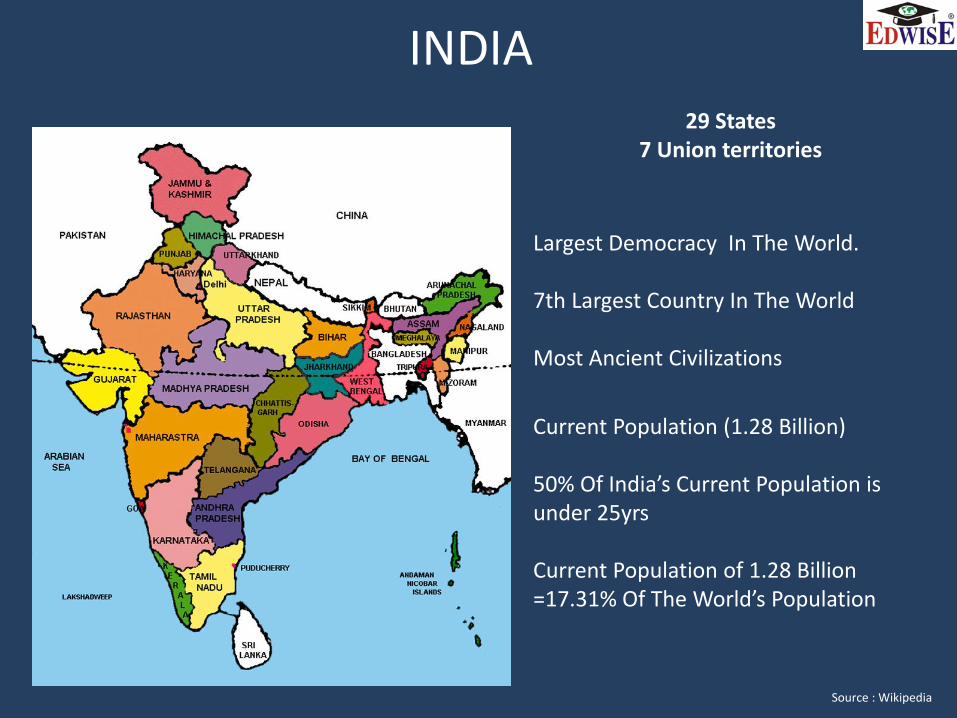
INDIA29 States
7 Union territories
Largest Democracy In The World.
7th Largest Country In The World
Most Ancient Civilizations
Current Population (1.28 Billion)
50% Of India’s Current Population is under 25yrs
Current Population of 1.28 Billion =17.31% Of The World’s Population
Source : Wikipedia
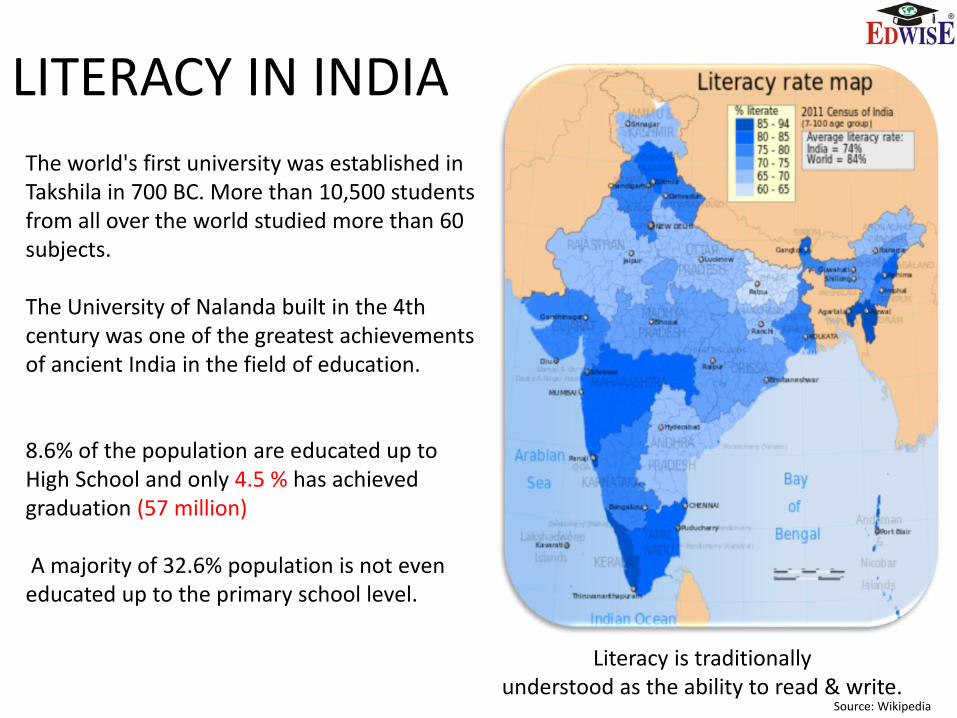
LITERACY IN INDIA
Literacy is traditionally understood as the ability to read & write.
The world's first university was established in Takshila in 700 BC. More than 10,500 students from all over the world studied more than 60 subjects.
The University of Nalanda built in the 4th century was one of the greatest achievements of ancient India in the field of education.
8.6% of the population are educated up to High School and only 4.5 % has achieved graduation (57 million)
A majority of 32.6% population is not even educated up to the primary school level.
Source: Wikipedia
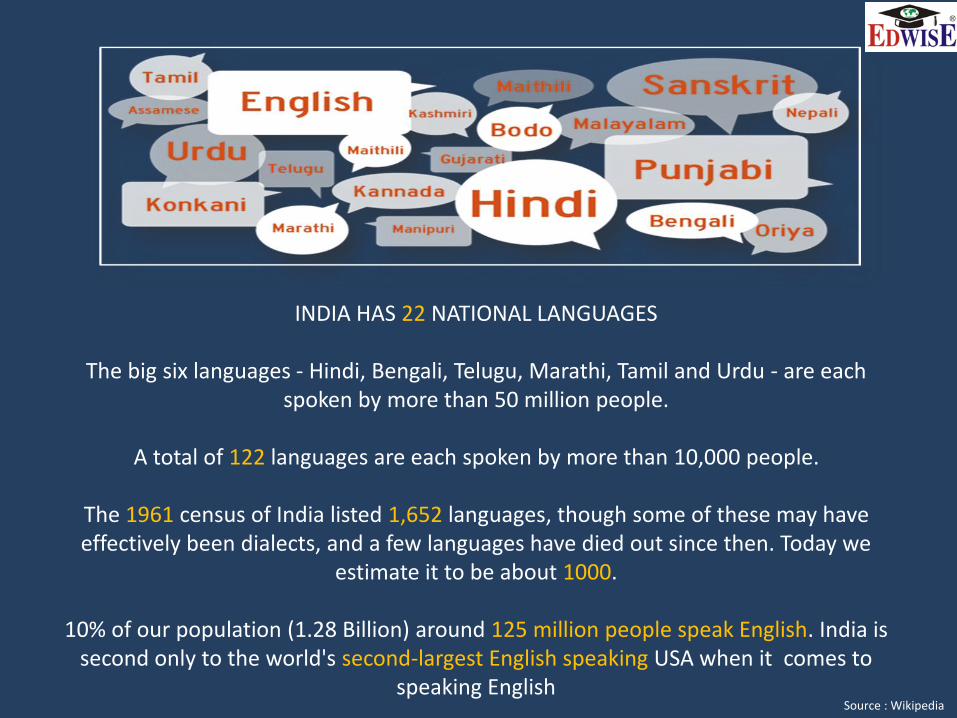
INDIA HAS 22 NATIONAL LANGUAGES
The big six languages - Hindi, Bengali, Telugu, Marathi, Tamil and Urdu - are each spoken by more than 50 million people.
A total of 122 languages are each spoken by more than 10,000 people.
The 1961 census of India listed 1,652 languages, though some of these may have effectively been dialects, and a few languages have died out since then. Today we
estimate it to be about 1000.
10% of our population (1.28 Billion) around 125 million people speak English. India is second only to the world's second-largest English speaking USA when it comes to
speaking EnglishSource : Wikipedia
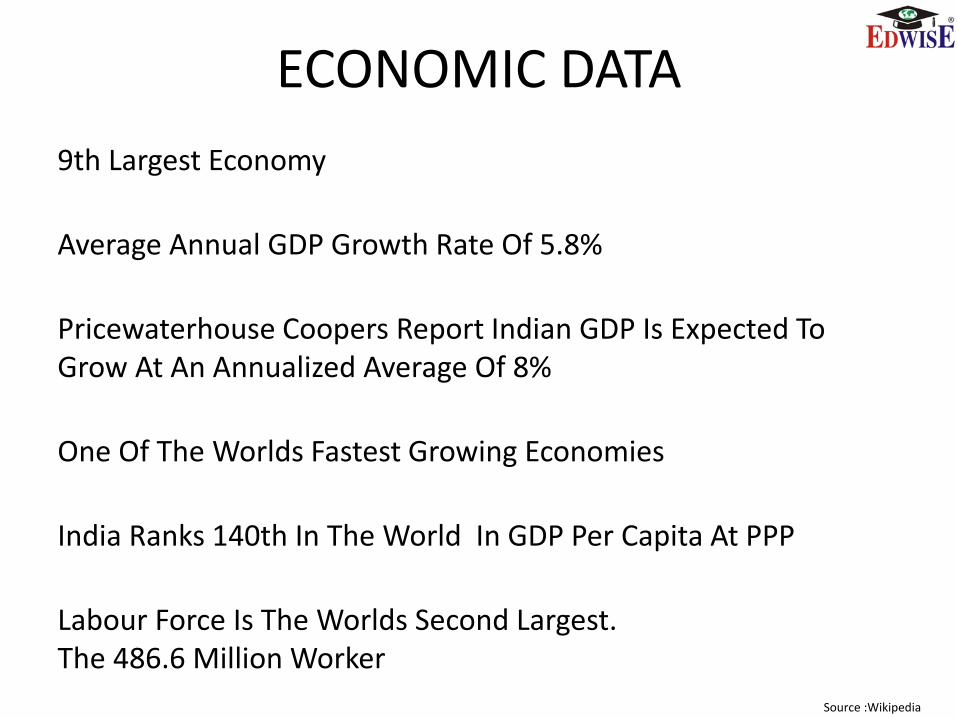
ECONOMIC DATA
9th Largest Economy
Average Annual GDP Growth Rate Of 5.8%
Pricewaterhouse Coopers Report Indian GDP Is Expected To Grow At An Annualized Average Of 8%
One Of The Worlds Fastest Growing Economies
India Ranks 140th In The World In GDP Per Capita At PPP
Labour Force Is The Worlds Second Largest.The 486.6 Million Worker
Source :Wikipedia
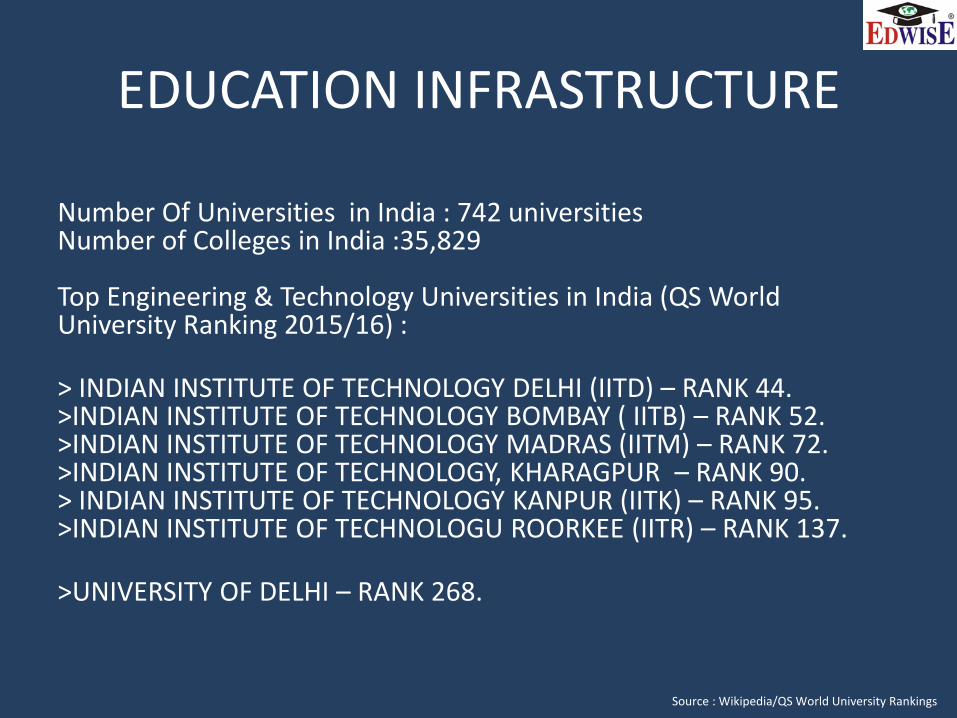
EDUCATION INFRASTRUCTURE
Number Of Universities in India : 742 universitiesNumber of Colleges in India :35,829
Top Engineering & Technology Universities in India (QS World University Ranking 2015/16) :
> INDIAN INSTITUTE OF TECHNOLOGY DELHI (IITD) – RANK 44.>INDIAN INSTITUTE OF TECHNOLOGY BOMBAY ( IITB) – RANK 52.>INDIAN INSTITUTE OF TECHNOLOGY MADRAS (IITM) – RANK 72.>INDIAN INSTITUTE OF TECHNOLOGY, KHARAGPUR – RANK 90.> INDIAN INSTITUTE OF TECHNOLOGY KANPUR (IITK) – RANK 95.>INDIAN INSTITUTE OF TECHNOLOGU ROORKEE (IITR) – RANK 137.
>UNIVERSITY OF DELHI – RANK 268.
Source : Wikipedia/QS World University Rankings
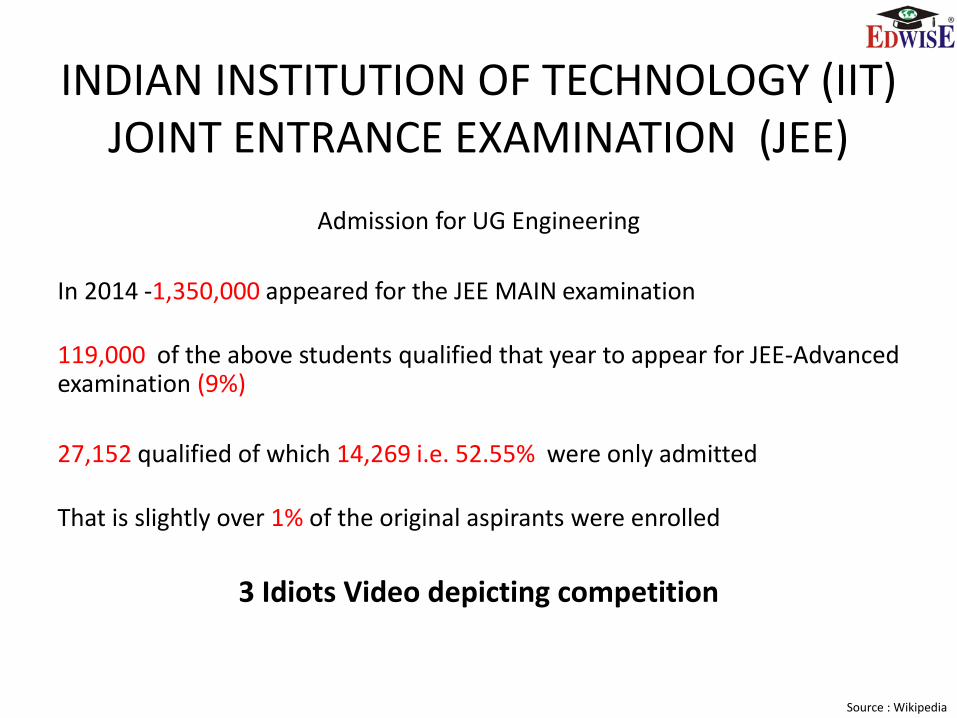
INDIAN INSTITUTION OF TECHNOLOGY (IIT)JOINT ENTRANCE EXAMINATION (JEE)
Admission for UG Engineering
In 2014 -1,350,000 appeared for the JEE MAIN examination
119,000 of the above students qualified that year to appear for JEE-Advanced examination (9%)
27,152 qualified of which 14,269 i.e. 52.55% were only admitted
That is slightly over 1% of the original aspirants were enrolled
3 Idiots Video depicting competition
Source : Wikipedia

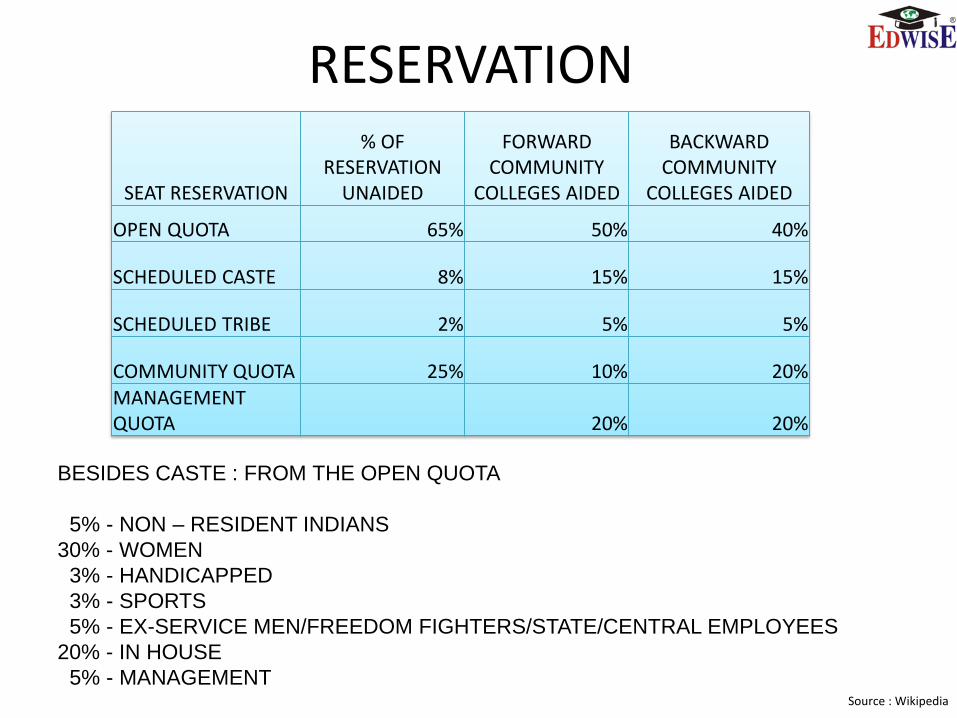
RESERVATION
SEAT RESERVATION
% OF RESERVATION
UNAIDED
FORWARD COMMUNITY
COLLEGES AIDED
BACKWARD COMMUNITY
COLLEGES AIDED
OPEN QUOTA 65% 50% 40%
SCHEDULED CASTE 8% 15% 15%
SCHEDULED TRIBE 2% 5% 5%
COMMUNITY QUOTA 25% 10% 20%MANAGEMENT QUOTA 20% 20%
BESIDES CASTE : FROM THE OPEN QUOTA
5% - NON – RESIDENT INDIANS
30% - WOMEN
3% - HANDICAPPED
3% - SPORTS
5% - EX-SERVICE MEN/FREEDOM FIGHTERS/STATE/CENTRAL EMPLOYEES
20% - IN HOUSE
5% - MANAGEMENTSource : Wikipedia
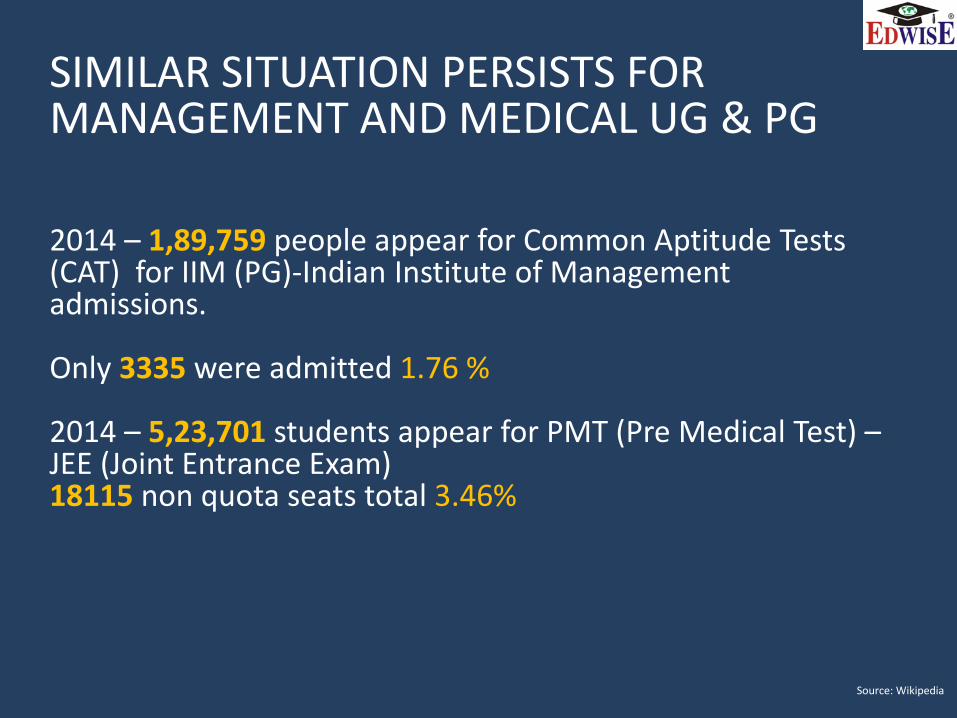
SIMILAR SITUATION PERSISTS FOR MANAGEMENT AND MEDICAL UG & PG
2014 – 1,89,759 people appear for Common Aptitude Tests (CAT) for IIM (PG)-Indian Institute of Management admissions.
Only 3335 were admitted 1.76 %
2014 – 5,23,701 students appear for PMT (Pre Medical Test) –JEE (Joint Entrance Exam) 18115 non quota seats total 3.46%
Source: Wikipedia
ISSUES WITH INDIAN EDUCATION SYSTEM
• Need to create a large number of additional seats
• Quality issues in higher education in India
• Persistent issues with respect to the employability of graduates not meeting industry expectations.
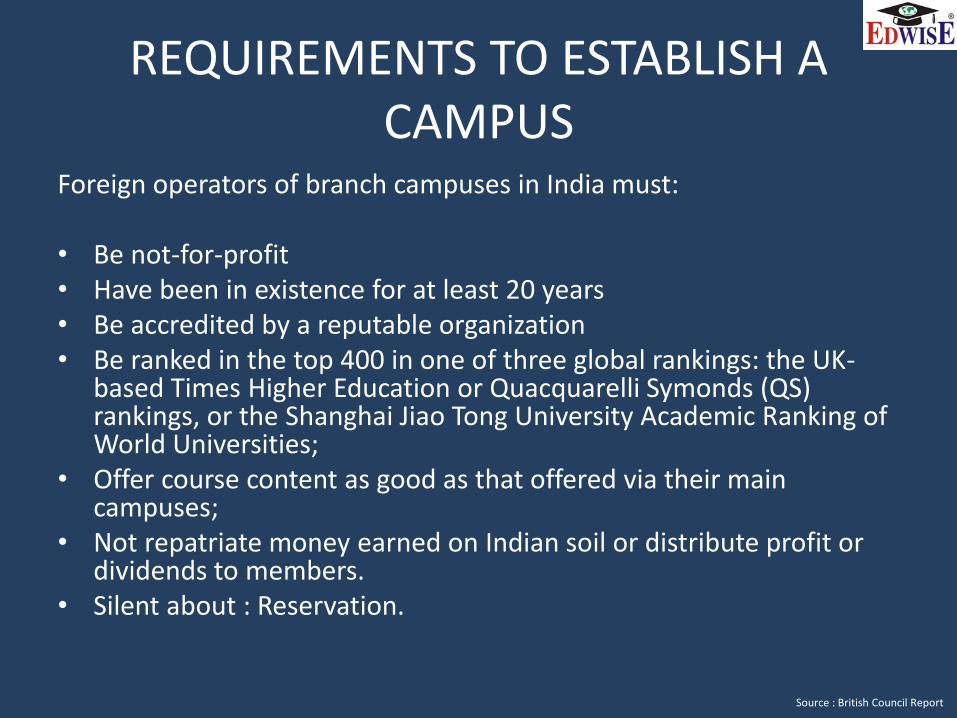
REQUIREMENTS TO ESTABLISH A CAMPUS
Foreign operators of branch campuses in India must:
• Be not-for-profit• Have been in existence for at least 20 years• Be accredited by a reputable organization• Be ranked in the top 400 in one of three global rankings: the UK-
based Times Higher Education or Quacquarelli Symonds (QS) rankings, or the Shanghai Jiao Tong University Academic Ranking of World Universities;
• Offer course content as good as that offered via their main campuses;
• Not repatriate money earned on Indian soil or distribute profit or dividends to members.
• Silent about : Reservation.
Source : British Council Report
WHY INDIAN STUDENTS STUDY ABROAD ?
• Shortage Of Capacity Vs. Demand
• Quality Of Education – Tier 2 In India Vs Tier 2 Overseas
• International Exposure -Study, Live, Work
• Immigration
• BUT Exchange Rates And High Fees Are The Deterrent
•
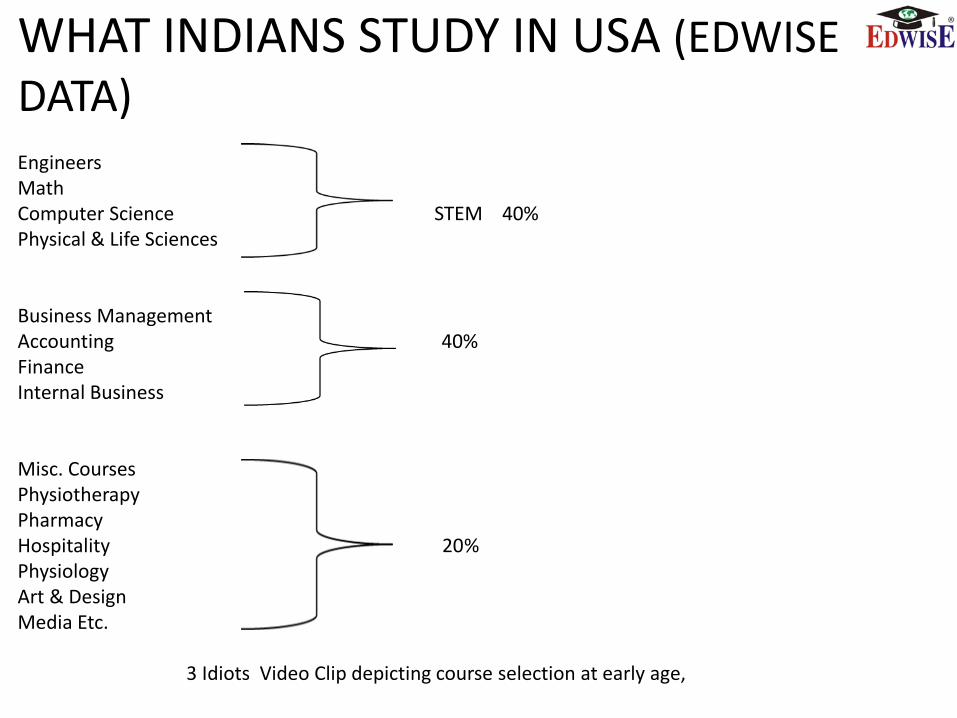
WHAT INDIANS STUDY IN USA (EDWISE DATA)Engineers MathComputer Science STEM 40%Physical & Life Sciences
Business ManagementAccounting 40%Finance Internal Business
Misc. CoursesPhysiotherapyPharmacyHospitality 20%PhysiologyArt & DesignMedia Etc.
3 Idiots Video Clip depicting course selection at early age,
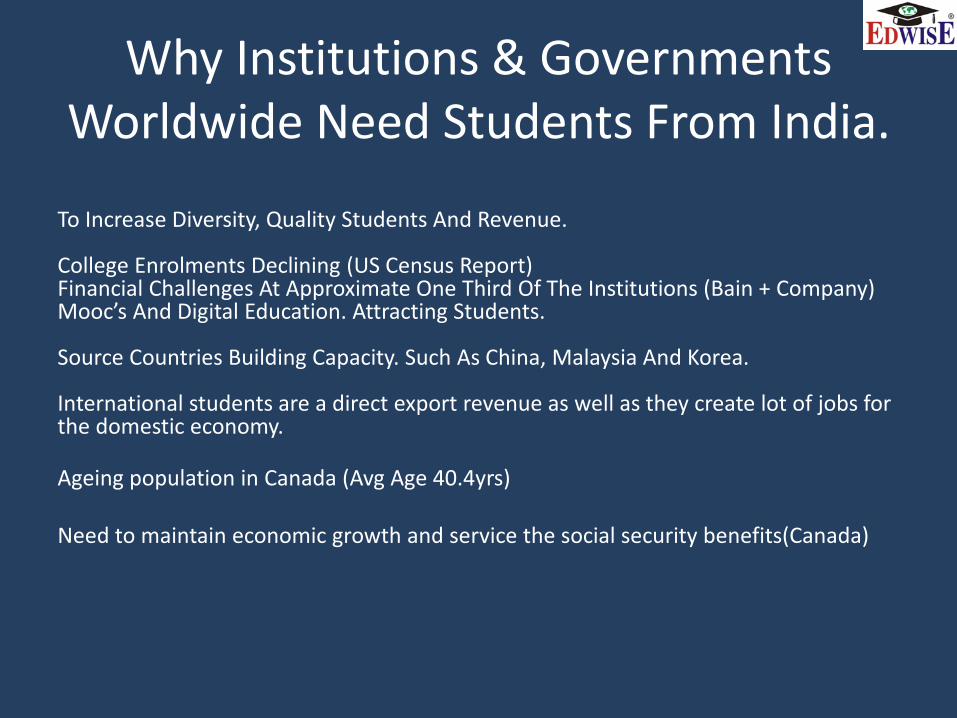
Why Institutions & Governments Worldwide Need Students From India.
To Increase Diversity, Quality Students And Revenue.
College Enrolments Declining (US Census Report)Financial Challenges At Approximate One Third Of The Institutions (Bain + Company) Mooc’s And Digital Education. Attracting Students.
Source Countries Building Capacity. Such As China, Malaysia And Korea.
International students are a direct export revenue as well as they create lot of jobs for the domestic economy.
Ageing population in Canada (Avg Age 40.4yrs)
Need to maintain economic growth and service the social security benefits(Canada)
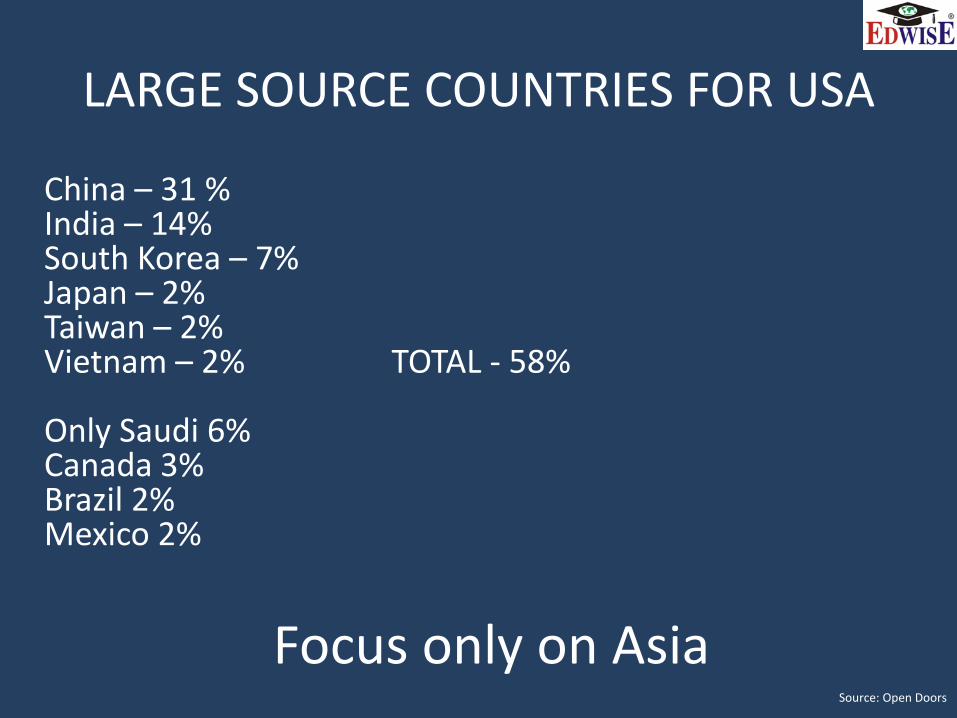
LARGE SOURCE COUNTRIES FOR USA
China – 31 %India – 14%South Korea – 7%Japan – 2%Taiwan – 2%Vietnam – 2% TOTAL - 58%
Only Saudi 6%Canada 3%Brazil 2%Mexico 2%
Focus only on AsiaSource: Open Doors
Source: Dept of Immigration & Border Protection Australia
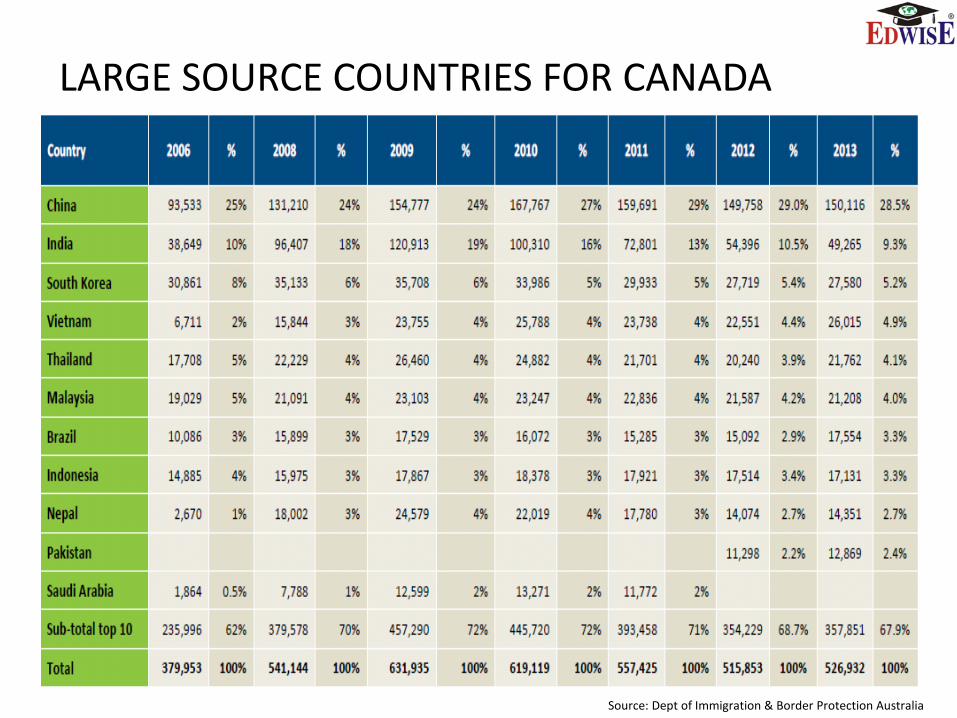
LARGE SOURCE COUNTRIES FOR CANADA
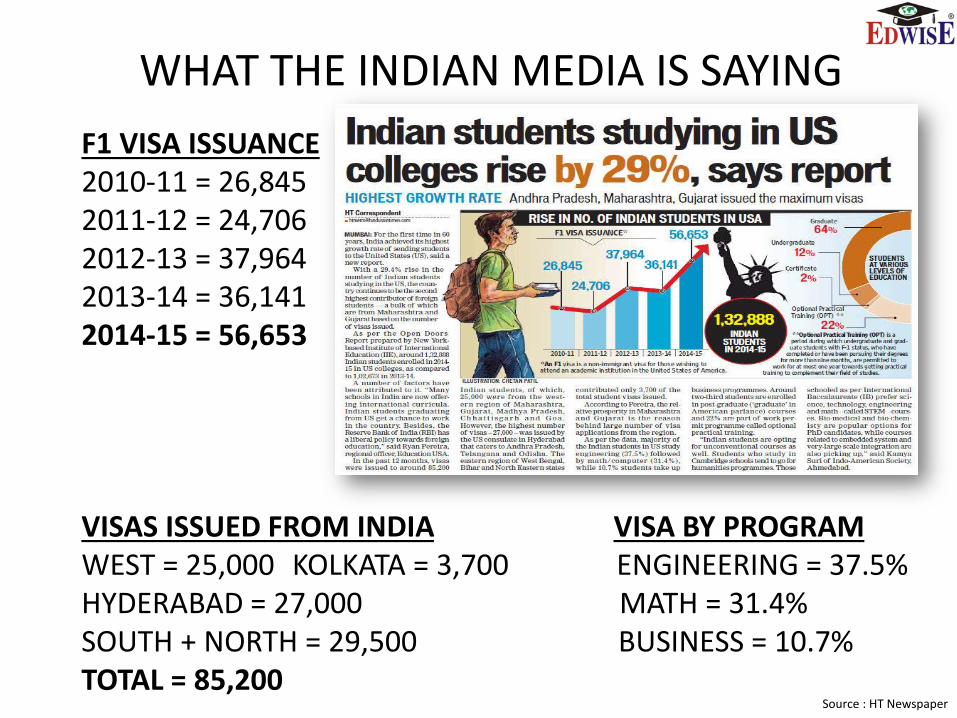
WHAT THE INDIAN MEDIA IS SAYING
F1 VISA ISSUANCE 2010-11 = 26,8452011-12 = 24,7062012-13 = 37,9642013-14 = 36,1412014-15 = 56,653
VISAS ISSUED FROM INDIA VISA BY PROGRAMWEST = 25,000 KOLKATA = 3,700 ENGINEERING = 37.5%HYDERABAD = 27,000 MATH = 31.4%SOUTH + NORTH = 29,500 BUSINESS = 10.7% TOTAL = 85,200
Source : HT Newspaper
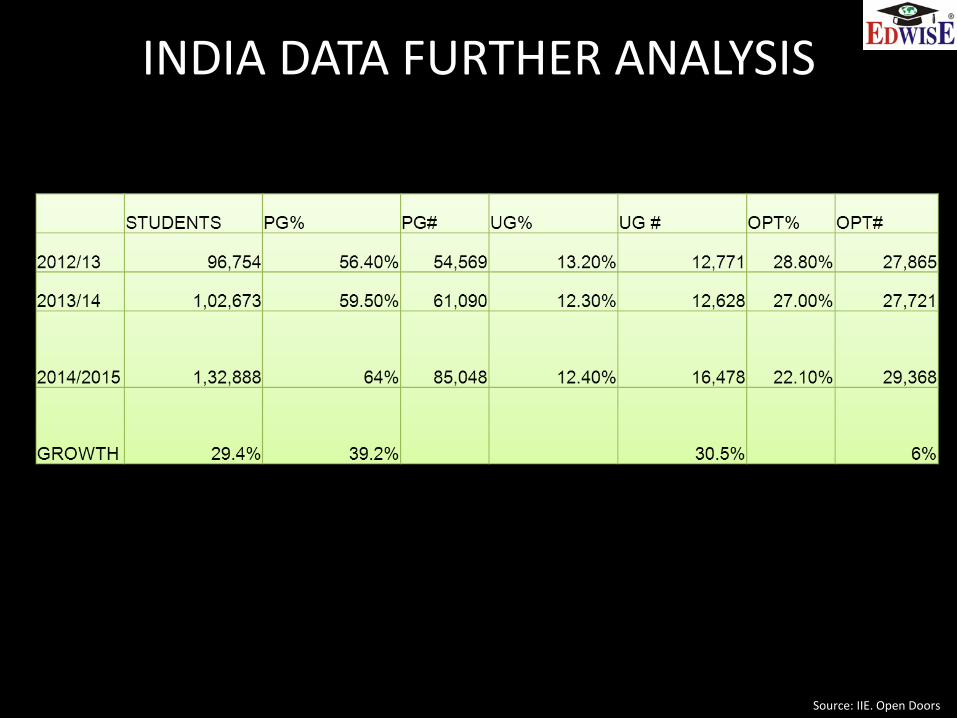
INDIA DATA FURTHER ANALYSIS
Source: IIE. Open Doors
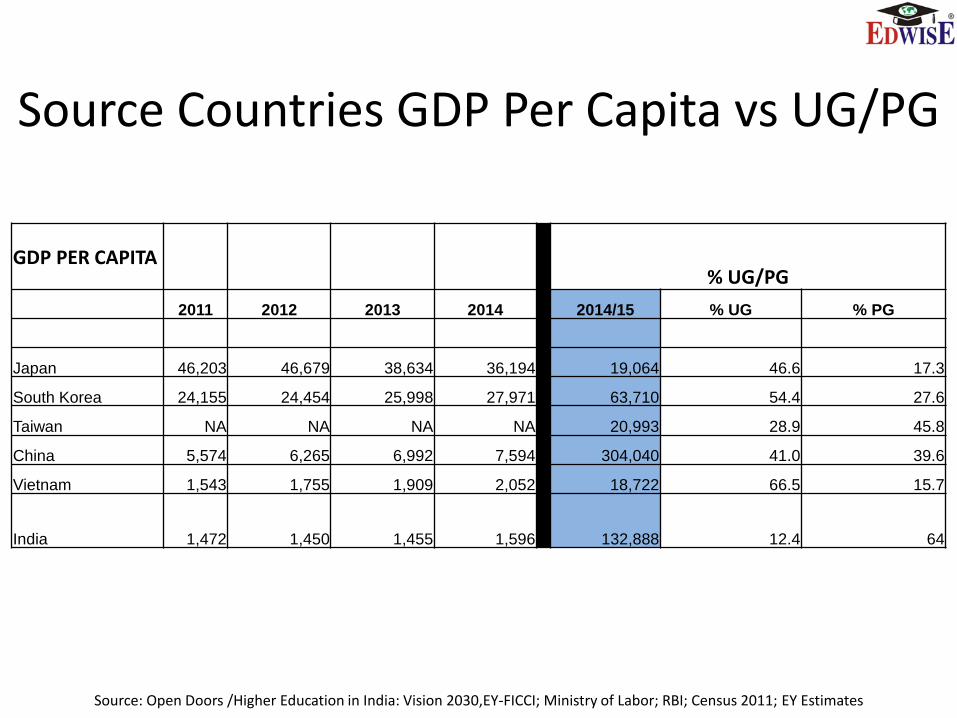
Source Countries GDP Per Capita vs UG/PG
Source: Open Doors /Higher Education in India: Vision 2030,EY-FICCI; Ministry of Labor; RBI; Census 2011; EY Estimates
GDP PER CAPITA% UG/PG
2011 2012 2013 2014 2014/15 % UG % PG
Japan 46,203 46,679 38,634 36,194 19,064 46.6 17.3
South Korea 24,155 24,454 25,998 27,971 63,710 54.4 27.6
Taiwan NA NA NA NA 20,993 28.9 45.8
China 5,574 6,265 6,992 7,594 304,040 41.0 39.6
Vietnam 1,543 1,755 1,909 2,052 18,722 66.5 15.7
India 1,472 1,450 1,455 1,596 132,888 12.4 64
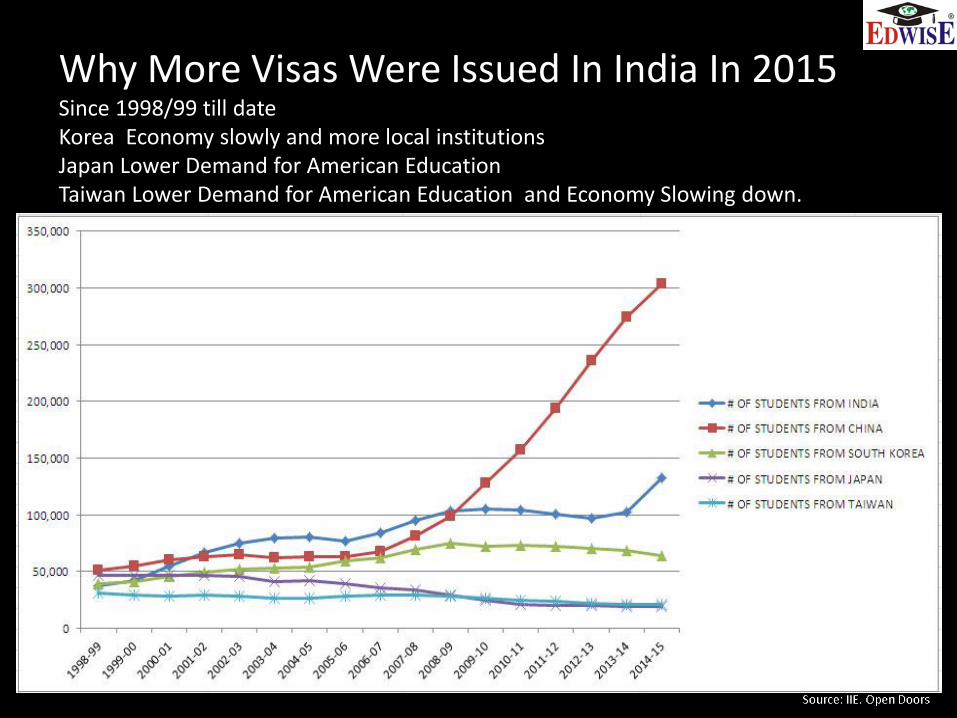
Why More Visas Were Issued In India In 2015Since 1998/99 till date Korea Economy slowly and more local institutions Japan Lower Demand for American Education Taiwan Lower Demand for American Education and Economy Slowing down.
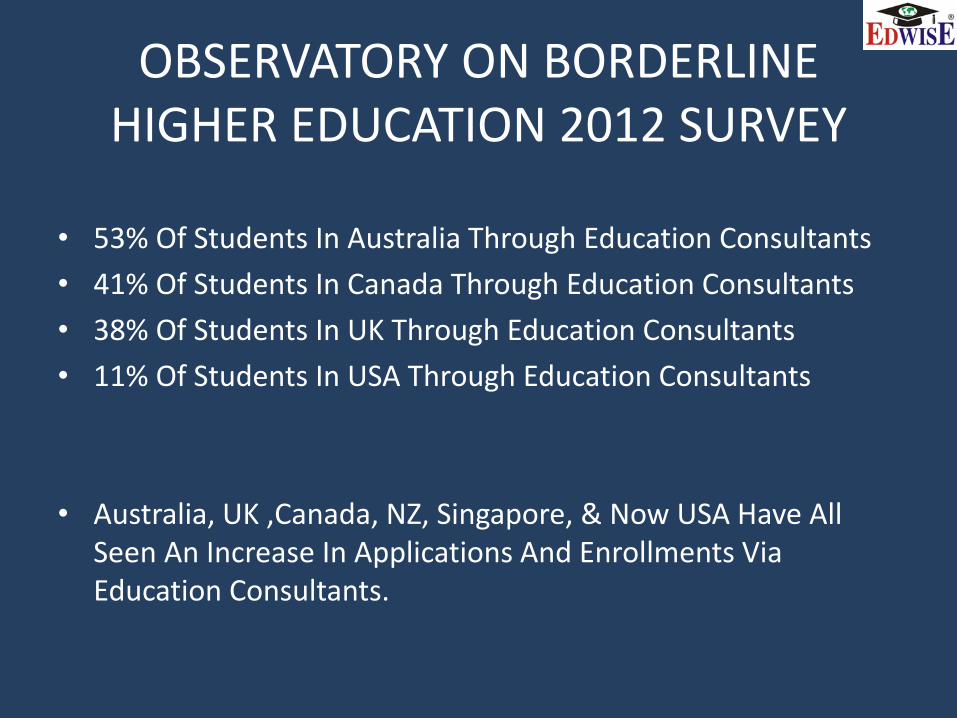
• 53% Of Students In Australia Through Education Consultants
• 41% Of Students In Canada Through Education Consultants
• 38% Of Students In UK Through Education Consultants
• 11% Of Students In USA Through Education Consultants
• Australia, UK ,Canada, NZ, Singapore, & Now USA Have All Seen An Increase In Applications And Enrollments Via Education Consultants.
OBSERVATORY ON BORDERLINE HIGHER EDUCATION 2012 SURVEY
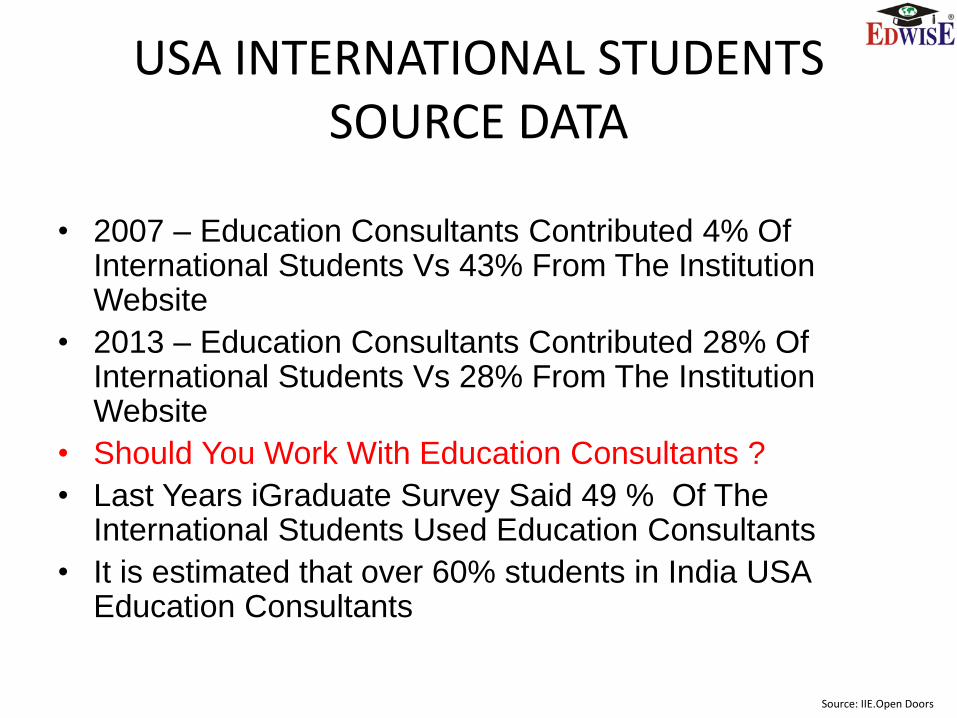
USA INTERNATIONAL STUDENTS SOURCE DATA
• 2007 – Education Consultants Contributed 4% Of International Students Vs 43% From The Institution Website
• 2013 – Education Consultants Contributed 28% Of International Students Vs 28% From The Institution Website
• Should You Work With Education Consultants ?
• Last Years iGraduate Survey Said 49 % Of The International Students Used Education Consultants
• It is estimated that over 60% students in India USA Education Consultants
Source: IIE.Open Doors
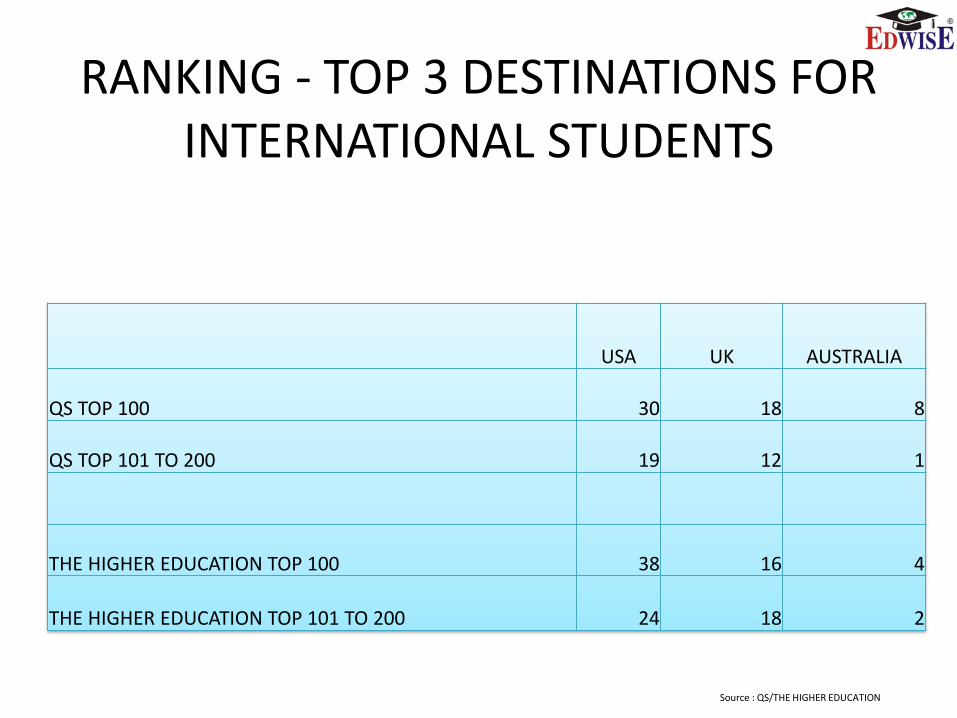
USA UK AUSTRALIA
QS TOP 100 30 18 8
QS TOP 101 TO 200 19 12 1
THE HIGHER EDUCATION TOP 100 38 16 4
THE HIGHER EDUCATION TOP 101 TO 200 24 18 2
RANKING - TOP 3 DESTINATIONS FOR INTERNATIONAL STUDENTS
Source : QS/THE HIGHER EDUCATION
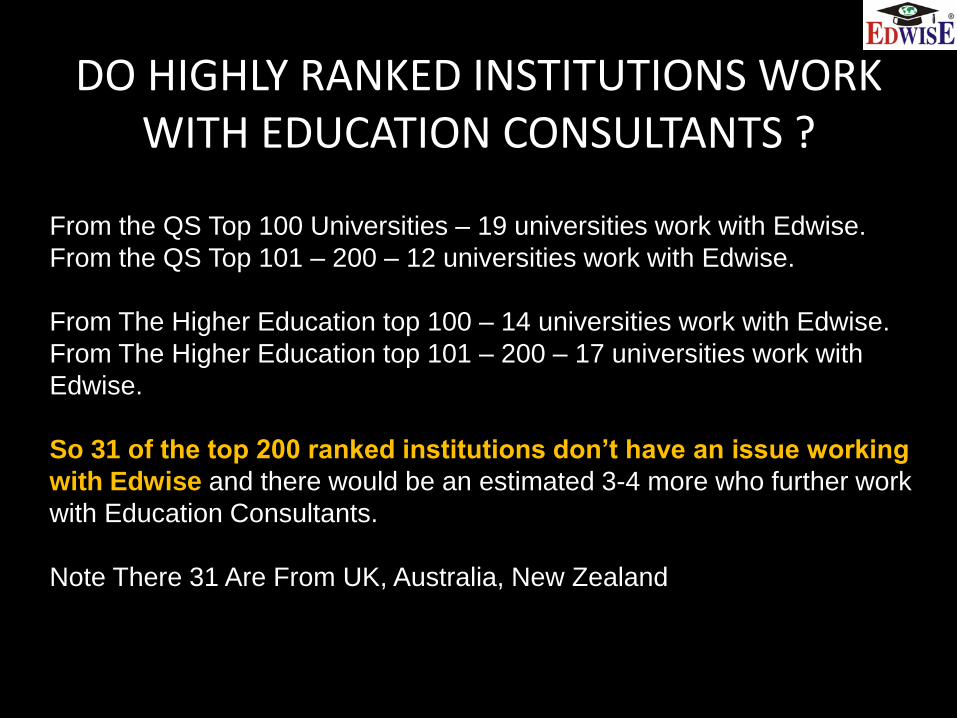
DO HIGHLY RANKED INSTITUTIONS WORK WITH EDUCATION CONSULTANTS ?
From the QS Top 100 Universities – 19 universities work with Edwise.
From the QS Top 101 – 200 – 12 universities work with Edwise.
From The Higher Education top 100 – 14 universities work with Edwise.
From The Higher Education top 101 – 200 – 17 universities work with
Edwise.
So 31 of the top 200 ranked institutions don’t have an issue working
with Edwise and there would be an estimated 3-4 more who further work
with Education Consultants.
Note There 31 Are From UK, Australia, New Zealand
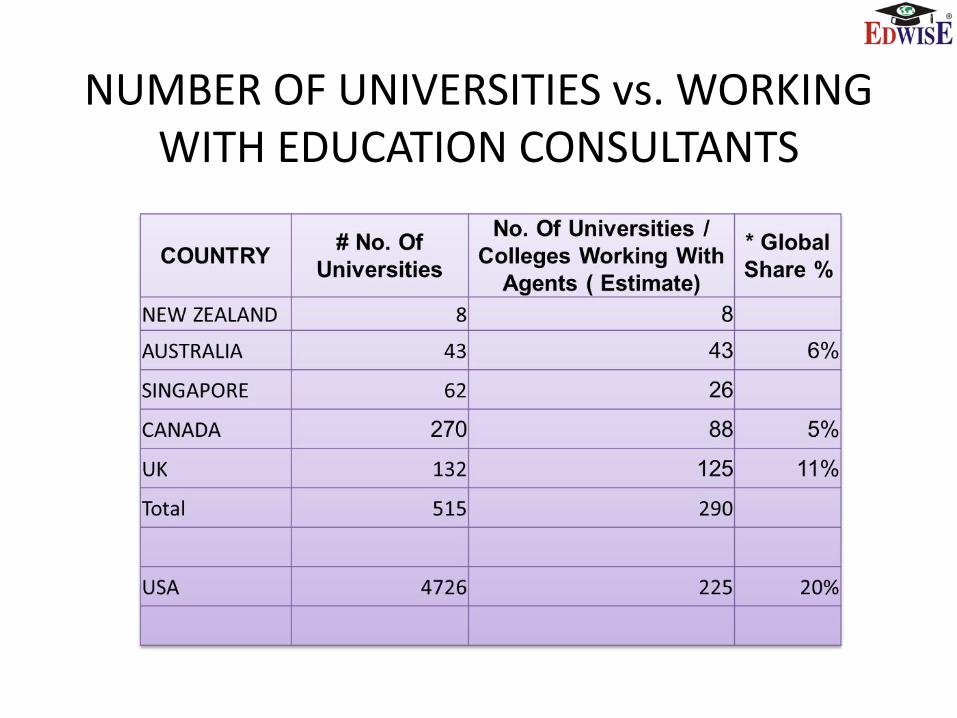
NUMBER OF UNIVERSITIES vs. WORKING WITH EDUCATION CONSULTANTS
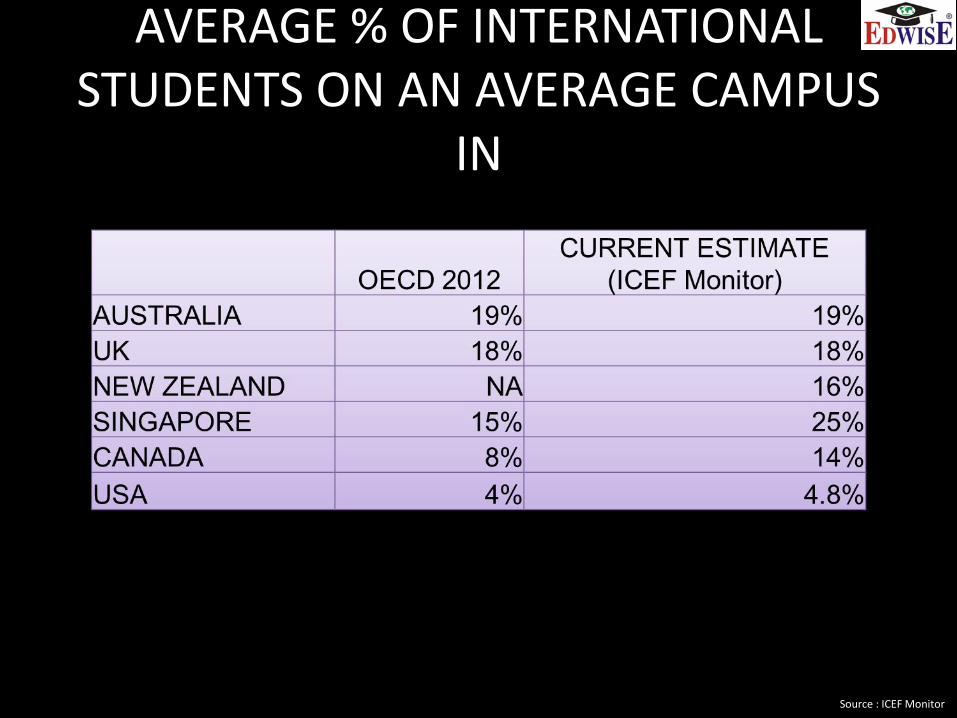
AVERAGE % OF INTERNATIONAL STUDENTS ON AN AVERAGE CAMPUS
IN
Source : ICEF Monitor
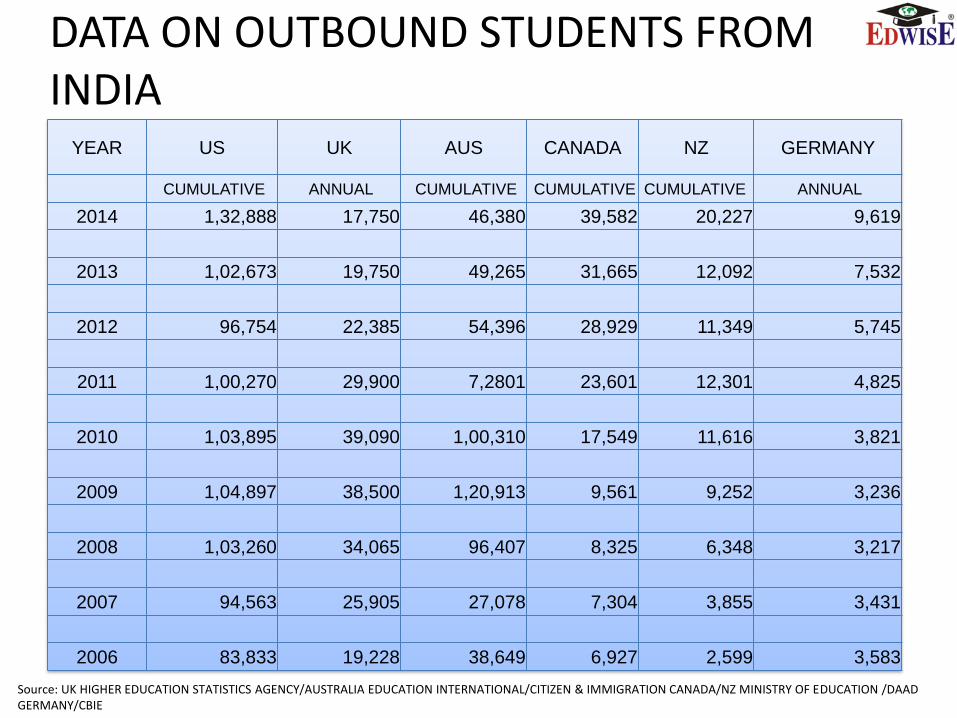
DATA ON OUTBOUND STUDENTS FROM INDIA
YEAR US UK AUS CANADA NZ GERMANY
CUMULATIVE ANNUAL CUMULATIVE CUMULATIVE CUMULATIVE ANNUAL
2014 1,32,888 17,750 46,380 39,582 20,227 9,619
2013 1,02,673 19,750 49,265 31,665 12,092 7,532
2012 96,754 22,385 54,396 28,929 11,349 5,745
2011 1,00,270 29,900 7,2801 23,601 12,301 4,825
2010 1,03,895 39,090 1,00,310 17,549 11,616 3,821
2009 1,04,897 38,500 1,20,913 9,561 9,252 3,236
2008 1,03,260 34,065 96,407 8,325 6,348 3,217
2007 94,563 25,905 27,078 7,304 3,855 3,431
2006 83,833 19,228 38,649 6,927 2,599 3,583
Source: UK HIGHER EDUCATION STATISTICS AGENCY/AUSTRALIA EDUCATION INTERNATIONAL/CITIZEN & IMMIGRATION CANADA/NZ MINISTRY OF EDUCATION /DAAD GERMANY/CBIE
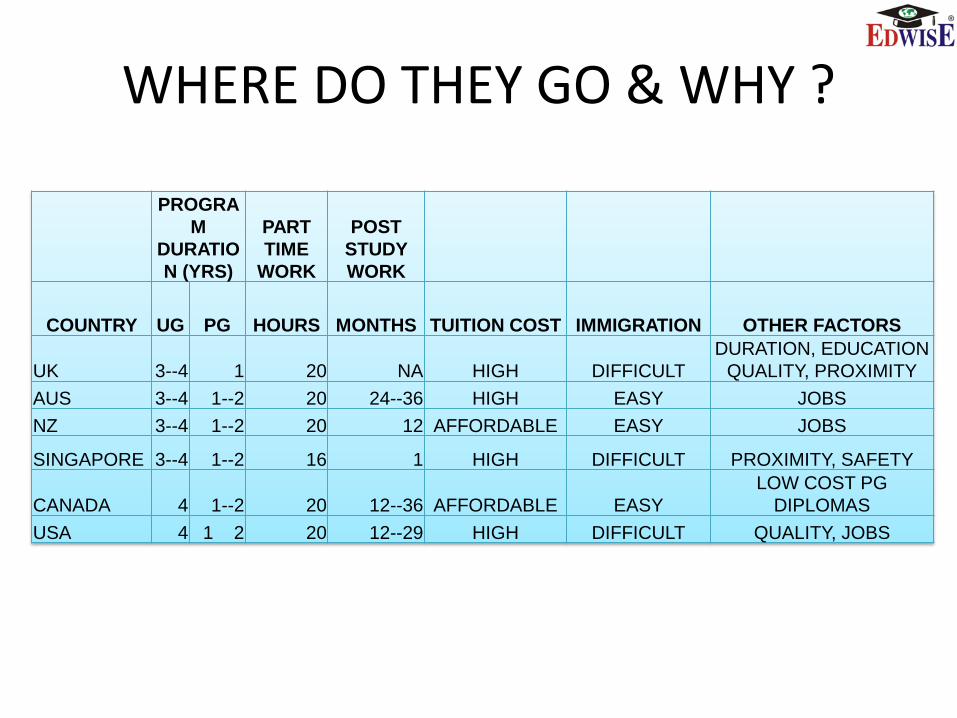
WHERE DO THEY GO & WHY ?
PROGRA
M
DURATIO
N (YRS)
PART
TIME
WORK
POST
STUDY
WORK
COUNTRY UG PG HOURS MONTHS TUITION COST IMMIGRATION OTHER FACTORS
UK 3--4 1 20 NA HIGH DIFFICULT
DURATION, EDUCATION
QUALITY, PROXIMITY
AUS 3--4 1--2 20 24--36 HIGH EASY JOBS
NZ 3--4 1--2 20 12 AFFORDABLE EASY JOBS
SINGAPORE 3--4 1--2 16 1 HIGH DIFFICULT PROXIMITY, SAFETY
CANADA 4 1--2 20 12--36 AFFORDABLE EASY
LOW COST PG
DIPLOMAS
USA 4 1 2 20 12--29 HIGH DIFFICULT QUALITY, JOBS
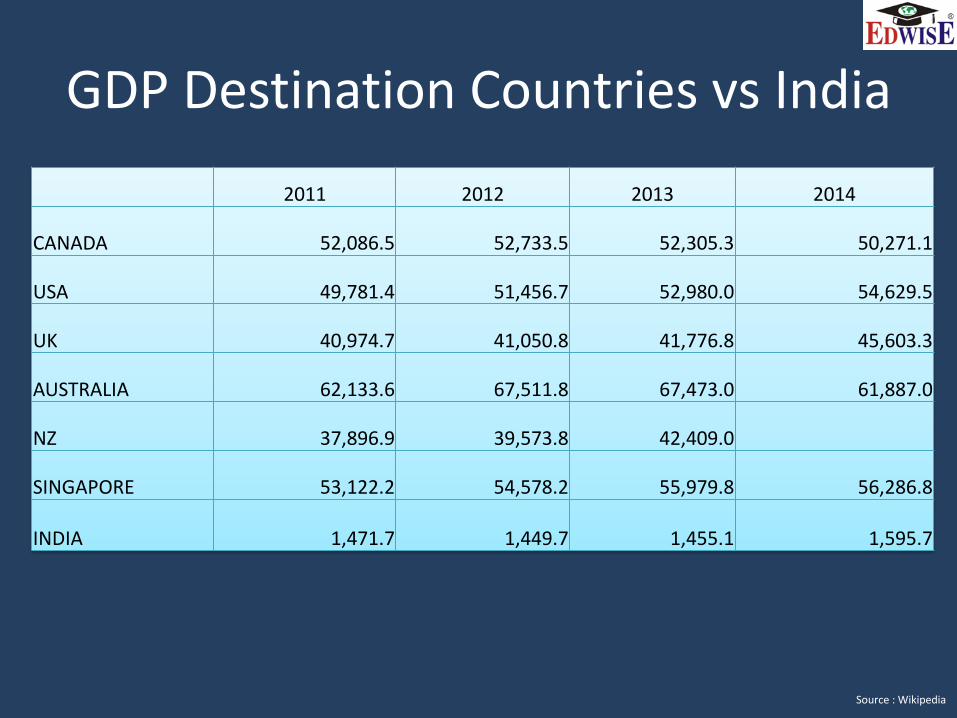
GDP Destination Countries vs India
2011 2012 2013 2014
CANADA 52,086.5 52,733.5 52,305.3 50,271.1
USA 49,781.4 51,456.7 52,980.0 54,629.5
UK 40,974.7 41,050.8 41,776.8 45,603.3
AUSTRALIA 62,133.6 67,511.8 67,473.0 61,887.0
NZ 37,896.9 39,573.8 42,409.0
SINGAPORE 53,122.2 54,578.2 55,979.8 56,286.8
INDIA 1,471.7 1,449.7 1,455.1 1,595.7
Source : Wikipedia
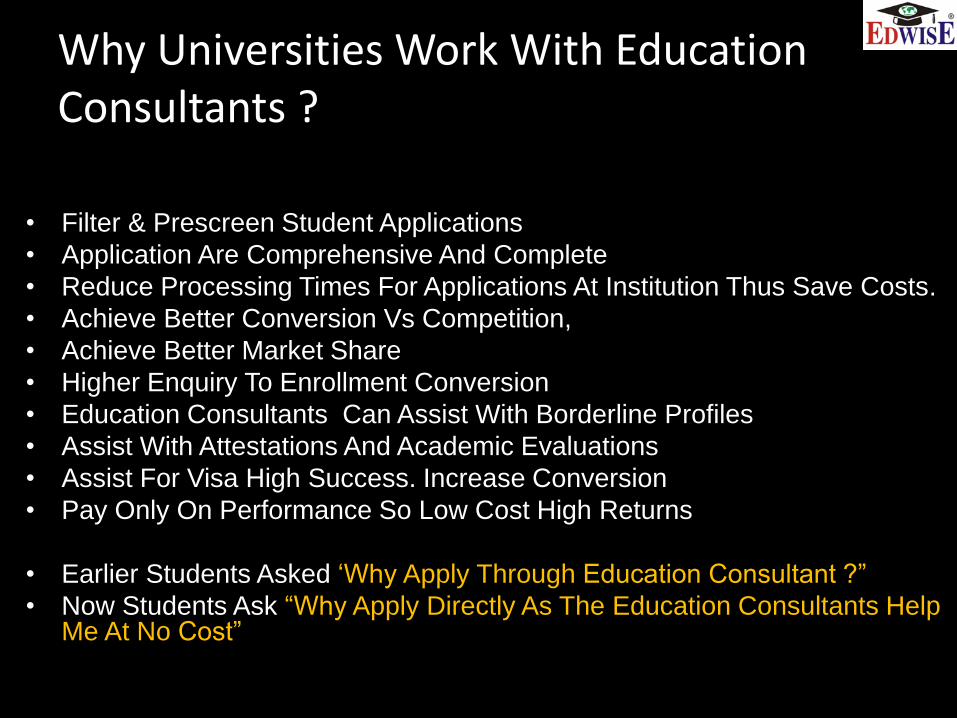
Why Universities Work With Education Consultants ?
.
• Filter & Prescreen Student Applications
• Application Are Comprehensive And Complete
• Reduce Processing Times For Applications At Institution Thus Save Costs.
• Achieve Better Conversion Vs Competition,
• Achieve Better Market Share
• Higher Enquiry To Enrollment Conversion
• Education Consultants Can Assist With Borderline Profiles
• Assist With Attestations And Academic Evaluations
• Assist For Visa High Success. Increase Conversion
• Pay Only On Performance So Low Cost High Returns
• Earlier Students Asked ‘Why Apply Through Education Consultant ?”
• Now Students Ask “Why Apply Directly As The Education Consultants Help Me At No Cost”
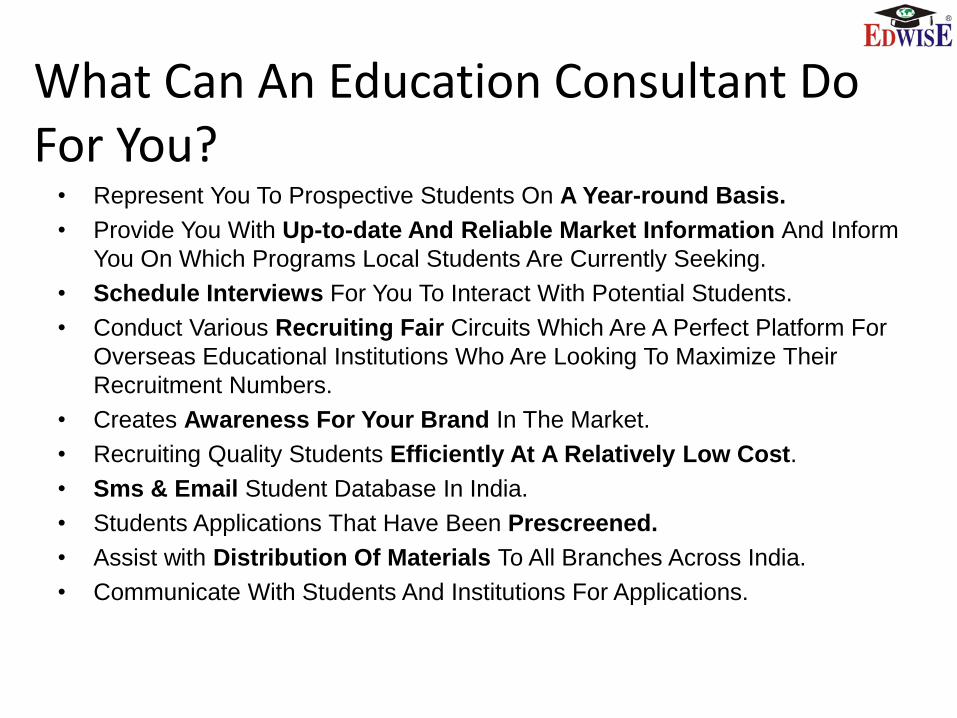
What Can An Education Consultant Do For You?
• Represent You To Prospective Students On A Year-round Basis.
• Provide You With Up-to-date And Reliable Market Information And Inform
You On Which Programs Local Students Are Currently Seeking.
• Schedule Interviews For You To Interact With Potential Students.
• Conduct Various Recruiting Fair Circuits Which Are A Perfect Platform For
Overseas Educational Institutions Who Are Looking To Maximize Their
Recruitment Numbers.
• Creates Awareness For Your Brand In The Market.
• Recruiting Quality Students Efficiently At A Relatively Low Cost.
• Sms & Email Student Database In India.
• Students Applications That Have Been Prescreened.
• Assist with Distribution Of Materials To All Branches Across India.
• Communicate With Students And Institutions For Applications.
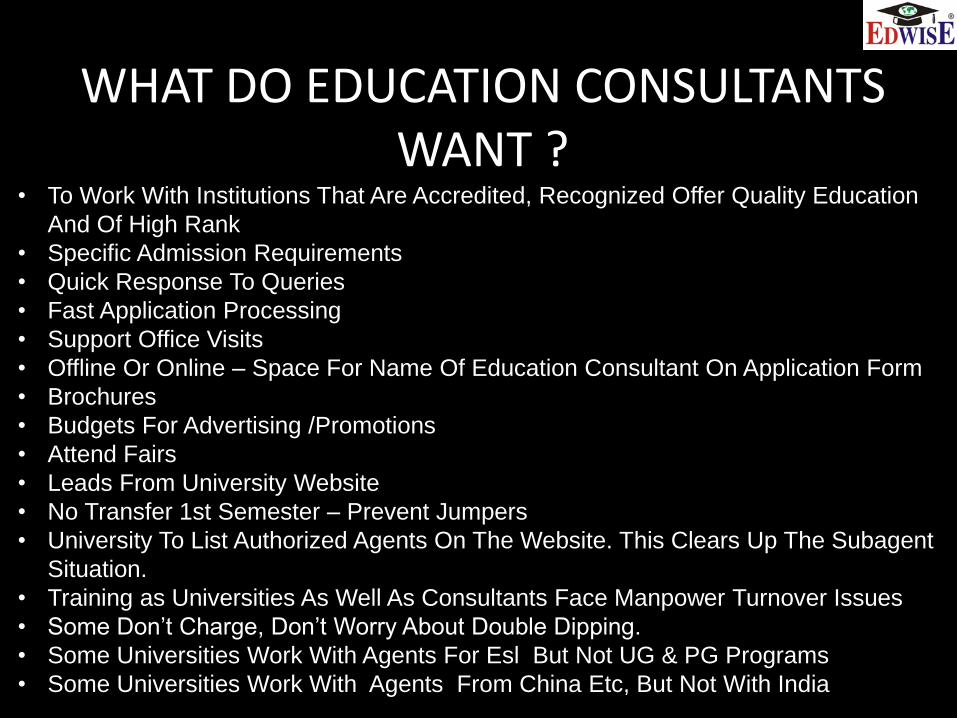
WHAT DO EDUCATION CONSULTANTS WANT ?
• To Work With Institutions That Are Accredited, Recognized Offer Quality Education
And Of High Rank
• Specific Admission Requirements
• Quick Response To Queries
• Fast Application Processing
• Support Office Visits
• Offline Or Online – Space For Name Of Education Consultant On Application Form
• Brochures
• Budgets For Advertising /Promotions
• Attend Fairs
• Leads From University Website
• No Transfer 1st Semester – Prevent Jumpers
• University To List Authorized Agents On The Website. This Clears Up The Subagent
Situation.
• Training as Universities As Well As Consultants Face Manpower Turnover Issues
• Some Don’t Charge, Don’t Worry About Double Dipping.
• Some Universities Work With Agents For Esl But Not UG & PG Programs
• Some Universities Work With Agents From China Etc, But Not With India
HOW MANY EDUCATION CONSULTANTS
Focus On Regionally Strong As Well As National Players
Reputed And Established - Take References From Institutions
AIRC Certified
Cautious With Those Who Work With Sub Agents – Ensure Quality Checks
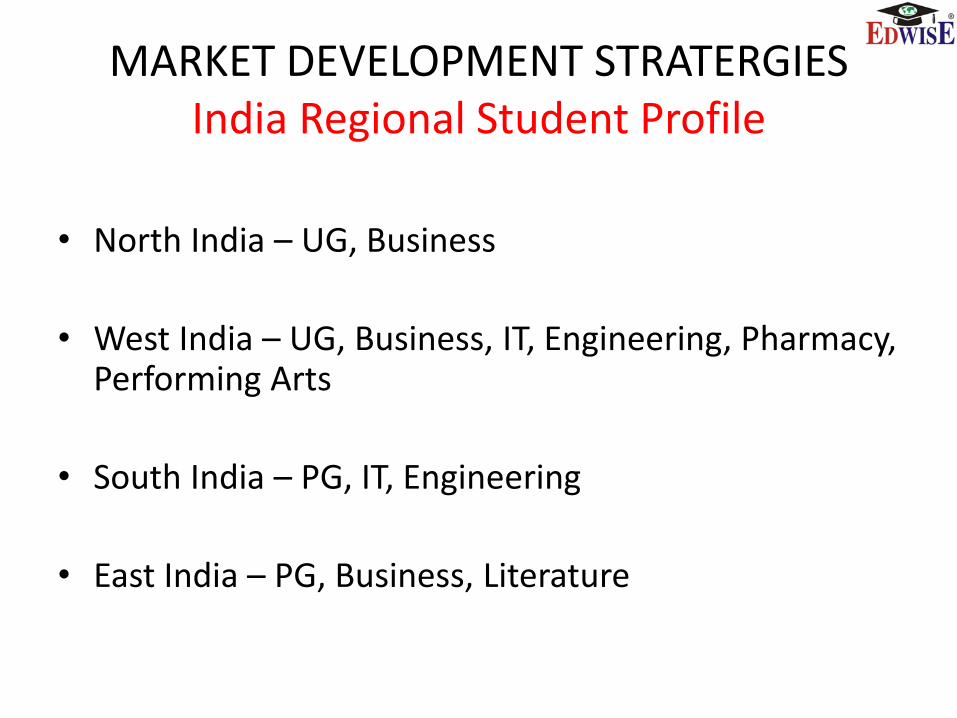
MARKET DEVELOPMENT STRATERGIES India Regional Student Profile
• North India – UG, Business
• West India – UG, Business, IT, Engineering, Pharmacy, Performing Arts
• South India – PG, IT, Engineering
• East India – PG, Business, Literature

OFFICE VISITS
• Meet Staff Build Relationships
• Training Counselors
• Institutions And Agents Face Manpower Turnover
• Update On Local Market Situation
• Meet Parents And Students
• Interview To Feel Right Match
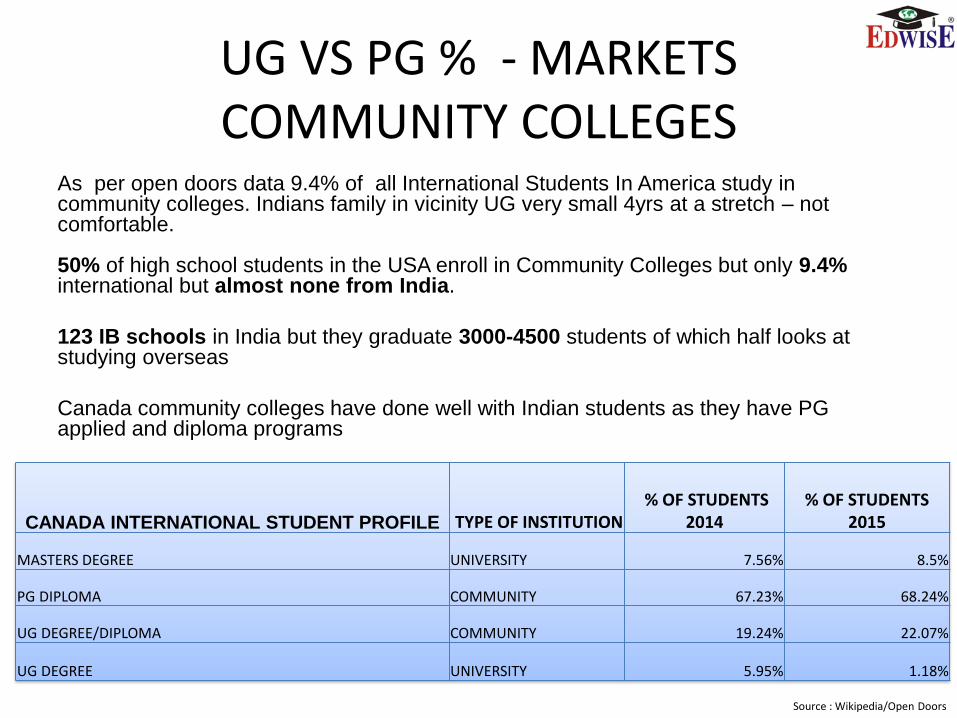
UG VS PG % - MARKETSCOMMUNITY COLLEGES
As per open doors data 9.4% of all International Students In America study in community colleges. Indians family in vicinity UG very small 4yrs at a stretch – not comfortable.
50% of high school students in the USA enroll in Community Colleges but only 9.4% international but almost none from India.
123 IB schools in India but they graduate 3000-4500 students of which half looks at studying overseas
Canada community colleges have done well with Indian students as they have PG applied and diploma programs
CANADA INTERNATIONAL STUDENT PROFILE TYPE OF INSTITUTION% OF STUDENTS
2014% OF STUDENTS
2015
MASTERS DEGREE UNIVERSITY 7.56% 8.5%
PG DIPLOMA COMMUNITY 67.23% 68.24%
UG DEGREE/DIPLOMA COMMUNITY 19.24% 22.07%
UG DEGREE UNIVERSITY 5.95% 1.18%
Source : Wikipedia/Open Doors
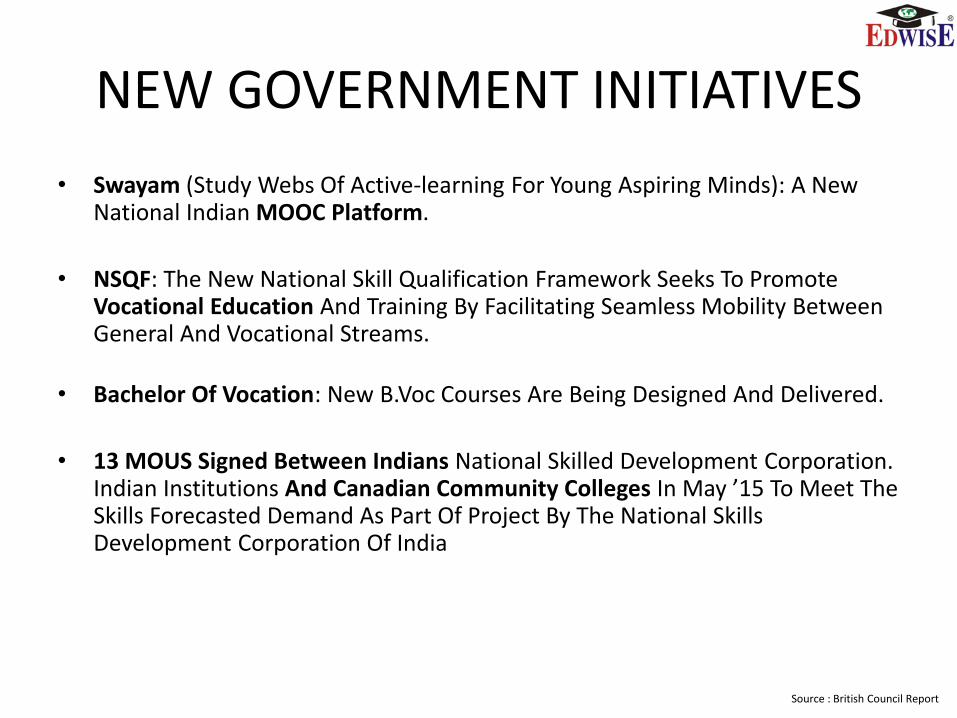
NEW GOVERNMENT INITIATIVES
• Swayam (Study Webs Of Active-learning For Young Aspiring Minds): A New National Indian MOOC Platform.
• NSQF: The New National Skill Qualification Framework Seeks To Promote Vocational Education And Training By Facilitating Seamless Mobility Between General And Vocational Streams.
• Bachelor Of Vocation: New B.Voc Courses Are Being Designed And Delivered.
• 13 MOUS Signed Between Indians National Skilled Development Corporation. Indian Institutions And Canadian Community Colleges In May ’15 To Meet The Skills Forecasted Demand As Part Of Project By The National Skills Development Corporation Of India
Source : British Council Report
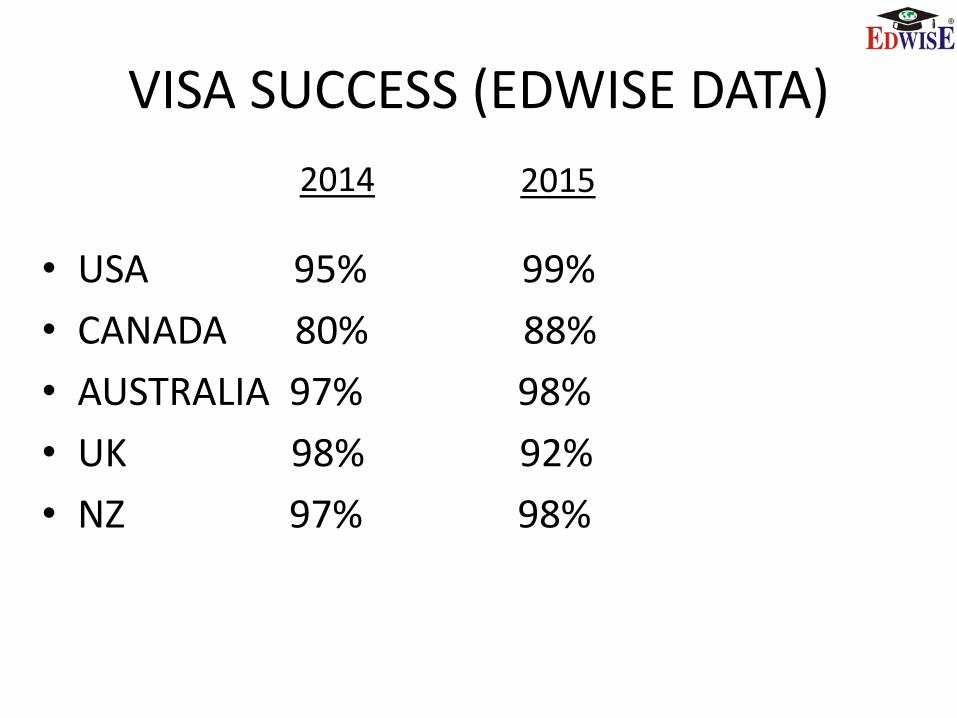
VISA SUCCESS (EDWISE DATA)
• USA 95% 99%
• CANADA 80% 88%
• AUSTRALIA 97% 98%
• UK 98% 92%
• NZ 97% 98%
2014 2015
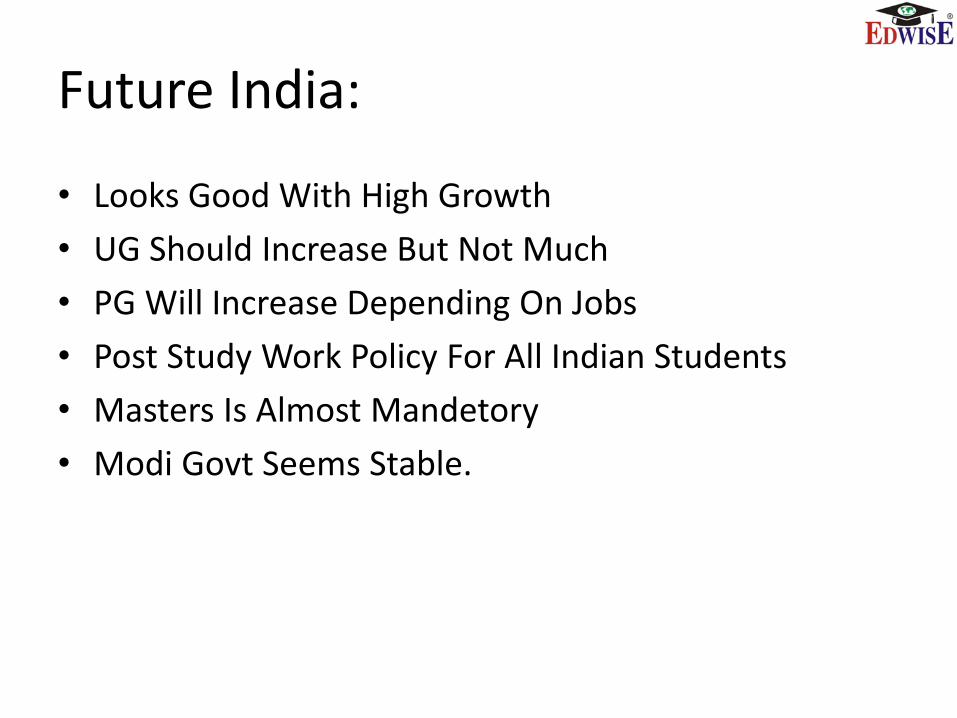
Future India:
• Looks Good With High Growth
• UG Should Increase But Not Much
• PG Will Increase Depending On Jobs
• Post Study Work Policy For All Indian Students
• Masters Is Almost Mandetory
• Modi Govt Seems Stable.
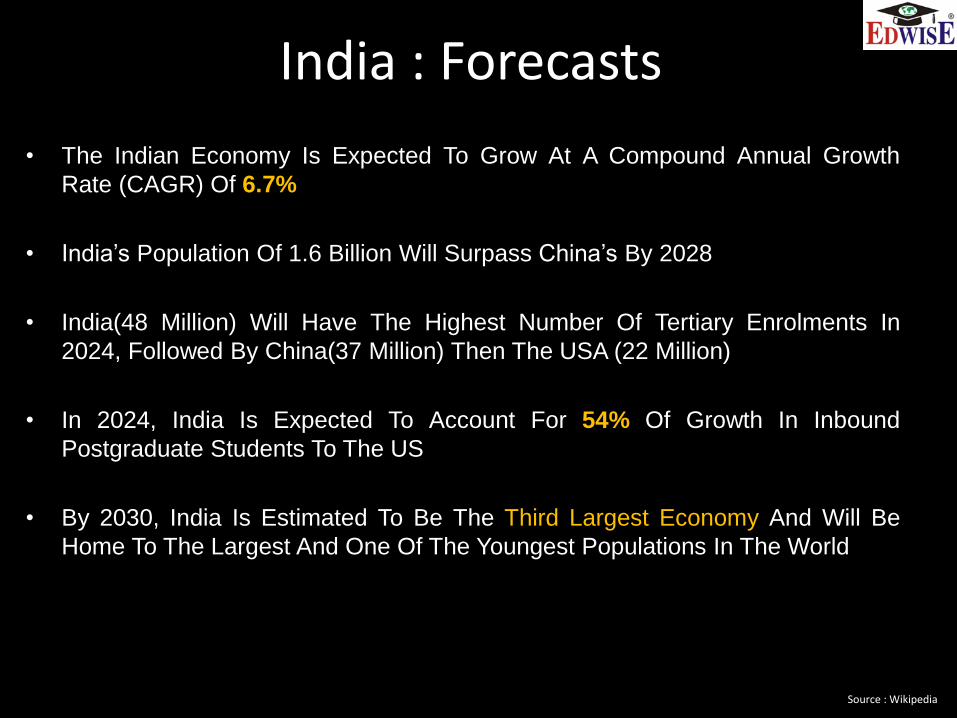
India : Forecasts
• The Indian Economy Is Expected To Grow At A Compound Annual Growth
Rate (CAGR) Of 6.7%
• India’s Population Of 1.6 Billion Will Surpass China’s By 2028
• India(48 Million) Will Have The Highest Number Of Tertiary Enrolments In
2024, Followed By China(37 Million) Then The USA (22 Million)
• In 2024, India Is Expected To Account For 54% Of Growth In Inbound
Postgraduate Students To The US
• By 2030, India Is Estimated To Be The Third Largest Economy And Will Be
Home To The Largest And One Of The Youngest Populations In The World
Source : Wikipedia
Sushil Sukhwani, Founder Director Of Edwise.
Contact :(+91) 022 4081 3456
Universities aiming to increase students from across India are encouraged to participate
in the World Education Fair organized by Edwise . Edwise has organized over a 150 fairs
in the last 6 years in cities like :
Ahmedabad Cochin Indore Surat
Bangalore Coimbatore Kolkata Trivandrum
Chennai Delhi Mumbai Vadodara
Chandigarh Hyderabad Pune Vizag
Kindly contact [email protected] or [email protected] for
any further information on the fairs or visit www.worldeducationfair.com