record and analyze power supply problems simultaneously
TRANSCRIPT

Record and Analyze Power Supply Problems Simultaneously with a Single Unit
The New World Standard for Power Quality Analysis
POWER QUALITY ANALYZER PW3198
Never Miss the Moment ● Detect power supply problems and perform onsite troubleshooting
● Do preventive maintenance to avert accidents by managing the power quality
CAT IV-600V Safety Standard ● Meets the CAT IV safety rating required to check an incoming power line
● Safe enough to measure up to 6,000Vpeak of transient overvoltage
Easy Setup Function with PRESETS ● Just select the measurement course, wiring, and clamps
● Automatic one-step setup based on measurement conditions
Compliant with International Standards ● International power quality measurement standard IEC 61000-4-30 Edition 2 Class A ● High precision with a basic voltage measurement accuracy of 0.1%
AC FLEXIBLE CURRENT SENSOR Introducing 2 new variations with a thinner cable!
Easy to loop around, even in confined spaces
CT9667-01
φ100 mm (3.94”) CT9667-02
φ180 mm (7.09”)
Cable diameterφ13 mm(0.51”)
Legacy product
New additions
CT9667-01, -02Cable diameterφ7.4 mm(0.29”)

2
2
One Single Unit Can Solve All Your Power Supply Problems
The number of power supply problems is increasing as power systems are becoming more and more complicated - all due to the rising use of power electronics devices plus a growing installed base of large systems and distributed power supplies. The quickest way to approach these problems is to understand the situation quickly and accurately. The PW3198 Power Quality Analyzer is ready to effectively solve your power supply problems.
Troubleshooting 4 Understand the actual power situation at the site where the problem is occurring (e.g., the equipment malfunction, fail-
ure, reset, overheating, or burning damage). 4 Ideal for troubleshooting solar and wind power generation systems, EV charge stations, smart grids, tooling machines,
OA equipment (e.g., computers, printers, and UPS), medical equipment, server rooms, and electrical equipment (e.g., transformers and phase-advancing capacitors).
Field Survey and Preventive Maintenance 4 Perform long-term measurements of the power quality and study problems that are difficult to detect or that occur intermit-
tently. 4 Maintain electrical equipment and check the operation of solar and wind power generation systems. 4 Manage the parameters with a control set point, such as a voltage fluctuation, flicker, and harmonic voltage.
Power (Load) Survey 4 Study the power consumption and confirm system capacity before adding load.
3
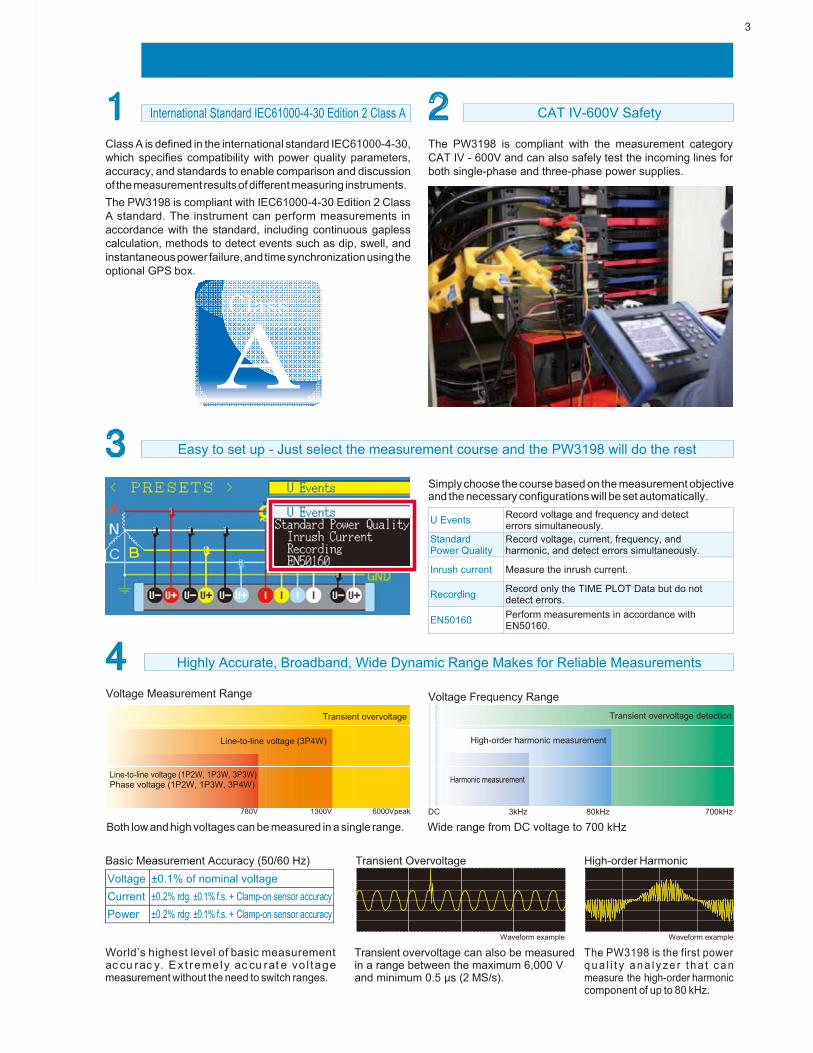
International Standard IEC61000-4-30 Edition 2 Class A
1 2 Class A is defined in the international standard IEC61000-4-30, which specifies compatibility with power quality parameters, accuracy, and standards to enable comparison and discussion of the measurement results of different measuring instruments.
The PW3198 is compliant with IEC61000-4-30 Edition 2 Class A standard. The instrument can perform measurements in accordance with the standard, including continuous gapless calculation, methods to detect events such as dip, swell, and instantaneous power failure, and time synchronization using the optional GPS box.
3
Voltage Measurement Range
The PW3198 is compliant with the measurement category CAT IV - 600V and can also safely test the incoming lines for both single-phase and three-phase power supplies.
Simply choose the course based on the measurement objective and the necessary configurations will be set automatically.
U Events Record voltage and frequency and detect errors simultaneously.
Standard Power Quality
Record voltage, current, frequency, and harmonic, and detect errors simultaneously.
Inrush current Measure the inrush current.
Recording Record only the TIME PLOT Data but do not detect errors.
EN50160 Perform measurements in accordance with EN50160.
Voltage Frequency Range
780V 1300V 6000Vpeak DC 3kHz 80kHz 700kHz
Both low and high voltages can be measured in a single range. Wide range from DC voltage to 700 kHz
Basic Measurement Accuracy (50/60 Hz)
Voltage ±0.1% of nominal voltage
Current ±0.2% rdg. ±0.1% f.s. + Clamp-on sensor accuracy
Power ±0.2% rdg. ±0.1% f.s. + Clamp-on sensor accuracy
World’s highest level of basic measurement ac cu r ac y . E x t r e m e l y ac cu r at e v o l t a g e measurement without the need to switch ranges.
Transient Overvoltage
Waveform example
Transient overvoltage can also be measured in a range between the maximum 6,000 V and minimum 0.5 µs (2 MS/s).
High-order Harmonic
Waveform example
The PW3198 is the first power q u a l i t y a n a l y z e r t h a t c a n measure the high-order harmonic component of up to 80 kHz.
Transient overvoltage detection
High-order harmonic measurement
Harmonic measurement
Transient overvoltage
Line-to-line voltage (3P4W)
Line-to-line voltage (1P2W, 1P3W, 3P3W) Phase voltage (1P2W, 1P3W, 3P4W)
Advanced Features for Safe, Simple, and Accurate Measurements
A Class
4
CAT IV-600V Safety
Easy to set up - Just select the measurement course and the PW3198 will do the rest
Highly Accurate, Broadband, Wide Dynamic Range Makes for Reliable Measurements
10
n Switch windows with one touch
power
factor
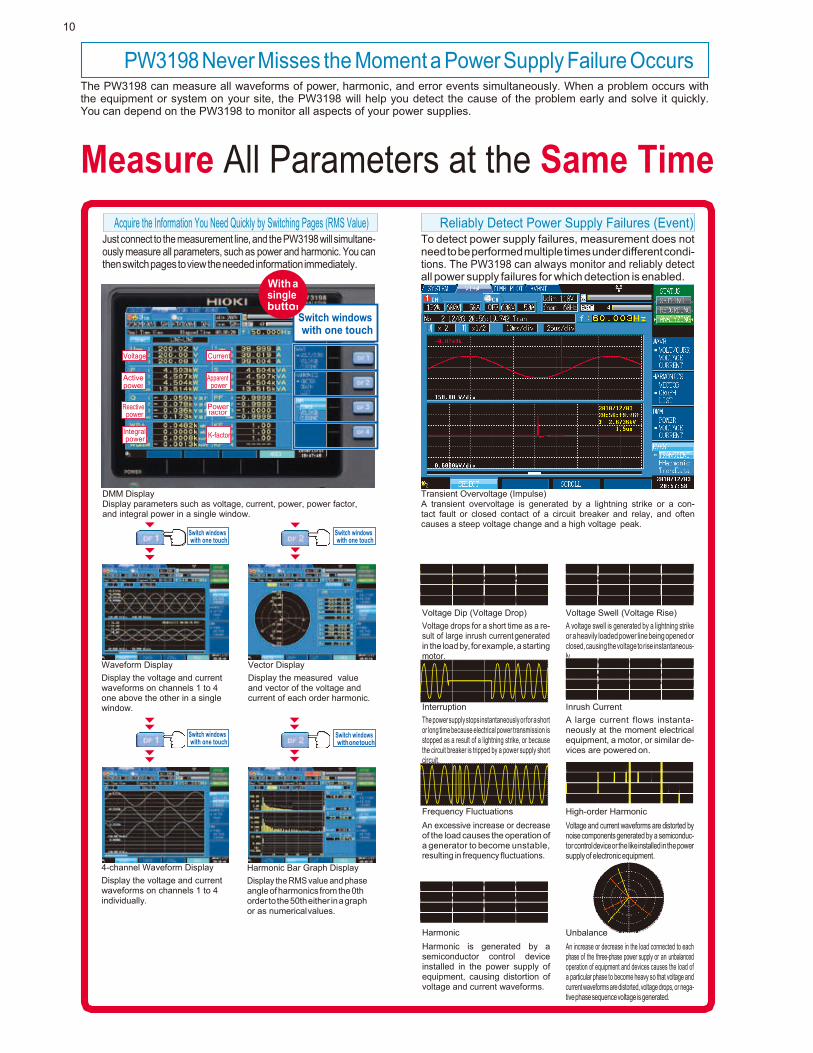
The PW3198 can measure all waveforms of power, harmonic, and error events simultaneously. When a problem occurs with the equipment or system on your site, the PW3198 will help you detect the cause of the problem early and solve it quickly. You can depend on the PW3198 to monitor all aspects of your power supplies.
Measure All Parameters at the Same Time
Just connect to the measurement line, and the PW3198 will simultane- ously measure all parameters, such as power and harmonic. You can then switch pages to view the needed information immediately.
With a single butto
To detect power supply failures, measurement does not need to be performed multiple times under different condi- tions. The PW3198 can always monitor and reliably detect all power supply failures for which detection is enabled.
DMM Display Display parameters such as voltage, current, power, power factor, and integral power in a single window.
Transient Overvoltage (Impulse) A transient overvoltage is generated by a lightning strike or a con- tact fault or closed contact of a circuit breaker and relay, and often causes a steep voltage change and a high voltage peak.
Waveform Display
Display the voltage and current waveforms on channels 1 to 4 one above the other in a single window.
4-channel Waveform Display
Display the voltage and current waveforms on channels 1 to 4 individually.
Vector Display
Display the measured value and vector of the voltage and current of each order harmonic.
Harmonic Bar Graph Display
Display the RMS value and phase angle of harmonics from the 0th order to the 50th either in a graph or as numerical values.
Voltage Dip (Voltage Drop)
Voltage drops for a short time as a re- sult of large inrush current generated in the load by, for example, a starting motor.
Interruption
The power supply stops instantaneously or for a short or long time because electrical power transmission is stopped as a result of a lightning strike, or because the circuit breaker is tripped by a power supply short circuit.
Frequency Fluctuations
An excessive increase or decrease of the load causes the operation of a generator to become unstable, resulting in frequency fluctuations.
Harmonic
Harmonic is generated by a semiconductor control device installed in the power supply of equipment, causing distortion of voltage and current waveforms.
Voltage Swell (Voltage Rise)
A voltage swell is generated by a lightning strike or a heavily loaded power line being opened or closed, causing the voltage to rise instantaneous- ly.
Inrush Current
A large current flows instanta- neously at the moment electrical equipment, a motor, or similar de- vices are powered on.
High-order Harmonic
Voltage and current waveforms are distorted by noise components generated by a semiconduc- tor control device or the like installed in the power supply of electronic equipment.
Unbalance
An increase or decrease in the load connected to each phase of the three-phase power supply or an unbalanced operation of equipment and devices causes the load of a particular phase to become heavy so that voltage and current waveforms are distorted, voltage drops, or nega- tive phase sequence voltage is generated.
Switch windows withonetouch
K-factor Integral power
Current Voltage
Reliably Detect Power Supply Failures (Event)Acquire the Information You Need Quickly by Switching Pages (RMS Value)
PW3198 Never Misses the Moment a Power Supply Failure Occurs
Active Apparent power
Reactive power
Power
Switch windows with one touch
Switch windows with one touch
Switch windows with one touch

5
Simultaneous Recording of and
TIME PLOT Data
TIME PLOT Recording of All Parameters The PW3198 can simultaneously record 8,000 or more parameters, such as voltage, current, power, power factor, frequency, integral power, harmonic, and flicker, at the specified recording interval. The PW3198 never fails to capture the peak because it performs cal- culations continuously and records the maximum, minimum, and average values within the recording interval.
Harmonic Recording
Voltage drop occurred! Flicker and ΔV10 Recording
Trend Recording (TIME PLOT Recording)
Integral Power Recording
Event Waveforms Capture up to 55,000 Instantaneous Waveforms of Power Supply Failures
The PW3198 can record up to 1,000 instantaneous waveforms of power supply failures (up to 55,000 when repeat re- cording is set to ON) while performing TIME PLOT recording.
Event recording of waveforms View waveforms during measurement
Event List Event Waveform
This list records instantaneous waveforms of power supply failures (events), such as a voltage drop or inrush current, along with the time or other information. Events are always monitored, regardless of the recording interval of the TIME PLOT recording.
The PW3198 lets you view the instantaneous waveform (200 ms) of a power supply failure in the window.
Inrush current occurs RMS va lue c han ges over 30 seconds When a voltage drop or i n ru sh c u r re n t o cc u rs , RMS value changes are recorded over 30 seconds
Voltage drop caused by inrush current simultaneously. This func- tion can also be used to check the voltage drop caused by inrush current generated by the start of
the motor. 30 seconds
Event details
Power consumption
Switch windows with one touch
Event list
Event waveforms
TIME PLOT Data Event Waveforms
Regenerative power

6
Analyze Recorded Data with a PC Using Application Software 9624-50 PQA-HiVIEW PRO
Use Model 9624-50 PQA-HiVIEW PRO (version 2.00 or later) with a PC to analyze the data collected by the PW3198.
Display and analyze the data recorded by the PW3198 POWER QUALITY ANALYZER.
Event List Window Display a list of power supply failures (events) that occurred.
TIME PLOT Window Display the TIME PLOT (recorded trend) data as well as changes in the voltage/current RMS values, har- monic, and many other parameters.
Event Waveform Window Display the waveform of an event that occurred, plus the vector, harmonic, DMM, and instantaneous har- monic values.
ITIC Curve Display Window Analyze the ITIC (CBEMA) curve (tolerance curve) used in the power quality standards in the United States.
Status Window Transient Waveform Window Inrush Current Event Graph Window Harmonics TIME PLOT Window
Automatically and effortlessly create rich reports for compliance and record management. Report output items: Voltage/current RMS value fluctuation graph, harmonic fluctuation graph, inter-harmonics fluctuation graph, flicker graph, integral power graph, demand graph,
total harmonic voltage/current distortion rate list, EN50160 window (Overview, Harmonic, Measurement Results Category), worst case, transient waveform, maximum/minimum value list, all event waveforms/detailed list, and setup list
Print Examples
RMS Value Voltage Fluctuations All Event Detailed List TIME PLOT Recording of Parameters EN50160
CSV Conversion of Measurement Data Download Measurement Data via USB/LAN Convert data in the range specified in the TIME PLOT window into CSV format and then save for further processing. The 9624-50 can also convert event waveforms into CSV format. Open CSV data using any commercially available spreadsheet soft- ware for advanced data management and analysis.
Even Analyze Data Recorded with Models 3196 and 3197 PQAs Data recorded with the HIOKI 3196 and 3197 Power Quality Analyzers can also be analyzed.
Data in the SD memory card inserted in the PW3198 can be downloaded to a PC via USB or LAN.
EN50160 Display Function EN50160 is a power quality standard for the EU. In this mode, evaluate and analyze power quality in accordance with the standard. You can display the Overview, Harmonic, and Measurement Results Category windows.
9624-50 Specifications Delivery media CD-R
Operating environment AT-compatible PC
OS Windows10, Windows8, Windows7
Memory 512 MB or more
Other Functions
Report Creation Function
Viewer Function

7
Data is recorded to a large capacity SD memory card. The data can be transferred to a PC and analyzed using dedicated application software. If your PC is not equipped with an SD memory card slot, simply connect a USB cable between the PW3198 and the PC. The PC will then recognize the SD memory card as removable media.
Apart from the main measurement line, you can also measure the AC/DC voltage on another line using Channel 4.
Yes! Simultaneously!
• Measure the primary and secondary sides of UPS
• Two-line voltage analysis
• Measure three-phase lines and grounding wire
• Measure neutral lines to detect short circuits
• Measure the input and output of a DC-AC converter for solar power generation
ch1, ch2, ch3 ch4
You can use any Internet browser to remotely operate the PW3198, plus download the data stored in the SD memory card using dedicated software (LAN access required).
Conduct off-site remote control with a tablet PC using a wireless LAN router
In addition to current sensors for measuring 100A AC, 500A AC, 1000A AC and 5000A AC rated currents, a 5A AC sensor is also available. In addition, HIOKI’s CLAMP ON LEAK SENSORS enable you to accurately measure for leakage current down to the mA level, while the new CT7700 AC/DC AUTO-ZERO CURRENT SENSOR further widen applications by supporting DC current testing.
T h e P W 9 0 0 5 G P S B O X le t s y o u synchronize the clock on the PW3198 to the UTC standard time. Eliminate time differences between multiple PQAs and correctly analyze measurement data
The PW3198 uses the new large capacity BATTERY PACK Z1003, enabling continuous measurement for three hours even if a power failure occurs. In addition, a power failure processing function restarts measurement automatically even if the power is cut off completely during measurement.
taken by several instruments. Previous model 6 times the battery life!
PW3198
30 minutes 180 minutes
Flicker measurement Measure flicker in conformance with IEC 61000-4-15 Ed2. Phase voltage check for Δ connection Use the Δ-Y and Y-Δ conversion function to measure phase voltage using a virtual neutral point. 400 Hz line measurement Measure at a power line frequency of 50/60 Hz as well as 400 Hz.
Backup and Recovery from Power Failure GPS Time Synchronization
An Assortment of Clamp-on Sensors Covers a Broad Range of Measurements Remote Measurement Using HTTP Server Function
Repeat record Recording period
OFF Max. 35 days Reference value: ALL DATA (all items recorded), repeat record- ing OFF, and TIME PLOT interval 1 minute or longer)
ON
Max. 55 weeks (about 1 year) Reference value: ALL DATA (all items recorded), repeat recording ON (1 week x 55 times), and TIME PLOT interval 10 minutes or lon-ger)
Useful Functions for a Wide Variety of Applications
Large Capacity Recording with SD memory card Simultaneously Measure Three-phase Lines and Grounding Wire
Other Measurement Applications

8
Voltage drop occurs periodically
S
M
S
M
M
A
urvey Objective The power supply of a printer at the office shuts down even
though it is not operated. Equipment other than the printer can also sometimes perform a reset unexpectedly.
easurement Method Setup is very easy. Just install the PW3198 on the site,
and measure the voltage, current, and power. To troubleshoot, just select the clamp-on sensor and wiring, and then select the “U Events” course.
urvey Objective Replacing the equipment with a new one by the service pro-
vider did not improve the malfunction. A survey of the power supply was required to clarify the cause.
easurement Method Select the “U Events” course in the PW3198 in the same way
as with the office equipment example.
Voltage Fluctuation Graph Voltage and Current Waveforms at the Time Voltage Dip Occurs
Analysis Report Analysis Report No failure occurred during the measurement period, but a
periodic voltage drop was confirmed. The voltage drop may have been caused by the periodic start and operation of the electrical equipment connected to the power supply line. Equipment, such as a laser printer, copier, and electrical heater, may start themselves periodically due to residual heat. An instantaneous voltage drop is likely to have been caused by inrush current from equipment that consumes a large amount of power.
It was determined that a voltage dip (voltage drop) occurred and impacted the operation of the equipment. If a voltage dip occurs every day on a regular basis, the probable cause is the start of a large air-conditioning unit, pump, heater, or similar equipment.
Survey Objective
• Maintain a solar power generation system and check its operation (verify the power quality) • Troubleshoot (impact on the peripheral equipment, operation shutdown, etc.)
easurement Method Set up the PW3198 on the site and measure the voltage, cur-
rent, and power. To survey the power quality, select the “Standard power quality measurement” course in the PRESETS menu. To measure the DC voltage, connect channel 4 to the primary side of the solar panel.
Connection Example
Example of Voltage Waveforms at the Time of Line Switching
Example of Determining Inflow or Outflow (Inflow of 5th and 7th Order Harmonic)
nalysis Report All parameters can be recorded simultaneously with a single measurement.
• Identify changes in the output voltage of the power conditioner • Presence or absence of the occurrence of a transient overvoltage • Frequency fluctuation important for system interconnection • Identify changes in the harmonic voltage and current included in the output • Power (AC), integral power (AC), etc.
Surveying a Solar Power Generation System
Voltage waveforms
Voltage dip occurs
Current waveforms
Power Quality Survey Applications
The power supply of the office equipment sometimes shuts down Medical equipment malfunctions
Outflow
Inflow
Outflow
Line
Power conditioner
Solar panel
Primary DC measurement
(ch4)
Secondary AC measurement (ch1 and ch2)
9
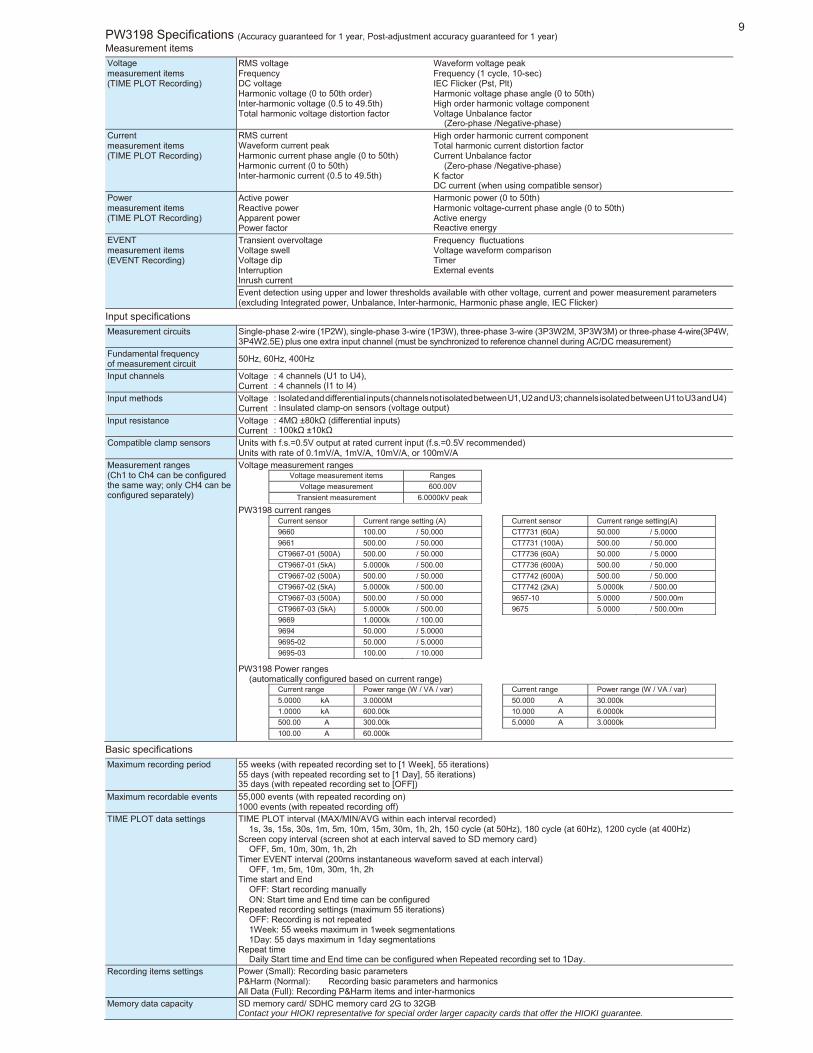
PW3198 Specifications (Accuracy guaranteed for 1 year, Post-adjustment accuracy guaranteed for 1 year) Measurement items
Voltage measurement items (TIME PLOT Recording)
RMS voltage Frequency DC voltage Harmonic voltage (0 to 50th order) Inter-harmonic voltage (0.5 to 49.5th) Total harmonic voltage distortion factor
Waveform voltage peak Frequency (1 cycle, 10-sec) IEC Flicker (Pst, Plt) Harmonic voltage phase angle (0 to 50th) High order harmonic voltage component Voltage Unbalance factor
(Zero-phase /Negative-phase)
Current measurement items (TIME PLOT Recording)
RMS current Waveform current peak Harmonic current phase angle (0 to 50th) Harmonic current (0 to 50th) Inter-harmonic current (0.5 to 49.5th)
High order harmonic current component Total harmonic current distortion factor Current Unbalance factor
(Zero-phase /Negative-phase) K factor DC current (when using compatible sensor)
Power measurement items (TIME PLOT Recording)
Active power Reactive power Apparent power Power factor
Harmonic power (0 to 50th) Harmonic voltage-current phase angle (0 to 50th) Active energy Reactive energy
EVENT measurement items (EVENT Recording)
Transient overvoltage Voltage swell Voltage dip Interruption Inrush current
Frequency fluctuations Voltage waveform comparison Timer External events
Event detection using upper and lower thresholds available with other voltage, current and power measurement parameters (excluding Integrated power, Unbalance, Inter-harmonic, Harmonic phase angle, IEC Flicker)
Input specifications
Measurement circuits Single-phase 2-wire (1P2W), single-phase 3-wire (1P3W), three-phase 3-wire (3P3W2M, 3P3W3M) or three-phase 4-wire(3P4W, 3P4W2.5E) plus one extra input channel (must be synchronized to reference channel during AC/DC measurement)
Fundamental frequency of measurement circuit
50Hz, 60Hz, 400Hz
Input channels Voltage Current
: 4 channels (U1 to U4), : 4 channels (I1 to I4)
Input methods Voltage Current
: Isolated and differential inputs (channels not isolated between U1, U2 and U3; channels isolated between U1 to U3 and U4) : Insulated clamp-on sensors (voltage output)
Input resistance Voltage Current
: 4MΩ ±80kΩ (differential inputs) : 100kΩ ±10kΩ
Compatible clamp sensors Units with f.s.=0.5V output at rated current input (f.s.=0.5V recommended) Units with rate of 0.1mV/A, 1mV/A, 10mV/A, or 100mV/A
Measurement ranges (Ch1 to Ch4 can be configured the same way; only CH4 can be configured separately)
Voltage measurement ranges
PW3198 current ranges
PW3198 Power ranges (automatically configured based on current range)
Basic specifications
Maximum recording period 55 weeks (with repeated recording set to [1 Week], 55 iterations) 55 days (with repeated recording set to [1 Day], 55 iterations) 35 days (with repeated recording set to [OFF])
Maximum recordable events 55,000 events (with repeated recording on) 1000 events (with repeated recording off)
TIME PLOT data settings TIME PLOT interval (MAX/MIN/AVG within each interval recorded) 1s, 3s, 15s, 30s, 1m, 5m, 10m, 15m, 30m, 1h, 2h, 150 cycle (at 50Hz), 180 cycle (at 60Hz), 1200 cycle (at 400Hz)
Screen copy interval (screen shot at each interval saved to SD memory card) OFF, 5m, 10m, 30m, 1h, 2h
Timer EVENT interval (200ms instantaneous waveform saved at each interval) OFF, 1m, 5m, 10m, 30m, 1h, 2h
Time start and End OFF: Start recording manually ON: Start time and End time can be configured
Repeated recording settings (maximum 55 iterations) OFF: Recording is not repeated 1Week: 55 weeks maximum in 1week segmentations 1Day: 55 days maximum in 1day segmentations
Repeat time Daily Start time and End time can be configured when Repeated recording set to 1Day.
Recording items settings Power (Small): Recording basic parameters P&Harm (Normal): Recording basic parameters and harmonics All Data (Full): Recording P&Harm items and inter-harmonics
Memory data capacity SD memory card/ SDHC memory card 2G to 32GB Contact your HIOKI representative for special order larger capacity cards that offer the HIOKI guarantee.
Voltage measurement items Ranges
Voltage measurement 600.00V
Transient measurement 6.0000kV peak
Current sensor Current range setting (A)
9660 100.00 / 50.000
9661 500.00 / 50.000
CT9667-01 (500A) 500.00 / 50.000
CT9667-01 (5kA) 5.0000k / 500.00
CT9667-02 (500A) 500.00 / 50.000
CT9667-02 (5kA) 5.0000k / 500.00
CT9667-03 (500A) 500.00 / 50.000
CT9667-03 (5kA) 5.0000k / 500.00
9669 1.0000k / 100.00
9694 50.000 / 5.0000
9695-02 50.000 / 5.0000
9695-03 100.00 / 10.000
Current sensor Current range setting(A)
CT7731 (60A) 50.000 / 5.0000
CT7731 (100A) 500.00 / 50.000
CT7736 (60A) 50.000 / 5.0000
CT7736 (600A) 500.00 / 50.000
CT7742 (600A) 500.00 / 50.000
CT7742 (2kA) 5.0000k / 500.00
9657-10 5.0000 / 500.00m
9675 5.0000 / 500.00m
Current range Power range (W / VA / var)
5.0000 kA 3.0000M
1.0000 kA 600.00k
500.00 A 300.00k
100.00 A 60.000k
Current range Power range (W / VA / var)
50.000 A 30.000k
10.000 A 6.0000k
5.0000 A 3.0000k

1
PRESETS function U Events : Record and monitor voltage elements and frequency, plus detect events Standard Power Quality : Record and monitor voltage and current elements, frequency, and harmonics, plus detect events Inrush Current : Measure inrush current (basic voltage measurement required) Recording : Record only trend data, no event detection EN50160 : Measure according to EN50160 standards
Real-Time Clock function Auto-calendar, leap-year correcting 24-hour clock
Display Language English, Simplified Chinese, Japanese Real-time clock accuracy ±0.3 s per day (with instrument on, 23°C±5°C (73°F±9°F)
Power supply AC ADAPTER Z1002 (12 VDC, Rated power supply 100VAC to 240VAC, 1.7Amax, 50/60Hz) BATTERY PACK Z1003 (Ni-MH 7.2VDC 4500 mAh)
Maximum rated power 15VA (when not charging, except AC adapter), 35VA (when charging, except AC adapter)
Continuous battery operation time Approx. 180 min. [@23°C (@73.4°F), when using BATTERY PACK Z1003]
Recharge function BATTERY PACK Z1003 charges regardless of whether the instrument is on or off; charge time: max. 5 hr. 30 min. @23°C (@73.4°F)
Power outage processing In the event of a power outage during recording, instrument resumes recording once the power is back on (integral power starts from 0).
Power supply quality measure- ment method
IEC61000-4-30 Ed.2 :2008, IEEE1159 EN50160 (using Model PQA-HiVIEW PRO 9624-50)
Dimensions Approx. 300 W× 211 H × 68 D mm (11.81" W × 8.31" H × 2.68" D) (excluding protrusions) Mass Approx. 2.6 kg (91.7 oz.) (including battery pack)
Accessories Instruction manual, Measurement guide, VOLTAGE CORD L1000 (8 cords, approx. 3 m each: 1 each red, yellow, blue, and gray plus 4 black; 8 alligator clips: 1 each red, yellow, blue, and gray plus 4 black), Spiral Tube, Input Cable Labels (for identifying channel of voltage cords and clamp-on sensors), AC ADAPTER Z1002, Strap, USB cable (1 m length), BATTERY PACK Z1003, SD MEMORY CARD (2GB) Z4001
Display specifications
Display 6.5-inch TFT color LCD (640 × 480 dots)
External Interface Specifications
SD memory card Interface Saving of binary data, Saving and Loading setting files, Saving and Loading screen copies Slot : SD standard compliant Compatible card : SD memory card/ SDHC memory card (Use only HIOKI-approved SD memory cards) Supported memory capacity : SD memory card: Up to 2GB, SDHC memory card: Up to 32GB Media full processing : Saving of data to SD memory card is stopped
RS-232C Interface Measurement and control using GPS-synchronized time (connecting GPS BOX) Connector : D-sub9pin Connection destination : GPS box (cannot be connected to computer)
LAN Interface 1. HTTP server function (compatible software: Internet Explorer Ver.6 or later, Remote operation application function, measurement start and stop control functions, system configuration function, event list function (capable of displaying event waveforms, event vectors, and event harmonic bar graphs) 2. Downloading of data from the SD memory card using the 9624-50 PQA-HiView Pro Connector : RJ-45 Transmission method : 10BASE-T,100BASE-TX
USB2.0 Interface 1. Recognizes the SD memory card as a removable disk when connected to a computer. The instrument cannot be connected during recording (including standby operation) or analysis. 2. Download data from the SD memory card using the 9624-50 PQA-HiView Pro The instrument cannot be connected during recording (including standby operation) or analysis. Connector : Series B receptacle Connection destination : Computer [Windows10 (32bit/ 64bit), Windows8 (32bit/ 64bit), Windows7 (32bit/ 64bit)]
External control interface Connector : 4-pin screwless terminal block External event input : External event input at TTL low level (at falling edge of 1.0 V or less and when shorted) between GND terminal and EVENT IN terminal
Min. pulse width: 30 ms; rated voltage: -0.5 V to +6.0 V External event output :
Environment and safety specifications
Operating environment Indoors, altitude up to 3000 m (measurement category is lowered to 600 V CAT III when above 2000m), Pollution degree 2
Storage temperature and humidity -20 to 50°C (-4 to 122°F) 80% RH or less (non-condensating) (If the instrument will not be used for an extended period of time, remove the battery pack and store in a cool location [from -20 to 30°C (-4 to 86°F)].)
Operating temperature and humidity 0 to 50°C (32 to 122°F) 80% RH or less (non-condensating) Dust and water resistance IP30 (EN60529)
Maximum input voltage Voltage input section 1000 VAC, DC±600 V, max. peak voltage ±6000 Vpeak Current input section 3VAC, DC±4.24V
Maximum rated voltage to earth Voltage input terminal 600 V (Measurement Categories IV, anticipated transient overvoltage 8000 V)
Dielectric strength 6.88 kVrms (@50/60 Hz, 1 mA sense current): Between voltage measurement terminals (U1 to U3) and voltage measurement terminals (U4) 4.30 kVrms (1 mA@50/60 Hz, 1 mA sense current): Between voltage input terminal (U1 to U3) and current input terminals/interfaces Between voltage (U4) and current measurement terminals, and interfaces
Applicable standards
Safety EN61010 EMC EN61326 Class A, EN61000-3-2,
EN61000-3-3
External event output item setting Operation Pulse width
Short pulse output TTL low output at event generation between [GND] terminal and [EVENT OUT] terminal
Low level for 10 ms or more
Long pulse output TTL low output at event generation between [GND] terminal and [EVENT OUT] terminal (No external event output at START event)
Low level for approx. 2.5 s
ΔV10 alarm TTL low output at ΔV10 alarm between [GND] terminal and [EVENT OUT] terminal
Low level while alarm occurring ; reverts to high at data reset

11
Measurement Specifications (For specifications when measuring 400Hz circuits, please inquire with your HIOKI distributor.)
: The MAX/MIN/AVG of each recording interval for each parameter are recorded.
: When a power anomaly occurs, approx. 200ms instantaneous waveform is recorded.
: When a transient overvoltage is detected, the 2ms instantaneous waveforms before and after the occurrence (total 4ms) are recorded.
: The RMS fluctuation 0.5s before and 29.5s after an event has occurred are recorded.
: When a high order harmonic event occurs, the 40ms instantaneous waveform is recorded.
Transient overvoltage Display items For single transient incidents and continuous transient incidents
Transient voltage value, Transient width For continuous transient incidents
Transient period (Period from transient IN to transient OUT) Max. transient voltage value (Max. peak value during the period) Transient count during period
Measurement method Detected from waveform obtained by eliminating the fundamental component (50/60/400 Hz) from the sampled waveform
Sampling frequency 2MHz Measurement range, resolution ±6.0000kVpeak, 0.0001kV
Measurement bandwidth 5 kHz (-3dB) to 700 kHz (-3dB)
Min. detection width 0.5 μs Measurement accuracy ±5.0% rdg.±1.0%f.s.
RMS voltage/ RMS current refreshed each half-cycle Measurement method RMS voltage refreshed each half-cycle
RMS current refreshed each half-cycle
: :
True RMS type, RMS voltage values are calculated using sample data for 1 waveform derived by overlapping the voltage waveform every half-cycle RMS current is calculated using current waveform data sampled every half-cycle
Sampling frequency 200kHz Measurement range, resolution RMS voltage refreshed each half-cycle : 600.00V, 0.01V
RMS current refreshed each half-cycle : Based on clamp-on sensor in use; see Input specifications Measurement accuracy RMS voltage refreshed each half-cycle : ±0.2% of nominal voltage (With 1.666% f.s. to 110% f.s. input and a nominal input voltage of at least 100 V)
±0.2%rdg.±0.08%f.s.(Withinputoutsidetherangeof1.666% f.s. to 110% f.s. or a nominal inputvoltageoflessthan100V) RMS current refreshed each half-cycle : ±0.3% rdg.±0.5%f.s. + clamp-on sensor accuracy
Swell/ Dip/ Interruption Display item Swell : Swell height, Swell duration
Dip : Dip depth, Dip duration Interruption : Interruption depth, Interruption durationMeasurement method Swell : A swell is detected when the RMS voltage refreshed each half-cycle exceeds the threshold in the positive direction
Dip : A dip is detected when the RMS voltage refreshed each half-cycle exceeds the threshold in the negative direction Interruption : An interruption isdetectedwhen the RMSvoltagerefreshedeachhalf-cycleexceeds the threshold in the negativedirectionRange and accuracy See RMS voltage refreshed each half-cycle
Inrush current Display item Maximum current of RMS current refreshed each 1/2 cycle
Measurement method Detected when the RMS current refreshed each 1/2 cycle exceeds the threshold in a positive direction Range and accuracy See RMS current refreshed each half-cycle
RMS voltage, RMS current Display items RMS voltage :
RMS current : RMS voltage for each channel and AVG (average) RMS voltage for multiple channels RMS current for each channel and AVG (average) RMS current for multiple channels
Measurement method AC+DC True RMS type (Current DC value: when using compatible sensor) RMS value calculated from 10 cycles (50 Hz) or 12 cycles (60 Hz)
Sampling frequency 200kHz
Measurement range, resolution RMS voltage : RMS current :
600.00V, 0.01V Based on clamp-on sensor in use; see Input specifications
Measurement accuracy RMS voltage : RMS current :
±0.1% of nominal voltage (With 1.666% f.s. to 110% f.s. input and a nominal input voltage of at least 100 V) ±0.2%rdg.±0.08%f.s. (With input outside the range of 1.666% f.s. to 110% f.s. or a nominal input voltage of less than 100 V)±0.2% rdg.±0.1%f.s. + clamp-on sensor accuracy
Voltage waveform peak/ Current waveform peak Display item Positive peak value and negative peak value
Measurement method Measured every 10 cycles (50 Hz) or 12 cycles (60 Hz) maximum and minimum points sampled during approx. 200 ms aggregation
Sampling frequency 200kHz
Measurement range, resolution Voltage waveform peak : ±1200.0 Vpeak, 0.1V Current waveform peak : The quadruple of RMS current measurement range (Based on clamp-on sensor in use; See Input specifications)
Voltage waveform comparison Display item Event detection only
Measurement method A judgment area is automatically generated from the previous 200 ms aggregation waveform, and events are generated based on a comparison with the judgment waveform. Waveform judgments are performed once for each 200 ms aggregation.
Comparison window width 10 cycles (50 Hz), 12 cycles (60 Hz)
No. of window points 4096 points synchronized with harmonic calculations
Frequency cycle Measurement method Calculated as the reciprocal of the accumulated whole-cycle time during one U1 (reference channel) cycle
Measurement range, resolution 70.000Hz, 0.001Hz Measurement bandwidth 40.000 to 70.000Hz
Measurement accuracy ±0.200 Hz or less (for input from 10% f.s. to 110% f.s.)
Frequency Measurement method Calculated as the reciprocal of the accumulated whole-cycle time during approx. 200ms period of 10 or 12 U1 (reference channel) cycles Measurement range, resolution 70.000Hz, 0.001Hz Measurement bandwidth 40.000 to 70.000Hz Measurement accuracy ±0.020 Hz or less
10-sec frequency Measurement method Calculated as the reciprocal of the accumulated whole-cycle time during the specified 10s period for U1 (reference channel) as per IEC61000-4-30 Measurement range, resolution 70.000Hz, 0.001Hz
Measurement bandwidth 40.000 to 70.000Hz Measurement accuracy ±0.010 Hz or less
TRANSIENT EVENT
TIME PLOT EVENT
TIME PLOT EVENT
TIME PLOT EVENT
FLUCTUATION EVENT
TIME PLOT EVENT
FLUCTUATION EVENT
EVENT
TIME PLOT
EVENT
TRANSIENT
FLUCTUATION
HIGH-ORDER HARM
TIME PLOT EVENT
TIME PLOT
1
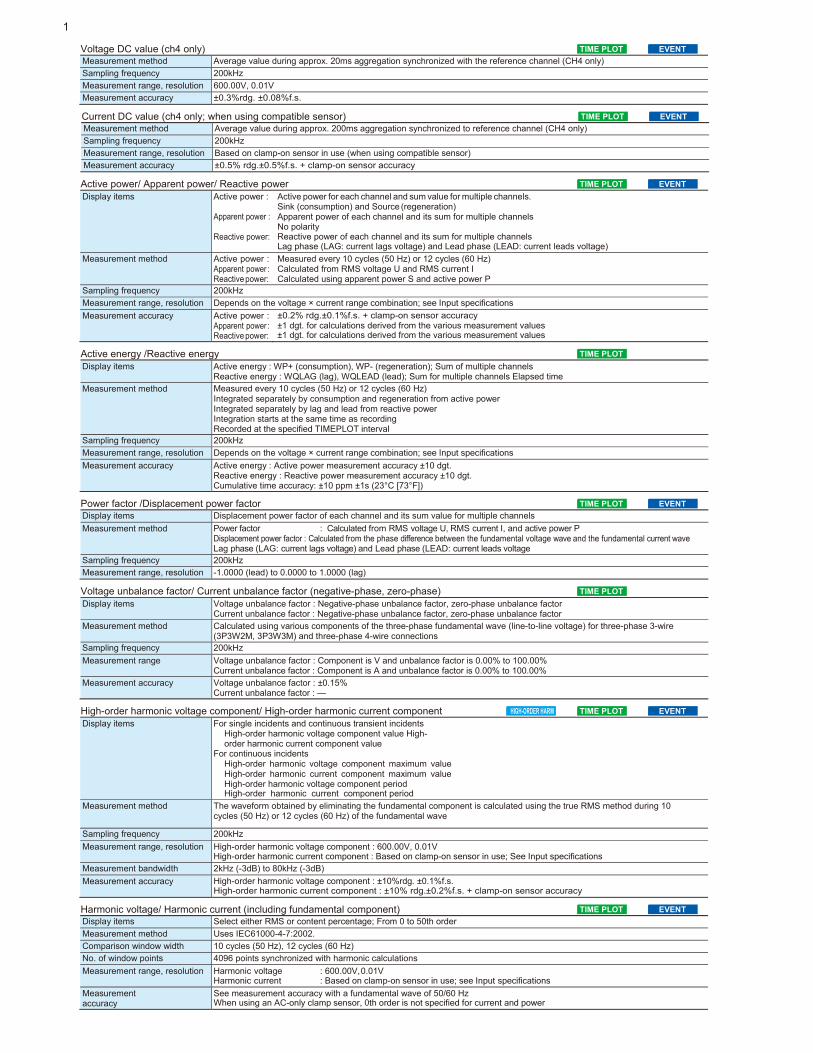
Voltage DC value (ch4 only) Measurement method Average value during approx. 20ms aggregation synchronized with the reference channel (CH4 only)
Sampling frequency 200kHz
Measurement range, resolution 600.00V, 0.01V Measurement accuracy ±0.3%rdg. ±0.08%f.s.
Current DC value (ch4 only; when using compatible sensor) Measurement method Average value during approx. 200ms aggregation synchronized to reference channel (CH4 only)
Sampling frequency 200kHz
Measurement range, resolution Based on clamp-on sensor in use (when using compatible sensor) Measurement accuracy ±0.5% rdg.±0.5%f.s. + clamp-on sensor accuracy
Active power/ Apparent power/ Reactive power Display items Active power :
Apparent power :
Reactive power:
Active power for each channel and sum value for multiple channels. Sink (consumption) and Source (regeneration) Apparent power of each channel and its sum for multiple channels No polarity Reactive power of each channel and its sum for multiple channels Lag phase (LAG: current lags voltage) and Lead phase (LEAD: current leads voltage)
Measurement method Active power : Apparent power : Reactive power:
Measured every 10 cycles (50 Hz) or 12 cycles (60 Hz) Calculated from RMS voltage U and RMS current I Calculated using apparent power S and active power P
Sampling frequency 200kHz
Measurement range, resolution Depends on the voltage × current range combination; see Input specifications
Measurement accuracy Active power : Apparent power : Reactive power:
±0.2% rdg.±0.1%f.s. + clamp-on sensor accuracy ±1 dgt. for calculations derived from the various measurement values ±1 dgt. for calculations derived from the various measurement values
Active energy /Reactive energy Display items Active energy : WP+ (consumption), WP- (regeneration); Sum of multiple channels
Reactive energy : WQLAG (lag), WQLEAD (lead); Sum for multiple channels Elapsed time Measurement method Measured every 10 cycles (50 Hz) or 12 cycles (60 Hz)
Integrated separately by consumption and regeneration from active power Integrated separately by lag and lead from reactive power Integration starts at the same time as recording Recorded at the specified TIMEPLOT interval
Sampling frequency 200kHz
Measurement range, resolution Depends on the voltage × current range combination; see Input specifications
Measurement accuracy Active energy : Active power measurement accuracy ±10 dgt. Reactive energy : Reactive power measurement accuracy ±10 dgt. Cumulative time accuracy: ±10 ppm ±1s (23°C [73°F])
Power factor /Displacement power factor Display items Displacement power factor of each channel and its sum value for multiple channels
Measurement method Power factor : Calculated from RMS voltage U, RMS current I, and active power P Displacement power factor : Calculated from the phase difference between the fundamental voltage wave and the fundamental current wave Lag phase (LAG: current lags voltage) and Lead phase (LEAD: current leads voltage
Sampling frequency 200kHz Measurement range, resolution -1.0000 (lead) to 0.0000 to 1.0000 (lag)
Voltage unbalance factor/ Current unbalance factor (negative-phase, zero-phase) Display items Voltage unbalance factor : Negative-phase unbalance factor, zero-phase unbalance factor
Current unbalance factor : Negative-phase unbalance factor, zero-phase unbalance factor Measurement method Calculated using various components of the three-phase fundamental wave (line-to-line voltage) for three-phase 3-wire
(3P3W2M, 3P3W3M) and three-phase 4-wire connections Sampling frequency 200kHz
Measurement range Voltage unbalance factor : Component is V and unbalance factor is 0.00% to 100.00% Current unbalance factor : Component is A and unbalance factor is 0.00% to 100.00%
Measurement accuracy Voltage unbalance factor : ±0.15% Current unbalance factor : —
High-order harmonic voltage component/ High-order harmonic current component Display items For single incidents and continuous transient incidents
High-order harmonic voltage component value High-order harmonic current component value
For continuous incidents High-order harmonic voltage component maximum value High-order harmonic current component maximum value High-order harmonic voltage component period High-order harmonic current component period
Measurement method The waveform obtained by eliminating the fundamental component is calculated using the true RMS method during 10 cycles (50 Hz) or 12 cycles (60 Hz) of the fundamental wave
Sampling frequency 200kHz
Measurement range, resolution High-order harmonic voltage component : 600.00V, 0.01V High-order harmonic current component : Based on clamp-on sensor in use; See Input specifications
Measurement bandwidth 2kHz (-3dB) to 80kHz (-3dB)
Measurement accuracy High-order harmonic voltage component : ±10%rdg. ±0.1%f.s. High-order harmonic current component : ±10% rdg.±0.2%f.s. + clamp-on sensor accuracy
Harmonic voltage/ Harmonic current (including fundamental component) Display items Select either RMS or content percentage; From 0 to 50th order
Measurement method Uses IEC61000-4-7:2002.
Comparison window width 10 cycles (50 Hz), 12 cycles (60 Hz) No. of window points 4096 points synchronized with harmonic calculations
Measurement range, resolution Harmonic voltage : 600.00V, 0.01V Harmonic current : Based on clamp-on sensor in use; see Input specifications
Measurement accuracy
See measurement accuracy with a fundamental wave of 50/60 Hz When using an AC-only clamp sensor, 0th order is not specified for current and power
TIME PLOT
TIME PLOT EVENT
TIME PLOT
TIME PLOT EVENT
TIME PLOT EVENT
TIME PLOT EVENT
HIGH-ORDER HARM TIME PLOT EVENT
TIME PLOT EVENT

13
Total harmonic voltage/ Total harmonic current distortion factor Display items THD-F (total harmonic distortion factor for the fundamental wave)
THD-R (total harmonic distortion factor for the total harmonic including the fundamental wave)
Measurement method Based on IEC61000-4-7:2002; Max. order: 50th Comparison window width 10 cycles (50 Hz), 12 cycles (60 Hz)
No. of window points 4096 points synchronized with harmonic calculations
Measurement range, resolution 0.00 to 100.00%(Voltage), 0.00 to 500.00%(Current) Measurement accuracy —
Harmonic power (including fundamental component) Display item Select either RMS or content percentage; From 0 to 50th order
Measurement method Uses IEC61000-4-7:2002. Comparison window width 10 cycles (50 Hz), 12 cycles (60 Hz)
No. of window points 4096 points synchronized with harmonic calculations
Measurement range, resolution Depends on the voltage × current range combination; See Input specifications Measurement accuracy See measurement accuracy with a fundamental wave of 50/60 Hz (When using an AC-only clamp sensor, order 0 is not specified for current and power)
Measurement accuracy with a fundamental wave of 50/60 Hz Harmonic input Measurement accuracy
Voltage (At least 1% of nominal voltage)
Specified with a nominal voltage of at least 100 V Order 0: ±0.3%rdg.±0.08%f.s. Order 1+: ±5.00%rdg
Voltage (<1% of nominal voltage)
Specified with a nominal voltage of at least 100 V Order 0: ±0.3%rdg.±0.08%f.s. Order 1+: ±0.05% of nominal voltage
Current Order 0: Order 1 to 20th: Order 21 to 50th:
±0.5%rdg.±0.5%f.s. ±0.5%rdg.±0.2%f.s. ±1.0%rdg.±0.3%f.s.
+clamp-on sensor accuracy +clamp-on sensor accuracy +clamp-on sensor accuracy
Power Order 0: Order 1 to 20th: Order 21 to 30th: Order 31 to 40th: Order 41 to 50th:
±0.5%rdg.±0.5%f.s. ±0.5%rdg.±0.2%f.s. ±1.0%rdg.±0.3%f.s. ±2.0%rdg.±0.3%f.s. ±3.0%rdg.±0.3%f.s.
+clamp-on sensor accuracy +clamp-on sensor accuracy +clamp-on sensor accuracy +clamp-on sensor accuracy +clamp-on sensor accuracy
Harmonic voltage phase angle/ Harmonic current phase angle (including fundamental component) Display item Harmonic phase angle components for whole orders
Measurement method Uses IEC61000-4-7:2002.
Comparison window width 10 cycles (50 Hz), 12 cycles (60 Hz)
No. of window points 4096 points synchronized with harmonic calculations Measurement range, resolution -180.00° to 0.00° to 180.00°
Measurement accuracy —
Harmonic voltage-current phase angle (including fundamental component) Display item Indicates the difference between the harmonic voltage phase angle and the harmonic current phase angle.
Harmonic voltage-current phase difference for each channel and sum (total) value for multiple channels Measurement method Uses IEC61000-4-7:2002.
Comparison window width 10 cycles (50 Hz), 12 cycles (60 Hz) No. of window points 4096 points synchronized with harmonic calculations
Measurement range, resolution -180.00° to 0.00° to 180.00°
Measurement accuracy 1st to 3rd orders : ± 2° +clamp-on sensor accuracy 4th to 50th orders: ±(0.05° × k+2°) +clamp-on sensor accuracy; (k: harmonic orders) Specified with a harmonic voltage of 1 V for each order and a current level of at 1% f.s. or greater.
Inter-harmonic voltage and inter-harmonic current Display item Select either RMS or content percentage; 0.5 to 49.5th orders
Measurement method Uses IEC61000-4-7:2002.
Comparison window width 10 cycles (50 Hz), 12 cycles (60 Hz) No. of window points 4096 points synchronized with harmonic calculations
Measurement range, resolution Inter-harmonic voltage : 600.00V, 0.01V Inter-harmonic current : Due to using clamp-on sensor; See Input specifications
Measurement accuracy Inter-harmonic voltage (Specified with a nominal voltage of at least 100 V) : At least 1% of harmonic input nominal voltage : ±5.00% rdg. <1% of harmonic input nominal voltage : ±0.05% of nominal voltage
Inter-harmonic current : Unspecified
K Factor (multiplication factor) Measurement method Calculated using the harmonic RMS current of the 2nd to 50th orders
Comparison window width 10 cycles (50 Hz), 12 cycles (60 Hz) No. of window points 4096 points synchronized with harmonic calculations
Measurement range, resolution 0.00 to 500.00 Measurement accuracy —
Instantaneous flicker value Measurement method As per IEC61000-4-15
User-selectable from 230 Vlamp/120 Vlamp (when Pst and Plt are selected for flicker measurement)/4 types of Ed2 filter (230 Vlamp 50/60 Hz, 120 Vlamp 60/50 Hz) Measurement range, resolution 99.999, 0.001
Δ V10 Flicker Display items ΔV10 measured at one minute intervals, average value for one hour, maximum value for one hour, fourth largest value for one
hour, total (within the measurement interval) maximum value Measurement method Calculated values are subject to 100 V conversion following gap-less measurement once each minute
Measurement range, resolution 0.000 to 99.999V Measurement accuracy ±2% rdg.±0.01 V (with a fundamental wave of 100 Vrms [50/60 Hz], a fluctuation voltage of 1 Vrms, and a fluctuation frequency of 10 Hz) Threshold 0.00 to 9.99V alarm output is generated when the reading for each minute is compared to the threshold and found to be greater
IEC Flicker Display items Short interval flicker Pst, long interval flicker Plt
Measurement method Based on IEC61000-4-15:1997 +A1:2003 Ed1/Ed2. Pst is calculated after 10 minutes of continuous measurement and Plt after 2 hours of continuous measurement
Measurement range 0.0001 to 10000 P.U. broken into 1,024 segments with a logarithm
Measurement accuracy Pst ±5% rdg. (Specified within range 0.1000 to 20.000 using IEC61000-4-15 Ed1.1 and IEC61000-4-15 Ed2 Class F1 performance test.) Flicker filter Select 230 V lamp Ed1, 120 V lamp Ed1, 230 V lamp Ed2, or 120 V lamp Ed2.
TIME PLOT
TIME PLOT
TIME PLOT EVENT
TIME PLOT
TIME PLOT EVENT
TIME PLOT EVENT
TIME PLOT EVENT
TIME PLOT
TIME PLOT

1
Clamp-on sensors specifications (Options)
Clamp-on sensor CLAMP ON SENSOR 9694 CLAMP ON SENSOR 9660 CLAMP ON SENSOR 9661
Appearance
Primary current rating 5A AC 100A AC 500A AC Output voltage 10mV/A AC AC 1mV/A AC AC 1mV/A AC Measurement range See input specifications Amplitude accuracy * ±0.3%rdg.±0.02%f.s. * ±0.3%rdg.±0.02%f.s. * ±0.3%rdg.±0.01%f.s *
Phase accuracy * ±2° or less * ±1° or less * ±0.5° or less * Maximum allowable input * 50 A continuous * 130 A continuous * 550 A continuous *
Maximum rated voltage to earth CAT III 300Vrms CAT III 600 Vrms
Frequency characteristics ±1.0% or less for 66Hz to 5kHz (deviation from specified accuracy) Cord length 3m (9.84ft)
Measurable conductor diameter Max.φ15mm (0.59") Max.φ46mm (1.81")
Dimensions, Mass 46W(1.81")×135H(5.31")×21D(0.83")mm,
230g(8.1oz.) 78W(3.07")×152H(5.98")×42D(1.65")mm,
380g(13.4oz.) * : 45 to 66Hz
Clamp-on sensor CLAMP ON SENSOR 9669 CLAMP ON SENSOR 9695-02 CLAMP ON SENSOR 9695-03
Appearance
Insulated conductor
Not CE marked
Insulated conductor
Not CE marked
Note: CONNECTION CORD 9219 (sold separately) is required.
Primary current rating 1000 A AC 50A AC 100A AC Output voltage 0.5mV/A AC 10mV/A AC 1mV/A AC
Measurement range See input specifications Amplitude accuracy * ±1.0%rdg.±0.01%f.s. * ±0.3%rdg.±0.02%f.s. * ±0.3%rdg.±0.02%f.s. * Phase accuracy * ±1° or less * Within ±2° * Within ±1° *
Maximum allowable input * 1000 A continuous * 130 A continuous * 130 A continuous *
Maximum rated voltage to earth CATIII 600Vrms CATIII 300Vrms
Frequency characteristics Within ±2% at 40Hz to 5kHz (deviation from accuracy) Within ±2% at 40Hz to 5kHz (deviation from accuracy)
Cord length 3m (9.84ft) CONNECTION CORD 9219 (sold separately) is required. Measurable conductor diameter Max. φ55 mm(2.17"), 80 (3.15")×20(0.79") mm busbar Max. φ15mm(0.59")
Dimensions, Mass 99.5W (3.92") × 188H (7.40") × 42D (1.65") mm,
590g (20.8 oz.) 51W(2.01")×58H(2.28")×19D(0.75")mm, 50g(1.8oz.)
Options (sold separately) — CONNECTION CORD 9219 (Cord length:3m (9.84ft) * : 45 to 66Hz
CONNECTION CORD 9219
Clamp-on sensor AC FLEXIBLE CURRENT SENSOR
CT9667-01 AC FLEXIBLE CURRENT SENSOR
CT9667-02 AC FLEXIBLE CURRENT SENSOR
CT9667-03
Appearance
Primary current rating 500A AC, 5000A AC (selectable)Output voltage 500 mV AC f.s.
Measurement range See input specifications Amplitude accuracy * ±2.0%rdg.±0.3%f.s. *
Phase accuracy * ±1° or less *
Maximum allowable input * 10000 A continuous *
Maximum rated voltage to earth CATIII 1000 Vrms CATIV 600 Vrms
Frequency characteristics ±3dB or less for 10 Hz to 20kHz (within ±3dB)
Cord length Sensor to circuit: 2m (6.56ft), Circuit to connector: 1m (3.28ft)
Measurable conductor diameter Max. φ100mm (3.94”) Max. φ180mm(7.09”) Max. φ254mm(10.0")
Dimensions, Mass Circuit box: 35W (1.38") × 120.5H (4.74") × 34D (1.34") mm
Sensor cable diameter: φ7.4 mm(0.29”) Sensor cable diameter: φ13 mm (0.51”)
Mass 280g (9.9 oz.) 470 g (16.6 oz.) Power supply LR6 alkaline battery x2, AC Adapter (option) , or external 5 to 15 V DC power supply
Options (sold separately) AC ADAPTER 9445-02 (universal 100 to 240VAC , 9V/1A output/for USA) AC ADAPTER 9445-03 (universal 100 to 240VAC , 9V/1A output/for Europe)
* : 45 to 66Hz

15
Clamp-on sensor
AC/DC AUTO-ZERO CURRENT SENSOR CT7731
AC/DC AUTO-ZERO CURRENT SENSOR CT7736
AC/DC AUTO-ZERO CURRENT SENSOR CT7742
Appearance
Primary current rating 100A AC/DC 600A AC/DC 2000A AC/DC
Output voltage (The range is switched using the Display Unit CM7290.)
60A range : 10mV/A 100A range : 1mV/A
60A range : 10mV/A 600A range : 1mV/A
600A ramge : 1mV/A 2000A range : 0.1mV/A
Amplitude accuracy * ±1.0%rdg. ±0.5%f.s. * ±2.0%rdg. ±0.5%f.s. * ±1.5%rdg. ±0.5%f.s. * Phase accuracy ** ±1.8° or less ±1.8° or less ±2.3° or less
Maximum allowable input ** 100 A continuous 600 A continuous 2000 A continuous
Maximum rated voltage to earth CATⅣ AC/DC 600Vrms CATⅢ AC/DC 1000Vrms / CATⅣ AC/DC 600Vrms Frequency characteristics DC to 5kHz (-3dB)
Cord length 2.5m (8.20ft) Measurable conductor diameter Max.φ33mm (1.30”) Max.φ33mm (1.30”) Max.φ55mm (2.17”)
Dimensions, Mass 58W(2.28”)×132H(5.20”)×18D(0.71”)mm,
250g(8.8oz.) 64W(2.52”)×160H(6.30”)×34D(1.34”)mm,
320g(11.3oz.) 64W(2.52”)×195H(7.68”)×34D(1.34”)mm,
510g(18.0oz.) Power supply DISPLAY UNIT CM7290
*The Display Unit CM7290, Output Cord L9095, and AC Adapter 9445-02 or 9445-03 are required in order to use the AC/DC Auto-zero Current Sensor CT7700 series.
OUTPUT CORD L9095
AC/DC AUTO-ZERO CURRENT SENSOR CT7700 series
DISPLAY UNIT CM7290
AC ADAPTER
9445-02 or 9445-03
Power source
* : DC, 45 to 66Hz ** : to 66Hz
Clamp-on leak sensor CLAMP ON LEAK SENSOR 9657-10 CLAMP ON LEAK SENSOR 9675 Appearance
Insulated conductor
Insulated conductor
Primary current rating 10A AC (Up to 5A on Model PW3198) Output voltage 100 mV/A AC
Measurement range See input specifications (Cannot be used to measure power) Amplitude accuracy * ±1.0%rdg.±0.05%f.s. * ±1.0%rdg.±0.005%f.s. *
Residual current characteristics Max. 5mA
(in 100A go and return electric wire) Max. 1mA
(in 10A go and return electric wire)
Effect of external magnetic fields
400A AC/m corresponds to 5mA, Max. 7.5mA
Measurable conductor Insulated conductor
Cord length 3m (9.84ft) Measurable conductor diameter Max. φ40 mm(1.57") Max. φ30 mm(1.18oz")
Dimensions, Mass 74W(2.91")×145H(5.71")×
42D(1.65)mm, 380g(13.4oz.) 60W(2.36")×112.5H(4.43")×
23.6D(23.6")mm, 160g(5.6oz.) * : 45 to 66Hz

Model Name: POWER QUALITY ANALYZER PW3198
Bundled accessoriesSD MEMORY CARD 2GB Z4001Voltage cord L1000 AC adapter Z1002 Battery pack Z1003 Instruction manual Measurement guide Strap USB cable (Approx. 1m in length)
Model No.(Order Code) (Specifications)
Clock synchronization
GPS BOX PW9005 To synchronize the PW3198 clock, Accessory: Connection cable set
IMPORTANT
Use Model PQA-HiVIEW PRO 9624-50 (version 2.00 or later) with a PC to analyze the data collected by the PW3198.
Red and black adapters sold separately. Purchase the quantity and color appropriate for your application. (Example: 3P3W - 3 adapters; 3P4W - 4 adapters)
Voltage measurement
φ11mm(0.43”)
WIRING ADAPTER PW9000 For 3P3W WIRING
WIRING ADAPTER PW9001 For 3P4W WIRING
MAGNETIC ADAPTER 9804-01 (red)MAGNETIC ADAPTER 9804-02 (black)
GRABBER CLIP9243
Magnetic tip for use with the standard For use with the standardVoltage Cord L1000 (generally compatible with M6 pan screws)
Voltage Cord L1000
Reduce voltage cords for easy wiring
Application software
PQA-HiVIEW PRO 9624-50 Use Model 9624-50 PQA-HiVIEW PRO (version 2.00 or later) with a PC to ana- lyze the data collected by the PW3198.
Case
CARRYING CASE CARRYING CASE C1001 C1002 Soft case Hard case 450W× 345W× 210Dmm 413W× 595W× 265Dmm (17.7”W× 13.6”H× 8.3”D) (16.3”W× 23.4”H× 10.4”D) 3.4kg (120oz.) 5.7kg (201oz.)
Strage media
SD MEMORY CARD 8GB Z4003 *
Options
Current measurement (see P.14 -15 Clamp-on sensors specifications for details) CLAMP ON SENSOR (Load current, AC) AC/DC AUTO-ZERO CURRENT SENSOR (Load current, AC/DC)
CT7731 CT7736 CT7742 9694 9660 9661 9669 100A AC/DC, 600A AC/DC, 2000A AC/DC, 5A AC, 100A AC, 500A AC, 1000A AC, φ55mm(2.17”), φ33mm(1.30”) φ33mm(1.30”) φ55mm(2.17”) φ15mm(0.59”) φ15mm(0.59”) φ46mm(1.81”) 80(3.15")×20(0.79")mm busbar
*The AC/DC Auto-zero Current Sensor CT7731/CT7736/CT7742 cannot be used on its own with the PW3198. Be sure to use a set that includes the Display Unit CM7290, Output Cord L9095, and AC Adapter 9445-02 or 9445-03.
CT9667-01 CT9667-02 CT9667-03 500A AC/ 5000A AC 500A AC/ 5000A AC 500A AC/ 5000A AC DISPLAY UNIT OUTPUT CORD AC ADAPTER AC ADAPTER φ100mm (3.94"), φ180mm (7.09"), φ254mm (10"), CM7290 L9095 9445-02 9445-03 Power supply: LR06 alkaline battery Power supply: LR06 alkaline battery Power supply: LR06 alkaline battery For use with the For use with BNC For USA, For EU, or AC ADAPTER 9445-02/03 (sold separately) or AC ADAPTER 9445-02/03 (sold separately) or AC ADAPTER 9445-02/03 (sold separately) CT7700 series connectors, 1.5m 100 to 240V AC, 100 to 240 V AC,
(4.92ft)length 9V/1A 9 V/ 1 A
CLAMP ON ADAPTER CLAMP ON LEAK SENSOR (Leak Current)Cannot be used to measure power
9695-02 (50A AC) CONNECTION CORD 9219 9290-10 9695-03 (100A AC) For connecting 9695-02,9695-03 CT ratio 10:1, AC1000A, 9657-10 9675 φ15mm(0.59"), CONNECTION CORD Cord length : 3m(9.84ft) φ55mm(2.17"), 10A AC (Up to 5A 10A AC(Up to 5A
80(3.15")×20(0.79")mm busbar, on Model PW3198), on Model PW3198),
9219 is required (sold separately) Cord length : 3m(9.84ft) φ40mm(1.57"), φ30mm(1.18"),
Note: Company names and Product names appearing in this catalog are trademarks or registered trademarks of various companies.
HEADQUARTERS 81 Koizumi, Ueda, Nagano, 386-1192, Japan TEL +81-268-28-0562 FAX +81-268-28-0568 http://www.hioki.com / E-mail: [email protected]
HIOKI (Shanghai) SALES & TRADING CO., LTD. TEL +86-21-63910090 FAX +86-21-63910360 http://www.hioki.cn / E-mail: [email protected]
HIOKI SINGAPORE PTE. LTD. TEL +65-6634-7677 FAX +65-6634-7477 E-mail: [email protected]
HIOKI KOREA CO., LTD. TEL +82-2-2183-8847 FAX +82-2-2183-3360 E-mail: [email protected]
DISTRIBUTED BY
HIOKI USA CORPORATION TEL +1-609-409-9109 FAX +1-609-409-9108 http://www.hiokiusa.com / E-mail: [email protected]
All information correct as of Dec. 27, 2016. All specifications are subject to change without notice. PW3198E14-6ZE Printed in Japan
Combination example: For three-phase 4-wire circuits containing leak current
PW3198-90 POWER QUALITY ANALYZER
PW3198 set with PQA HiVIEW PRO 9624-50
+ 9661 × 3 + 9675 + PW9001 + CLAMP ON SENSOR (500A) CLAMP ON LEAK SENSOR WIRING ADAPTER
C1001CARRYING CASE
PW3198-90
Set of PW3198 and
PQA HiVIEW PRO 9624-50
PW3198 Main Unit only
Bundled accessories
Voltage Cord L1000
AC ADAPTER Z1002
8 cords, approx. 3 m each: Power supply for the1 each red, yellow, blue, PW3198 and gray plus 4 black; 100V AC to 240V AC
8 alligator clips: 1 each
red, yellow, blue, and
gray plus 4 black
SD MEMORY CARD 2GB
BATTERY PACK Z1003Z4001 * (Ni-MH, 7.2 V/4500 mAh)
* IMPORTANT
Use only HIOKI-approved
SD memory cards