recent trends in u.s. services trade, 2016 · “trends in u.s. health travel services trade”...
TRANSCRIPT

United States International Trade Commission
Recent Trends in U.S. Services Trade:
2016 Annual Report
2016 Publication Number: 4643 Investigation Number: 332-345

United States International Trade Commission
Commissioners Irving A. Williamson, Chairman
David S. Johanson, Vice Chairman
Dean A. Pinkert
Meredith M. Broadbent
F. Scott Kieff
Rhonda K. Schmidtlein
Catherine DeFilippo Director, Office of Operations
Jonathan Coleman Director, Office of Industries
Address all communications to Secretary to the Commission
United States International Trade Commission Washington, DC 20436

Recent Trends in U.S. Services Trade: 2016 Annual Report
October 2016 Publication Number: 4643 Investigation Number: 332-345
This report was prepared principally by:
Project Leader George Serletis
Deputy Project Leader Art Chambers
Principal Authors
Chapter 1 Art Chambers [email protected] Cynthia Payne [email protected]
Chapter 2 Art Chambers [email protected] George Serletis [email protected]
Chapter 3 Logan Cobb [email protected]
Chapter 4 Isaac Wohl [email protected]
Chapter 5 Isaac Wohl [email protected]
Chapter 6 Art Chambers [email protected] Sarah Oliver [email protected]
Content Reviewers Heidi Colby-Oizumi and Ravinder Ubee
Office of Analysis and Research Services Peg Hausman Judy Edelhoff Jeremy Wise
Administrative Support Johnita Glover
Monica Sanders
Under the direction of Martha Lawless, Chief
Services Division Office of Industries

U.S. International Trade Commission | 1
Preface This report is the 20th in a series of annual reports on recent trends in U.S. services trade that the U.S. International Trade Commission (Commission) has published. The Commission also publishes an annual companion report on U.S. trade in goods, Shifts in U.S. Merchandise Trade. These recurring reports are the products of an investigation instituted by the Commission in 1993 under section 332(b) of the Tariff Act of 1930.1 The information in this report reflects the knowledge, industry contacts, and analytic skills the Commission uses in providing expert analyses of service industries in its statutory investigations and in apprising its customers of global industry trends, regional developments, and competitiveness issues.
In addition to the Recent Trends series, major recent Commission publications offer significant services content. These include Trade and Investment Polices in India, 2014–2015; Overview of Cuban Imports of Goods and Services and Effects of U.S. Restrictions; Trans-Pacific Partnership Agreement: Likely Impact on the U.S. Economy and on Specific Industry Sectors; and Economic Impact of Trade Agreements Implemented under Trade Authorities Procedures, 2016 Report.
Moreover, within the past year Commission staff have published several short studies, known as Executive Briefings on Trade that focus on the services sector.2 These include “The Undersea Cable Boom in Sub-Saharan Africa“ (June 2015); “Mobile Money in Kenya“ (June 2015); “World Bank Indicators Suggest that Sub-Saharan African Countries Are Open to Services Trade” (July 2015); “Factors Contributing to the Rapid Growth of Mauritius’ Services Economy” (July 2015); “Trends in U.S. Health Travel Services Trade” (August 2015); “Transport Corridors Have Improved Trade in Sub-Saharan Africa, but Issues Remain” (October 2015); “Sub-Saharan African Travel Services Trade” (October 2015); “South Africa Is a Leading Producer and Supplier of Services in Africa” (October 2015); and “Factors Affecting Growth in Ghana’s Services Economy” (October 2015).
1 On August 27, 1993, acting on its own motion under section 332(b) of the Tariff Act of 1930 (19 U.S.C. 1332(b)), the USITC instituted investigation no. 332-345, Annual Reports on U.S. Trade Shifts in Selected Industries. On December 20, 1994, the Commission on its own motion expanded the scope of this report to include more detailed coverage of service industries. Under the expanded scope, the Commission publishes two annual reports, Shifts in U.S. Merchandise Trade and Recent Trends in U.S. Services Trade. The USITC’s current report format provides a systematic means of examining and assessing major trade developments with leading U.S. trading partners, in the services, agriculture, and manufacturing sectors. 2 The Commission’s Executive Briefings on Trade are published at http://www.usitc.gov/research_and_analysis/executive_briefings.htm. These briefings are designed to inform the Commission and the public of current domestic and global activities that affect U.S. trade, investment, and competitiveness. They reflect the opinions and research of individual authors and are not the views of the Commission or any of its individual Commissioners.

2 | www.usitc.gov
Recent Trends in U.S. Services Trade: 2016 Annual Report
U.S. International Trade Commission | 3
Abstract Recent Trends in U.S. Services Trade: 2016 Annual Report focuses on U.S. exports and imports of financial services, including banking, insurance, and securities services. In 2015, the United States exported $119.6 billion in financial services and imported $72.9 billion, resulting in a trade surplus of $46.7 billion. By comparison, the total U.S. services trade surplus was $263.5 billion, a decrease of $2.5 billion from the previous year. U.S. financial services contributed $1.2 trillion to U.S. gross domestic product (GDP) in 2015, or 9 percent of total U.S. private sector GDP. Financial services employed over 6.4 million full-time equivalent employees in 2015, representing almost 6 percent of U.S. total private sector employment. Despite slow wage growth in financial services in recent years, workers on average earned $99,672 in 2015, nearly twice the average wage for the private sector as a whole.
Financial services are facing significant challenges and disruptions from digital technologies and in navigating the post-recessionary financial landscape of increased regulation and low interest rates. U.S. financial services firms have adapted by incorporating new financial technologies into their operations, but also face rising cybersecurity risks. In addition, the growth of the Chinese financial system has increased competition for U.S. banks while at the same time creating an attractive market for U.S. securities firms. Furthermore, climate change has emerged as both a challenge and an opportunity for U.S. insurers. Overall, U.S. and global financial services firms’ business models will continue to evolve in response to a variety of emerging market conditions.

4 | www.usitc.gov

U.S. International Trade Commission | 5
Table of Contents Preface ............................................................................................................... 1Abstract .............................................................................................................. 3Acronyms and Abbreviations ............................................................................ 11Executive Summary .......................................................................................... 13Chapter 1 Introduction ...................................................................................... 23
Data and Organization .............................................................................................................. 23 The U.S. Services Sector ............................................................................................................ 24 Global Services Trade ................................................................................................................ 25 Cross-border Trade, 2014 ......................................................................................................... 29 Cross-border Trade, 2015 ......................................................................................................... 33 Affiliate Transactions, 2013 ...................................................................................................... 34 Bibliography .............................................................................................................................. 36
Chapter 2 Financial Services .............................................................................. 47Overview ................................................................................................................................... 47 Digital Technologies Are Transforming Financial Services ....................................................... 48 U.S. Trade in Financial Services................................................................................................. 51 GDP, Employment, Labor Productivity, and Salaries ................................................................ 55 Bibliography .............................................................................................................................. 59
Chapter 3 Banking Services ............................................................................... 63Summary ................................................................................................................................... 63 Introduction .............................................................................................................................. 64 Market Conditions .................................................................................................................... 64
E-Banking Allows Banks to More Effectively Reach Customers ........................................... 68
Emerging Supply and Demand Factors ..................................................................................... 69
Financial Technology ............................................................................................................. 69 Regulation and Trade in Banking Services ............................................................................ 75
Trade Trends ............................................................................................................................. 81
Cross-border Trade ............................................................................................................... 81 Affiliate Transactions ............................................................................................................ 83
Outlook ..................................................................................................................................... 85 Bibliography .............................................................................................................................. 87
Chapter 4 Insurance Services ............................................................................ 97Summary ................................................................................................................................... 97 Introduction .............................................................................................................................. 97 Market Conditions .................................................................................................................... 98 Emerging Supply and Demand Factors ................................................................................... 101

Table of Contents
6 | www.usitc.gov
Insurers’ Reactions to Climate Change Concerns ............................................................... 101 The Impact of Low Global Interest Rates on the Insurance Sector .................................... 104
Trade Trends ........................................................................................................................... 107
Cross-border Trade ............................................................................................................. 107 Affiliate Transactions .......................................................................................................... 111
Outlook ................................................................................................................................... 113 Bibliography ............................................................................................................................ 115
Chapter 5 Securities Services .......................................................................... 123Summary ................................................................................................................................. 123 Introduction ............................................................................................................................ 123 Market Conditions .................................................................................................................. 124 Emerging Supply and Demand Factors ................................................................................... 126
Blockchains .......................................................................................................................... 126 China’s Growing Securities Market ..................................................................................... 128
Trade Trends ........................................................................................................................... 131
Cross-border Trade ............................................................................................................. 131 Affiliate Transactions .......................................................................................................... 133
Outlook ................................................................................................................................... 135 Bibliography ............................................................................................................................ 138
Chapter 6 Services Roundtable ....................................................................... 145Evolution and Effectiveness of Services Trade Provisions ...................................................... 145 The Impact of Digital Technologies on Services Trade and Liberalization ............................. 147 Bibliography ............................................................................................................................ 150
Appendix A Summary of Selected Services Research ....................................... 151Appendix B Data Tables for Figures ................................................................. 165
Boxes
Box 1.1: Services Trade “Modes of Supply” under the WTO’s General Agreement on Trade in Services (GATS) ............................................................................................................................. 27 Box 1.2: The Rise of Affiliate Transactions ................................................................................... 28 Box 2.1: Financial Services in Trade Agreements ......................................................................... 50 Box 3.1: Fintech Is Fundamentally Reshaping Payments ............................................................. 73 Box 3.2: The Impact of Brexit on Financial Services ..................................................................... 78 Box 3.3: An Explanation of BEA Data on Cross-Border Trade and Affiliate Transactions in Banking Services ........................................................................................................................... 82 Box 4.1: Cybersecurity Insurance Is Growing Rapidly ................................................................ 106 Box 4.2: Understanding BEA Data on Cross-border Trade and Affiliate Transactions in Insurance Services ....................................................................................................................... 108

Recent Trends in U.S. Services Trade: 2016 Annual Report
U.S. International Trade Commission | 7
Box 5.1: Understanding Data on Cross-border Trade and Affiliate Transactions in Securities Services ....................................................................................................................................... 134
Figures
Figure ES.1: Global services: The United States led the world in cross-border trade of commercial services in 2014 ......................................................................................................... 14 Figure 1.1: Global services: The United States led the world in cross-border exports and imports of commercial services in 2014 ....................................................................................... 26 Figure 1.2: U.S. services: Sales and purchases of services through affiliate transactions are almost twice the value of cross-border trade in services ............................................................. 30 Figure 1.3: U.S. services: Travel and passenger fares accounted for the largest share of U.S. cross-border trade in 2014 ........................................................................................................... 31 Figure 1.4: U.S. services: Distribution accounted for the largest share of U.S. affiliate transactions in 2013 ...................................................................................................................... 35 Figure 2.1: U.S. financial services: Banking services led cross-border exports, and insurance services led cross-border imports of financial services in 2015 ................................................... 53 Figure 2.2: U.S. financial services: Securities services were the largest category of financial services sales by foreign affiliates of U.S. firms in 2013, and insurance was the largest category of purchases from U.S. affiliates of foreign firms .......................................................... 55 Figure 3.1: Banking Services: Europe had the largest share of bank assets by region in 2014 ... 66 Figure 3.2: Banking Services: Bank branch concentration was highest in North America and Europe in 2014 .............................................................................................................................. 68 Figure 3.3: Banking services: In 2015, global revenues for fintech firms were highest for payment transactions, followed by lending and financing ........................................................... 70 Figure 3.4: Banking Services: Global investment and loan issuance in fintech grew rapidly after 2012 ...................................................................................................................................... 70 Figure 3.5: Banking Services: U.S. firms led global fintech lending in 2014 ................................. 72 Figure 3.6: Banking services: U.S. cross-border trade in banking services resulted in a U.S. trade surplus each year during 2010–15 ............................................................................... 82 Figure 3.7: Banking services: U.S.-owned foreign affiliate sales outpaced purchases from foreign-owned U.S. affiliates during 2009–13 .............................................................................. 84 Figure 3.8: Banking services: In 2013, the United Kingdom was the largest purchaser of banking services from U.S.-owned foreign affiliates ................................................................ 85 Figure 4.1: Insurance services: U.S. cross-border trade in insurance services resulted in a large but shrinking U.S. trade deficit each year during 2010–15 ........................................ 108 Figure 4.3: Insurance services: In 2014, the United States had its largest cross-border insurance trade deficit with Bermuda ........................................................................................ 111

Table of Contents
8 | www.usitc.gov
Figure 4.4: Insurance services: Since 2011, services purchased from U.S. affiliates of foreign-owned insurance firms have exceeded services supplied by foreign affiliates of U.S.-owned insurance firms ........................................................................................................ 112 Figure 4.5: Insurance services: Japan was the largest market for services supplied by foreign affiliates of U.S.-owned insurance firms in 2013 ........................................................... 113 Figure 5.1: Securities services: Global investment banking revenues grew in 2014 but are still below their 2007 peak .......................................................................................................... 126 Figure 5.2: Securities services: U.S. cross-border trade in securities services resulted in a U.S. trade surplus each year during 2010–15 ............................................................................. 131 Figure 5.3: Securities services: Services supplied by foreign affiliates of U.S.-owned firms, and services purchased from U.S. affiliates of foreign-owned firms, both increased slightly in 2013 ........................................................................................................................................ 133 Figure 5.4: Securities services: The United Kingdom was the largest market for securities services supplied by U.S.-owned foreign affiliates in 2013 ........................................................ 134
Tables
Table 1.1: U.S. private services exports and imports to the world, by category, 2015 (billion dollars) .......................................................................................................................................... 34 Table 2.1: United States: GDP, FTEs, wage and salary accruals, and labor productivity, by goods and services industry, 2010, 2014–15 ............................................................................... 56 Table 2.2: United States: GDP, FTEs, wage and salary accruals, and labor productivity, by services industry, 2010, 2014–15 ................................................................................................. 57 Table 3.1: Ten largest global banks by total assets, 2016 (billion dollars) ................................... 67 Table 4.1: Top countries by direct premiums written, 2015 ........................................................ 99 Table 4.2: Top countries by investments of direct insurance companies, life and nonlife, 2014 ............................................................................................................................................ 100 Table 4.3: Top global insurance companies by revenue, 2014 (billion dollars) ......................... 101 Table 5.1: Top countries by value of stocks traded .................................................................... 124 Table 5.2: Top investment banks by fees, 2015 ......................................................................... 126 Table B.1: Global services: The United States led the world in cross-border exports and imports of commercial services in 2014 (million dollars) ........................................................... 167 Table B.2: U.S. services: Sales and purchases of services through affiliate transactions are almost twice the value of cross-border trade in services ........................................................... 167 Table B.3: U.S. services: Travel and passenger fares accounted for the largest share of U.S. cross-border trade in 2014 (million dollars) ............................................................................... 168 Table B.4: U.S. services: Distribution accounted for the largest share of U.S. affiliate transactions in 2013 (million dollars) ......................................................................................... 168

Recent Trends in U.S. Services Trade: 2016 Annual Report
U.S. International Trade Commission | 9
Table B.5: U.S. financial services: Banking services led cross-border exports, and insurance services led cross-border imports of financial services in 2015 (million dollars) ....................... 168 Table B.6: U.S. financial services: Securities services were the largest category of financial services sales by foreign affiliates of U.S. firms in 2013, and insurance was the largest category of purchases from U.S. affiliates of foreign firms (billion dollars) ............................... 169 Table B.7: Banking Services: Europe had the largest share of bank assets by region in 2014 .. 169 Table B.8: Banking Services: Bank branch concentration was highest in North America and Europe in 2014 ............................................................................................................................ 169 Table B.9: Banking services: In 2015, global revenues for fintech firms were highest for payment transactions, followed by lending and financing (percent) ......................................... 169 Table B.10: Global investment and loan issuance in fintech grew rapidly after 2012 (billion dollars) ........................................................................................................................................ 170 Table B.11: Banking Services: U.S. firms led global fintech lending in 2014 (billion dollars) ..... 170 Table B.12: Banking services: U.S. cross-border trade in banking services resulted in a U.S. trade surplus each year during 2010–15 (billion dollars) .................................................... 170 Table B.13: Banking services: U.S.-owned foreign affiliate sales outpaced purchases from foreign-owned U.S. affiliates during 2009–13 (billion dollars) ................................................... 170 Table B.14: Banking services: In 2013, the United Kingdom was the largest purchaser of banking services from U.S.-owned foreign affiliates (million dollars) ........................................ 171 Table B.15: Insurance services: U.S. cross-border trade in insurance services resulted in a large but shrinking U.S. trade deficit each year during 2010–15 (billion dollars) ................... 171 Table B.16: Insurance services: Bermuda was the leading market for U.S. cross-border exports and imports of insurance in 2014 (million dollars) ........................................................ 171 Table B.17: Insurance services: In 2014, the United States had its largest cross-border insurance trade deficit with Bermuda (million dollars) .............................................................. 172 Table B.18: Insurance services: Since 2011, services purchased from U.S. affiliates of foreign-owned insurance firms have exceeded services supplied by foreign affiliates of U.S.-owned insurance firms (million dollars) .............................................................................. 172 Table B.19: Insurance services: Japan was the largest market for services supplied by foreign affiliates of U.S.-owned insurance firms in 2013 (million dollars) ................................. 172 Table B.20: Securities services: Global investment banking revenues grew in 2014 but are still below their 2007 peak (million dollars) ......................................................................... 172 Table B.21: Securities services: U.S. cross-border trade in securities services resulted in a U.S. trade surplus each year during 2010–15 (billion dollars) ............................................. 173 Table B.22: Securities services: Services supplied by foreign affiliates of U.S.-owned firms, and services purchased from U.S. affiliates of foreign-owned firms, both increased slightly in 2013 (million dollars) .................................................................................................. 173 Table B.23: Securities services: The United Kingdom was the largest market for securities services supplied by U.S.-owned foreign affiliates in 2013 (million dollars) .............................. 173

10 | www.usitc.gov
U.S. International Trade Commission | 11
Acronyms and Abbreviations Terms Definitions ASEAN Association of Southeast Asian Nations BEA Bureau of Economic Analysis BIS Bank for International Settlements BRIC Brazil, Russia, India, and China CAGR compound annual growth rate CRD4 Capital Requirements Directive 4 CVV card verification value EU European Union FDI foreign direct investment FTC Federal Trade Commission FTE full-time equivalent GAT General Agreement on Tariffs GATTS General Agreement on Tariffs and Trade GDP gross domestic product IIB Institute of International Banking IMF International Monetary Fund IRSG International Regulatory Strategy Group IT information technology n.i.e. not included elsewhere OCC Office of the Comptroller of the Currency OECD Organisation for Economic Co-operation and Development P2P peer-to-peer PRA Prudential Regulatory Authority PwC Pricewaterhouse Coopers QFII Qualified Foreign Institutional Investor RMB renminbi S&P Standard and Poor’s SIFI systemically important financial institution SIFMA Securities Industry and Financial Markets Association SMEs small and medium-sized enterprises SQL Structured Query Language TFA Trade Facilitation Agreement TIC Treasury International Capital TISA Trade in Services Agreement TPP Trans-Pacific Partnership TTIP Transatlantic Trade and Investment Partnership U.S. United States UK United Kingdom USDA United States Department of Agriculture USDOC United States Department of Commerce USITC United States International Trade Commission

12 | www.usitc.gov

U.S. International Trade Commission | 13
U.S. Services Trade Highlights
The United States continued to be the largest global exporter and importer of services in 2014.
Financial services (banking, insurance, and securities) represented a major share of U.S. services trade, and registered a cross-border trade surplus of $46.7 billion in 2015.
Digital technologies and post-recession regulations are significantly transforming the global market for financial services.
The growing significance of Chinese banks in the global banking system reflects the rapid growth of the Chinese economy in recent years.
Continued low interest rates and climate change concerns are among the most important new trends affecting the U.S. and global insurance industries.
The United States is the world’s largest securities services market, accounting for half of stocks traded globally in 2014, and is home to 6 of the world’s top 10 investment banks.
Executive Summary The United States is the world’s largest services market, and remained the largest global cross-border exporter and importer of services in 2014 (figure ES.1).3 Preliminary data for 2015 indicate that U.S. services exports increased by 1 percent to $730.6 billlion, while imports increased by 2 percent to $467.1 billion. Services contribute significantly to the U.S. economy, accounting for $11.0 trillion (78 percent) of U.S. private sector gross domestic product (GDP) and 91.8 million private sector employees (82 percent) in 2015.
3 The time frames used in this report are based on the latest data available from each source used. At the time of publication in October 2016, comparative global trade data from the World Trade Organization are available only through 2014; preliminary annual data from the U.S. Bureau of Economic Analysis are available for total cross-border trade for some sectors, including financial services, through 2015. U.S. cross-border services trade data by country are available only through 2014; data on affiliate transactions, through 2013. For details on the different modes of services trade, see box 1.1.

Executive Summary
14 | www.usitc.gov
Figure ES.1: Global services: The United States led the world in cross-border trade of commercial services in 2014
Source: WTO, International Trade Statistics 2015, tables A8 and A9 (accessed March 1, 2016). (See appendix table B.1.) Notes: Excludes public sector transactions. The World Trade Organization includes the following countries under the Commonwealth of Independent States: Armenia, Azerbaijan, Belarus, Georgia, Kazakhstan, Kyrgyzstan, Moldova, Russia, Tajikistan, Turkmenistan, Ukraine, and Uzbekistan.
a The value of global exports and imports differ due to several factors, including time lags, differences in methodology, and other measurement error.
United States 14%
United Kingdom 7%
France 6%
Germany 5%
China 5%
Other Europe 31%
Other Asia 20%
Other Americas 5%
Middle East and Africa 5%
Commonwealth of Independent States
2%
Exports Total = $4.9 trillion
United States 9%
China 8%
Germany 7%
France 5%
United Kingdom 4%
Other Europe 26%
Other Asia 21%
Middle East and Africa 9%
Other Americas 7%
Commonwealth of Independent States
4%
Importsa Total = $4.8 trillion

Recent Trends in U.S. Services Trade: 2016 Annual Report
U.S. International Trade Commission | 15
This report is the latest in the annual Recent Trends series prepared by the U.S. International Trade Commission (Commission or USITC), and provides an overview of U.S. trade in services. The focus for this year’s report is on recent developments in financial services trade, with detailed descriptions of trends in banking, insurance, and securities services.4 Financial services provide the critical economic infrastructure necessary for modern economies to function. As such, they are essential in the production of nearly all goods and services, and facilitate international trade. Well-developed financial systems promote economic efficiency, lower transaction costs, facilitate personal and commercial transactions, and direct savings toward economically productive activities. The critical importance of financial services to the global economy is underscored by the fact that it is one of the few services industries that has international regulatory standards.
The depth of the 2008–09 global recession, which erased an estimated $50 trillion in global wealth, and the relatively slow pace of recovery afterwards both resulted, in part, from systemic failures in the financial sector. Seven years later, U.S. and global financial services firms’ revenue growth is only now recovering to pre-crisis levels. However, financial services firms still face the need to adjust to evolving digital technologies and substantial new international and national regulatory measures that are aimed at averting another global financial crisis. In addition, the fallout from the United Kingdom’s decision to exit the European Union (EU) may have significant long-term consequences for the global financial sector.
Digital technologies and the Internet are changing the global financial system. This change is being driven by demographic and behavioral changes from a new generation of digitally enabled consumers, who are increasingly using digital devices to conduct commercial transactions online. Smartphones, in particular, are transforming the way U.S. and global consumers access financial services. According to the U.S. Federal Reserve, over half of U.S. smartphone owners used their devices to access retail banking services in 2013. In response, traditional financial services firms are changing the way they supply services. In addition, many are facing strong competitive pressures from non-bank financial technology (fintech) firms.
Like banking, insurance and securities services are also being transformed by digital technologies. Insurance activities such as underwriting and pricing are becoming increasingly automated and are moving to online platforms that diminish the traditional advantages of size and scale. Securities services providers are also facing competitive challenges from the
4 Beginning with its publication in 2013, Recent Trends covers three industries each year, rotating on a four-year basis between professional services (education, healthcare, and legal or management consulting services); electronic services (audiovisual, computer, and telecommunication services); distribution services (logistics, retail, and transportation services); and financial services (banking, insurance, and securities). The 2015 Recent Trends report focused on distribution services.

Executive Summary
16 | www.usitc.gov
increased availability of data and information online, including wealth management programs and online trading.
New post-financial crisis regulations designed to safeguard the global financial system from future instability have increased costs for financial institutions, particularly larger banking and securities firms that now must devote more resources to comply with these regulations. Insurance firms have also been affected by new rules requiring them to hold more capital. The variation in regulations across markets also makes trade more costly and complicated, since financial services firms need to comply with diverse laws and regulations in each market. Efforts by countries to harmonize rules or engage in other forms of regulatory cooperation are beginning to address some of these concerns. However, the proliferation of regional and bilateral trade agreements and investment treaties, with varying provisions for financial services, may introduce additional impediments to trade as these agreements harmonize regulations across certain countries but not others.
Key Findings
Total U.S. Trade in Services
Services Generated Large Trade Surpluses in 2014 and 2015
U.S. cross-border exports of private services totaled $690.1 billion in 2014, while U.S. imports totaled $453.3 billion, resulting in a $236.9 billion trade surplus. Preliminary data for 2015 suggest an increase in total U.S. services exports and imports. Annual services exports were reported to be $730.6 billion in 2015, while imports were $467.1 billion, generating a surplus of $263.5 billion.5 Leading export markets were Canada, the UK, and Japan, which collectively received 25 percent of total U.S. cross-border services exports in 2014 (latest available data). Similarly, the UK (11 percent), Canada (7 percent), Japan (6 percent), and Germany (6 percent) supplied the largest shares of U.S. services imports.
Services supplied by U.S.-owned foreign affiliates, the leading channel by which many U.S. services are delivered to foreign markets, increased by 3 percent to slightly more than $1.3 trillion in 2013 (latest available data). The largest foreign markets for sales by U.S.-owned foreign affiliates were the UK (14 percent), Canada (10 percent), and Ireland (7 percent). The EU as a whole accounted for 42 percent of such sales by U.S.-owned foreign affiliates in 2013. Purchases from U.S. affiliates of foreign firms were $878.5 billion in 2013, an increase of 8 percent from the previous year. Japan accounted for the largest share of these purchases
5 The data regarding exports and imports for 2015 discussed in this section are preliminary; the data do not contain breakdowns for all countries and certain industries or affiliate transactions.

Recent Trends in U.S. Services Trade: 2016 Annual Report
U.S. International Trade Commission | 17
(17 percent), followed by UK- and German-owned affiliates (14 percent each). Overall, 51 percent of purchases in the United States from foreign-owned affiliates were from affiliates of EU-based parent firms.
Financial Services
Banking Services Accounted for the Majority of U.S. Cross-border Trade in Financial Services in 2015
In 2015, U.S. cross-border exports of financial services totaled $119.6 billion, while imports totaled $72.9 billion, resulting in a trade surplus of $46.7 billion.6 Banking services (including financial management, credit card processing, and credit-related services, but excluding retail banking) accounted for 62 percent ($74.2 billion) of total U.S. financial services exports in 2015 and 25 percent ($17.9 billion) of imports. Securities services (including brokerage, underwriting, and lending) made up 24 percent ($28.2 billion) of total U.S. financial services exports and 10 percent ($7.3 billion) of imports in the same year. Insurance services represented 14 percent ($17.1 billion) of total U.S. financial services exports and 66 percent ($47.8 billion) of imports in 2015. In 2014, the UK (17 percent), Canada (7 percent), and Belgium-Luxembourg (4 percent) were the largest export markets for banking and securities services combined, while the top three markets for U.S. exports of insurance services were Bermuda (20 percent), Canada (17 percent), and the UK (11 percent).7
Affiliate Transactions Accounted for the Majority of Financial Services Trade in 2013
The majority of U.S. financial services trade occurs through affiliate transactions. Affiliates of U.S. financial services companies located abroad (U.S.-owned foreign affiliates) represented 20 percent or $259.5 billion of sales by all U.S.-owned foreign affiliates in 2013. Within financial services, securities services accounted for the largest share of affiliate sales, with 39 percent (nearly $102.3 billion) in 2013. Insurance accounted for 25 percent of sales by U.S.-owned foreign affiliates in 2013, followed closely by banking services (21 percent). Purchases of financial services from foreign-owned U.S. affiliates (i.e., affiliates of foreign firms located in the United States) totaled $182.9 billion in 2013. Insurance services represented the largest share of purchases from foreign-owned U.S. affiliates in financial services, totaling $69.5 billion
6 For the purposes of the cross-border trade discussion, data on financial services encompass securities services, banking services, insurance services, and rental and leasing services (excluding real estate). Other aspects of financial services, such as retail banking, are reported as affiliate transactions and discussed separately. 7 Preliminary data for total exports and imports are available for 2015, as well as data for certain industries such as financial services. However, breakdowns of exports and imports by country for financial services are only available through 2014.

Executive Summary
18 | www.usitc.gov
(38 percent), followed closely by securities services (34 percent) and banking services (25 percent).
Financial Services’ GDP Contribution, Wages, and Labor Productivity Grew in 2015
In 2015, the contribution of U.S. private sector financial services to U.S. gross domestic product (GDP) was $1.2 trillion, accounting for nearly 9 percent of total U.S. GDP. Insurance and banking services each represented around one-third of financial services’ contribution to U.S. private sector GDP in 2015, followed by securities services (17.6 percent) and rental and leasing services (16.4 percent).8 Overall employment growth in this sector has been slow since the 2008–09 financial crisis, increasing 1 percent for most years during 2010–14 (slower than the 3 percent for the services industry as a whole). In 2015, employment was highest in banking services (including retail banking), with just over 2.5 million full-time equivalent (FTE) employees (39 percent of all financial services employees) and insurance services (slightly less than 2.5 million FTEs, also 39 percent). Insurance services employment rose the fastest from 2014 to 2015 (3 percent), while employment in banking increased by less than 1 percent.
Growth in labor productivity in financial services has been slow but positive. It was one of only two services industries to report labor productivity growth from 2010 to 2014, rising at an average annual rate of 0.4 percent, but from 2014 to 2015 labor productivity growth in financial services was outpaced by nearly every other services sector. Average output per worker in financial services was $192,110 in 2015, the second highest of any services category, but ranged from almost $158,000 in banking services to over $383,000 in rental and leasing services. Wages in financial services reflected the industry’s relatively higher labor productivity: workers earned on average $99,672 in 2015, nearly twice the average wage for the private sector as a whole, and increased at an average annual rate of 2.7 percent from 2010 to 2014. Within financial services, securities services had the highest average wage in 2015 at $221,447, four times the lowest average wage, which was reported in rental and leasing services ($55,956).
8 For the purposes of this report, rental and leasing services (excluding real estate) are referred to in discussions of economic and affiliate trade data, where applicable. The U.S. Bureau of Economic Analysis (BEA) does not record cross-border trade data in rental and leasing services.

Recent Trends in U.S. Services Trade: 2016 Annual Report
U.S. International Trade Commission | 19
Banking Services
Growth in Global Banking Assets Has Shifted from Europe and North America to China in Recent Years
Three regions accounted for over 70 percent of global bank assets in 2014: Europe, North Asia (China, Japan, and South Korea), and North America. The share of assets held by European and North American banks has declined since the end of the financial crisis. Demand growth has been lower in North America and Europe, as these markets for banking services are relatively mature. By contrast, the large increase in North Asia’s share of global banking assets has been driven by growth in the Chinese banking industry, which has experienced double-digit annual growth in assets since 2012. In 2014, Chinese financial institutions accounted for 5 of the top 10 global banks by total assets. Two U.S. banks—JPMorgan Chase & Co., at number 6; and Bank of America, at number 9—ranked among the world’s top 10 banks. Other leading U.S. banks were Wells Fargo, at number 11, and Citigroup, at number 13. The growing significance of Chinese institutions reflects the recent rapid growth of the Chinese economy.
The United States Posted a Large Trade Surplus in Banking Services in 2015
In 2015, U.S. cross-border exports of banking services totaled $74.2 billion, a 5 percent decrease from 2014, while U.S. imports of banking services were $17.9 billion. Low interest rates and a rapidly changing regulatory environment have tempered growth in U.S. exports of banking services. Sales by foreign affiliates of U.S. banks abroad totaled $53.9 billion in 2013, a 7 percent decrease from 2012. By contrast, purchases of banking services from U.S. affiliates of foreign banks decreased by 9 percent in 2013, to $44.9 billion. Major U.S. trading partners in banking services continued to be the UK, Australia, Canada, China, and Germany.
Insurance Services
The United States Was the Largest Global Insurance Market by Global Premiums in 2014
The United States is the world’s largest insurance market by far; its $553 billion in life premiums and $764 billion in nonlife premiums together accounted for over one-quarter of total global premiums. Japan, the UK, and China were the world’s second-, third-, and fourth-largest insurance markets, respectively. U.S. insurance companies also held the most assets: $5.2 trillion in 2014, on which they earned $223 billion in net investment income. Among the challenges and opportunities facing insurers, there is concern within the industry that climate change is increasing the risks associated with the provision of coastal property insurance and

Executive Summary
20 | www.usitc.gov
crop insurance, and life insurers are struggling with low global interest rates that depress investment income.
The United States Was a Net Importer of Insurance Services in 2015
U.S. affiliate sales in insurance (sales by U.S.-owned insurance affiliates in foreign markets) continued to exceed cross-border trade in insurance by a wide margin. The United States maintained a large deficit in cross-border insurance trade in 2015, primarily driven by imports of reinsurance, though that trade deficit shrank to its lowest level since 2006. Similarly, purchases of insurance from U.S. affiliates of foreign firms have modestly exceeded sales by foreign affiliates of U.S. firms since 2011. Japan was the top market for sales by U.S.-owned foreign insurance affiliates in 2013, accounting for 35 percent of total sales.
Securities Services
The United States Accounted for a Substantial Share of Global Stock Trades in 2014
The United States remained the world’s largest securities services market in 2014 as it accounted for more than half of stocks traded by value, followed by China (31 percent) and Japan (12 percent). These three markets also led the list of stocks traded as a percentage of GDP. Notably, the value of stocks traded in the United States was equivalent to 224 percent of U.S. GDP, far higher than the global average of 102 percent. The United States is home to the world’s five largest investment banks (JPMorgan Chase & Co., Goldman Sachs & Co., Bank of America Merrill Lynch, Morgan Stanley, and Citi), with each holding between 5 and 7 percent of global market share. Global investment banking revenues grew by 6 percent in 2014 to $81.6 billion, led by high growth in the EU and the BRIC countries (Brazil, Russia, India, and China), though revenues were still down from their 2007 peak of $89.8 billion. The securities industry will continue to be shaped by new regulations and by the evolving demand for financial assets. In terms of challenges, securities services firms are currently navigating both new technologies and emerging financial markets such as China.
The United States Ran a Large Cross-border Trade Surplus in Securities Services in 2015
In 2015, the United States exported $28.2 billion of securities services, which included $11.8 billion of brokerage and underwriting services and $16.4 billion of securities lending and electronic funds transfer services. The United States imported $7.2 billion of securities services,

Recent Trends in U.S. Services Trade: 2016 Annual Report
U.S. International Trade Commission | 21
comprising $4.4 billion of brokerage and underwriting services and $2.8 billion of lending and electronic funds transfer services. The cross-border trade surplus in 2015 was $20.9 billion.
Securities services are traded at much larger volumes through affiliates than through cross-border trade. In 2013, foreign affiliates of U.S. firms sold $102 billion of securities services abroad, while purchases from U.S. affiliates of foreign firms totaled $62 billion. Compared to 2012, this represents 3 percent growth in sales by U.S. affiliates abroad and 16 percent growth in purchases from U.S. affiliates of foreign firms. While sales by the foreign affiliates of U.S. firms have not yet recovered to their 2010 peak of $128 billion, the 2013 purchases from U.S. affiliates of foreign firms represented an all-time high. The United Kingdom purchased the most securities services from affiliates of U.S. firms in 2013, accounting for 29 percent—more than half of the total sales to Europe. Canada and Japan were also significant markets, accounting for 6 percent and 5 percent of affiliate sales, respectively.
USITC Roundtable Discussion The Commission hosted its ninth annual Services Roundtable on November 5, 2015, with Chairman Meredith Broadbent and Commissioner Rhonda Schmidtlein moderating. The Commission holds these roundtables annually to encourage discussion among individuals from government, industry, and academia about important issues affecting services trade. This year’s event focused on the evolution and effectiveness of services trade provisions in existing trade agreements, and the impact of digital technologies on the cross-border provision and liberalization of services.
During the roundtable, participants cited the “negative list” approach to market access provisions contained in agreements such as the Trans-Pacific Partnership (TPP), which allow agreements to capture unforeseen developments in covered sectors,9 as being particularly important for allowing innovation in services trade to continue. Participants noted that trade agreements have become increasingly complex in other respects, and include mechanisms that allow countries to exclude certain activities from liberalization; they stated that this trend could be an impediment to trade. However, many participants were encouraged that agreements such as the TPP will contain provisions that will prevent discriminatory treatment and improve market access for many services industries; they saw future agreements, such as the proposed Trade in Services Agreement, as important for setting new standards in services trade.
Participants also discussed the particular importance of commitments made in the TPP regarding the free flow of data across members’ borders for services such as e-commerce,
9 In trade agreements, a negative list approach means that the agreement covers all services, present and future, unless specific exceptions are listed.

Executive Summary
22 | www.usitc.gov
insurance, and telecommunications, though these commitments would not prohibit forced data localization for financial services providers. Some attendees added that a challenge for liberalizing trade in digital services was to ensure that commitments would be enforced similarly across borders. Commenting on the prospects for future trade agreements, most panelists agreed that the commitments in the TPP will set a high standard for commitments on digital trade in future trade agreements. Lastly, participants considered the challenges of measuring trade in digital services in official statistics, as the technology facilitating trade in services continues to change faster than the ability to measure it.

U.S. International Trade Commission | 23
Chapter 1 Introduction Services continue to be a growing and important sector in the U.S. economy, accounting for 79 percent of U.S. gross domestic product (GDP) and 82 percent of employment in 2015. The World Trade Organization (WTO) reports that the U.S. services trade surplus in 2014 was the world’s largest at $235.9 billion, followed by that of the United Kingdom (UK) at $140.3 billion.10
This annual report provides an overview of U.S. services trade, identifying important U.S. trading partners and analyzing global market conditions in selected industries. It focuses on financial services, which include banking services, insurance services, and securities services.11 U.S. financial services employed 6.4 million people in 2015 and accounted for almost 9 percent of GDP; since 2006 (including the 2008–09 financial crisis and recovery), the industry’s annual 9 percent export growth has outpaced the 7 percent export growth per year of the U.S. private services sector as a whole.12
Data and Organization The U.S. International Trade Commission (Commission or USITC) draws much of the services trade data used throughout this report from the Bureau of Economic Analysis (BEA) at the U.S. Department of Commerce (USDOC). The BEA collects services trade data through a number of surveys, which under most conditions require respondents with more than $2 million in exports or $1 million in imports to furnish details about their international services transactions. The BEA estimates trade flow data using these survey results.13 For this report, the Commission has supplemented the BEA data with information from other sources, including individual firms,
10 WTO, International Trade Statistics 2015, tables A8 and A9 (accessed March 3, 2016). 11 In 2013, Recent Trends changed its format to cover three industries per year in depth, rotating on a four-year basis between professional services (education, healthcare, and legal or management consulting services); electronic services (audiovisual, computer, and telecommunication services); distribution services (logistics, retail, and transportation services (maritime transport)); and financial services (banking, insurance, and securities or leasing services). Rental and leasing services are not covered in detail in this year’s report. The 2015 report focused on distribution services. 12 In this study, all multiyear growth rates are calculated as compound annual growth rates (CAGR). For more information on the U.S. services economy, see USDOC, BEA, Survey of Current Business, October 2015. 13 For more information on the BEA’s data collection methods, see USDOC, BEA, Survey of Current Business, October 2015, 26.

Chapter 1: Introduction
24 | www.usitc.gov
trade associations, industry and academic journals and reports, international organizations, and other government agencies.14
This chapter examines the U.S. services sector, global trade in services, and U.S. trade in services. It reviews both cross-border trade in services from 2009 through 2015 and affiliate firms’ sales of services from 2009 through 2013,15 comparing the trade picture in recent years with earlier trends. Chapter 2 provides an overview of financial services; identifies key trends affecting the sector; and examines its contribution to U.S. economic output, employment, labor productivity, and trade. Chapters 3, 4 and 5 focus on banking services, insurance services, and securities services, respectively. These chapters provide an overview of market conditions, selected emerging demand and supply factors, and recent trends in U.S. cross-border and affiliate trade for each industry. Chapter 6 summarizes the information presented and the views expressed at the ninth annual USITC services trade roundtable, hosted by the Commission on November 5, 2015. Appendix A provides a snapshot of recent services research conducted by Commission staff. Appendix B provides data tables for the figures used in this report. In addition, 2016 marks the first year that this report will be accompanied by web-based interactive charts, which allow users to explore trends in U.S. services exports and imports over time and by selected industries and countries. Recent Trends 2016 Interactive data link.
The U.S. Services Sector Services industries account for a large majority of U.S. output and employment. In 2015, U.S. services industries accounted for 78 percent (or $11.0 trillion) of U.S. private sector GDP and for 82 percent (or 91.8 million) of U.S. private sector full-time employees, compared to 22 percent and 18 percent, respectively, for the goods-producing sector.16 Recent trends in the U.S. services sector have mirrored overall trends in the goods-producing sector. Services output
14 The BEA updates its international trade statistics for prior years as additional data become available, and occasionally revises the methodology and presentation of its statistics in order to improve their quality and comply with new international standards. For these reasons, care should be taken in comparing statistics in previous Recent Trends reports with currently published statistics. For more information, see USDOC, BEA, “The Comprehensive Restructuring,” March 2014; USDOC, BEA, “Comprehensive Restructuring and Annual Revision,” July 2014, 1–3. 15 “Affiliate firms” includes both firms outside the United States that are owned by U.S. companies and firms located in the United States that are owned by foreign companies. Note that publication of the data on affiliate transactions lags publication of data on cross-border services trade. Analyses of affiliate transactions compare performance in 2013 with trends from 2009 through 2012. 16 The goods-producing sector refers to agriculture, forestry, fishing, mining, construction, and manufacturing. USDOC, BEA, “Frequently Asked Questions,” March 10, 2006.

Recent Trends in U.S. Services Trade: 2016 Annual Report
U.S. International Trade Commission | 25
slightly outpaced goods production in GDP, employment, and wage growth from 2010 to 2015, but goods production saw faster increases in labor productivity during the same period.17
Global Services Trade The United States remains highly competitive in the global services market. As the world’s top exporter of services, the United States accounted for $687.6 billion, or 14 percent, of global cross-border commercial services exports in 2014 (figure 1.1).18 Other top single-country exporters included the UK and France, which accounted for $337.2 billion (7 percent) and $267.1 billion (5 percent), respectively.19 Although most of the world's top 10 services exporters in 2014 were developed countries, China was the 5th-largest exporter (after Germany), and India ranked 8th (down from 6th in 2014). Overall, the top 10 exporting countries (including the United States) together accounted for approximately 52 percent of global cross-border services exports in 2014.20
17 USDOC, BEA, “Real Value Added by Industry,” April 1, 2016; USDOC, BEA, table 6.5D, “Full-Time Equivalent Employees by Industry,” April 1, 2016; USDOC, BEA, table 6.3D, “Wages and Salaries by Industry,” August 3, 2016. Value added is a measure of an industry’s contribution to GDP; it is the difference between the value of an industry’s gross output and the cost of its intermediate inputs. Full-time equivalent employees (FTEs) equal the number of employees on full-time schedules plus the number of employees on part-time schedules converted to a full-time basis. The number of FTEs in each industry is the product of the total number of employees and the ratio of average weekly hours per employee for all employees on full-time schedules. 18 This discussion draws on WTO trade data to help compare U.S. trends with those of other countries. The term “commercial services,” used by the WTO, is roughly equivalent to “private services” used by the BEA—both refer to services offered by the private sector rather than the public sector. However, there are differences between the two values. These differences are the result of a lagged time period used for the WTO estimate and small differences in the activities captured by the two measures. USDOC, BEA representative, telephone interview by USITC staff, February 23, 2012. 19 In 2014, services exports to other EU countries represented approximately 37 percent of total UK services exports, while French services exports to other EU countries accounted for about 54 percent of that country’s total services exports the same year. EC, Eurostat Database (accessed June 22, 2016; USITC calculations). 20 WTO, International Trade Statistics, table A8 (accessed March 1, 2016).

Chapter 1: Introduction
26 | www.usitc.gov
Figure 1.1: Global services: The United States led the world in cross-border exports and imports of commercial services in 2014
Source: WTO, International Trade Statistics 2015, tables A8 and A9 (accessed March 1, 2016). (See appendix table B.1.) Notes: Excludes public sector transactions. The WTO includes the following countries under the Commonwealth of Independent States: Armenia, Azerbaijan, Belarus, Georgia, Kazakhstan, Kyrgyzstan, Moldova, Russia, Tajikistan, Turkmenistan, Ukraine, and Uzbekistan.
a The value of global exports differs from that of global imports due to several factors, including time lags, differences in methodology, and other measurement errors.
United States 14%
United Kingdom 7%
France 5%
Germany 5%
China 5%
Other Europe 31%
Other Asia 19%
Other Americas 5%
Middle East and Africa 5%
Commonwealth of Independent States
2%
Exports Total = $4.9 trillion
United States 9%
China 8%
Germany 7%
France 5%
United Kingdom 4%
Other Europe 26%
Other Asia 21%
Middle East and Africa 9%
Other Americas 7%
Commonwealth of Independent States
4%
Importsa Total = $4.8 trillion

Recent Trends in U.S. Services Trade: 2016 Annual Report
U.S. International Trade Commission | 27
The United States was also the world's largest cross-border services importer in 2014, with $451.7 billion, or 9 percent, of global commercial services imports. China remained the 2nd-largest importer in 2014 with $381.6 billion (8 percent), followed by Germany with $326.4 billion (7 percent). India was the 8th-largest services importer (up from 9th in 2013). Overall, the top 10 importing countries accounted for almost 50 percent of global commercial services imports in 2014.21
The BEA publishes annual data on both U.S. cross-border trade and U.S. affiliate transactions in services, which together account for a substantial portion of the services provided through all four “modes of supply” specified in the General Agreement on Trade in Services (GATS) under the WTO (box 1.1). The BEA publishes these data by country and by industry, at the highest level of detail that its surveys allow. The bureau also publishes quarterly cross-border trade data in highly aggregated form.22
According to the BEA, “cross-border trade” occurs when suppliers in one country sell services to consumers in another country, with people, information, or money crossing national boundaries in the process.23 Such transactions appear as exports and imports in a country’s balance of payments. Firms also provide services to foreign consumers through affiliates established in host (i.e., foreign) countries; the income generated through “affiliate transactions” may appear as direct investment income in the balance of payments.24
Box 1.1: Services Trade “Modes of Supply” under the WTO’s General Agreement on Trade in Services (GATS)
The GATS identifies four “modes of supply” for services trade—i.e., four ways that services can be traded:
Mode 1 is cross-border supply. In this mode, a service is supplied by an individual or firm in one country to an individual or firm in another (i.e., the service crosses national borders). An example would be a digital file of a final architectural design emailed to a foreign client. Mode 1 under the GATS does not directly compare to BEA’s data for cross-border trade (see discussion below).
Mode 2 is consumption abroad. In this mode, an individual from one country travels to another country and consumes a service in that country. An example would be foreign nationals visiting the United States for medical care.
Mode 3 is commercial presence. In this mode, a firm based in one country establishes an affiliate in another country and supplies services from that locally established affiliate. An example would be a U.S.-
21 WTO, International Trade Statistics 2014, 2014, table A9 (accessed March 1, 2016). 22 Quarterly data on U.S. trade in services can be found in USDOC, BEA, Interactive Data, International Data, International Transactions. 23 This definition is also consistent with the GATS classifications of the WTO. 24 Income generated through affiliate transactions only appears as direct investment income in the balance of payments once it has been repatriated to the United States.

Chapter 1: Introduction
28 | www.usitc.gov
based law firm providing legal services to citizens of a foreign country from its affiliated office located in that country.
Mode 4 is the temporary presence of natural persons. In this mode, an individual service supplier from one country travels to another country on a short-term basis to supply a service there—for instance, as a consultant, contract employee, or intracompany transferee at an affiliate in the host country.a An example would be U.S.-based engineers traveling to a foreign country to help local staff on a construction project.
The BEA’s data categories for services trade—i.e., cross-border trade and affiliate transactions—do not correspond exactly to the channels of service delivery described in the GATS.b The BEA notes that the GATS’ mode 1 and mode 2 transactions, as well as some mode 4 transactions, generally are grouped together in the BEA’s data on cross-border trade, while mode 3 transactions are included, with some exceptions, in the BEA’s affiliate transactions data.c
a USDOC, BEA, Survey of Current Business, October 2009, 40–43, tables 1 and 2. b For more information on the four modes of supply under the GATS, see WTO, “Chapter 1: Basic Purpose and Concepts,” n.d.
https://www.wto.org/english/tratop_e/serv_e/cbt_course_e/c1s3p1_e.htm (accessed July 19, 2016). c The BEA only includes affiliate transactions between residents and nonresidents, while certain transactions that fall under
mode 3 of the GATS could involve only residents of one country. USDOC, BEA, U.S. International Economic Accounts: Concepts and Methods, September 2014.
The channel of delivery that services providers use is primarily determined by the nature of the service. For example, financial services are generally supplied through affiliates located close to consumers. In contrast, audio visual services are predominantly traded across borders.25 Regardless, affiliate transactions (i.e., services provided by U.S. affiliates abroad) remain the principal means of providing services to overseas markets (box 1.2).
Box 1.2: The Rise of Affiliate Transactions
Since 1986, when the U.S. Department of Commerce began collecting statistics on U.S. services trade, the relative importance of cross-border trade and affiliate transactions has shifted significantly. In each of the 10 years from 1986 through 1995, U.S. cross-border exports of services exceeded sales by U.S. majority-owned foreign affiliates of U.S. firms. Since 1996, however, sales by U.S. firms’ foreign affiliates have exceeded U.S. exports of cross-border services. In 2013, services supplied by U.S. firms’ foreign affiliates abroad ($1.32 trillion) were almost double the value of U.S. cross-border exports of services ($664.9 billion). Similarly, services supplied by foreign-owned affiliates to U.S. residents have exceeded U.S. cross-border services imports since 1989. In 2013, the value of services supplied to U.S. residents by the U.S. affiliates of foreign companies ($878.5 billion) was nearly twice the value of U.S. cross-border services imports ($438.4 billion).a
The growing predominance of affiliate transactions largely reflects the global spread of service firms, facilitated by liberalization—the removal or lessening of barriers to trade—in investment and services.b
25 New developments in digital technology have allowed services, including financial services, which previously required person-to-person contact to be supplied digitally across borders. Chapter 3 discusses the effects of financial technology (or fintech) on banking services, while chapter 5 includes a discussion of the effects of innovations in securities services.

Recent Trends in U.S. Services Trade: 2016 Annual Report
U.S. International Trade Commission | 29
Liberalization first occurred in developed countries and has occurred more recently in a growing number of low- and middle-income countries.
a USDOC, BEA, Survey of Current Business, October 2015, 1–4; USDOC, BEA, table 2.1, “U.S. Trade in Services, by Type of Service,” October 15, 2015.
b Before 2004, retail banking services were not included in statistics measuring services supplied through foreign affiliates. The measurement of insurance services was also changed in that year. USDOC, BEA, Survey of Current Business, October 2015, 1.
Cross-border Trade, 2014 U.S. cross-border exports of private services26 totaled $690.1 billion in 2014, while U.S. imports totaled $453.3 billion, resulting in a $236.9 billion trade surplus (figure 1.2).27 As in previous years, in 2014 travel services and passenger fares accounted for the largest share of U.S. services trade, together representing 32 percent of both exports and imports. Financial services constituted a smaller share, accounting for 15 percent of both exports and imports (figure 1.3) and resulting in a surplus of $35.1 billion in 2014.
26 Cross-border services trade, as reported by the BEA, includes both private and public sector transactions. The latter principally reflect operations of the U.S. military and embassies abroad. However, because public sector transactions are not considered to reflect U.S. services industries’ competitiveness and may introduce anomalies resulting from events such as international peacekeeping missions, this report will focus solely on private sector transactions, except as noted. 27 The data presented in this section are drawn from the most complete BEA publication of services data to date, the Survey of Current Business released in October 2015. Some data referenced in other sections for 2013 and 2014 have been updated since that publication, and are sourced from the BEA Interactive Tables with access dates reported. Preliminary data regarding services exports and imports for 2015 are discussed in a subsequent section; however, those data are still subject to revision and are not available for all industries and countries.

Chapter 1: Introduction
30 | www.usitc.gov
Figure 1.2: U.S. services: Sales and purchases of services through affiliate transactions are almost twice the value of cross-border trade in services
Source: USDOC, BEA, table 2.1, “U.S. Trade in Services, by Type of Service,” October 15, 2015; table 3.1: “Services Supplied to Foreign Persons by U.S. MNEs through Their MOFAs, by Industry of Affiliate and by Country of Affiliate,” October 15, 2015; and table 4.1, “Services Supplied to U.S. Persons by Foreign MNEs through Their MOUSA, by Industry of Affiliate and by Country of UBO,” March 4, 2016. (See appendix table B.2.)
a Data for affiliates are available only through 2013. b Total cross-border exports and imports are based on revised 2014 data from the BEA; the most recent data for 2015 have
not been included due to their preliminary nature.
0
200
400
600
800
1,000
1,200
1,400
2006 2007 2008 2009 2010 2011 2012 2013 2014
Billi
on $
U.S. international services supplied
Sales of services by U.S.-owned foreign affiliatesa
U.S. cross-border exports of private servicesb
$1,321 billion
$690 billion
0
100
200
300
400
500
600
700
800
900
1,000
2006 2007 2008 2009 2010 2011 2012 2013 2014
Billi
on $
U.S. international services received
Purchases of services from foreign-owned U.S. affiliatesa
U.S. cross-border imports of private servicesb
$878 billion
$453 billion

Recent Trends in U.S. Services Trade: 2016 Annual Report
U.S. International Trade Commission | 31
Figure 1.3: U.S. services: Travel and passenger fares accounted for the largest share of U.S. cross-border trade in 2014
Source: USDOC, BEA, table 2.1., “U.S. Trade in Services, by Type of Service,” October 15, 2015. (See appendix table B.3.) Notes: Excludes public-sector transactions. Total exports and imports by sector are based on the latest BEA data for which all sectors are available.
Travel and passenger fares 32%
Professional 19% Financial 15%
Distribution 13%
Electronics 9%
Royalties & license fees 7% Other 3%
Imports Total = $453.3 billion
Travel and passenger fares 32%
Professional 20% Royalties & license fees 16%
Financial 15%
Electronics 8%
Distribution 7% Other 2%
Exports Total = $690.1 billion

Chapter 1: Introduction
32 | www.usitc.gov
In 2014, the value of U.S. cross-border services exports rose by 4 percent from 2013, which was down slightly from the previous year's increase (5 percent). Growth occurred in a number of services industries, led by professional services (10 percent); financial services (4 percent); and electronic services and travel services (both 3 percent).28 Exports of distribution services also rose 2 percent, while other services exports declined 3 percent, driven by decreases in operating leasing services and construction. Concurrently, the value of U.S. services imports rose 3 percent to $453.3 billion in 2014, virtually unchanged from the 3 percent growth reported the prior year. Imports grew the fastest in travel services (7 percent), followed by professional services (6 percent) and electronic services (5 percent). Imports declined in royalties and license fees (9 percent) and in financial services (3 percent), driven by decreases in other intellectual property services and insurance services, respectively.29
As in previous years, the majority of U.S. services industries had cross-border trade surpluses in 2014. Royalties and license fees had the largest surplus in 2014 ($80.3 billion), followed by travel services ($75.1 billion), professional services ($46.4 billion), and financial services ($35.1 billion). Distribution services was the only major sector with a cross-border services trade deficit ($12.9 billion). However, several subsectors also recorded trade deficits, including insurance services ($32.7 billion); computer services ($9.1 billion); and accounting, auditing, and bookkeeping services ($1.3 billion).30
Trade deficits occurred for several reasons. The deficit in distribution services31 largely reflects the deficit in U.S. merchandise trade and the payments of freight and port fees to transport those goods to the United States.32 The deficit in insurance services is principally the result of U.S. primary insurers’ payments to European and Bermudian reinsurers in return for their assuming a portion of large risks.33 The deficit in computer services largely reflects U.S. firms offshoring many of these services to foreign providers, particularly those in India. For example, in 2014, the United States imported $10.6 billion in computer services from India, a 7 percent increase over the previous year. Similarly, the deficit in accounting, auditing, and bookkeeping
28 USDOC, BEA, Survey of Current Business, October 2015, 2, table 2.1. 29 Ibid. 30 Ibid. 31 BEA data on cross-border exports and imports of distribution services include data on air freight and airport services; sea freight and seaport services; and trade-related services. In 2014, the cross-border deficit in distribution services was driven by deficits in the sea freight, airport, and trade-related services categories. 32 For example, Chinese shipments of manufactured goods to the United States typically exceed U.S. shipments of goods to China; payments to Chinese or other foreign shippers for transporting U.S. merchandise imports are recorded by the BEA as U.S. imports of transportation services. 33 Reinsurance is a form of risk management whereby insurance companies buy insurance contracts from other insurers to protect themselves from unexpected large claims. Many reinsurers locate themselves in Bermuda due to the island’s favorable tax policies.

Recent Trends in U.S. Services Trade: 2016 Annual Report
U.S. International Trade Commission | 33
services may also reflect the offshoring of certain internal operations to offset the U.S. industry’s high labor costs.34
Major U.S. trading partners in services for 2014 have not changed significantly from 2013. A small number of developed countries continue to account for a large share of U.S. cross-border services trade. Canada, the UK, and Japan collectively received 25 percent of total U.S. cross-border services exports in 2014. Similarly, the UK (11 percent), Canada (7 percent) and Japan and Germany (6 percent each) supplied the largest shares of U.S. services imports. In 2014, the European Union (EU) accounted for 31 percent of U.S. services exports and 35 percent of U.S. services imports.35
Cross-border Trade, 2015 Preliminary data for 2015 suggest a small increase in total U.S. services exports, while imports continued to grow at a higher but still modest rate that year. Annual services exports were reported to be $730.6 billion in 2015, while annual services imports totaled $467.1 billion in the same year (table 1.1).36 As a result, in 2015, the United States recorded a services trade surplus of $263.5 billion, down from the previous year.37 Initial data also indicate that in 2015, the UK, Canada, and Japan remained the largest recipients of U.S. cross-border services exports, while the UK, Canada, and Germany (followed closely by Japan) were the largest sources of U.S. services imports.38
34 Morea, “Accounting Services in the U.S.,” November 2013, 10. However, growth in offshoring has slowed in recent years as rising wages in major outsourcing destinations, such as India, have reduced foreign workers’ competitive advantage. Economist, “India’s Outsourcing Business,” January 19, 2013. 35 USDOC, BEA, Survey of Current Business, October 2015, 3, table 2.2. 36 The data regarding exports and imports for 2015 discussed in this section are preliminary; the data do not contain breakdowns for all countries and certain industries, which are included in the data reported for 2014 referenced in the previous section. Year-on-year growth calculations in this section use data for 2014 which has been updated by the BEA as part of its regular release schedule, and may contain slight revisions from the figures published in the BEA’s 2015 Survey of Current Business. The BEA is scheduled to publish its full report covering international trade in services in October 2016. 37 USDOC, BEA, table 3.1, “U.S. International Trade in Services,” June 16, 2016. 38 USDOC, BEA, table 1.3, “U.S. International Trade in Services,” July 19, 2016.

Chapter 1: Introduction
34 | www.usitc.gov
Table 1.1: U.S. private services exports and imports to the world, by category, 2015 (billion dollars)
Service industry Exports
2015 Imports
2015 Travel and passenger fares 246.2 148.4 Royalties and license feesa 124.7 40.4 Financial services 119.6 39.5 Banking 74.2 37.3 Securities 28.2 32.0 Insurance 17.1 26.9 Professional and management consulting services 64.9 27.8 Technical, trade-related, and other business servicesb 35.2 72.9 Research and development services 34.5 47.8 Maintenance and repair services, n.i.e. 24.0 17.9 Air transport (excludes passenger fares) 23.0 7.3 Other 58.4 41.9
Total 730.6 467.1
Source: USDOC, BEA, table 3.1, “U.S. International Trade in Services,” June 16, 2016. Notes: Data for 2015 are preliminary. n.i.e. = not included elsewhere. Excludes public-sector transactions.
a Royalties and license fees (also called charges for the use of intellectual property, n.i.e.) includes processes, computer software, trademarks and franchise fees, audiovisual and related products, and other intellectual property.
b Technical, trade-related, and other business services includes construction, architectural and engineering services, waste treatment, operational leasing, trade-related, and other business services.
Affiliate Transactions, 2013 In 2013, services supplied by U.S.-owned foreign affiliates39 rose 3 percent to slightly more than $1.3 trillion.40 Distribution services—including wholesale trade, retail trade, and transportation and warehousing services—was again the category with the largest share of sales, with 31 percent of total services provided by U.S.-owned foreign affiliates (figure 1.4). Financial services ranked second, with 20 percent of affiliate transactions. The largest foreign purchasers of services from U.S.-owned foreign affiliates were the UK (14 percent), Canada (10 percent), Ireland (7 percent), and Japan (5 percent). The EU received 42 percent of total services supplied by U.S.-owned foreign affiliates in 2013.41
The value of services purchased from foreign-owned affiliates in the United States grew by 8 percent in 2013 to $878.5 billion. This increase outpaced the 7 percent annual growth registered during 2009–12. Distribution services remained the largest category in 2013, representing 28 percent of purchases from foreign-owned affiliates in the United States, while financial services accounted for 21 percent. By country, Japanese-owned firms accounted for 17 percent, supplying the largest share of purchases in 2013, followed by UK- and German-owned affiliates (representing 14 percent each). French and Canadian firms rounded out the
39 U.S.-owned foreign affiliates are affiliates owned by a U.S. parent company and located abroad; conversely, foreign-owned U.S. affiliates are affiliates located in the United States and owned by foreign parent companies. 40 The main source for this section is the USDOC, BEA, Survey of Current Business, October 2015. 41 USDOC, BEA, Survey of Current Business, October 2015, 19–23, tables 8–10.2.

Recent Trends in U.S. Services Trade: 2016 Annual Report
U.S. International Trade Commission | 35
top five with 10 percent each. Overall, 51 percent of purchases in the United States from foreign-owned affiliates were from affiliates of EU-based parent firms.
Figure 1.4: U.S. services: Distribution accounted for the largest share of U.S. affiliate transactions in 2013
Source: USDOC, BEA, Table 3.1 “Services Supplied to Foreign Persons by U.S. MNEs through Their MOFAs, by Industry of Affiliate and by Country of Affiliate,” October 15, 2015, and table 4.1, “Services Supplied to U.S. Persons by Foreign MNEs. through their MOUSA, by Industry of Affiliate and by Country of UBO,” March 4, 2016. (See appendix table B.4.)
a Services supplied by majority-owned foreign affiliates of U.S. parent firms. b Includes ancillary services provided by goods manufacturers, such as computer hardware services. Data are underreported
by the BEA to avoid disclosing individual company information. c Data are underreported by the BEA to avoid disclosing individual company information. d Services supplied by majority-owned U.S. affiliates of foreign parent firms. e Includes ancillary services provided by goods manufacturers, such as computer hardware services.
Distribution 31%
Financial services 20% Electronics 11%
Professional services 5%
Manufacturing 2%
Other services (includes suppressed
data) 31%
U.S.-owned foreign affiliatesa
Total = $1,321 billion
c
b
Distribution 28%
Financial services 21% Electronics 14%
Professional services 10%
Manufacturinge 9%
Other services 17%
Foreign-owned U.S. affiliatesd
Total = $878.5 billion

Chapter 1: Introduction
36 | www.usitc.gov
Bibliography Economist. “India’s Outsourcing Business,” January 19, 2013.
http://www.economist.com/news/special-report/21569571-india-no-longer-automatic-choice-it-services-and-back-office-work-turn.
European Commission (EC). Eurostat. “International Trade in Services (since 2010) (BPM6).” http://appsso.eurostat.ec.europa.eu/nui/submitViewTableAction.do.
Morea, Stephen. Accounting Services in the U.S. IBISWorld Industry Report 54121c, November 2013. http://www.ibisworld.com/.
U.S. Department of Commerce (USDOC). Bureau of Economic Analysis (BEA). “Frequently Asked Questions,” March 10, 1006. http://www.bea.gov/faq/index.cfm?faq_id=182.
———.Bureau of Economic Analysis (BEA). Survey of Current Business 95, no. 10 (October 2015).
———.Bureau of Economic Analysis (BEA). Survey of Current Business 89, no. 10 (October 2009).
———.Bureau of Economic Analysis (BEA). Survey of Current Business 94, no. 10 (October 2014).
———.Bureau of Economic Analysis (BEA). “Comprehensive Restructuring and Annual Revision,” July 2014. http://www.bea.gov/scb/pdf/2014/07%20July/0714_annual_international_transactions_accounts.pdf.
———.Bureau of Economic Analysis (BEA). U.S. International Economic Accounts: Concepts and Methods, September 2014. http://www.bea.gov/international/pdf/concepts-methods/14%20Chapter%20ITA-Methods.pdf.
———.Bureau of Economic Analysis (BEA). “The Comprehensive Restructuring of International Economic Accounts,” March 2014. http://www.bea.gov/scb/pdf/2014/03%20March/0314_restructuring_the_international_economic_accounts.pdf.

Recent Trends in U.S. Services Trade: 2016 Annual Report
U.S. International Trade Commission | 37
———.Bureau of Economic Analysis (BEA). “Real Value Added by Industry.” Interactive tables: Gross Domestic Product by Industry Accounts, April 16, 2016. http://www.bea.gov/iTable/iTable.cfm?ReqID=51&step=1#reqid=51&step=3&isuri=1&5102=10.
———.Bureau of Economic Analysis (BEA). Table 6.5D, “Full-Time Equivalent Employees by Industry.” Interactive tables: Gross Domestic Product by Industry Accounts, August 3, 2016. http://www.bea.gov/iTable/iTable.cfm?ReqID=9&step=1#reqid=9&step=1&isuri=1.
———.Bureau of Economic Analysis (BEA). Table 6.3D, “Wage and Salary Accruals per Full Time Equivalent Employee by Industry.” Interactive tables: National and Product Accounts, August 3, 2016. http://www.bea.gov/iTable/iTable.cfm?ReqID=9&step=1#reqid=9&step=1&isuri=1.
———.Bureau of Economic Analysis (BEA). Table 1.3, “U.S. International Transactions, Expanded Detail by Area and Country.” Interactive tables: International Data, International Transactions, June 16, 2016. http://www.bea.gov/iTable/iTable.cfm?ReqID=62&step=1#reqid=62&step=6&isuri=1&6210=1&6200=1.
———.Bureau of Economic Analysis (BEA). Table 2.1, “U.S. Trade in Services, by Type of Service.” Interactive tables: International Data, International Services, October 15, 2015. http://www.bea.gov/iTable/iTable.cfm?ReqID=62&step=1#reqid=62&step=6&isuri=1&6210=4&6200=160.
———.Bureau of Economic Analysis (BEA). Table 3.1, “Services Supplied to Foreign Persons by U.S. MNEs through Their MOFAs, by Industry of Affiliate and by Country of Affiliate.” Interactive tables: International Data, International Services, October 15, 2015. http://www.bea.gov/iTable/iTable.cfm?ReqID=62&step=1#reqid=62&step=6&isuri=1&6210=4&6200=231.
———.Bureau of Economic Analysis (BEA). Table 4.1, “Services Supplied to U.S. Persons by Foreign MNEs through Their MOUSA, by Industry of Affiliate and by Country of UBO.” Interactive tables: International Data, International Services, October 15, 2015. http://www.bea.gov/iTable/iTable.cfm?ReqID=62&step=1#reqid=62&step=6&isuri=1&6210=4&6200=237.

Chapter 1: Introduction
38 | www.usitc.gov
World Trade Organization (WTO). International Trade Statistics 2015. Table A9, “World Imports of Commercial Services by Region and Selected Economy, 2004–2014.” https://www.wto.org/english/res_e/statis_e/its2015_e/appendix_e/a09.xls (accessed March 1, 2016).
———.International Trade Statistics 2015. Table A8, “World Exports of Commercial Services by Region and Selected Economy, 2004–2014.” https://www.wto.org/english/res_e/statis_e/its2015_e/appendix_e/a08.xls (accessed March 1, 2016).

U.S. International Trade Commission | 47
Chapter 2 Financial Services Overview Financial services represent a broad range of sectors that facilitate monetary transactions, mobilize savings, allocate capital, and transform risk. Principal sectors include banking, insurance, and securities services. Well-developed financial services systems42 promote economic efficiency, lower transaction costs, facilitate personal and commercial transactions, and direct savings to economically productive activities.43 Although they account for a relatively small share of output in most countries (about 7 percent of GDP in the United States), financial services provide the economic infrastructure necessary for modern economies to function.44 As such, financial services are essential to the production of nearly all goods and other services, and facilitate international trade. There is a strong positive connection between the strength of a country’s financial system and its economic growth and stability.45 The critical importance of financial services to the global economy is underscored by the fact that it is one of the few services industries that has international regulatory standards.
The depth of the 2008–09 global recession—which erased an estimated $50 trillion in global wealth46—and the relatively slow pace of recovery afterwards resulted, in part, from systemic failures in the financial sector.47 Strong linkages between financial services providers caused the crisis to spread quickly throughout the United States and the global economy. Seven years on, U.S. and global financial services firms’ revenue growth is just now recovering to pre-crisis
42 The financial system includes the universe of financial services institutions, including the private firms and government regulators that comprise an economy’s financial services sector. 43 Well-developed banking and securities sectors are seen as lowering transaction costs and enhancing resource allocation, while insurance services encourage economic activity by mitigating risks and providing security to individuals, businesses, and communities. World Bank, “Financial Sector,” World Bank Open Data, http://data.worldbank.org/topic/financial-sector (accessed May 12, 2016); United Nations Conference on Trade and Development (UNCTAD), “About the Insurance Program,” http://unctad.org/en/Pages/DIAE/Enterprise%20Development/Insurance/Insurance-about-the-Programme.aspx (accessed June 4, 2016). 44 Dobson, “Financial Services and International Trade Agreements,” 2008, 290. 45 For developed and developing countries. Gopalan, “Does Foreign Bank Entry Contribute to Financial Depth?” February 2015. 46 Summers, “Economic Crisis and Recovery,” March 13, 2009. Declines in U.S. income were estimated at $6 trillion–$14 trillion. Ball, “Long-Term Damage from the Great Recession,” May 2015; Atkinson, Lattrell, and Rosenblum, “How Bad Was It?” July 2013, 2. 47 For an in-depth analysis of the global financial crisis, see Financial Crisis Inquiry Commission, Financial Crisis Inquiry Report, January 2011.

Chapter 2: Financial Services
48 | www.usitc.gov
levels.48 However, financial services firms are facing challenges and disruptions from digital technologies, which are changing the way financial services are supplied and consumed. In addition, firms must deal with substantial new international and national regulatory measures that are aimed at averting another global financial crisis, but may also be inhibiting trade. In addition, the UK’s referendum to exit the EU roiled global financial markets in the short term, and may have significant long-term consequences for the global financial sector.49 Digital and regulatory challenges, briefly discussed below, are more deeply covered in the sector-specific chapters.50
Digital Technologies Are Transforming Financial Services Digital technologies and the Internet are changing the global financial system, altering the composition of financial activity, and challenging the dominance of large traditional suppliers.51
This transformation is being driven by coinciding demand and supply factors. Demographic and behavioral changes from a new generation of digitally enabled consumers, who are increasingly using digital devices to conduct commercial transactions online, are challenging the sector.52 Traditional financial services firms are also facing strong supply pressures from non-bank financial firms (fintech) that are capturing revenues through online channels.53 One survey of high-level business leaders indicated that over 60 percent of financial services executives anticipate that their firms would be “moderately to massively disrupted” by digital technology in 2016.54 Another survey, which revealed that nearly half of financial services executives viewed “digital disruption” as an existential threat to their firms, ranked financial services along with travel, media, and retail as the most threatened industries.55
Smartphones, in particular, are transforming the way U.S. and global consumers access financial services. According to the Federal Reserve, over half of U.S. smartphone owners used their
48 BCG, “Banking on Digital Simplicity,” May 2016, 8. 49 The referendum occurred on June 23, 2016. 50 Potential effects of the UK exit from the EU are discussed in chapter 3, textbox 3.2. 51 WTO, “Financial Services: Developments in the Sector” (accessed June 7, 2016). 52 BCG, “Banking on Digital Simplicity,” May 2016; Kenth, “Top Six Trends,” April 6, 2015. Some observers refer to the challenges and opportunities of digital technology as “digital disruption.” Such disruption can alter a firm’s or industry’s existing business models. In some cases, new digital technology can enhance the way businesses operate; in others, the new technology may cause them to exit the industry altogether. 53 Financial firms are also facing competition from other traditional providers that are investing heavily in digital services to offer multichannel (online and in-person) services to financial services customers. Denecker, Gulati, and Niedekorn, “The Digital Battle,” August 2014. 54 For consumer financial services. Grossman, “The Industries That Are Being Disrupted,” March 21, 2016. 55 Bradley et al., “Digital Vortex,” June 2015, 3.

Recent Trends in U.S. Services Trade: 2016 Annual Report
U.S. International Trade Commission | 49
devices to access retail banking services in 2014.56 One-third of U.S. consumers are now using mobile phones to make payments, using such nontraditional channels as PayPal, Square, and Google Pay.57 In addition, private sector survey data for 2015 indicate that the share of banking conducted digitally (online and mobile) is surpassing all other channels, including branch banking and ATM transactions, in many global markets.58
Digital disruption is also occurring in the insurance industry, with activities such as underwriting and pricing increasingly being automated and moving to online platforms. These changes diminish the traditional advantages of size and scale.59 Both large and small insurance firms are using social media, data analytics, and proprietary databases to access new customers, helping to transform the traditional business models of large dominant insurance providers.60 Securities firms also face digital disruption from the increased availability of data and information online, including wealth management programs and online trading, which reduces demand for traditional securities intermediation services. Consumers seeking lower-cost alternatives are turning to a range of providers, including digitally based, nontraditional securities firms that have recently entered the market.61 According to one report, one-fifth of new fintech firms have targeted the securities industry.62
New Post-crisis Financial Regulations Are Impacting Large Firms and Trade In the wake of the 2008–09 financial crisis, banks are facing increasing regulation, which raises their compliance costs, as well as a fragmented regulatory environment across markets that complicates trade in financial services. In an attempt to safeguard the global financial system, regulators in the United States and across the globe have introduced reforms meant to strengthen banks, insurance providers, and securities firms in the event of future instability. These rules have increased costs for financial institutions, particularly larger banking and securities firms, which now must devote more resources to comply with these regulations.63 Insurance firms have also been affected, with new rules requiring them to hold more capital.64
56 Federal Reserve, “Consumers and Mobile Financial Services 2015,” March 2015, 1. 57 McKinsey, “The Digital Battle That Banks Must Win,” August 2014. 58 The digital share of banking transactions doubled from 2013 to 2015 and accounts for over half (54 percent) of all transactions, based on country surveys of banks in nine key financial centers. BCG, “Banking on Digital Simplicity,” May 2016. 59 Deloitte, “Insurers on the Brink,” 2016, 5. 60 IBISWorld, Global Direct General Insurance Carriers, January 2016, 8. 61 Accenture, “Digital Disruptions in Investment Banking,” 2014, 1; BCG, “Global Capital Market 2015: Adapting to Digital,” 2015. 62 BCG, “Global Capital Market 2015: Adapting to Digital,” 2015, 10. 63 PricewaterhouseCoopers, Smart Implementation: Reining in the Risk, December 2012. 64 Bank of America Merrill Lynch, “Navigating Solvency II and Basel III,” September 2012.

Chapter 2: Financial Services
50 | www.usitc.gov
The variation in regulations across markets also makes trade more costly and complicated, since financial services firms need to comply with the different laws and regulations in each country where they operate.65 Efforts by countries to harmonize rules or to engage in other forms of regulatory cooperation are beginning to address some of these concerns. However, the proliferation of trade agreements, investment treaties, and other arrangements with varying provisions for financial services may themselves introduce additional complications at the regional level. An example would be the need to reconcile differing measures concerning the transfer of financial data in the Trans-Pacific Partnership (TPP) agreement compared to previous agreements, such as the U.S.-Korea Free Trade Agreement.66 A discussion of how financial services are treated in trade agreements is provided in box 2.1.
Box 2.1: Financial Services in Trade Agreements
Developed countries often regard their securities services firms as internationally competitive, and in negotiating trade agreements they prioritize opening new markets to cross-border and affiliate financial services trade. However, while parties to an agreement usually share the broad goals of increased market access, financial services are difficult to liberalize. Attempts to do so usually require lengthy technical annexes just to achieve commitments that often fall short the financial services sector’s goals.a For example, in many U.S. trade agreements, cross-border financial services liberalization is limited to a few subsectors such as reinsurance, auxiliary insurance services, and financial data processing.
These gaps remain because financial services are inseparable from complex domestic regulations, and negotiations over such regulations can raise deep technical challenges and political disagreements. Financial services involve many complex issues: the juridical form of banks; the role of monopolies and exclusive suppliers; public procurement and subsidies; transfers of financial information; access to payment and clearing systems; and interpretations of international supervisory standards (including treatment of tax evasion). They also touch on areas of fundamental state sovereignty, such as monetary and exchange rate policy and social insurance policy.
Typically, trade agreements will promote regulatory cooperation but affirm that domestic regulators have broad rights to protect investors and ensure systemic financial stability.b Many trade negotiation participants differ in their technical approaches to key regulatory issues, such as in distinguishing investment and commercial banking activities. This also applies to areas of regulation that affect financial services indirectly. For example, different attitudes towards data protection are one reason the
65 OECD, “Tackling Policy Fragmentations,” June 9, 2016. These legal regimes include not only prudential financial regulations such as Dodd-Frank, but also laws covering bribery, money laundering, and data privacy (including forced data localization). A comprehensive set of global reforms, introduced by the Basel III Committee, has increased capital requirements and leverage ratios, with the largest and most connected banks expected to hold more liquid reserves. See chapter 3 of this report for a discussion of international banking standards under Basel III. 66 The U.S.-Korea Free Trade Agreement contains provisions encouraging members to refrain from imposing restrictions on data flows, including those relating to financial services. By contrast, while the TPP contains stronger language prohibiting forced data localization, it specifically exempts financial services from this commitment. Elliott et al., “Assessing the Trans-Pacific Partnership,” February 2016, 9; Meltzer, “The Internet, Cross-Border Data Flows,” February 2013.

Recent Trends in U.S. Services Trade: 2016 Annual Report
U.S. International Trade Commission | 51
Trans-Pacific Partnership (TPP) agreement permits forced localization for financial data but not for nonfinancial data.c
Furthermore, for parties like the United States and the EU, financial services are regulated at the national and subnational levels. Even within countries, there are varying approaches to issues like foreign ownership and permitted activities. There is also a fine line between liberalizing capital movements and liberalizing services that involve international capital transactions. Trade agreements typically address the former while preserving the rights of governments to set policies on overall capital inflows and outflows. For instance, the General Agreement on Trade in Services (GATS) allows signatories to suspend their commitments in case of a balance-of-payments crisis, so long as such suspensions do not discriminate among WTO members.d
There are different international forums where parties discuss regulatory harmonization. Part of the context for the Transatlantic Trade and Investment Partnership (TTIP) negotiations is that the EU would like to include more regulatory issues in TTIP, but the U.S. government prefers venues like the G20 and the Financial Market Regulatory Dialogue.e Within countries there are disagreements between regulators and the private sector. For instance, in the United States the Securities Industry and Financial Markets Association (SIFMA) has expressed strong support for including financial regulatory coordination in TTIP.f
Financial services trade will likely continue to become more complicated and cross-jurisdictional, requiring more time and resources from negotiators in the future. At the same time, multinational regulatory cooperation will likely become more important as a long-term public good that can prevent arbitrage and “jurisdictional shopping,” thereby increasing global financial stability.g
a ITAC-10, Advisory Committee Report, December 3, 2015. b Lang and Conyers, Financial Services in EU Trade Agreements, October 2014, 37. c Treasury Secretary Jack Lew notes that U.S. financial regulators need this carve-out in order to access and review data that
otherwise may be stored overseas. Guida, “Lew Defends Financial Services Data Carveout,” February 11, 2016. Localization refers to a country requiring data to be stored in computer systems located within its borders.
d IMF, “Reference Note on Trade in Financial Services,” September 3, 2010, 6. e Puccio, TTIP and Regulation of Financial Markets, June 2015. f SIFMA, “SIFMA Joins U.S. and EU Entities Urging TTIP,” February 21, 2016. g Bickel, “Harmonizing Regulations in the Financial Services Industry,” 2015.
U.S. Trade in Financial Services Financial services was the third-largest category of U.S. services trade in 2015, accounting for almost 16 percent of both total U.S. cross-border services exports and imports.67 In that year, U.S. financial services exports reached $119.6 billion, down slightly from $125.0 billion in 2014,
67 USDOC, BEA, table 2.1, “U.S. Trade in Services, by Type of Service” (accessed June 20, 2016). Cross-border trade data on financial services encompass securities services, banking services, insurance services, and rental and leasing services (excluding real estate). Other aspects of financial services, such as retail banking, are reported as affiliate transactions and discussed separately. Banking, insurance, and securities are discussed in depth in chapters 3, 4, and 5, respectively.

Chapter 2: Financial Services
52 | www.usitc.gov
while U.S. imports totaled $72.9 billion, down from $76.7 billion in 2014. U.S. financial services thus recorded a trade surplus of $46.7 billion in 2015, down slightly from $48.3 billion in 2014.68
In 2015, banking services (including financial management, credit card processing, and credit-related services, but excluding retail banking)69 accounted for 62 percent ($74.2 billion) of total U.S. financial services exports and 25 percent ($17.9 billion) of imports, producing a trade surplus of $56.4 billion (figure 2.1). By comparison, securities services (including brokerage, underwriting, and lending) made up 24 percent ($28.2 billion) of total U.S. financial services exports and 10 percent ($7.3 billion) of imports in the same year, rendering a surplus of $20.9 billion.
The largest category of imports was insurance services (including direct insurance, reinsurance, and auxiliary insurance services). It represented 66 percent ($47.8 billion) of financial services imports but only 14 percent ($17.1 billion) of exports, resulting in a large trade deficit of $30.6 billion. In 2014, the top three markets for U.S. exports of insurance services were Bermuda (20 percent), Canada (17 percent), and the UK (11 percent). By contrast, the UK (17 percent), Canada (7 percent), and Belgium-Luxembourg (4 percent) were the largest export markets for banking and securities services combined.70
68 USDOC, BEA, Survey of Current Business, October 2015, table 2.1, “U.S. Trade in Services, 2006–2014,” 1–2. 69 The majority of U.S. trade in banking services occurs through foreign affiliates (GATS mode 3; see box 1.1). The BEA does not publish data on cross-border trade in retail banking services, although a small amount of trade may be occurring digitally through new financial technologies discussed in chapter 3. 70 The BEA does not publish disaggregated data by country for trade in banking and security services, but does publish data by country for banking and securities combined.
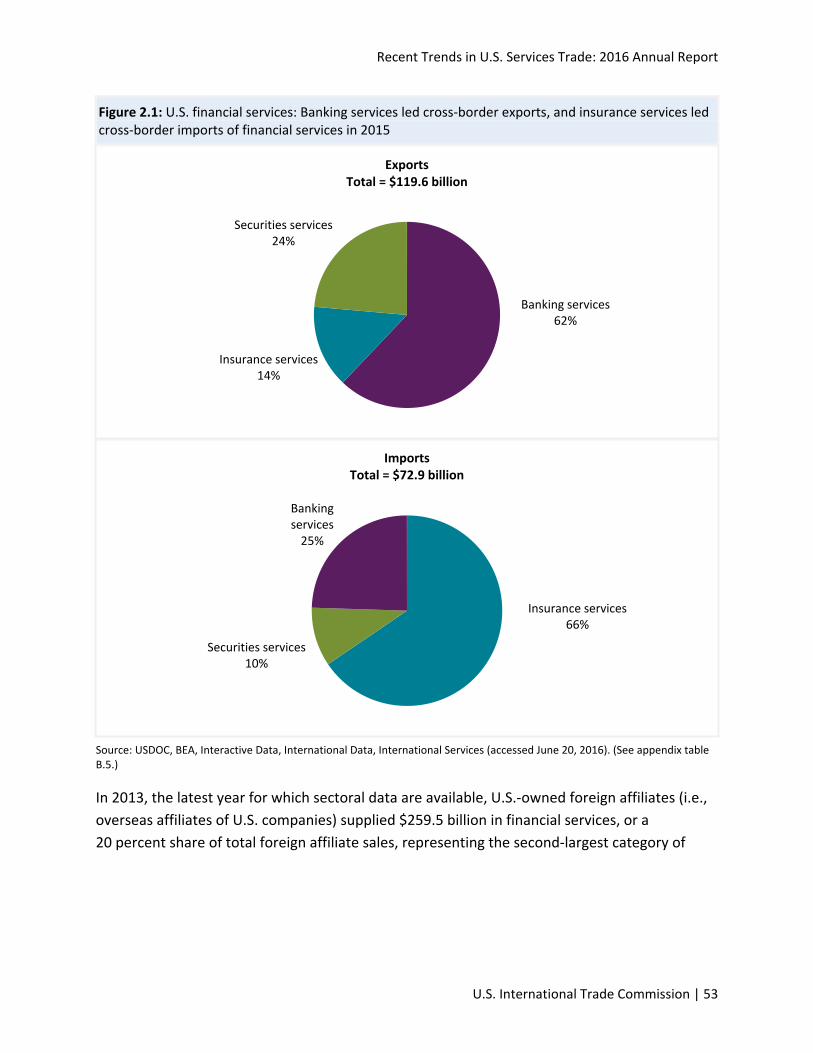
Recent Trends in U.S. Services Trade: 2016 Annual Report
U.S. International Trade Commission | 53
Figure 2.1: U.S. financial services: Banking services led cross-border exports, and insurance services led cross-border imports of financial services in 2015
Source: USDOC, BEA, Interactive Data, International Data, International Services (accessed June 20, 2016). (See appendix table B.5.)
In 2013, the latest year for which sectoral data are available, U.S.-owned foreign affiliates (i.e., overseas affiliates of U.S. companies) supplied $259.5 billion in financial services, or a 20 percent share of total foreign affiliate sales, representing the second-largest category of
Banking services 62%
Insurance services 14%
Securities services 24%
Exports Total = $119.6 billion
Insurance services 66%
Securities services 10%
Banking services
25%
Imports Total = $72.9 billion

Chapter 2: Financial Services
54 | www.usitc.gov
services sold by U.S.-owned foreign affiliates after distribution services.71 Within financial services, securities services accounted for the largest share of U.S.-owned foreign affiliate sales, at 39 percent ($102.3 billion) (figure 2.2). Insurance also accounted for a significant share (25 percent or $64.3 billion) of sales by U.S.-owned foreign affiliates in 2013, followed closely by banking services (21 percent or $57.6 billion).72
Financial services purchased from foreign-owned U.S. affiliates (i.e., affiliates of foreign firms located in the United States) were valued at $182.9 billion in 2013, or 21 percent of total services purchases. Insurance services represented the largest share of purchases from foreign-owned U.S. affiliates in financial services, totaling $69.5 billion (38 percent), followed closely by securities services, at $61.8 billion (34 percent), and banking services at $44.9 billion (25 percent).73
71 BEA reports U.S. affiliate data differently than cross-border data, due to discrepancies in data availability and company reporting standards. In addition, BEA may understate or exclude certain data segments, such as affiliate transactions, to avoid disclosing proprietary information of individual companies. Data on affiliate sales in financial services are disaggregated into the following four broad categories: depository credit intermediation (banking), finance (except depository institutions), rental and leasing services (excluding real estate), and insurance carriers and related activities. Further, the BEA disaggregates data on cross-border trade for financial services into four categories: securities brokerage, underwriting, and related services; financial management, financial advisory, and custody services; credit card and other credit-related services; and securities lending, electronic funds transfer, and other services. Data on insurance services are also divided into direct insurance, reinsurance, and auxiliary insurance services. 72 USDOC, BEA, Survey of Current Business, October 2015, table 2.1. Rental and leasing services accounted for the remaining share of such sales (15 percent). 73 USDOC, BEA, Survey of Current Business, October 2015. Rental and leasing services accounted for the remaining share of such purchases (9 percent).

Recent Trends in U.S. Services Trade: 2016 Annual Report
U.S. International Trade Commission | 55
Figure 2.2: U.S. financial services: Securities services were the largest category of financial services sales by foreign affiliates of U.S. firms in 2013, and insurance was the largest category of purchases from U.S. affiliates of foreign firms
Source: USDOC, BEA, Interactive Data, International Data, International Services (accessed April 28, 2016). (See appendix table B.6.)
GDP, Employment, Labor Productivity, and Salaries The contribution of U.S. private sector financial services to the U.S. private sector GDP (including goods and services) in 2015 was $1.2 trillion, accounting for 8.7 percent of total U.S. private sector GDP (table 2.1).74 Insurance and banking services each represented around one-third of financial services’ contribution to U.S. private sector GDP in that year, followed by securities services (17.6 percent) and rental and leasing services (16.4 percent) (table 2.2). Rental and leasing services also registered the highest growth rate within financial services (9.4 percent) from 2014 to 2015, while securities services contracted slightly over the same period. However, from 2010 to 2014 both insurance and rental and leasing services increased at an average annual rate of 3.2 percent. From 2014 to 2015, total financial services grew by 2.6 percent, slightly slower than the U.S. private sector as a whole, and the average annual rate
74 USDOC, BEA, “Real Value Added by Industry,” 2015. By comparison, professional services accounted for 18.4 percent of total U.S. private sector GDP in 2014, while distribution services accounted for 16.7 percent; electronic services, 6.0 percent; and other services (including real estate), 27.9 percent.
-
20
40
60
80
100
120
Securities services Insurance services Banking services Rental and leasing(except real estate)
Billi
on $
U.S.-owned foreign affiliates Foreign-owned U.S. affiliates
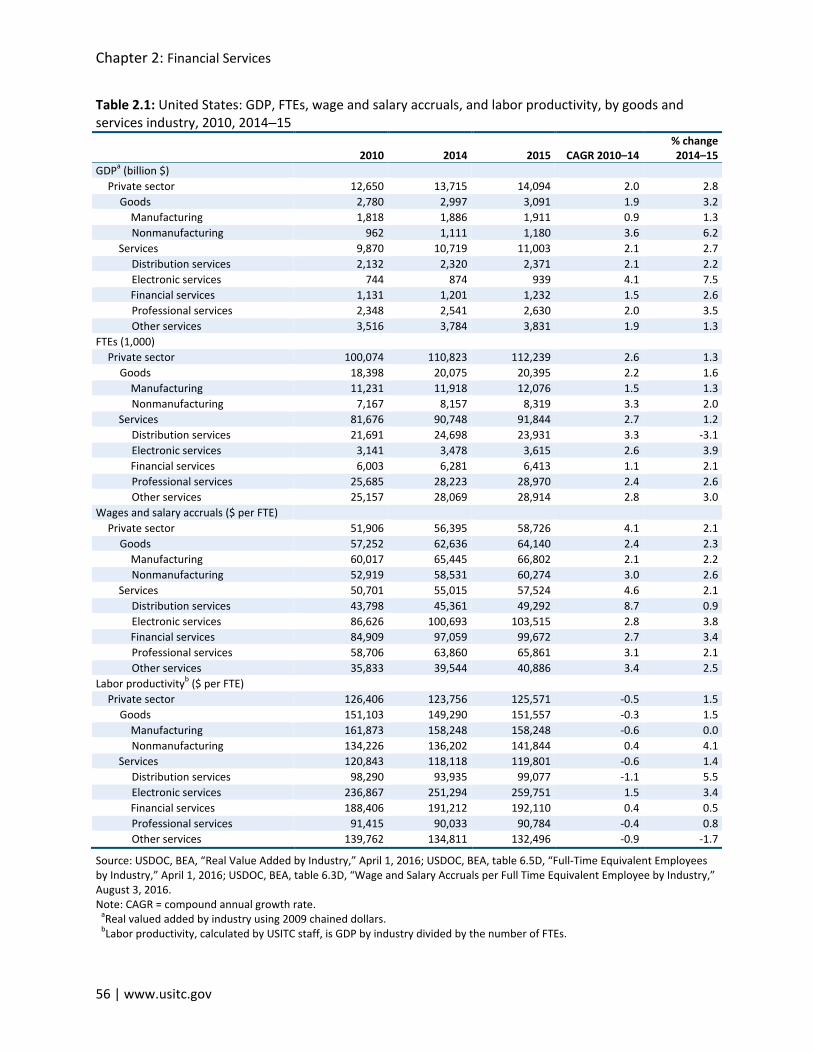
Chapter 2: Financial Services
56 | www.usitc.gov
Table 2.1: United States: GDP, FTEs, wage and salary accruals, and labor productivity, by goods and services industry, 2010, 2014–15
2010 2014 2015 CAGR 2010–14 % change 2014–15
GDPa (billion $) Private sector 12,650 13,715 14,094 2.0 2.8
Goods 2,780 2,997 3,091 1.9 3.2 Manufacturing 1,818 1,886 1,911 0.9 1.3 Nonmanufacturing 962 1,111 1,180 3.6 6.2
Services 9,870 10,719 11,003 2.1 2.7 Distribution services 2,132 2,320 2,371 2.1 2.2 Electronic services 744 874 939 4.1 7.5 Financial services 1,131 1,201 1,232 1.5 2.6 Professional services 2,348 2,541 2,630 2.0 3.5 Other services 3,516 3,784 3,831 1.9 1.3
FTEs (1,000) Private sector 100,074 110,823 112,239 2.6 1.3
Goods 18,398 20,075 20,395 2.2 1.6 Manufacturing 11,231 11,918 12,076 1.5 1.3 Nonmanufacturing 7,167 8,157 8,319 3.3 2.0
Services 81,676 90,748 91,844 2.7 1.2 Distribution services 21,691 24,698 23,931 3.3 -3.1 Electronic services 3,141 3,478 3,615 2.6 3.9 Financial services 6,003 6,281 6,413 1.1 2.1 Professional services 25,685 28,223 28,970 2.4 2.6 Other services 25,157 28,069 28,914 2.8 3.0
Wages and salary accruals ($ per FTE) Private sector 51,906 56,395 58,726 4.1 2.1
Goods 57,252 62,636 64,140 2.4 2.3 Manufacturing 60,017 65,445 66,802 2.1 2.2 Nonmanufacturing 52,919 58,531 60,274 3.0 2.6
Services 50,701 55,015 57,524 4.6 2.1 Distribution services 43,798 45,361 49,292 8.7 0.9 Electronic services 86,626 100,693 103,515 2.8 3.8 Financial services 84,909 97,059 99,672 2.7 3.4 Professional services 58,706 63,860 65,861 3.1 2.1 Other services 35,833 39,544 40,886 3.4 2.5
Labor productivityb ($ per FTE) Private sector 126,406 123,756 125,571 -0.5 1.5
Goods 151,103 149,290 151,557 -0.3 1.5 Manufacturing 161,873 158,248 158,248 -0.6 0.0 Nonmanufacturing 134,226 136,202 141,844 0.4 4.1
Services 120,843 118,118 119,801 -0.6 1.4 Distribution services 98,290 93,935 99,077 -1.1 5.5 Electronic services 236,867 251,294 259,751 1.5 3.4 Financial services 188,406 191,212 192,110 0.4 0.5 Professional services 91,415 90,033 90,784 -0.4 0.8 Other services 139,762 134,811 132,496 -0.9 -1.7
Source: USDOC, BEA, “Real Value Added by Industry,” April 1, 2016; USDOC, BEA, table 6.5D, “Full-Time Equivalent Employees by Industry,” April 1, 2016; USDOC, BEA, table 6.3D, “Wage and Salary Accruals per Full Time Equivalent Employee by Industry,” August 3, 2016. Note: CAGR = compound annual growth rate. aReal valued added by industry using 2009 chained dollars. bLabor productivity, calculated by USITC staff, is GDP by industry divided by the number of FTEs.

Recent Trends in U.S. Services Trade: 2016 Annual Report
U.S. International Trade Commission | 57
Table 2.2: United States: GDP, FTEs, wage and salary accruals, and labor productivity, by services industry, 2010, 2014–15
2010 2014 2015 CAGR 2010–14 % change 2014–15
GDPa (billion $) Banking services 388 394 398 0.3 1.2 Insurance services 360 408 421 3.2 3.2 Rental and leasing services and lessor of intangible assets
162 184 202 3.2 9.4
Securities services 221 219 217 -0.2 -1.0 FTEs (1,000)
Banking services 2,477 2,509 2,520 0.3 0.4 Insurance services 2,182 2,396 2,477 2.4 3.4 Rental and leasing services and lessor of intangible assets
486 512 527 1.3 2.9
Securities services 858 865 889 0.2 2.8 Wages and salary accruals ($ per FTE)
Banking services 64,318 75,626 80,162 6.0 4.1 Insurance services 73,512 82,511 85,117 3.2 2.9 Rental and leasing services and lessor of intangible assets
47,938 55,836 55,956 0.2 3.9
Securities services 194,277 223,812 221,447 -1.1 3.6 Labor productivityb ($ per FTE)
Banking services 156,641 157,035 157,937 0.1 0.6 Insurance services 164,986 170,284 169,964 0.8 0.2 Rental and leasing services and lessor of intangible assets
333,333 359,375 383,302 1.9 6.7
Securities services 257,576 253,179 244,094 -0.4 3.6
Source: USDOC, BEA, “Real Value Added by Industry,” April 1, 2016; USDOC, BEA, table 6.5D, “Full-Time Equivalent Employees by Industry,” April 1, 2016; USDOC, BEA, table 6.3D, “Wage and Salary Accruals per Full Time Equivalent Employee by Industry,” August 3, 2016. Note: CAGR = compound annual growth rate.
a Real valued added by industry using 2009 chained dollars. b Labor productivity, calculated by USITC staff, is GDP by industry divided by the number of FTEs.
of growth during 2010–14 for financial services was also below the average for the private sector.75
The financial services industry accounted for only 5.7 percent of total private sector employment in 2015, or 6.4 million full-time equivalent (FTE) employees.76 Overall employment growth in the sector has been slow since the 2008–09 financial crisis, increasing 1.1 percent from 2010 to 2014 (slower than the 2.7 percent of the services industry as a whole). In 2015, employment was highest in banking services, with just over 2.5 million FTEs (39.3 percent of all financial services employees), and insurance services, with slightly less than 2.5 million FTEs (38.6 percent). Insurance services employment rose the fastest from 2014 to 2015
75 Ibid. 76 USDOC, BEA, table 6.5D, “Full-Time Equivalent Employees by Industry,” August 7, 2015. BEA defines full-time equivalent employees as the number of employees on full-time schedules, plus the number of part-time employees that would have been needed to complete all the hours of full-time work reported in a given dataset.

Chapter 2: Financial Services
58 | www.usitc.gov
(3.4 percent), while in banking employment increased only 0.4 percent. Banking services and securities services employment also grew slowly (less than 1 percent) over the 2010–14 period.
Growth in labor productivity in financial services has been slow but positive, driven by a rise in productivity in rental and leasing services (measured as output in dollars per FTE).77 It was one of only two industries to report growth in labor productivity from 2010 to 2014, rising at an average annual rate of 0.4 percent, behind electronic services (1.5 percent). However, from 2014 to 2015, labor productivity in financial services was outpaced by nearly every other sector, with productivity rising only 0.5 percent compared to 1.4 percent for services overall.78 Average output per worker in financial services was $192,110 in 2015, the second highest behind electronic services ($259,751).79 Among financial services workers, output per worker varied widely by industry, ranging from less than $158,000 in banking services to over $383,000 in rental and leasing services.
Despite high wages overall, wages in financial services grew slower than in other services industries over the 2010–14 period; they increased at an average annual rate of 2.7 percent, compared to 8.7 percent in distribution services. Wages in financial services reflected the industry's relatively higher labor productivity, with workers earning on average $99,672 in 2015, nearly twice the average wage for the private sector as a whole ($58,726). Within financial services, securities services had the highest average wage in 2015 at $221,447. This was four times the lowest average wage, which was reported in rental and leasing services ($55,956).80 Overall, average wages in financial services grew by 3.4 percent between 2014 and 2015. This increase made financial services the category with the second-fastest growth after electronic services (3.8 percent) and placed it well ahead of the private sector average (2.1 percent).
77 Increased output in the rental and leasing sector is likely due to a recovery in home prices, while employment in this industry declined from 2009 to 2014, both of which contributed to an increase in labor productivity in that sector. USDOC, BEA, table 6.5D, “Full-Time Equivalent Employees by Industry,” August 7, 2015. 78 Productivity growth in the financial services sector is driven by several factors, including mergers and acquisitions by large financial firms, improvements in technology and human capital, and financial integration across markets. Balling et al., Productivity in the Financial Services Sector, 2009, 23, 89, 183. 79 Average output per worker in the electronic services sector is generally higher due to the high levels of capital available per worker. For more on the electronic services sector, see USITC, Recent Trends in U.S. Services Trade, May 2014. 80 Compensation other than wages, such as bonuses and other commissions, likely make up a large percentage of earnings for employees in the securities industry. But since they are not equally distributed, the large bonuses of a few employees can raise the average significantly. For example, excluding most types of bonuses, the mean annual wage for the securities and commodity contracts sector was $104,500 in 2015, with higher wages concentrated in the managerial, legal, and sales occupations. USDOL, BLS, “Occupational Employment Statistics,” May 2015.

Recent Trends in U.S. Services Trade: 2016 Annual Report
U.S. International Trade Commission | 59
Bibliography Accenture, “Digital Disruptions in Investment Banking,” 2014. https://www.accenture.com/us-
en/_acnmedia/Accenture%C2%A0/Conversion-Assets/DotCom/Documents/Global/PDF/Dualpub_9/Accenture-Digital-Disruptions-Investment-Banking.pdf.
Atkinson, Tyler, David Luttrell, and Harvey Rosenblum. “How Bad Was It? The Costs and Consequences of the 2007–09 Financial Crisis.” Federal Reserve Bank of Dallas. Staff paper, July 2013. https://dallasfed.org/assets/documents/research/staff/staff1301.pdf.
Ball, Laurence M. “Long-Term Damage from the Great Recession in OECD Countries.” National Bureau of Economic Research. Working Paper 20185, May 2014. http://www.nber.org/papers/w20185.
Balling, Morten, Ernst Gnan, Frank Lierman, and Jean-Pierre Schoder, eds. Productivity in the Financial Services Sector. The European Money and Finance Forum. Société Universitaire Européenne de Recherches Financières. Study 2009/4, 2009. https://ideas.repec.org/b/erf/erfstu/56.html.
Bank of America Merrill Lynch. “Navigating Solvency II and Basel III,” September 2012. https://corp.bankofamerica.com/documents/10157/67594/dalibrary_do.pdf.
Boston Consulting Group (BCG). “Global Capital Market 2015: Adapting to Digital Advances.” BCG Perspectives, May 11, 2015. https://www.bcgperspectives.com/Images/BCG-Adapting-to-Digital-Advances-May-2015_tcm80-187907.pdf.
———.“Global Retail Banking 2016: Banking on Digital Simplicity.” BCG Perspectives, May 10, 2016.https://www.bcgperspectives.com/content/articles/financial-institutions-technology-digital-banking-digital-simplicity-global-retail-banking-2016/.
Bradley, Joseph, Jeff Loucks, James Macaulay, Andy Noronha, and Michael Wade. “Digital Vortex: How Digital Disruption Is Redefining Industries.” Global Center for Digital Business Transformation. IMD and Cisco Industry Survey Initiative, June 2015. http://www.cisco.com/c/dam/en/us/solutions/collateral/industry-solutions/digital-vortex-report.pdf.

Chapter 2: Financial Services
60 | www.usitc.gov
Deloitte. “Insurers on the Brink: Disrupt or Be Disrupted.” Deloitte Center for Financial Services report for insurers, 2016. https://www2.deloitte.com/content/dam/Deloitte/us/Documents/financial-services/us-fsi-insurance-industry-outlook.pdf.
Denecker, Olivier, Sameer Gulati, and Marc Nierdekorn. “The Digital Battle That Banks Must Win.” McKinsey & Company, August 2014. http://www.mckinsey.com/industries/financial-services/our-insights/the-digital-battle-that-banks-must-win.
Dobson, Wendy. “Financial Services and International Trade Agreements: The Development Dimension.” In A Handbook of International Trade in Services, edited by Aaditya Mattoo, Robert M. Stern, and Gianni Zanini, 289–337. Oxford: Oxford University Press, 2008.
Elliott, Kimberly Ann, Caroline Freund, Anna Gelpern, Cullen S. Hendrix, Gary Clyde Hufbauer, Barbara Kotschwar, Theodore H. Moran, Tyler Moran, Lindsay Oldenski, Sarah Oliver, Peter A. Petri, and Michael G. Plummer. Assessing the Trans-Pacific Partnership, Volume 1: Market Access and Sectoral Issues. Peterson Institute for International Economics (PIEE). PIEE Briefing Paper no. PIIEB16-1, February 2016. https://piie.com/publications/piie-briefings/assessing-trans-pacific-partnership-volume-1-market-access-and-sectoral.
Federal Reserve. “Consumers and Mobile Financial Services 2015,” March 2015. https://hbr.org/2016/03/the-industries-that-are-being-disrupted-the-most-by-digital.
Financial Crisis Inquiry Commission. The Financial Crisis Inquiry Report: Final Report of the National Commission on the Causes of the Financial and Economic Crisis in the United States. Final report. Washington, DC: GPO, February 25, 2011. https://www.gpo.gov/fdsys/pkg/GPO-FCIC/pdf/GPO-FCIC.pdf.
Gopalan, Sasidaran. “Does Foreign Bank Entry Contribute to Financial Depth? Examining the Role of Income Thresholds.” Hong Kong University of Science and Technology, Institute for Emerging Marketing Studies (HKUST, IEMS). Working Paper No. 2015-05, February 2015. http://iems.ust.hk/wp-content/uploads/2015/02/IEMSWP2015-05.pdf.
Grossman, Rhys. “The Industries That Are Being Disrupted the Most by Digital.” Harvard Business Review, March 21, 2016. https://hbr.org/2016/03/the-industries-that-are-being-disrupted-the-most-by-digital.

Recent Trends in U.S. Services Trade: 2016 Annual Report
U.S. International Trade Commission | 61
Hoekman, Bernard, and Aaditya Mattoo. “Services Trade and Growth.” World Bank Policy Research Working Paper 4461, January 2008. http://elibrary.worldbank.org/doi/abs/10.1596/1813-9450-4461 http://www-wdsworldbank.org/servlet/WDSContentServer/WDSP/IB/2008/01/02/000158349_20080102162022/Rendered/PDF/wps4461.pdf.
IBISWorld. Global Direct General Insurance Carriers. IBISWorld Industry Report JL 5612, January 2016.
Kenth, Jagdev. “Top Six Trends That Are Redefining Financial Institutions.” Willis Resilience, Issue 6, April 2015. http://www.resilience.willis.com/articles/2015/04/28/top-6-trends-are-redefining-financial-institutions/.
Meltzer, Joshua. “The Internet, Cross-Border Data Flows and International Trade.” Brookings Center for Innovation, February 2013. https://www.brookings.edu/wp-content/uploads/2016/06/internet-data-and-trade-meltzer.pdf.
Organisation for Economic Co-operation and Development (OECD). “Tackling Policy Fragmentation: The Key to Getting onto a Path of Rapid and Sustainable Productivity Growth.” OECD Business and Financial Outlook report, June 9, 2016. http://www.oecd.org/finance/tackling-policy-fragmentation-the-key-to-getting-onto-a-path-of-rapid-and-sustainable-productivity-growth.htm.
PricewaterhouseCoopers International Limited (PwC). Smart Implementation: Reining in the Risk and Cost of Regulatory Change in Banking, December 2012. https://www.pwc.com/gx/en/banking-capital-markets/publications/assets/pdf/pwc-strategic-regulatory-management-pov.pdf.
Summers, Lawrence. “Responding to an Historic Economic Crisis: The Obama Program.” Speech at the Brookings Institution, Washington, DC, March 13, 2009. http://www.brookings.edu/~/media/events/2009/3/13-summers/20090313_summers.pdf.
U.S. Department of Commerce (USDOC). Bureau of Economic Analysis (BEA). Survey of Current Business 95, no. 10 (October 2015).
———.Bureau of Economic Analysis (BEA). Table 2.1., “U.S. Trade in Services, by Type of Service.” International Data, Interactive tables: October 15, 2015. http://www.bea.gov/iTable/iTable.cfm?ReqID=62&step=1#reqid=62&step=6&isuri=1&6210=4&6200=160.

Chapter 2: Financial Services
62 | www.usitc.gov
———.Bureau of Economic Analysis (BEA). “Real Value Added by Industry.” Interactive tables: Gross Domestic Product by Industry Accounts, August 3, 2016. http://www.bea.gov/iTable/iTable.cfm?ReqID=51&step=1#reqid=51&step=3&isuri=1&5102=10.
———.Bureau of Economic Analysis (BEA). Table 6.5D, “Full-Time Equivalent Employees by Industry.” Interactive tables: Gross Domestic Product by Industry Accounts, August 3, 2016. http://www.bea.gov/iTable/iTable.cfm?ReqID=9&step=1#reqid=9&step=1&isuri=1.
———.Bureau of Economic Analysis (BEA). Table 6.3D, “Wage and Salary Accruals per Full Time Equivalent Employee by Industry.” Interactive tables: National and Product Accounts, August 3, 2016. http://www.bea.gov/iTable/iTable.cfm?ReqID=9&step=1#reqid=9&step=3&isuri=1&903=189.
U.S. Department of Labor (USDOL). Bureau of Labor Statistics (BLS). “May 2015 National Industry-Specific Occupational Employment and Wage Estimates: NAICS 523100 - Securities and Commodity Contracts Intermediation and Brokerage.” http://www.bls.gov/oes/current/oessrci.htm#52 (accessed July 20, 2016).
World Trade Organization (WTO). “Financial Services: Developments in the Sector.” https://www.wto.org/english/tratop_e/serv_e/finance_e/finance_devel_e.htmhttps://www.wto.org/english/tratop_e/serv_e/finance_e/finance_devel_e.htm#techno (accessed June 7, 2016).

U.S. International Trade Commission | 63
Chapter 3 Banking Services Summary Banks provide vital services to businesses and consumers, enabling them to finance investment and to manage money and financial transactions. Demand for banking services generally tracks economic activity and development, so the demand for banking services is greatest in developed economies with large consumer markets. Since banking services are essential to the functioning of consumer markets, regulators around the world establish extensive rules to promote stability in this critical industry.
Today, rapid technological change and changing consumer preferences are transforming the way banking services are provided. Consumers increasingly prefer to conduct bank transactions digitally, prompting banks to offer e-banking services that allow customers to manage accounts without going to a physical bank branch. Financial technology—or “fintech”—firms are accelerating change in the banking industry by using digital (including mobile) technology to offer certain banking services more efficiently. Peer-to-peer (P2P) lenders,81 for instance, connect lenders to borrowers via the Internet, forgoing the direct credit risk and associated regulatory scrutiny banks face when lending. At the same time, new regulations have been introduced in the wake of the global financial crisis. Designed to ensure the stability of the global financial system, the new rules are making certain banking services more costly to provide by requiring banks to set aside higher reserves against potential losses, which raises banks’ compliance costs. In addition, differences in new regulations and approaches across countries make it costlier for banks to operate in multiple markets, a trend that may negatively impact trade.
In 2015, U.S. cross-border exports of banking services totaled $74.2 billion, a 5 percent decrease from 2014, while U.S. imports of banking services were $17.9 billion (a 2 percent increase from 2014), resulting in a cross-border surplus of $56.3 billion. Despite a 3 percent average annual growth rate during 2009–12, sales by foreign affiliates of U.S. banks decreased by 7 percent to $53.9 billion in 2013. Major markets for sales of U.S. banking services continue to be the United Kingdom, Australia, Canada, China, and Germany. Purchases of banking services from U.S. affiliates of foreign banks also decreased during 2012–13, falling by 9 percent to $44.9 billion.
81 Peer-to-peer means facilitated direct transactions.
Chapter 3: Banking
64 | www.usitc.gov
Introduction In the U.S. official statistics for cross-border trade in goods and services, banking services are defined as fee-based commercial banking services. They include financial management and transaction services, advisory services, custody services, credit card services, and other credit-related services, such as trade finance activities. Deposit-taking and lending services are therefore excluded from the cross-border trade statistics shown below, but they are included in the estimates of foreign affiliate transactions and the industry analysis discussion presented later in this chapter.82
Deposit taking and lending generate the majority of banking revenues. Banks’ gross earnings from these activities may be broadly represented by their net interest margin—i.e., the difference between the interest payments received on loan assets and the interest payments made to depositors and other providers of funding. Banks also generate revenues from other activities, such as charging fees on bank overdrafts or certain transactions. Further, banks routinely sell additional products and services, such as mortgages, credit cards, and other forms of financing to clients, all of which generate industry profits. Commercial and residential mortgages account for 52 percent of the global industry’s products and services.83
Other major market segments include other business loans (23 percent), home equity and vehicle loans (12 percent), and other secured and unsecured consumer loans (8 percent).84 Globally, individual consumers represent the largest source of industry revenue (46 percent), followed by corporate clients (30 percent) and government agencies (1 percent).85 While corporations generally engage in higher-value banking activities, the size of the global consumer market accounts for its higher share of industry revenue.
Market Conditions The global retail and commercial banking industry generated revenue of $2.1 trillion dollars in 2015, a 9 percent decrease from 2014.86 This represents the first annual decrease in global industry revenue since the global financial crisis in 2008–09, when most major markets banks’ revenue declined sharply. In the period spanning 2010 to 2015, bank revenue grew annually by 82 See box 3.3. For more detail on how financial services are measured by BEA, see USDOC, BEA, U.S. International Economic Accounts: Concepts and Methods, June 30, 2014, 10–13. For a description of how banks’ foreign affiliate sales are calculated, see Koncz-Bruner and Flatness, “U.S. International Services,” October 2009. 83 IBISWorld, Global Commercial Banking, March 2016, 11. 84 Ibid. 85 Ibid. 86 Revenue items include interest payments related to bank loan assets and fees charged for various transactions and advisory services. However, total assets, rather than total revenues, are a more useful measure of a bank’s size, as they are the sum of all loan assets outstanding. IBISWorld, Global Commercial Banking, March 2016, 31.

Recent Trends in U.S. Services Trade: 2016 Annual Report
U.S. International Trade Commission | 65
1 percent.87 Turbulent markets and trading losses largely explain the decline in revenues during the financial crisis, and the gradual nature of the recovery in economic activity in the post-crisis years has driven the slow growth in banking revenues seen more recently.88
Three regions account for over 70 percent of global bank assets: Europe, North Asia, and North America (figure 3.1).89 While Europe continues to hold the largest percentage of assets, its share has declined since the end of the financial crisis.90 The European banking sector faced significant instability following the financial crisis, triggering a sharp decline in the value of bank assets (including mortgage and property financing, commercial loans, and sovereign lending). Governments had to step in to support failing banks in several EU member states.91 North America has likewise seen its share of global banking assets fall, from 23 percent in 2011 to 14 percent in 2014, due to the growth of the banking industry in North Asia.92 Demand growth is also lower in North America than in other regions because the market for banking services is relatively mature.93
87 Calculations by USITC staff. IBISWorld, Global Commercial Banking, March 2016, 31. 88 Gray, “US Banks Endure Biggest Drop in Revenues,” April 19, 2016. 89 North Asia includes China, South Korea, and Japan; it is defined as distinct from Southeast Asia. IBISWorld, Global Commercial Banking, March 2016, 16. 90 Europe accounted for 47 percent of global assets in 2011. USITC, Recent Trends in U.S. Services Trade, July 2012, 3-3. 91 IBISWorld, Global Commercial Banking, March 2016, 15. 92 USITC, Recent Trends in U.S. Services Trade, July 2012, 3-3; IBISWorld, Global Commercial Banking, March 2016, 16. 93 IBISWorld, Global Commercial Banking, March 2016, 16.
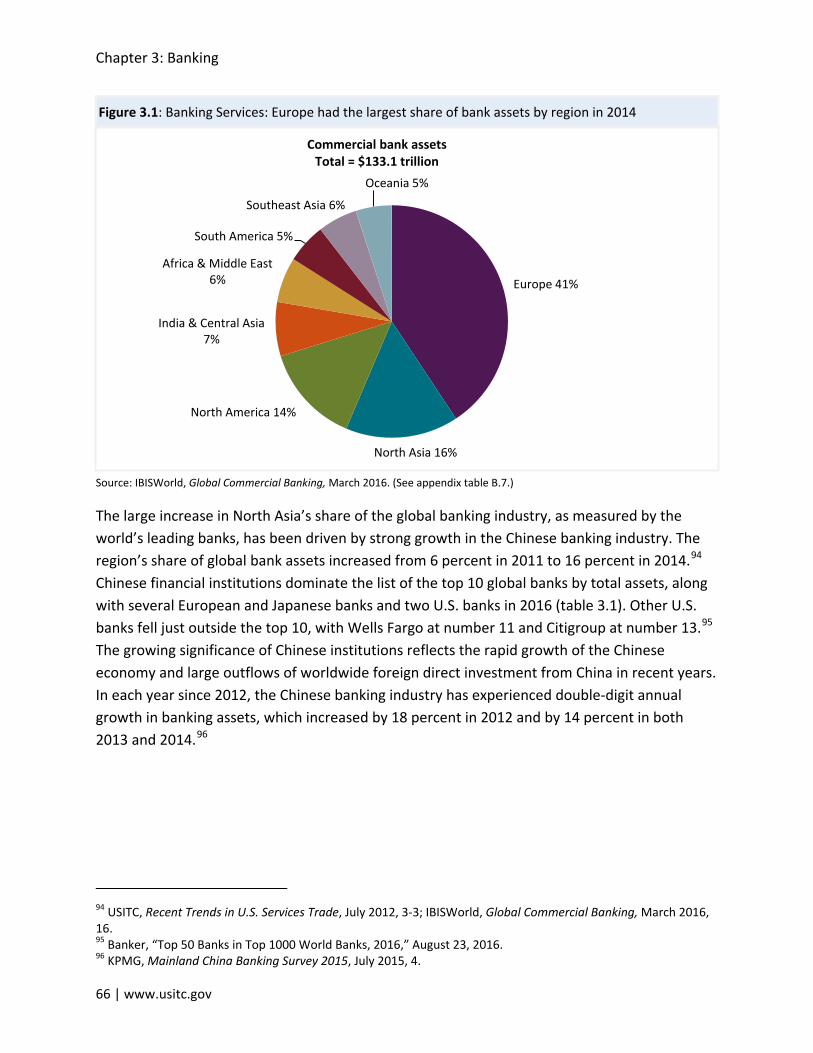
Chapter 3: Banking
66 | www.usitc.gov
Figure 3.1: Banking Services: Europe had the largest share of bank assets by region in 2014
Source: IBISWorld, Global Commercial Banking, March 2016. (See appendix table B.7.)
The large increase in North Asia’s share of the global banking industry, as measured by the world’s leading banks, has been driven by strong growth in the Chinese banking industry. The region’s share of global bank assets increased from 6 percent in 2011 to 16 percent in 2014.94 Chinese financial institutions dominate the list of the top 10 global banks by total assets, along with several European and Japanese banks and two U.S. banks in 2016 (table 3.1). Other U.S. banks fell just outside the top 10, with Wells Fargo at number 11 and Citigroup at number 13.95 The growing significance of Chinese institutions reflects the rapid growth of the Chinese economy and large outflows of worldwide foreign direct investment from China in recent years. In each year since 2012, the Chinese banking industry has experienced double-digit annual growth in banking assets, which increased by 18 percent in 2012 and by 14 percent in both 2013 and 2014.96
94 USITC, Recent Trends in U.S. Services Trade, July 2012, 3-3; IBISWorld, Global Commercial Banking, March 2016, 16. 95 Banker, “Top 50 Banks in Top 1000 World Banks, 2016,” August 23, 2016. 96 KPMG, Mainland China Banking Survey 2015, July 2015, 4.
Europe 41%
North Asia 16%
North America 14%
India & Central Asia 7%
Africa & Middle East 6%
South America 5%
Southeast Asia 6%
Oceania 5%
Commercial bank assets Total = $133.1 trillion

Recent Trends in U.S. Services Trade: 2016 Annual Report
U.S. International Trade Commission | 67
Table 3.1: Ten largest global banks by total assets, 2016 (billion dollars) Rank Bank Country Total assets 1 ICBC China 3,422 2 China Construction Bank China 2,827 3 Agricultural Bank of China China 2,741 4 Mitsubishi UFJ Financial Group Japan 2,649 5 Bank of China China 2,591 6 HSBC Holdings UK 2,410 7 JPMorgan Chase & Co United States 2,352 8 BNP Paribas France 2,168 9 Bank of America United States 2,147 10 Credit Agricole Japan 1,847 Source: Banker, “Top 50 Banks in Top 1000 World Banks, 2016,” August 23, 2016.
However, even with the rapid growth in the past few years, China remains a comparatively underdeveloped banking market, with significant potential for future growth.97 Elsewhere, low-income regions where only a small percentage of the population has a bank account, such as Southeast Asia and sub-Saharan Africa, represent the biggest potential growth opportunities for the banking sector. In countries that are members of the Organisation for Economic Co-operation and Development (OECD), the percentage of adults in 2014 with an account at a financial institution was 73 percent, while it was only 22 percent in low income countries.98 A low number of bank branches per person indicates significant growth potential in sub-Saharan Africa, South Asia, Latin America and the Caribbean, as well as East Asia and the Pacific (figure 3.2).
97 China represents a 12 percent share of the world’s unbanked adults (“unbanked” refers to anyone not served by a bank or other financial institution), and China, India, and Indonesia together represent 55 percent of the world’s unbanked adult population. McKinsey, “Weathering the Storm: Asia-Pacific Banking Review 2016,” June 2016, 23. IBISWorld, Global Commercial Banking, March 2016, 16. 98 World Bank, Global Findex (accessed May 2, 2016).

Chapter 3: Banking
68 | www.usitc.gov
Figure 3.2: Banking Services: Bank branch concentration was highest in North America and Europe in 2014
Source: World Bank, World Development Indicators (accessed June 14, 2016). (See appendix table B.8.)
E-Banking Allows Banks to More Effectively Reach Customers Banks have been able to sustain revenue growth without expanding their network of brick and mortar branches through the adoption of innovative digital banking services, or “e-banking.”99 These services allow banks to reach consumers more effectively, while limiting the physical infrastructure and human resource costs associated with expanding physical branches.100 Globally, a transaction in a physical branch has been estimated to cost 43 times more than a transaction via mobile channels.101 Consumers are increasingly opting to conduct their banking either online or through a mobile device.102 Among people in the United States who have a mobile phone, the percentage reporting that they had used mobile banking increased from 22 percent in 2011 to 43 percent in 2015.103
Online and mobile banking will also drive the banking industry’s growth in developing nations; according to World Bank estimates, 2 billion adults around the world do not have access to
99 Kelly, The Digital Revolution in Banking, 2014, 9. 100 IBISWorld, Global Commercial Banking, March 2016, 4. 101 KPMG, Mobile Banking Report 2015, July 2015, 22. 102 According to a 2015 report from the Federal Reserve, in 2014 the most common way consumers interacted with their bank remained in-person at a branch. But 75 percent of consumers also reported using online banking services, and about one-third reported using mobile banking services. Federal Reserve, Consumers and Mobile Financial Services 2015, March 2015, 9. 103 Federal Reserve, Consumers and Mobile Financial Services, March 30, 2016, 5.
0
5
10
15
20
25
30
Sub-SaharanAfrica
South Asia Middle East &North Africa
OECDmembers
Latin America& Caribbean
EuropeanUnion
East Asia &Pacific
NorthAmerica
Bran
ches
per
100
,000

Recent Trends in U.S. Services Trade: 2016 Annual Report
U.S. International Trade Commission | 69
financial services.104 KPMG forecasts that the number of global mobile banking users will increase by 1 billion between 2014 and 2019; moreover, it predicts that adoption rates of mobile technology will be highest in the developing world, reaching 60 to 70 percent in India and China, respectively.105 Increased use of mobile and digital technologies have already been important in Africa for expanding banking services to previously unbanked populations, and this trend is likely to continue.
Emerging Supply and Demand Factors Two key drivers––new technologies and tighter regulatory environments––are affecting the global banking industry and international trade in banking services. The following discussion outlines how the emergence of financial technology—or fintech—firms, and the global regulatory response to the 2008–09 financial crisis, are changing business models in the banking sector.
Financial Technology
Fintech Makes Significant Inroads in Financial Services
Fintech firms use digital technology and nontraditional, innovative business models to provide financial services to consumers. The emergence of these firms has the potential to fundamentally transform how banking services are provided globally.106 Fintech firms focus on specific banking services, such as payments and transaction services, lending and financing, and account management, as well as non-banking services such as managing financial assets (figure 3.3).107 Some examples of fintech firms are Xoom (money transfer), Square (payments), Mint (personal finance), and Lending Club (lending). The fintech sector has grown substantially since 2010, albeit from a small base; investment in fintech grew by 63 percent annually during 2010–14, while loan issuance expanded by 121 percent annually during the period (figure 3.4).108 However, the global banking industry still dwarfs the fintech sector, with fintech firms accounting for less than 1 percent of total bank lending worldwide.109
104 Global Findex Database (accessed May 17, 2016). 105 KPMG, Mobile Banking Report 2015, July 2015, 1, 5; HV et al., “Weathering the Storm: Asia-Pacific Banking,” June 2016, 23. 106 WEF, The Future of Fintech, October 2015, 3. 107 Industry representative, interview by USITC staff, Washington, DC, May 13, 2016. 108 Compound annual growth rates. USITC calculations; Accenture, Fintech and the Evolving Landscape, 2016, 3; Morgan Stanley, Can P2P Lending Reinvent Banking? June 17, 2015. 109 WEF, The Future of Fintech, October 2015, 13.

Chapter 3: Banking
70 | www.usitc.gov
Figure 3.3: Banking services: In 2015, global revenues for fintech firms were highest for payment transactions, followed by lending and financing
Source: McKinsey, “Cutting through the Fintech Noise,” December 2015, 2. (See appendix table B.9.)
Figure 3.4: Banking Services: Global investment and loan issuance in fintech grew rapidly after 2012
Source: Accenture, Fintech and the Evolving Landscape, 2016, 3; Morgan Stanley, Can P2P Lending Reinvent Banking? June 17, 2015. (See appendix table B.10.)
Fintech has the potential to both displace and augment traditional financial services—trends commonly referred to as competitive and collaborative fintech, respectively. The majority of new investment in 2015 was in competitive fintech ($10.2 billion), but there has been strong
0
5
10
15
20
25
30
Account Management Lending and Financing Payments Financial Assets
Perc
ent
Retail Commercial Large Corporate
0
5
10
15
20
25
2010 2011 2012 2013 2014
Billi
on $
Global fintechinvestment
Globalmarketplaceloan issuance

Recent Trends in U.S. Services Trade: 2016 Annual Report
U.S. International Trade Commission | 71
growth in collaborative fintech investments ($8.0 billion). Investment in collaborative fintech ventures increased by 138 percent from 2014 to 2015, compared with an increase of just 23 percent for competitive fintech.110 Certain financial services, such as payments, tend to produce competitive fintech, while others tend to produce collaborative fintech, such as wealth management. Other products, like lending, produce both collaborative and competitive fintech.111 Fintech firms are growing in areas where an element of a traditional bank’s business can be done more efficiently using new digital technology. A recent survey of traditional bankers found that 95 percent of respondents believe that part of their business could be lost to fintech firms by 2020.112 However, others argue that by partnering with fintech firms, banks can modernize and improve their own service delivery.113 An industry representative characterized the fintech segment as being built upon the existing financial system, complementing the efforts of the traditional banking sector.114
Some of the growth in fintech activity has been driven by firms’ ability to operate in less highly regulated environments; however, the lack of regulatory oversight presents both advantages and disadvantages for fintech firms. Fintech firms face regulatory uncertainty because their business models are not necessarily covered by existing regulations, which were designed before the advent of digital technologies.115 The U.S. regulatory system, designed to oversee a relatively stable retail banking industry, has struggled to adapt to the recent and rapid emergence of services offered by fintech firms. For example, U.S. P2P fintech lending firms are not deposit-taking institutions like traditional banks; instead, they serve as a platform to connect borrowers and lenders, so they are not subject to the same regulatory standards.116 Regulators are aware of these trends and are attempting to adjust to this rapidly changing environment.117
110 Accenture, Fintech and the Evolving Landscape, 2016, 6. 111 Ibid. 112 PwC, Blurred Lines, March 2016, 18. 113 Wisniewski, “These Startups Are Trying to Solve,” October 13, 2015. 114 Industry representative, interview by USITC staff, Washington, DC, May 13, 2016. 115 Elliott, “Where Fin-Tech Is Struggling with Regulation,” November 24, 2015. 116 Industry representative, interview by USITC staff, Washington, DC, May 13, 2016; Elliott, “Where Fin-Tech is Struggling with Regulation,” November 24, 2015. 117 For example, the U.S. Office of the Comptroller of the Currency (OCC) has released a paper outlining the OCC’s framework for encouraging responsible innovation in financial services. The OCC defines responsible innovation to mean the use of new or improved financial products, services, and processes to meet the evolving needs of consumers, businesses, and communities in a way that is consistent with sound risk management and is aligned with the bank’s overall business strategy. Details are currently being formulated. The agency included in its framework a request for input by industry, and those comments arrived in May 2016. OCC, Supporting Responsible Innovation, March 2016, 11. Similarly, the Treasury Department issued a May 10, 2016, white paper exploring how to address the regulatory challenges associated with online marketplace lending. U.S. Treasury, Opportunities and Challenges in Online Marketplace Lending, May 10, 2016.

Chapter 3: Banking
72 | www.usitc.gov
U.S. Fintech Firms Have a Competitive Advantage
The United States is a global leader in fintech, owing to its dominance in both financial services and digital technologies. In 2015, about two-thirds (61 of 94) of global fintech investment deals valued over $50 million occurred in the United States, with Silicon Valley as the center of global fintech investment.118 For example, in the P2P lending sector, U.S. firms accounted for over half of global fintech lending in 2014 (figure 3.5).
Figure 3.5: Banking Services: U.S. firms led global fintech lending in 2014
Source: Morgan Stanley, Can P2P Lending Reinvent Banking? June 17, 2015. (See appendix table B.11.)
U.S. fintech firms offer a broad array of financial services. For example, the U.S. firm Gro Solutions has pioneered a mobile-based bank account-opening process in the United States. An example of a collaborative U.S. fintech firm, iovation Inc., works with banks to detect fraud by tracking devices that try to open multiple accounts under different identities.119 In the P2P lending sector, San Francisco-based SoFi was the first to use data analytics and algorithmic lending to issue student loans to students unlikely to default.120 In wealth management services, Acorns is a fintech app that rounds up transactions to the nearest dollar and invests the balance in an exchange traded fund.121
118 Accenture, Fintech and the Evolving Landscape, 2016, 4. 119 Wisniewski, “These Startups Are Trying to Solve,” October 13, 2015. 120 Algorithmic lending involves making credit decisions based on whether a borrower fits certain criteria, without referencing a credit score. Kessler, “The Uberization of Banking,” April 29, 2016. 121 Rao, “PayPal Just Backed an Investment App,” April 21, 2016.
United States China United Kingdom Australia0
2
4
6
8
10
12
14
Billi
on $

Recent Trends in U.S. Services Trade: 2016 Annual Report
U.S. International Trade Commission | 73
Fintech Eases Entry into Foreign Markets, but Challenges Remain
Fintech can provide banking services to consumers remotely over telecommunications networks without incurring the cost of establishing physical branches.122 For example, fintech firms like Square and PayPal have become industry leaders in P2P mobile payments and remittances transactions (box 3.1).123 These firms have quickly established a widespread international presence by leveraging digital technologies to connect service providers to customers without the need for branches in every target market.124 On the lending side, an example of increased international reach is the U.S. fintech firm Finca, which has partnered with a U.S. analytics company to provide loans in East Africa.125
Box 3.1: Fintech Is Fundamentally Reshaping Payments
Payments are a fundamental banking service, allowing consumers, businesses, and governments to complete transactions without the need for cash. Checks were one of the earliest forms of noncash payment,a and electronic payments began with the introduction of the first general-purpose credit card in 1966.b In the Internet era, the banks’ market position has been sharply eroded, as fintech firms such as PayPal have introduced payment services on digital platforms. Recent industry surveys indicate that payment services are shifting to mobile payment platforms as consumers increasingly use their smartphones to shop. Banks and non-bank payment services providers are responding to this trend by increasing mobile and e-banking services.c
Global payments revenue in 2014 was $1.7 trillion. North America accounted for 24 percent of this revenue, while the Asia-Pacific region accounted for 41 percent.d Of this amount, cross-border payments accounted for 13 percent ($215 billion) of total payment revenue.e Business-to-business (B2B) transactions accounted for nearly 80 percent of cross-border payments revenue,f while consumer-to-consumer and consumer-to-business transactions make up a significantly smaller share of cross-border payments revenue. Non-bank payments firms, including fintech firms, capture almost 50 percent of all digital payments, including commercial transactions and P2P payments.g
The revenue for providing payments services is separately captured by the various participants in the supply chain: banks, credit card companies, digital platforms, and connection enablers. As credit card issuers, banks enable consumers to make payments to any merchant in the credit card network. Payments flow from consumers’ bank accounts via the card-issuing bank to merchants’ bank accounts, relying on an “open-loop” system of interbank cooperation and funds transfers, allowing merchants and customers with different banks to efficiently complete a payment.h
122 KPMG, Mobile Banking Report 2015, July 2015, 22. 123 Industry representative, interview by USITC staff, Washington, DC, May 13, 2016; BNY Mellon, Innovation in Payments, October 2015, 2. 124 Square operates in Japan, the United States, Australia, and Canada, while PayPal operates in 203 markets. See the Square website, https://squareup.com/help/us/en/article/4956-international-availability (accessed June 8, 2016), and the PayPal website, https://www.paypal.com/webapps/mpp/country-worldwide (accessed June 8, 2016). 125 Aglionby, “Fintech Takes Off in Africa,” May 16, 2016.
Chapter 3: Banking
74 | www.usitc.gov
However, electronic payments are in the midst of an evolution beyond the credit card networks created by banks in the second half of the last century, as digital platforms like PayPal provide secure networks for transactions. PayPal operates in 203 countries, allowing businesses and consumers to make secure transactions over the Internet.i In 2013, PayPal processed $43.8 billion of payments over its network. Transactions among OECD members accounted for just under half of these financial flows, while China and the Latin American and Caribbean region received $5.6 billion (13 percent) and $1.6 billion (4 percent) of the flows over PayPal’s network, respectively.j
Fintech firms are also introducing new ways to connect to digital payment platforms. For instance, the payment firm Square has introduced card readers that physically hook into cellphones, allowing anyone with a smartphone to accept a credit card payment, including individuals, entrepreneurs, and service providers like music teachers or gardeners.k
Innovation in payments also aims to execute credit card payments without the need for the consumer to physically have the card. “Digital wallet” services such as Apple Pay are responding to consumer demands for convenience.l PayPal is also moving towards a card-free payment system. Consumers can securely execute a transaction by using their PayPal credentials instead of entering credit card information (such as card number, card verification code, and expiration date) into each e-commerce platform. By expanding the security and frequency of transactions, these payment innovations increase bank revenues; banks charge fees associated with payments, and as payment volumes rise, so do revenues from those fees.m
The future evolution of payments will likely continue the cardless trend, aiming towards a “frictionless” payment experience. The transportation service, Uber, for example, already has removed the need for a card in payment: a consumer designates a credit card to be used for transactions once, and is able to complete subsequent transactions without needing to reenter the information or authorize a particular transaction.n Other payment providers are expanding their role beyond just payments to also providing consumers with a secure digital identity. Stronger digital identities reduce the risk of identity theft by allowing transactions to happen without the need to input sensitive card data onto numerous forms that are then stored by each firm, potentially exposing that information to a data breach. For example, American Express offers a service called AmEx Express Checkout where users can pay for Airbnb vacations simply by inputting the American Express login credentials and completing the payment that way.o
a Federal Reserve Board of San Francisco, “What Is the Fed: Payment Systems,” n.d. (accessed June 2, 2016). http://www.frbsf.org/education/teacher-resources/what-is-the-fed/payment-services
b A general-purpose credit can be used to make purchases at any establishment and is not tied to a particular firm or industry, like the Diners Club Card.
c Higginson, Krieger, and Zhang, “16 in 2016,” October 2015,17. d McKinsey, Global Payments 2015, October 2015, 6. e Ibid. f Ibid. g Ibid. h PayPal website, https://www.paypal.com/webapps/mpp/pay-online (accessed June 3, 2016); Landers, “How FinTech Is
Changing Business,” January 7, 2016. i OECD, Economic and Social Benefits of Internet Openness, 2016. j Sienkiewicz, “Credit Cards and Payment Efficiency,” August 2001, 4. k Gulati, “Gauging the Disruptive Potential of Digital Wallets,” May 2015. l Kim, “5 Predictions for the Future of Payments,” August 25, 2015. m Wolf, “The Role of Payment Networks,” May 11, 2016. n Ibid. o Ibid.

Recent Trends in U.S. Services Trade: 2016 Annual Report
U.S. International Trade Commission | 75
At the same time, U.S. entrants face competition from domestic firms in foreign markets. In China, for example, there are over 1,500 fintech P2P lenders. The largest of these, Lufax, a subsidiary of Ping An Insurance, was valued at $10 billion when it went to the market to raise capital in early 2015.126 In Singapore, UOB became the first Asian bank to partner with a fintech firm to provide funding for startups. Another Singaporean financial firm, DBS Bank, has developed its own predictive analytics software to identify fraud through a government-backed partnership for fintech research.127 In other countries, some firms are even engaging in international P2P transactions, with the UK P2P lender, Funding Circle, connecting UK SMEs to U.S. lenders, for example.128
Further, the lack of transparent and stable regulations constrains trade in fintech services. Fintech firms that expand internationally must navigate the diverse regulatory regimes of each market in which they operate. Some countries, such as the UK, Australia, and Singapore, are constructing regulatory frameworks that seek to enable fintech firms to introduce new services quickly (often at their own risk), with the goal of positioning themselves as centers for fintech innovation.129 For example, in Singapore, the Monetary Authority has created a regulatory “sandbox,” allowing innovative firms to introduce new financial services to the market without going through a complex regulatory approval process, and to assume the risk associated with offering a new product or service themselves.130 However, government policies designed to promote fintech innovation are varied, and some countries have a longer track record than others.131 While some larger, more established firms currently operate in multiple countries, most fintech startups have not even considered expanding into foreign markets, possibly because of the complexity of doing so.132
Regulation and Trade in Banking Services
Regulators Respond to the Financial Crisis
The global financial crisis of 2008–09 exposed serious weaknesses in the global financial system. In response, the G20 countries agreed to a new set of rules in 2010––informally called “Basel III”––to safeguard the global banking system.133 These rules have had a significant effect on the
126 Clover, “China P2P Lender Banks on Social Media Usage,” August 30, 2015. 127 Vasagar, “Singapore Banks Become a Hotbed for ‘Fintech,’” May 5, 2016. 128 Alloway, “P2P Lender Bondora Targets Europe,” February 26, 2015. 129 Vasagar, “Singapore Banks Become a Hotbed for ‘Fintech,’” May 5, 2016; Alloway, “P2P Lender Bondora Targets Europe,” February 26, 2015. 130 Ibid. 131 EY, UK Fintech: On the Cutting Edge, February 24, 2016, 11. 132 Industry representative, interview by USITC staff, Washington, DC, May 13, 2016. 133 BIS, Tenth Progress Report, April 2016; Alper and Egan, “Basel III Delinquents May Face Sanctions,” November 4, 2012.

Chapter 3: Banking
76 | www.usitc.gov
industry, changing how banks assess credit and market risks and limiting some of the activities banks can engage in. Some regulators concede that tighter regulations since the crisis may be partially responsible for the global trend of “de-risking” whereby banks eliminate some business lines and classes of customers.134 Additionally, differences in the way national banking regulators are implementing the new standards have complicated the regulatory landscape, raising compliance costs and making it harder for banks to operate internationally.135 As banks pull back their involvement in foreign markets, both cross-border trade in banking services and the sales of foreign affiliates may be negatively affected.
The Basel III standards seek to strengthen the global banking system by improving the ability of the banking sector to withstand negative shocks.136 According to the Basel Committee on Banking Supervision, the standards aim not only to improve how an individual country regulates its banking sector and manages systemwide risks, but also how to strengthen individual banks so they can withstand periods of distress. At the individual bank level, reforms focus on capital and liquidity. Increased capital standards mean that banks can absorb greater losses without losing viability. New liquidity standards ensure that banks can more easily fund short-term activities by selling their assets.137 The Basel Committee states that these reforms aim to reinforce each other, with more stable individual banks contributing to a more stable banking system and a more stable system allowing banks to face more manageable risks. The Basel III standards also recognize a class of large, important banks which are subject to stricter regulation.138 These systemically important financial institutions (or SIFIs) tend to be the ones that are the most engaged in trade, and country-specific variations of these rules can have a larger impact on trade.
Regulations Differ from Country to Country
The United States enacted the Dodd-Frank Act of 2010 to rewrite financial regulations in order to improve banking stability. The act requires banks to maintain stronger balance sheets by holding increased capital and to create plans for orderly dissolution in case of trouble (these are also known as banks’ “living wills”). It also requires that U.S. deposit-taking institutions no longer engage in proprietary trading (whereby a bank uses its own money instead of deposits to make trades), an activity which could significantly increase the volatility of banks’ profits.139 Furthermore, it provides mechanisms to close regulatory gaps that previously existed, such as
134 Tracy, “Policy Makers Defend Postcrisis Financial Regulation,” May 7, 2016. 135 IRSG, “Regulatory Landscape” (accessed June 7, 2016). 136 One example could be a recession that causes significant defaults. See BIS, “Basel III: International Regulatory Framework for Banks,” n.d. (accessed June 7, 2016). 137 BIS, “Basel Committee on Banking Supervision,” n.d. (accessed June 7, 2016). 138 Ibid. 139 U.S. Treasury, Dodd-Frank at Five Years, July 2015, 11.

Recent Trends in U.S. Services Trade: 2016 Annual Report
U.S. International Trade Commission | 77
the Financial Stability Oversight Council, which serves as a coordinating mechanism for various regulators to communicate and promote the overall stability of the financial system.140
While these requirements meet the Basel III standards, several U.S. rules and regulations are stricter. For instance, the Federal Reserve requires a 6 percent leverage ratio for large institutions, as opposed to the 3 percent required by Basel III.141 Additionally, the United States imposes higher capital standards on SIFIs, ranging from an additional 1 to 5 percent of total assets versus only 1 to 3 percent of total assets in Basel III.142 The U.S. rules require large banks to either hold more capital or decrease their size.
In the UK—like the United States, a large exporter of banking services—similar reforms were instituted. UK retail banks will be required to hold a special capital buffer of as much as 3 percent of their assets, weighted for risk.143 UK banking regulators also went beyond Basel III standards by developing and adopting rules on “ringfencing” retail banks, to separate the provision of consumer banking services from the more volatile trading activities of investment banks.144 These rules would require larger banks to separate their investment and retail banking activities by 2019.145 The separation would allow regulators to require higher capital buffers for the retail segment and minimize reliance on the investment bank for revenue.146 Furthermore, the UK has introduced a Senior Managers Regime that names individual managers who must take personal responsibility for certain banking functions and could face criminal penalties in the event that the bank fails.147
As with the United States, these rules particularly affect the largest UK banks and could impact trade by increasing the costs to comply with regulations or by placing very large banks at a competitive disadvantage vis-à-vis other competitors. At the same time, the June 2016 referendum in the UK to exit the EU will likely affect both the UK and global financial services sectors (see box 3.2).
140 U.S. Treasury, Dodd-Frank at Five Years, July 2015, 13. 141 Keats, “Are Tougher Regulations Helping or Hurting US Banks?” November 16, 2016. 142 IIB, 2015 Global Survey, October 2015, 111. 143 FastFT, “BoE Sets Out Capital Rules for Ringfenced Banks,” May 26, 2016. 144 These rules will have a similar effect to the Glass-Steagall Act. PRA, “The Implementation of Ring-fencing,” March 2016; The Week, “How Will the UK Bank Ringfence Work?” October 26, 2015. 145 This is similar to Glass-Steagall, enacted in 1933 in response to the Great Depression. IIB, 2015 Global Survey, October 2015, 98. 146 The Week, “How Will the UK Bank Ringfence Work?” October 26, 2015. 147 IIB, 2015 Global Survey, October 2015, 99.

Chapter 3: Banking
78 | www.usitc.gov
Box 3.2: The Impact of Brexit on Financial Services
On June 23, 2016, the United Kingdom voted in a referendum to leave the European Union (“Brexit”).a
This will likely have a significant impact on the UK’s financial services industry.
Industry clusters, such as financial services in London, are groups of interconnected companies that share knowledge, are close to clients, can access specialized labor and services inputs, and benefit from economies of scale.b The cluster of financial and related services firms in the UK generates $300 billion in annual output and employs 2.2 million people,c and by some estimates makes London the top financial center in the world.d This industry is highly international: in 2014, the UK’s $102 billion in insurance and financial services exports were equivalent to 3.4 percent of its GDP.e By contrast, such exports only accounted for 0.8 percent of GDP in the rest of the EU and 0.6 percent in the United States. Many foreign firms (including U.S. firms) have established financial operations in London and use it as a gateway to the European market.
The EU is the UK’s top market for financial services: it receives about one-third of the UK’s financial and insurance services exports and one-half of its cross-border bank lending.f In 2015, London had only 2.6 percent of the EU’s total jobs, but had 6.2 percent of the EU’s finance and insurance jobs, reflecting the high geographic concentration and tradability of these services.g And while the UK accounts for 18 percent of the EU’s GDP, it hosts 85 percent of the EU’s hedge fund assets and 64 percent of its private equity funds.h
This concentration is possible because EU membership provides UK-based financial firms (including foreign firms that have offices in the UK) with a “passport,” signifying mutual recognition of prudential standards. This allows financial firms to offer cross-border services and open branches across the EU.i Without such a passport, firms must get regulatory permissions for each country where they operate.
Before the referendum, several financial firms indicated that Brexit would likely cause them to shift resources from the UK to subsidiaries in the EU (e.g., in Dublin, Paris, or Frankfurt) in order to maintain access to their clients. HSBC said it may move up to 1,000 trading jobs to Paris, Morgan Stanley said it may move 1,000 jobs out of London, and JP Morgan said it may move up to 4,000 jobs out of the UK.j
There have been previous efforts to reduce London’s role in the EU’s financial system. In 2011, the European Central Bank required clearing houses that handled large volumes of euros to be located in Eurozone countries so it could better monitor trades and provide liquidity in a crisis. The UK challenged this policy, and in 2015 the EU General Court ruled that the UK could host such clearing houses, which process about $1 trillion of euro-based trades per day. However, after the referendum, French president François Hollande reopened the issue by arguing that euro-denominated clearing must take place within the EU.k
Key questions that are frequently posed for the financial services industry after Brexit:
• Will the UK have a voice in designing future EU financial regulations, and will it have to abide by those regulations in order to access the EU market?
• Will the UK fall outside of the EU’s data protection and transfer regime?
• Will the UK lose preferential trade benefits (including provisions on financial services) that have been established by EU trade agreements with 53 other countries?

Recent Trends in U.S. Services Trade: 2016 Annual Report
U.S. International Trade Commission | 79
• As skilled labor is a key input to the financial sector, will new restrictions on the movement of people or the loss of workers through emigration erode London’s competitive position?
• How will ancillary industries like legal, accounting, and consulting services be affected?
The consequences for financial services will depend on new UK-EU arrangements, still to be negotiated. Possible arrangements include membership in the European Economic Area (like Iceland, Liechtenstein, and Norway), the European Free Trade Association (like Switzerland), or a customs union (like Turkey). The UK could also merely have World Trade Organization “most favored nation” status with respect to the EU, or the parties could draft a completely new trade agreement.l Notably, some of these arrangements require contributions to the EU budget and commitments to the free movement of people, both sensitive issues in the UK. Most arrangements do not provide access to the EU’s single market for financial services, and where access is provided it is contingent on the UK adopting EU regulations (without having any formal influence on such regulations).
In any scenario, London will likely retain competitive advantages in financial services by virtue of its legal system, business environment, and skilled labor, and the city will incentivize financial firms to stay. However, many firms are likely to wait and see what happens before making large new investments or hiring new employees in the UK, and in the meantime consider their options including shifting their operations to the EU.m
a “Leave” won by 52 percent to 48 percent, on a turnout of 72 percent (or more than 30 million voters). b Porter, “Clusters and the New Economics of Competition,” 1998. c TheCityUK, “Key Facts,” March 2016, 4. d Yeandle, Global Financial Centres Index 19, March 2016. This index is based on business environment, human capital,
financial sector development, infrastructure, and reputation. London is followed by New York and Singapore. e World Bank, World Development Indicators (accessed July 5, 2016). f IMF, United Kingdom: Selected Issues, June 17, 2016, 14. g UK, ONS, Workforce Jobs by Industry (accessed July 5, 2016); Eurostat, Employment by Sex, Age, and Economic Activity
(accessed July 5, 2016). h TheCityUK, “A Guide to the EU Referendum,” May 2016, 4. i Passporting applies to a variety of financial services, including operating trading platforms, regulating prospectuses for public
offerings, managing and marketing collective investment schemes, and acting as central counterparties. International Organization of Securities Commissions, “IOSCO Task Force on Cross-Border Regulation,” 2014, 27.
j Arnold and Noonan, “Banks Begin Moving Some Operations Out of Britain,” June 26, 2016. For HSBC and Morgan Stanley, these numbers represent about 20 percent of staff employed in their London trading operations.
k Brunsden and Chassany, “François Hollande Rules Out City’s Euro Clearing Role,” June 28, 2016. l Kierzenkowski et al., “The Economic Consequences of Brexit,” April 2016. m Barker, “City of London Has Lost Its Voice with Brexit,” June 26, 2016.

Chapter 3: Banking
80 | www.usitc.gov
In the EU, the Capital Requirements Directive 4 (CRD4) has been introduced to implement the Basel III standards, similar to Dodd-Frank in the United States.148 Taking effect in January 2014, CRD4 brings the EU in line with the Basel III capital standards, but also creates a limit on bonuses that can be given to bankers.149 Some sources view these restrictions on compensation as having the potential to undermine a bank’s willingness to enter a foreign market due to concerns about recruiting top talent.150 The EU has also undertaken additional rule-making regarding a broad overhaul of the European Financial Regulation and a framework for bank resolution.151
In November 2013, China issued new capital standards for banks, bringing Chinese standards generally in line with the Basel III requirements.152 However, Chinese standards are also stricter than the Basel III standards when it comes to calculating risk.153 Six of China’s largest banks were unable to meet the strict capital standards, resulting in a waiver being issued by the Chinese regulator, the Chinese Banking Regulatory Commission.154 On December 20, 2014, separately from its implementation of Basel III rules, China issued new rules providing greater market access for foreign banks wishing to enter the Chinese market.155 In Hong Kong, where banks are regulated separately from mainland China, the Basel III regulations have additional impacts. The implementing rules require banks to hold certain types of domestic assets, such as government bonds, to withstand market volatility.156 However, governments like Hong Kong simply do not issue the levels of debt often found in Western markets, making it difficult for banks to meet their regulatory liquidity requirements.157 This difficulty could prevent some banks from establishing affiliates in markets like Hong Kong, diverting international trade in banking from those markets.
148 Banking in the UK has also been governed by regulations issued by the European Union (EU). However, the June 23, 2016, referendum in the UK exiting the EU will have profound institutional implications for the EU financial system. See box 3.2 on Brexit’s implications for the financial services sector. It is estimated that EU-level directives account for about one-sixth of UK regulations. Morgan, “Financial Services Sector Implications,” March 28, 2016; IIB, “2015 Global Survey,” October 2015, 30, 31. 149 BBC, “EU Tightens Up Bank Lending Rules,” April 16, 2013. 150 UK regulators maintain that their regime for bonuses is already effective and that the EU caps provided for under CRD4 could have a perverse effect on UK banking. BBC, “EU Tightens Up Bank Lending Rules,” April 16, 2013. 151 EC, “Economic Review of the Financial Regulation Agenda,” May 5, 2014; EC, “EU Bank Recovery and Resolution Directive (BRRD),” April 15, 2014. 152 CBRC, “Capital Rules for Commercial Banks,” November 29, 2013. 153 BIS, “Post-RCAP Follow-up Report,” March 2015, 2. 154 The waiver allowed the subject banks to use their own models to evaluate risk when calculating capital requirements. Zhu, “Six Chinese Banks Allowed to Use,” April 24, 2014. 155 IIB, Global Survey 2015, October 2015, 24. 156 KPMG, Hong Kong Bank Survey, September 2012, 13. 157 Ibid. For a more detailed discussion of how differences in the approaches of different national bank regulators affect international trade in banking services, see Norton Rose Fulbright, Supervision of International Bank Branches, n.d. (accessed June 7, 2016).

Recent Trends in U.S. Services Trade: 2016 Annual Report
U.S. International Trade Commission | 81
Differences in Regulation Affect Trade in Banking Services
Most international trade in banking services occurs by using the commercial presence of a bank in a foreign market (mode 3).158 As a highly regulated activity, banks face high costs demonstrating to regulators that they have complied with the various rules.159 For the largest banks, compliance costs can amount to billions of dollars.160 Large banks with experienced compliance departments are most easily capable of absorbing these costs, making larger banks more likely to provide services internationally. However, large banks are increasingly the focus of special regulatory rules designed to limit the potential for a large firm to introduce instability into the global financial system. These two trends serve to limit trade in banking services. In other words, while complex regulations may deter smaller banks from entering foreign markets, regulations that specifically target larger institutions reduce international activity by those banks that remain interested in operating in multiple countries.161
Trade Trends
Cross-border Trade In 2015, U.S. cross-border exports of banking services totaled $74.2 billion and cross-border imports totaled $17.9 billion, creating a surplus of $56.4 billion (figure 3.6) (box 3.3). The U.S. surplus in banking services declined by 6 percent from 2014 to 2015, reversing a trend of growing trade surpluses since 2010. The United States has registered a cross-border trade surplus in banking services each year from 2010 to 2015.
158 See “Trade Trends” section. 159 Noonan, “Banks Face Push Back,” May 28, 2015. 160 Ibid. 161 Conversely, new and more complicated rules may increase the likelihood that a bank will leave a particular market.

Chapter 3: Banking
82 | www.usitc.gov
Figure 3.6: Banking services: U.S. cross-border trade in banking services resulted in a U.S. trade surplus each year during 2010–15
Source: USDOC, BEA, table 3.1, “U.S. International Trade in Services” (accessed June 16, 2016). (See appendix table B.12.)
Note: BEA conducted a benchmark survey that greatly increased the number of respondents reporting international trade flows of banking services. This increase is reported for the years 2013, 2014, and 2015, and is responsible for the sharp increase in flows between 2012 and 2013.
The recovery from the global financial crisis resulted in strong growth of U.S. exports of banking services since 2010. However, between 2014 and 2015, U.S. exports decreased by 5 percent, during a period of low interest rates and a rapidly changing regulatory environment, as discussed above. This decline can primarily be attributed to a decrease in exports of financial management, financial advisory, and custody services.
Box 3.3: An Explanation of BEA Data on Cross-Border Trade and Affiliate Transactions in Banking Services
Official data on cross-border trade in banking services are not available. BEA reports data for non-insurance financial services broken out into four categories:
• Financial management, financial advisory, and custody services
• Credit card and other credit-related services
• Securities brokerage, underwriting, and related services
• Securities lending, electronic funds transfer, and other services
The Commission reports the sum of the first two categories (financial management, financial advisory, and custody services, and credit card and other credit-related services) as cross-border trade in banking services while reporting the other two categories as securities services. Both banks and securities firms engage in all four classes of activity. However, the activities reported as banking services tend to be
0
10
20
30
40
50
60
70
80
90
2010 2011 2012 2013 2014 2015
Billi
on $
Exports Imports
2015 trade surplus $56.4 billion
Recent Trends in U.S. Services Trade: 2016 Annual Report
U.S. International Trade Commission | 83
dominated by banks, while those reported as securities services tend to be provided predominantly by securities firms.
Official data on affiliate transactions are not presented symmetrically. Sales by non-insurance U.S. majority-owned foreign affiliates are categorized as depository credit intermediation and other non-insurance financial services. However, purchases are only categorized as insurance and non-insurance financial services. Due to this asymmetry, affiliate transactions in banking services can only be addressed in the context of U.S. exports.
Both cross-border trade and affiliate transactions of banking services can be broken into imports and exports. For cross-border trade, a U.S. import occurs when a U.S. person purchases a banking service from a bank located in another country. Similarly, an export occurs when a foreign person in his or her home country purchases a banking service from a U.S. bank located in the United States. Affiliate transactions occur through the establishment, by a bank of one country, of a commercial presence in another country. A U.S. export occurs when a U.S. bank established in a foreign market sells banking services to a person of that country. Similarly, a U.S. import occurs when a U.S. person purchases a banking service from a foreign bank established in the United States.
U.S. imports of banking services increased by 2 percent from 2014 to 2015, compared to 17 percent growth from 2013 to 2014. U.S. imports of credit card and credit-related services are an increasingly important component of U.S. imports of banking services, growing at a rate of 4 percent from 2014 to 2015, compared to 1 percent for financial management, financial advisory, and custody services. The slowdown of U.S. imports of banking services from 2014 to 2015 is attributable to the same factors causing the slowdown in exports.
Affiliate Transactions Sales by U.S.-owned foreign affiliates (U.S. companies with a commercial presence in a foreign country) decreased by 7 percent from 2012 to 2013, compared to a compound annual growth rate (CAGR) between 2009 and 2012 of 3 percent (figure 3.7). Purchases from foreign-owned U.S. affiliates decreased 9 percent from 2012 to 2013, despite a CAGR of 6 percent during 2009–12. The decrease in affiliate transactions in U.S. banking services in recent years likely reflects the larger global trend (discussed above) for financial services providers of de-risking to comply with new capital requirements. In particular, services to foreign embassies, nonprofit organizations, and correspondent banking are particularly affected by this trend.162
162 Correspondent banking occurs when one financial institution maintains an account with a foreign financial institution to take advantage of financial services that may be performed more economically or efficiently by the foreign bank in its domestic market. FFIEC, “Correspondent Accounts (Foreign)—Overview,” Bank Secrecy Act/Anti-Money Laundering Infobase, http://www.ffiec.gov/bsa_aml_infobase/pages_manual/olm_047.htm (accessed August 8, 2016); Durner and Shetret, Understanding Bank De-Risking, November 2015, 3.

Chapter 3: Banking
84 | www.usitc.gov
Figure 3.7: Banking services: U.S.-owned foreign affiliate sales outpaced purchases from foreign-owned U.S. affiliates during 2009–13
Source: USDOC, BEA, table 3.1, “Services Supplied to Foreign Persons by U.S. MNEs through Their MOFAs, by Industry of Affiliate and by Country of Affiliate,” and table 4.1, “Services Supplied to U.S. Persons by Foreign MNEs through Their MOUSA, by Industry of Affiliate and by Country of UBO” (both accessed March 3, 2016). (See appendix table B.13.)
In 2013, the UK was the largest purchaser of banking services sold through U.S.-owned foreign affiliates, purchasing $13.6 billion (25 percent) of banking services (figure 3.8). Australia and Canada both accounted for about 4 percent of all U.S.-owned foreign affiliate sales, purchasing $2.3 and $2.1 billion, respectively. China ($1.0 billion) and Germany ($0.9 billion) rounded out the top five purchasers of banking services from U.S.-owned foreign affiliates in 2013.
0
10
20
30
40
50
60
70
2009 2010 2011 2012 2013
Billi
on $
U.S.-owned foreign affiliates Foreign-owned U.S. affiliates

Recent Trends in U.S. Services Trade: 2016 Annual Report
U.S. International Trade Commission | 85
Figure 3.8: Banking services: In 2013, the United Kingdom was the largest purchaser of banking services from U.S.-owned foreign affiliates
Source: USDOC, BEA, table 3.1, “Services Supplied to Foreign Persons by U.S. MNEs through Their MOFAs, by Industry of Affiliate and by Country of Affiliate,” and table 4.1, “Services Supplied to U.S. Persons by Foreign MNEs through Their MOUSA, by Industry of Affiliate and by Country of UBO” (accessed March 3, 2016). (See appendix B.14.) Note: Country-level data for foreign-owned U.S affiliates of banking firms is limited and not included.
Outlook The outlook for banking services is positive. Demand for financial services generally tracks economic activity, and as the global economy continues to stabilize from the financial crisis and returns to growth, demand for financial services is expected to increase as well.163 Despite weak performance in 2015, industry revenue is expected to grow modestly in 2016.164 Beyond 2016, the banking industry is forecast to have revenues increase in the next five years. Similarly, industry assets are expected to increase.165 However, new capital requirements could depress industry profits.166
Emerging economies are forecast to have strong growth in the coming years, and global banks have an opportunity to expand into these markets.167 Growth in emerging economies is expected to come, in part, from high adoption rates for mobile banking technologies, which
163 Rouzet et al., Services Trade Restrictiveness Index (STRI), November 4, 2016, 6. 164 Conerly, “Banking Forecast 2015,” January 12, 2015. 165 IBISWorld, Global Commercial Banking, March 2016, 7. 166 Ibid. 167 Ibid.
United Kingdom 25%
Australia 4%
Canada 4%
China 2%
Germany 2%
All other countries 63%
U.S.-owned foreign affiliates Total = $53.9 billion

Chapter 3: Banking
86 | www.usitc.gov
allow banking services to be provided without costly networks of physical infrastructure.168 The existence of developing countries with relatively young populations and good telecommunications networks implies that there will be exponential growth in the number of mobile banking customers over the next 5–10 years.169
The outlook is less certain when it comes to the challenges and opportunities posed by fintech. Fintech firms are offering innovative new services that are more efficient and less costly than those offered by traditional banks. Banks increasingly perceive fintech firms as partners in the delivery of banking services and have begun to collaborate with them, leveraging the banks’ relationship with their customers while allowing the fintech firms to design and facilitate the customer interface.170 If they are able to continue to embrace fintech and use innovative technology to enhance the delivery of banking services, banks will be in a stronger and better position to grow.171
168 KPMG, Mobile Banking Report 2015, July 2015, 3. 169 Ibid. 170 PwC, “Blurred Lines,” March 2016, 29. 171 Accenture, Fintech and the Evolving Landscape, 2016, 11.
Recent Trends in U.S. Services Trade: 2016 Annual Report
U.S. International Trade Commission | 87
Bibliography Accenture. Fintech and the Evolving Landscape: Landing Points for the Industry, 2012.
http://www.fintechinnovationlablondon.co.uk/fintech-evolving-landscape.aspx.
Aglionby, John. “Fintech Takes Off in Africa as Lenders Tap Mobile Technology.” Financial Times, May 16, 2016. https://next.ft.com/content/6f5453d6-1b69-11e6-8fa5-44094f6d9c46.
Alloway, Tracy. “P2P Lender Bondora Targets Europe.” Financial Times, February 26, 2015. https://next.ft.com/content/3bbe3600-bdc2-11e4-9d09-00144feab7de.
Alper, Alexandra, and Louise Egan. “Basel III Delinquents May Face Sanctions: G20 Official.” Reuters, November 4, 2012. http://www.reuters.com/article/us-g20-banks-idUSBRE8A303F20121104.
Arnold, Martin, and Laura Noonan. “Banks Begin Moving Some Operations Out of Britain.” Financial Times, June 26, 2016. https://next.ft.com/content/a3a92744-3a52-11e6-9a05-82a9b15a8ee7.
Banker Database. “Top 50 Banks in Top 1000 World Banks, 2016,” August 23, 2016. http://www.thebankerdatabase.com/index.cfm/top50/.
Bank for International Settlements (BIS). “Basel III: International Regulatory Framework for Banks.” http://www.bis.org/bcbs/basel3.htm (accessed June 7, 2016).
Bank for International Settlements (BIS). “Basel Committee on Banking Supervision.” https://www.bis.org/bcbs/ (accessed June 7, 2016).
Bank for International Settlements (BIS). “Post-RCAP Follow-up Report: China,” March 2016. https://www.bis.org/bcbs/implementation/l2_cn_followup_mar16.pdf.
Bank for International Settlements (BIS). Tenth Progress Report on Adoption of the Basel Regulatory Framework, April 2016. http://www.bis.org/bcbs/publ/d366.pdf.
Bank of England. Inflation Report, May 2016. http://www.bankofengland.co.uk/publications/Documents/inflationreport/2016/may.pdf.
Barker, Alex. “City of London Has Lost Its Voice with Brexit, Says Lord Hill.” Financial Times, June 26, 2016. https://next.ft.com/content/2b84027e-3b93-11e6-9f2c-36b487ebd80a.

Chapter 3: Banking
88 | www.usitc.gov
BBC. “EU Tightens Up Bank Lending Rules and Bonuses,” April 16, 2013. http://www.bbc.com/news/world-europe-22164384.
BNY Mellon. Innovation in Payments: The Future Is Fintech, October 2015. https://www.bnymellon.com/_global-assets/pdf/our-thinking/innovation-in-payments-the-future-is-fintech.pdf.
Brunsden, Jim, and Anne-Sylvaine Chassany. “François Hollande Rules Out City’s Euro Clearing Role.” Financial Times, June 28, 2016. https://www.ft.com/content/e8e0c44a-3d89-11e6-9f2c-36b487ebd80a.
Caplen, Brian. “Ring-fencing Raises Fresh Challenges for UK Banks,” June 1, 2015. http://www.thebanker.com/Editor-s-Blog/Ring-fencing-raises-fresh-challenges-for-UK-banks?ct=true.
China Banking Regulatory Commission (CBRC). “Capital Rules for Commercial Banks,” November 29, 2013. http://www.cbrc.gov.cn/EngdocView.do?docID=86EC2D338BB24111B3AC5D7C5C4F1B28.
Clover, Charles. “China P2P Lender Banks on Social Media Usage.” Financial Times, August 30, 2015. https://next.ft.com/content/673d9608-4d83-11e5-b558-8a9722977189.
Conerly, William. “Banking Forecast 2015: Earnings Headed Up.” Forbes, January 12, 2015. http://www.forbes.com/sites/billconerly/2015/01/12/banking-forecast-2015-earnings-headed-up/#5f4323c62f31.
Desai, Falguni. “The Fintech Boom and Bank Innovation.” Forbes, December 14, 2015. http://www.forbes.com/sites/falgunidesai/2015/12/14/the-fintech-revolution/#79422fff36da.
Durner, Tracey, and Liat Shetret. Understanding Bank De-Risking and Its Effects on Financial Inclusion: An Exploratory Study. Global Center on Cooperative Security, November 2015. http://www.globalcenter.org/wp-content/uploads/2015/11/rr-bank-de-risking-181115-en.pdf.
Economist Intelligence Unit (EIU). Beyond Branches: Innovations in Emerging-Market Banking, 2012.
———.Out and Down: Mapping the Impact of Brexit, 2016.
Recent Trends in U.S. Services Trade: 2016 Annual Report
U.S. International Trade Commission | 89
Elliott, Nicholas. “Where Fin-Tech Is Struggling With Regulation.” Wall Street Journal, November 24, 2015. http://blogs.wsj.com/riskandcompliance/2015/11/24/where-fin-tech-is-struggling-with-regulation/.
European Commission (EC). “Economic Review of the Financial Regulation Agenda.” EC Staff Working Document, May 15, 2014. http://ec.europa.eu/finance/general-policy/docs/general/20140515-erfra-working-document_en.pdf.
———.“EU Bank Recovery and Resolution Directive (BRRD): Frequently Asked Questions.” EC Memo, April 15, 2014. http://europa.eu/rapid/press-release_MEMO-14-297_en.htm.
Eurostat. Employment by Sex, Age, and Economic Activity. Labor Force Survey. http://ec.europa.eu/eurostat/web/lfs/data/database (accessed July 5, 2016).
EY. UK Fintech: On the Cutting Edge. Report commissioned by HM Treasury, February 24, 2016. http://www.ey.com/UK/en/Industries/Financial-Services/Banking---Capital-Markets/EY-UK-FinTech-On-the-cutting-edge.
FastFT. “BoE Sets Out Capital Rules for Ringfenced Banks,” May 26, 2016. http://www.ft.com/fastft/2016/05/26/boe-sets-out-capital-rules-for-ringfenced-banks/.
Federal Reserve System (Federal Reserve). Consumers and Mobile Financial Services 2015, March 2015. http://www.federalreserve.gov/econresdata/consumers-and-mobile-financial-services-report-201503.pdf.
———.“Consumers and Mobile Financial Services 2016.” Washington, DC: Board of Governors of the Federal Reserve System, March 30, 2016. http://www.federalreserve.gov/communitydev/mobile_finance.htm.
Fitch Ratings. “Leave or Remain: Hypothetical Brexit Scenarios.” Reuters, May 16, 2016. http://www.reuters.com/article/idUSFit957914.
Gray, Alistar. “US Banks Endure Biggest Drop in Revenues since 2011.” Financial Times, April 19, 2016. https://next.ft.com/content/5d0b1df8-0634-11e6-9b51-0fb5e65703ce.

Chapter 3: Banking
90 | www.usitc.gov
Gulati, Sameer, Marie-Claude Nadeau, and Kausik Rajgopal. “Gauging the Disruptive Potential of Digital Wallets.” McKinsey on Payments 8, no. 21 (May 2015): 3–10. http://www.mckinsey.com/~/media/McKinsey/dotcom/client_service/Financial%20Services/Latest%20thinking/Payments/MoP21_digital_wallets.ashx.
Higginson, Matt, Steve Krieger, and Wings Zhang. “16 in 2016: Trailblazing Trends in Global Payments.” McKinsey on Payments 8, no. 22 (October 2015): 17–25. http://www.mckinsey.com/~/media/McKinsey/Industries/Financial%20Services/Our%20Insights/16%20in%202016%20Trailblazing%20trends%20in%20global%20payments/16%20in%202016%20Trailblazing%20trends%20in%20global%20payments_2015.ashx.
HV, Vinayak, Gillian Lee, Kartik Rajendran, and Joydeep Sengupta. “Weathering the Storm: Asia-Pacific Banking Review 2016.” McKinsey and Company, June 2016. http://www.mckinsey.com/industries/financial-services/our-insights/weathering-the-storm-asia-pacific-banking-review-2016?cid=other-eml-alt-mip-mck-oth-1606.
IBISWorld. Global Commercial Banking. IBISWorld Industry Report, March 2016.
Institute of International Bankers (IIB). Global Survey 2015: Regulatory and Market Developments. New York: IIB, October 2015. https://c.ymcdn.com/sites/iib.site-ym.com/resource/resmgr/weekly_bulletin/2015GlobalSurvey.pdf.
International Monetary Fund (IMF). United Kingdom: Selected Issues. Country Report No. 16/169, June 17, 2016. http://www.imf.org/external/pubs/ft/scr/2016/cr16169.pdf.
International Organization of Securities Commissions (IOSCO). “IOSCO Task Force on Cross-Border Regulation: Consultation Report,” 2014. http://www.centralbank.ie/regulation/marketsupdate/Documents/IOSCOPD466.pdf.
International Regulatory Strategy Group (IRSG). “Regulatory Landscape.” http://www.irsg.co.uk/ (accessed June 7, 2016).
Keats, Rebecca. “Are Tougher Regulations Helping or Hurting US Banks?” Marketrealist.com, November 16, 2016. http://marketrealist.com/2015/11/us-banks-played-pivotal-role-2008-financial-crisis/.
Kelly, Gail. The Digital Revolution in Banking. Group of 30. Occasional Paper 89. Washington, DC, 2014. www.centerforfinancialstability.org/research/OP89.pdf.
Kessler, Andy. “The Uberization of Banking.” Wall Street Journal, April 29, 2016. http://www.wsj.com/articles/the-uberization-of-banking-1461967266m.

Recent Trends in U.S. Services Trade: 2016 Annual Report
U.S. International Trade Commission | 91
Kierzenkowski, Rafal, Nigel Pain, Elena Rusticelli, and Sanne Zwart. The Economic Consequences of Brexit: A Taxing Decision. OECD Economic Policy Paper No. 16, April 28, 2016. http://www.oecd-ilibrary.org/economics/the-economic-consequences-of-brexit_5jm0lsvdkf6k-en.
Kim, Hwan. “5 Predictions for the Future of Payments.” World Economic Forum, August 25, 2015. https://www.weforum.org/agenda/2015/08/5-predictions-for-the-future-of-payments/.
Koncz-Bruner, Jennifer, and Anne Flatness. “U.S. International Services: Cross-Border Trade in 2008 and Services Supplied through Affiliates in 2007.” U.S. Bureau of Economic Analysis (BEA). Survey of Current Business, October 2009. http://www.bea.gov/scb/pdf/2009/10 October/1009_services_text.pdf.
Kowalik, Michal, Troy Davig, Charles S. Morris, and Kristen Regehr. “Bank Consolidation and Merger Activity Following the Financial Crisis.” Economic Review 100, no. 1 (First Quarter 2015). https://www.kansascityfed.org/publicat/econrev/pdf/15q1Kowalik-Davig-Morris-Regehr.pdf.
KPMG. “Banking on the Future: The Expectations of the Gen Y Professional,” 2015. https://home.kpmg.com/au/en/home/insights/2016/03/banking-on-the-future.html.
———. Hong Kong Banking Survey: 2012, September 2012. https://home.kpmg.com/cn/en/home/insights/2010/03/hong-kong-banking-survey-2012-201209.html.
———. Mainland China Banking Survey 2015, July 2015. https://www.kpmg.com/CN/en/IssuesAndInsights/ArticlesPublications/Documents/Mainland-China-Banking-Survey-201507-high.pdf.
———. Mobile Banking Report 2015, July 2015. https://www.kpmg.com/FR/fr/IssuesAndInsights/ArticlesPublications/Documents/Mobile-Banking-092015.pdf.
———.“The Need for Speed: 2016 Banking Industry Outlook Survey,” 2016. https://assets.kpmg.com/content/dam/kpmg/pdf/2016/04/banking-industry-outlook-survey.pdf.
Landers, Ryan. “How FinTech Is Changing Business (and Bank Accounts).” Business.com, January 7, 2016. http://www.business.com/finance/how-fintech-is-changing-business-and-bank-accounts/.

Chapter 3: Banking
92 | www.usitc.gov
McKinsey & Company. “Cutting Through the FinTech Noise: Markers of Success, Imperatives for Banks,” December 2015. https://www.febelfin.be/en/cutting-through-fintech-noise-markers-success-imperatives-banks.
McKinsey & Company. Global Payments 2015: A Healthy Industry Confronts Disruption, October 2015. http://www.mckinsey.com/industries/financial-services/our-insights/payments.
Morgan, Lewis. “Financial Services Sector Implications of ‘Brexit.’” Blog, Bloomberg, March 28, 2016. http://www.bloomberg.com/professional/blog/financial-services-sector-implications-of-brexit/.
Morgan Stanley. Can P2P Lending Reinvent Banking? Morgan Stanley Blue Papers, July 17, 2015. http://www.morganstanley.com/ideas/p2p-marketplace-lending.
Noonan, Laura. “Banks Face Pushback over Surging Compliance and Regulatory Costs.” Financial Times, May 28, 2015. http://www.ft.com/cms/s/0/e1323e18-0478-11e5-95ad-00144feabdc0.html#axzz4Glq7SgLk.
Norton Rose Fulbright. “Supervision of International Bank Branches”. n.d. http://www.nortonrosefulbright.com/knowledge/technical-resources/banking-reform/supervision-of-international-bank-branches---a-global-analysis/ (accessed June 7, 2016).
Office of the Comptroller of the Currency (OCC). Supporting Responsible Innovation in the Federal Banking System: An OCC Perspective, March 2016. http://www.occ.gov/publications/publications-by-type/other-publications-reports/pub-responsible-innovation-banking-system-occ-perspective.pdf.
Okwakol, Sam. “Vodafone Claims 25m M-Pesa Customers.” East African Business Week, May 2, 2016. http://www.busiweek.com/index1.php?Ctp=2&pI=5105&pLv=3&srI=69&spI=221.
Organisation for Economic Co-operation and Development (OECD). Economic and Social Benefits of Internet Openness. OECD Digital Economy Papers No. 257, 2016. http://www.oecd-ilibrary.org/science-and-technology/economic-and-social-benefits-of-internet-openness_5jlwqf2r97g5-en.
Planet Money. “Brexit.” Episode 707, NPR, June 24, 2016. http://www.npr.org/templates/transcript/transcript.php?storyId=483142244.

Recent Trends in U.S. Services Trade: 2016 Annual Report
U.S. International Trade Commission | 93
Policy Exchange. Ringfencing UK Banks: More of a Problem than a Solution, December 16, 2013. http://www.policyexchange.org.uk/images/publications/ringfencing%20uk%20banks.pdf.
Porter, Michael. “Clusters and the New Economics of Competition.” Harvard Business Review, November–December 1998. https://hbr.org/1998/11/clusters-and-the-new-economics-of-competition.
Prudential Regulation Authority (PRA). “The Implementation of Ring-fencing: The PRA’s Approach to Ring-fencing Transfer Schemes.” Bank of England Policy Statement PS10/16. http://www.bankofengland.co.uk/pra/Pages/publications/ps/2016/ps1016.aspx.
PwC. Blurred Lines: How Fintech Is Shaping Financial Services. Global Fintech Report, March 2016. http://www.pwc.com/gx/en/advisory-services/FinTech/PwC%20FinTech%20Global%20Report.pdf.
Rao, Leena. “PayPal Just Backed an Investment App for Millennials.” Fortune, April 21, 2016. http://fortune.com/2016/04/21/paypal-acorns/.
Rouzet, Dorothée, Hildegunn Kyvik Nordås, Frederic Gonzales, Massimo Geloso Grosso, Iza Lejárraga, Sébastien Miroudot, and Asaka Ueno. Services Trade Restrictiveness Index (STRI): Financial Services. OECD Trade Policy Papers no. 175, November 4, 2014. http://dx.doi.org/10.1787/5jxt4nhssd30-en.
Sienkiewicz, Stan. “Credit Cards and Payment Efficiency.” Federal Reserve Bank of Philadelphia Discussion Paper, August 2001. http://papers.ssrn.com/sol3/papers.cfm?abstract_id=927493.
Simpson, Stephen. “The Banking System: Commercial Banking.” Investopedia, n.d. http://www.investopedia.com/university/banking-system/banking-system1.asp (accessed May 30, 2016).
Tetlow, Gemma. “Brexiters’ Very Different Visions of Post-EU Britain.” Financial Times, June 25, 2016. https://next.ft.com/content/c4ae013a-370f-11e6-a780-b48ed7b6126f.
TheCityUK. “A Guide to the EU Referendum,” May 2016. https://www.thecityuk.com/assets/2016/Reports-PDF/A-guide-to-the-EU-referendum.pdf.

Chapter 3: Banking
94 | www.usitc.gov
TheCityUK. “Key Facts about UK Financial and Related Professional Services,” March 2016. https://www.thecityuk.com/assets/2016/Reports-PDF/Key-facts-about-UK-financial-and-related-professional-services-2016.pdf.
The Week. “How Will the UK Bank Ring-fence Work?” October 26, 2016. http://www.theweek.co.uk/66236/how-will-the-uk-bank-ring-fence-work.
Tracy, Ryan. “Policy Makers Defend Postcrisis Financial Regulation.” Wall Street Journal, May 7, 2016. http://www.wsj.com/articles/policy-makers-defend-postcrisis-financial-regulation-1457390208.
United Kingdom (UK). Office for National Statistics (ONS). Workforce Jobs by Industry. Nomis Official Labor Market Statistics, March 2016. https://www.nomisweb.co.uk/query/construct/summary.asp?mode=construct&version=0&dataset=130.
U.S. Department of Commerce (USDOC). Bureau of Economic Analysis (BEA). Table 2.1, “U.S. Trade in Services, by Type of Service.” Interactive tables: International Data. http://bea.gov/iTable/iTable.cfm?ReqID=62&step=1#reqid=62&step=2&isuri=1&6210=1 (accessed June 16, 2016).
———.Bureau of Economic Analysis (BEA). Table 4.1, “Services Supplied to U.S. Persons by Foreign MNEs through Their MOUSA, by Industry of Affiliate and by Country of UBO.” Interactive tables: International Data. http://bea.gov/iTable/iTable.cfm?ReqID=62&step=1#reqid=62&step=2&isuri=1&6210=1 (accessed June 16, 2016).
———.Bureau of Economic Analysis (BEA). Table 3.1, “Services Supplied to Foreign Persons by U.S. MNEs through Their MOFAs, by Industry of Affiliate and by Country of Affiliate.” Interactive tables: International Data. http://bea.gov/iTable/iTable.cfm?ReqID=62&step=1#reqid=62&step=2&isuri=1&6210=1 (accessed June 16, 2016).
———.U.S. International Economic Accounts: Concepts and Methods. June 30, 2014. http://www.bea.gov/international/concepts_methods.htmhttp://www.bea.gov/international/concepts_methods.htm.
U.S. Department of the Treasury (U.S. Treasury). Dodd-Frank at Five Years: Reforming Wall Street and Protecting Main Street, July 2015. https://www.treasury.gov/press-center/Documents/DFA%205%20Year%20Deck.pdf.
Recent Trends in U.S. Services Trade: 2016 Annual Report
U.S. International Trade Commission | 95
———.Opportunities and Challenges in Online Marketplace Lending, May 10, 2016. https://www.treasury.gov/connect/blog/Pages/Opportunities-and-Challenges-in-Online-Marketplace-Lending.aspx.
U.S. International Trade Commission (USITC). Recent Trends in U.S. Services Trade: 2012 Annual Report. USITC Publication No. 4338. Washington, DC: USITC, July 2012. https://usitc.gov/publications/industry_econ_analysis_332/2012/recent_trends_us_services_trade_2012_annual_report.htm.
Vasagar, Jeevan. “Singapore Banks Become a Hotbed for ‘Fintech.’” Financial Times, May 5, 2016. https://next.ft.com/content/7dc5fcb0-1120-11e6-91da-096d89bd2173.
Wisniewski, Mary. “These Startups Are Trying to Solve Real Bank Problems.” American Banker, October 13, 2016. http://www.americanbanker.com/news/bank-technology/these-startups-are-trying-to-solve-real-bank-problems-1077190-1.html?fintech.
Wolf, David. “The Role of Payment Networks in Enabling Fintech Innovation and What Policymakers Can Do to Support It.” Presentation to the Information Technology and Innovation Foundation, May 11, 2016. https://itif.org/media/role-payment-networks-enabling-fintech-innovation.
Woolsey, Ben, and Emily Gerson. “The History of Credit Cards.” Creditcards.com, May 11, 2009. http://www.creditcards.com/credit-card-news/credit-cards-history-1264.php.
World Bank. Global Findex (Global Financial Inclusion Database). http://datatopics.worldbank.org/financialinclusion/ (accessed May 2, 2016).
———.World Development Indicators. http://databank.worldbank.org/data/reports.aspx?source=world-development-indicators (accessed July 5, 2016).
World Economic Forum (WEF). The Future of FinTech: A Paradigm Shift in Small Business Finance. Global Agenda Council on the Future of Financing and Capital, October 2015. https://www.weforum.org/reports/future-fintech-paradigm-shift-small-business-finance/.
Yeandle, Mark. Global Financial Centres Index 19. Z/Yen Group, March 2016. http://www.longfinance.net/global-financial-centre-index-19/992-gfci-19.html.

Chapter 3: Banking
96 | www.usitc.gov
Yurcan, Bryan. “Are Troubled Banks and Fintech a Perfect Fit?” American Banker, May 13, 2016. http://www.americanbanker.com/news/bank-technology/are-troubled-banks-and-fintech-a-perfect-fit-1081006-1.html?pg=1.
Zhu, Grace. “Six Chinese Banks Allowed to Use New Capital Rules.” Wall Street Journal, April 24, 2014. http://www.wsj.com/articles/SB10001424052702304788404579520764104968656.

U.S. International Trade Commission | 97
Chapter 4 Insurance Services Summary The United States is the world’s largest insurance market. It accounted for 27 percent of total global premiums in 2014, a 2 percent increase over 2013.172 U.S. insurance companies also held the most assets in 2014—$5.2 trillion, on which they earned $223.2 billion in net investment income.173 U.S. insurers face both challenges and opportunities: they report that climate change is complicating the provision of coastal property insurance and crop insurance, and life insurers are struggling with low global interest rates that depress investment income. At the same time, cybersecurity insurance represents a new and rapidly growing market.
U.S. trade in insurance services through affiliates––sales by U.S.-owned affiliates in foreign markets, and purchases from foreign-owned affiliates in the United States––continues to exceed cross-border trade in insurance by a wide margin. The United States maintained a large deficit in cross-border insurance trade in 2015, though that deficit shrank to its lowest level since 2006. Similarly, purchases of insurance from U.S. affiliates of foreign firms have modestly exceeded sales by foreign affiliates of U.S. firms since 2011. Going forward, emerging markets will likely be the fastest-growing insurance markets, and the industry will continue to be shaped by regulatory changes, liberalization of trade barriers, and the introduction of new data analytics technologies, among other factors.
Introduction The insurance industry plays a critical role in the global economy by managing risk. Insurers underwrite financial risks—i.e., they accept liability and guarantee payment in case of loss—by selling life and non-life (property and casualty) products. They also provide services such as reinsurance (which transfers risk between insurance companies), marine and transportation insurance (which covers goods in transit), and insurance brokerage services (which package policies from multiple underwriters).174
172 Insurance Information Institute, “Top 10 Countries by Life and Nonlife Direct Premiums Written” (accessed May 9, 2016). 173 OECD, OECD.Stat, Insurance Indicators (accessed May 25, 2016). 174 There are also many new and innovative insurance products under development or growing quickly, such as pandemic insurance, insurance covering shared transportation and lodging services, and cybersecurity insurance (See Box 4.1).

Chapter 4: Insurance
98 | www.usitc.gov
The ability to purchase insurance encourages economic activity: it mitigates the risks of project failure for business owners, reduces social threats by offering consumer discounts for low-risk behavior, and increases the volume of investable funds by pooling the premiums of small investors. Revenues in the insurance industry are largely a product of collected premiums and investment income, minus claims paid to policy holders.
Market Conditions The total (life and non-life) world insurance market shrank by 4 percent in 2015 to $4.6 trillion, as measured by total premiums.175 The United States is the largest market by far; its $552.5 billion in life premiums and $763.8 billion in nonlife premiums together accounted for 29 percent of total premiums written globally (table 4.1). Japan, China, and the United Kingdom were the world’s second-, third-, and fourth-largest insurance markets, accounting for 10 percent, 8 percent, and 7 percent of total world premiums, respectively. Japan’s share of the world total has fallen from 13 percent in 2010, while China’s share has risen from 5 percent in 2010.176 China had the fastest 2015 growth rate: its $386.5 billion in total 2015 premiums was 18 percent higher than in 2014. As people get wealthier they acquire more valuable property that can be insured, so the highest growth rates are likely to be in emerging markets like China for the foreseeable future. The ratio of life premiums to nonlife premiums varies among countries; in the United States, nonlife premiums accounted for 58 percent of total premiums in 2015, but in Japan they accounted for only 24 percent. Insurance penetration rates (the ratio of premiums written to GDP) also vary among countries, ranging from an estimated 3 percent in China to 13 percent in South Korea.177
175 Insurance Information Institute, “Top 10 Countries by Life and Nonlife” (accessed May 9, 2016). 176 Insurance Information Institute, International Insurance Fact Book 2012, 2012. 177 OECD, OECD.Stat, “Insurance Indicators” (accessed May 9, 2016).

Recent Trends in U.S. Services Trade: 2016 Annual Report
U.S. International Trade Commission | 99
Table 4.1: Top countries by direct premiums written, 2015
Country Life premiums
(billion $)
Nonlife premiums (billion $)
Total premiums (billion $)
CAGR for total premiums,
2011–15
Percent of total world
premiums
Total insurance penetration,
2014 (%) United States 552.5 763.8 1,316.7 2 28.9 11.0 Japan 343.8 105.9 449.7 -9 9.9 7.2 China 210.8 175.7 386.5 15 8.5 3.2a United Kingdom 214.5 105.7 320.2 0 7.0 11.0 France 150.1 80.4 230.5 -4 5.1 9.3 Germany 96.7 116.5 213.3 -3 4.7 6.5 Italy 124.8 40.2 165.0 1 3.6 8.9 South Korea 98.2 55.4 153.6 4 3.4 12.6 Canada 49.3 65.6 115.0 -1 2.5 4.8b Taiwan 79.6 16.4 96.0 5 2.1 (c)
Sources: Insurance Information Institute, “Top 10 Countries by Life and Nonlife,” 2014; Insurance Information Institute, Archived Tables (accessed June 20, 2016); Insurance Information Institute, International Insurance Fact Book 2013, 2013, 6; OECD, OECD.Stat, “Insurance Indicators” (accessed May 9, 2016); Swiss Re, “Stronger Advanced Markets' Performance Boosts Insurance Industry Growth,” June 24, 2015. CAGR = compound annual growth rate.
a Swiss Re estimate. b 2013 value, most recent available. c Not available.
Insurers earn money on both premiums and investments. In 2014, U.S. life insurers held $3.8 trillion in assets and U.S. nonlife insurers held $1.4 trillion (table 4.2). In the life sector, Japan and Germany were in second and third place, with Japan’s insurers holding $2.9 trillion in assets and Germany’s holding $1.2 trillion. For nonlife insurers, Germany and the UK were in second and third place, with $578.0 billion and $247.6 billion in assets, respectively. Investments by U.S. insurance companies grew by 4 percent compared to 2013 in both the life and nonlife sectors. In contrast, Japan’s life insurance investments fell 9 percent compared to 2013, and the UK’s nonlife insurance investments fell by 11 percent. Germany’s total investments remained largely unchanged.
Because of their longer duration, bonds remained the dominant asset. Among the top 10 countries by total investments held, the average asset allocation in the life insurance sector was 57 percent bonds, 15 percent stock market shares, and 27 percent other (including real estate and loans) in 2014. In the nonlife sector, asset allocation was 48 percent bonds, 14 percent equity shares, and 38 percent other investments. Large asset holdings allowed U.S. insurers to earn $174.9 billion in net investment income in the life sector and $48.4 billion in the nonlife sector in 2014.

Chapter 4: Insurance
100 | www.usitc.gov
Table 4.2: Top countries by investments of direct insurance companies, life and nonlife, 2014 Life
Country
Total investments
(billion $) % change
2013-14
Percent of investment in
bonds
Percent of investment in
shares
Percent of investment in
other
Net investment income
(billion $) United States 3,766.8 4.4 73.4 3.7 22.9 174.9 Japan 2,935.8 -9.2 67.8 8.2 24.0 89.5 Germany 1,191.1 0.0 40.0 3.3 56.7 55.1 United Kingdom 704.4 3.0 63.8 13.0 23.2 81.3 Netherlands 537.3 7.0 41.0 18.6 40.5 10.3 South Korea 484.0 7.6 54.4 4.5 41.1 19.1 France 409.8 -16.8 83.0 11.9 5.0 (a) Denmark 307.8 1.9 36.2 49.2 14.6 (a) Switzerland 295.2 -3.7 61.1 2.4 36.4 9.1 Sweden 287.7 -3.7 51.1 38.9 10.1 (a)
Nonlife
Country
Total investments
(billion $) % change
2013-14
Percent of investment in
bonds
Percent of investment in
shares
Percent of investment in
other
Net investment income
(billion $) United States 1,427.7 4.3 62.3 25.5 12.2 48.4 Germany 578.0 0.9 40.6 9.5 50.0 18.6 United Kingdom 247.6 -10.6 40.2 6.1 53.7 7.4 Japan 231.6 -6.0 32.5 29.4 38.1 4.3 France 205.2 -7.4 60.7 24.6 14.6 (a) South Korea 149.7 15.4 37.3 3.8 58.8 5.1 Switzerland 122.3 -4.1 36.6 3.9 59.5 5.1 Netherlands 91.9 -9.2 43.6 7.7 48.7 1.5 Sweden 65.0 -8.8 55.1 30.6 14.3 (a) Australia 48.5 -8.2 70.6 2.0 27.4 3.0
Source: OECD.Stat, “Insurance Indicators” (accessed May 25, 2016). a Not available.
Berkshire Hathaway (United States), AXA (France), and Allianz (Germany) were the top three insurance companies by revenue in 2014 (table 4.3).178 Berkshire Hathaway is the largest property and casualty insurer, while AXA is the largest life and health insurer.179 While the list of top 10 global insurance firms has remained fairly constant over time, there have been some changes: since 2013, UnitedHealth Group (United States) and Zurich Insurance Group (Switzerland) have been replaced by Ping An Insurance (China) and Legal and General Group (UK). Notably, Japan Post Holdings (a life and health insurer) was the top insurance company by revenue as recently as 2011, but is now the fourth largest. Japan voted to privatize Japan Post in 2005, and it made an initial public offering in November 2015.180 Since 2008, the Japan Post distribution network has sold insurance products by other insurers, such as Aflac.
178 Insurance Information Institute, “Top 10 Global Insurance Companies by Revenues,” 2014. 179 Berkshire Hathaway holds several large insurance companies, including GEICO and Berkshire Hathaway Reinsurance Group. 180 Hyuga, “Japan Post Shares Surge 29 Percent,” November 3, 2015.

Recent Trends in U.S. Services Trade: 2016 Annual Report
U.S. International Trade Commission | 101
Table 4.3: Top global insurance companies by revenue, 2014 (billion dollars) Firm Country 2014 revenue Industry Berkshire Hathaway United States 194.7 Property/casualty AXA France 161.2 Life/health Allianz Germany 136.8 Property/casualty Japan Post Holdings Japan 129.7 Life/health Assicurazioni Generali Italy 118.9 Life/health Prudential plc UK 99.0 Life/health China Life Insurance China 87.2 Life/health Ping An Insurance China 86.0 Life/health Legal & General Group UK 84.8 Life/health Munich Re Germany 81.7 Property/casualty
Source: Insurance Information Institute, “Top 10 Global Insurance Companies by Revenues,” 2014.
Emerging Supply and Demand Factors The global insurance industry is adapting to challenges and opportunities presented by recent developments. The industry reports that climate change is increasing the risks associated with coastal property and crop insurance, while historically low global interest rates have created a difficult financing environment for life insurers. At the same time, the rising demand for cybersecurity insurance represents a promising market for a relatively new service (box 4.1). The following sections discuss these trends.
Insurers’ Reactions to Climate Change Concerns The insurance industry is analyzing and adjusting its strategies to address the economic risks associated with climate change.181 There is concern within the industry that these risks are potentially significant and growing.182 This concern is exacerbated by the fact that coastal property is becoming more valuable, as high demand for real estate in coastal areas has driven rapid development and growth in population density there.183
In addition, government programs may complicate the risk picture for insurers. Governments have subsidized coastal development for decades; for example, the U.S. federal government has historically funded two-thirds of the costs of beach nourishment (transporting sand to
181 Insurance Information Institute, “Climate Change,” September 2014. 182 Rising sea levels, warming temperatures, and changing rainfall patterns would affect the frequency and severity of floods, hurricanes, and droughts leading to higher risks for property and casualty insurers. Swiss Re, “Underinsurance of Property Risks,” 2015, 10. Also see Munich Re, “Climate Change,” n.d.; Lloyd’s of London, “Coastal Communities and Climate Change,” 2008; and AIG, “Climate Change: A Call for Weatherproofing the Insurance Industry,” 2012. It should be noted that it is difficult to attribute any single weather event, which has several proximate causes, to a long-run phenomenon that affects the average frequency, intensity, and duration of such events. See National Academies Press, Attribution of Extreme Weather Events, 2016. 183 To provide context for the value of property at risk, the exposure of one state insurance program, the Florida Hurricane Catastrophe Fund, exceeded $2 trillion, as measured in 2010. GAO, Natural Catastrophe Insurance Coverage Remains a Challenge, April 16, 2010, 2, 19.

Chapter 4: Insurance
102 | www.usitc.gov
widen beaches) in its coastal communities,184 and by one estimate, the government provides subsidized flood insurance at half the true-risk cost.185 According to the U.S. Government Accountability Office (GAO), these government subsidies distort price signals in the private insurance market and prevent policy holders from facing the true costs of climate change risks.186
As with flood insurance, crop insurance is often subsidized by governments. In the United States, the U.S. Department of Agriculture (USDA) administers the federal crop insurance program, which in 2013 covered $125 billion in property.187 Farmers use insurance to manage weather-related risks to crop yields, which are affected by changes in average temperatures and rainfall patterns. However, coverage is typically based on production history, so if yields in some regions fall over time due to climate change, there may be fewer crops to insure. A greater risk may be market distortions that motivate farmers to plant in risky areas, thus raising the overall cost of crop insurance.188
Insurers have responded to climate-related risks in a variety of ways. Allstate canceled or did not renew coastal property policies in many Gulf Coast states in 2006–07, and reduced its homeowners’ policies in Florida from 1.2 million to 400,000 after the extensive hurricane damage of the 2004–05 hurricane seasons.189 Some insurers set similar targets, while others hollowed out their coverage of at-risk property by increasing deductibles and adding exclusions.190 Last year, the SmarterSafer coalition (which includes Allianz, Liberty Mutual, and Swiss Re) released a report concluding that the United States should spend more on pre-disaster mitigation to prepare for changing climate conditions.191 In one case, an insurer has gone further and alleged that governments are legally obliged to prepare for foreseeable climate change-related damage. In 2014, Illinois Farmers Insurance Co. filed class-action lawsuits against local governments near Chicago for failing to prepare for climate change-related increases in rainfall, although the lawsuits were dropped two weeks later.192
The potential effects of climate change on insurers are unclear as they may create both opportunities and challenges for the industry. Berkshire Hathaway’s 2015 letter to shareholders suggests that property insurers may be resilient in the face of sudden increases in weather-related losses, since such insurance policies are typically written for one year and repriced 184 McNamara et al., “Climate Adaptation and Policy-Induced Inflation,” March 25, 2015. 185 Property Casualty Insurers Association of America, “True Market-Risk Rates for Flood Insurance,” June 2011, 6. 186 GAO, Climate Change: Better Management of Exposure, October 2014, 11. 187 Ibid. 188 Ibid. 189 Mills, “Responding to Climate Change,” 2007, 2. Also see Conley, “Gathering Storm,” September 18, 2007. 190 Insurance Journal, “Allstate Adds Maryland Coast to Its ‘No New Business’ List,” December 22, 2006. 191 SmarterSafer, Bracing for the Storm, April 2015. 192 Book, “Farmers Insurance Withdraws Class Action,” June 16, 2014.

Recent Trends in U.S. Services Trade: 2016 Annual Report
U.S. International Trade Commission | 103
annually to reflect changing exposures. The annual repricing means that higher risks translate quickly into higher premiums. For that reason, the potential growth in the cost and frequency of climate change-related losses may increase the size and maintain the profitability of insurance companies.193
The industry faces challenges in measuring and managing complex risks;194 for example, weather-related losses can be correlated at very high values (like as when severe flooding follows a hurricane).195 These phenomena make risk models much more difficult to calibrate,196 as even a slight increase in the number or impact of severe weather events can severely reduce the resilience of insurers.197 Dr. Robert P. Hartwig, former president of the Insurance Information Institute, said in early 2016, “It’s not presently possible . . . to take the output of climate change models and apply them to insurance pricing.” Furthermore, according to
193 Berkshire Hathaway, “2015 Letter to Shareholders,” 2015. Excerpts from the statement by Chairman and CEO Warren Buffet follow (25–26): “It seems highly likely to me that climate change poses a major problem for the planet. I say ‘highly likely’ rather than ‘certain’ because I have no scientific aptitude and remember well the dire predictions of most ‘experts’ about Y2K. It would be foolish, however, for me or anyone to demand 100% proof of huge forthcoming damage to the world if that outcome seemed at all possible and if prompt action had even a small chance of thwarting the danger. . . . “Up to now, climate change has not produced more frequent nor more costly hurricanes nor other weather-related events covered by insurance. As a consequence, U.S. super-cat rates have fallen steadily in recent years, which is why we have backed away from that business. If super-cats become costlier and more frequent, the likely—though far from certain—effect on Berkshire’s insurance business would be to make it larger and more profitable.” “As a citizen, you may understandably find climate change keeping you up nights. As a homeowner in a low-lying area, you may wish to consider moving. But when you are thinking only as a shareholder of a major insurer, climate change should not be on your list of worries.” 194 According to Christopher Smy at Marsh, the world’s largest insurance broker, insurers’ risk is about probable loss, frequency, and severity, and insurers do not necessarily have to label it. McCann, “Hot Topic,” March 23, 2016. 195 Additionally, in the loss distributions associated with climate change, the most extreme losses are orders of magnitude greater than the second most extreme losses. Correlation of multiple losses in a probability distribution is called tail dependence, while probability distributions showing an abnormally high probability of catastrophic losses are known as fat tails. Kousky and Cooke, “Climate Change and Risk Management,” February 2009. Also see Weitzman, “Fat-Tailed Uncertainty,” 2011. 196 Property insurers typically model recurrence intervals for losses—for example, “one-in-200” year losses—equal to the costliest losses they are likely to cover, with a probability of 99.5 percent. They use these estimates to set prices and decide how much capital to hold. So the business model of a typical insurance company depends heavily on how the 99.5 percent curve is calculated. Mackenzie, “Buffett’s Climate Certainty,” March 7, 2016. 197 Many catastrophic weather events over the previous decade (for example, Hurricane Katrina, Superstorm Sandy, floods in Thailand) were thought of as rare and infrequent. But Standard and Poor’s analysts estimated that if the last decade is typical (i.e., if this rate of catastrophic losses is the new normal), then the actual “one-in-250-year” loss is about 50 percent higher than the “one-in-250-year” loss currently estimated by reinsurers. S&P, “Climate Change Could Sting Reinsurers,” September 3, 2014.

Chapter 4: Insurance
104 | www.usitc.gov
Hartwig, the amount of capital available to insure against natural disasters is at its highest in industry history.198
Developing countries are typically considered growth markets for insurers because of their rising wealth and low insurance penetration rates. Moreover, developing countries are also disproportionately vulnerable to potential effects of climate change. For example, countries in South and Southeast Asia are highly exposed to flooding risks in coastal areas, while sub-Saharan African countries are highly exposed to risks of crop failure from drought.199 Insurance is an input to economic growth in these situations; for example, one study finds that farmers in Ghana make more productive investments in their farms if they have the opportunity to purchase rainfall insurance.200
If insurance is unavailable or unaffordable, individuals and firms will be unable to hedge against risks, inhibiting economic growth. However, there are a number of promising public and private efforts to provide climate risk insurance for developing countries as part of an overall adaptation plan. For example, the G7 Climate Risk Insurance Initiative aims to provide 400 million people in developing countries with increased access to insurance coverage against the impacts of climate change by 2020,201 and many individual insurers and reinsurers (including Allianz, AIG, Munich Re, and Swiss Re) have offered microinsurance products against the risks of drought throughout the developing world, including in India, Ethiopia, Kenya, and Mali.202 Such programs would likely increase subsidized exports of insurance services from countries like the United States, Japan, and the UK to developing countries.
The Impact of Low Global Interest Rates on the Insurance Sector Low global interest rates are challenging the financial models of life insurance firms. Life insurers accept premium payments from customers, invest that income in financial assets, and then pay out money to meet claims. Their profits, and their decisions on how to set prices, are based on the investment income they make during the period between receipts and payments—i.e., the spread between what is earned during the period that premiums are invested and what is paid when claims are due.203 The solvency of life insurers depends on the
198 McCann, “Hot Topic,” March 23, 2016. 199 IPCC, Climate Change 2014, 2014, 382, 1218. 200 Karlan et al., “Agricultural Decisions after Relaxing Credit,” December 2013. 201 UNFCCC, “G7 Climate Risk Insurance Initiative,” n.d. 202 Mills, “From Risk to Opportunity,” 2009, 37; Geneva Association, “The Insurance Industry and Climate Change,” July 2009, 87-88; Swiss Re, “Insuring the Frontier Markets,” 2016, 6-10. 203 Insurance companies have a perpetual and rolling investment portfolio, so they depend on the profits made on a spread of assets over time.
Recent Trends in U.S. Services Trade: 2016 Annual Report
U.S. International Trade Commission | 105
yields returned on high-quality long-term assets, which in turn depend on the interest rates set by central banks.
Since the 2008–09 financial crisis, central banks have kept interest rates at record low levels, as the global economy has suffered a mismatch between excess savings and insufficient investment opportunities. The benchmark 10-year U.S. Treasury yield has dropped from nearly 5 percent in 2007 to 2 percent in 2016. Countries representing nearly a quarter of the global economy actually have negative interest rates, meaning banks must pay to hold deposits with the central bank. For example, the European Central Bank pushed short-term policy interest rates below zero in June 2014, and the Bank of Japan adopted negative interest rates in January 2016.204
A sustained period of low interest rates threatens the solvency and stability of life insurers. Many life insurers’ risk scenarios did not anticipate that interest rates would drop to such low levels and remain there.205 For example, several years ago one insurance company priced its life policies under the assumption that premium investments would earn 7.5 percent, but the firm now expects a 4 percent yield on its investments.206 One survey found that the net portfolio yield across the entire life insurance industry fell from 6 percent in 2006 to 5.3 percent in 2011.207 Future payments to policy holders are contractually guaranteed, so an unforeseen drop in investment income can create a critical mismatch between assets and liabilities.
Interest rates also affect life insurers because the present value of expected future earnings is used by regulators to determine the amount of capital they must keep in reserve. If the value of expected earnings falls, insurers are required by statute to keep more capital in reserve. The current low-interest-rate environment is helping to drive the rise in total reserves held by the life insurance industry, which increased from $2.0 trillion in 2006 to $2.9 trillion at the end of 2013.208 High reserve requirements protect insurers against insolvency, but they also lock up capital that could otherwise be put to productive use.
In response, life insurers are adjusting the asset mix of their investment portfolios. Insurers such as MetLife are increasingly purchasing swaps and derivatives to hedge against interest rate risk.209 One possibility is that the low-interest-rate environment may push life insurers into
204 Wolf, “Negative Rates Are Not the Fault,” April 12, 2016. 205 U.S. Treasury, FIO, Annual Report on the Insurance Industry, September 2015. 206 Scism, “Low Rates Are Tormenting Insurers,” March 20, 2016. Negative interest rates mean that depositors, like private banks, are charged for keeping their money in accounts at central banks. Central banks have adopted negative interest rates in recent years in an attempt to encourage banks to lend more money and take more risks in order to stimulate the economy. 207 NAIC and the Center for Insurance Policy Research, State of the Life Insurance Industry, August 2013, 143. 208 NAIC and the Center for Insurance Policy Research, “Low Interest Rates,” February 2016. 209 Scism, “Low Rates Are Tormenting Insurers,” March 20, 2016.

Chapter 4: Insurance
106 | www.usitc.gov
higher-yielding but riskier assets, a behavior sometimes called “gambling for redemption.”210 A recent report found that life insurers increased their investments in lower-rated bonds and nontraditional, illiquid assets such as private equity between 2010 and 2014.211 The attempt to maximize yields is pro-cyclical (its value moves in the same direction as the economy) and can increase macroeconomic risks. Regulators are concerned about such strategies; life insurers are required to back their obligations with safe assets, but the definition of “safe” is often broad, enabling insurers to invest in complex and atypical assets while staying within regulatory parameters.212 The Organisation for Economic Co-operation and Development (OECD) reports that in 2014, life insurers in Japan, Israel, and Greece were especially active in shifting their investments into higher-risk assets.213 If this strategy is successful it will improve their global competitiveness, but they also may be more vulnerable to market reversals.
Box 4.1: Cybersecurity Insurance Is Growing Rapidly
Cybersecurity insurance is a relatively new market but one that is growing rapidly, reflecting firms’ increasing concerns about their vulnerability to cyber threats. Cyberattacks have increased in frequency and severity in recent years. In 2015, over 736 million records were exposed in data breach incidents,a
and one estimate puts the annual cost of global cybercrime at $400 billion.b
Over the past few years, companies like Home Depot, Target, Anthem, and Sony have experienced high-profile, costly cyberattacks. Target’s 2013 data breach cost the company an estimated $264 million.c For companies, the highest cost of cyberattacks is business lost due to reputational damage, although costs of detection and crisis management are also significant. One survey found that the average cost of a data breach in 2015 was $4 million per company; that figure is higher for companies in healthcare, education, pharmaceuticals, and finance.d Another 2015 survey estimated that the average cost of a data breach was as much as $4.8 million for large businesses and as much as $476,000 for small ones.e
Insurers have responded to the growing demand for cybersecurity insurance. Global premiums in this segment totaled about $2.5 billion in 2014, according to one estimate, and could grow to $7.5 billion by 2020.f Most major corporate insurers currently offer some form of cyber insurance, although many will not write policies for more than $100 million.g In one survey of publicly traded companies, a majority of businesses reported having some form of cybersecurity insurance; 91 percent of such companies had data restoration insurance, while 54 percent had expense reimbursement insurance.h The supply of, and demand for, cybersecurity insurance is currently concentrated in the United States, but Europe’s market is expanding quickly, and regulatory changes that require greater data protection are expected to drive growth in Asia.i
210 Antolin, Schich, and Yermo, “The Economic Impact of Protracted Low Interest Rates,” 2011. 211 Conning, “Life Insurance Industry Investments,” November 2015. 212 Haltom, “Reaching for Yield,” July 2013. This regulatory situation is evolving: for example, Prudential, MetLife, and AIG have been designated “systemically important financial institutions,” and regulators are still determining how that designation will affect capital requirements. Furthermore, the EU introduced a new regulatory framework called Solvency II in early 2016, which sets new capital requirements and includes rules on how life insurers identify and monitor risk. Gray, “US Life Insurers Shaken by Rock-Bottom Rates,” March 2, 2016. 213 OECD, Global Insurance Market Trends 2015, 2016, 17.

Recent Trends in U.S. Services Trade: 2016 Annual Report
U.S. International Trade Commission | 107
Policies are typically offered only after extensive review of the client’s cybersecurity controls, and payouts generally require companies to take adequate steps to protect their data. However, many data breaches are caused by well-known vulnerabilities. The JPMorgan Chase Corporate Challenge website was recently breached through an SQL injection vulnerability that has been on a public list of top 10 web vulnerabilities for the past decade.j In 2012, the Federal Trade Commission (FTC) alleged that the Wyndham Worldwide hotel chain had violated the FTC Act (which prohibits unfair commercial practices) by not using reasonable data security measures such as firewalls and encryption; the company’s out-of-date software had been hacked three times in 2008 and 2009, resulting in $11 million of fraudulent charges.k This changing landscape creates uncertainty about claims.
The growing cybersecurity insurance market faces other challenges. A lack of actuarial data on cyber threats makes it difficult to model risks. These data limitations are exacerbated by the fact that many companies are reluctant to report or share information on breaches. The Department of Homeland Security hosted a 2014 workshop on cybersecurity insurance, and the participants voiced support for a shared repository of information on cyber incidents to help address this issue.l Regulators are also getting involved, as the Securities and Exchange Commission is considering measures that would require publicly owned companies to disclose information about data breaches.m
a Risk-Based Security, “2015 Reported Data Breaches Surpasses All Previous Years,” February 2, 2016. b CSIS, Net Losses: Estimating the Global Cost of Cybercrime, June 2014. c Finkle, “Cyber Insurance Premiums Rocket after High-Profile Attacks,” October 12, 2015. d Ponemon Institute, 2015 Cost of Data Breach Study, May 2015. e PWC and Info Security Europe, 2015 Information Security Breaches Survey, 2015. Converted from British pounds to U.S.
dollars by USITC staff. f PwC, Insurance 2020 and Beyond, 2015. g Finkle, “Cyber Insurance Premiums Rocket after High-Profile Attacks,” October 12, 2015. h Veracode and NYSE, “Cybersecurity and Corporate Liability in the Boardroom,” November 5, 2015. i Kirkpatrick, “Cyber Policies on the Rise,” October 2015. j Veracode and NYSE, “Cybersecurity and Corporate Liability in the Boardroom,” November 5, 2015. k Harvard Law Review, “FTC v. Wyndham Worldwide Corp,” February 10, 2016. l DHS, “Insurance for Cyber-Related Critical Infrastructure Loss,” July 2014. m Bennett, “SEC Weighs Cybersecurity Disclosure Rules,” January 14, 2015.
Trade Trends
Cross-border Trade The United exported $17.1 billion and imported $47.8 billion in insurance services in 2015 (a decrease of 1 percent and 8 percent, respectively, from the previous year), resulting in a large cross-border trade deficit (figure 4.1) (box 4.2). However, while exports have grown steadily at an average annual rate of 5 percent since 2010, imports have contracted: 2015 imports were about three-quarters of their 2010 level. This is mostly driven by shrinking imports of reinsurance services (i.e., insurance purchased by insurance firms to manage risk), which fell from $56 billion in 2010 to $42 billion in 2015. As a result, the U.S. cross-border trade deficit in insurance services is at its lowest level since 2006. All categories of insurance exports and

Chapter 4: Insurance
108 | www.usitc.gov
imports have nearly doubled since 2005, and reinsurance exports have nearly tripled, reflecting ongoing globalization in this industry.214
Figure 4.1: Insurance services: U.S. cross-border trade in insurance services resulted in a large but shrinking U.S. trade deficit each year during 2010–15
Source: USDOC, BEA, table 3.1, “U.S. International Trade in Services” (accessed June 6, 2016). (See appendix table B.15.)
Box 4.2: Understanding BEA Data on Cross-border Trade and Affiliate Transactions in Insurance Services
The BEA publishes cross-border trade data for direct insurance services (which include life insurance, property and casualty insurance, and freight insurance) and auxiliary insurance services (which include commissions, brokerage services, consulting services, and actuarial services), as well as reinsurance. Trade in insurance services is calculated as the sum of premium income (adjusted for normal losses), investment income, and income from auxiliary services. Estimates of normal losses are calculated by averaging the difference between total premiums and losses over several years. The BEA also estimates the investment income that insurance firms earn based on their reserves, and categorizes it under insurance premium supplements. Auxiliary insurance services include earnings from the provision of actuarial, agency, brokerage, claims adjustment, and salvage administration services, as well as commissions.
In 2008, the BEA changed the way it calculates affiliate transactions in insurance services, revising its estimates to reflect “services supplied through affiliates” rather than “sales of services.” The BEA’s newer measure is more similar to output than to sales value. Much like cross-border trade data, these affiliate data incorporate sales (again adjusted for normal losses) and premium supplements.a
a USDOC, BEA, Survey of Current Business 88, no. 10 (October 2008), 34–35.
In 2014, Bermuda was the top U.S. trade partner for insurance services, accounting for 20 percent of U.S. exports and 46 percent of U.S. imports (figure 4.2). The $22.9 billion of 214 U.S. Treasury, FIO, Annual Report on the Insurance Industry, June 2013, 38.
0
10
20
30
40
50
60
70
2010 2011 2012 2013 2014 2015
Billi
on $
Exports Imports
2015 trade deficit $30.6 billion

Recent Trends in U.S. Services Trade: 2016 Annual Report
U.S. International Trade Commission | 109
insurance imported from Bermuda (almost all of which was reinsurance) exceeded imports from the 10 next-largest trade partners combined. Bermuda’s outsized role is largely due to its low tax rates and light regulations, which have motivated insurance companies to locate and make transactions in that country. Canada, Japan, the UK, and Australia are also significant export markets for U.S. insurers, accounting for 17 percent, 12 percent, 11 percent, and 5 percent of exports, respectively (figure 4.3). Canada purchased 32 percent of U.S. direct insurance exports, and both Japan and the UK purchased more reinsurance services than Bermuda. Switzerland, the UK, Ireland, and Germany accounted for 13 percent, 10 percent, 6 percent, and 5 percent of U.S. insurance imports, respectively.
The United States runs an insurance trade surplus with Japan and Canada, and a trade deficit (generally driven by reinsurance) with its other major trading partners. The pattern of U.S. reinsurance imports tracks the location of the world’s top reinsurance firms, which include PartnerRe and Everest (Bermuda), Swiss Re and Zurich Insurance Group (Switzerland), Lloyd’s of London (UK), XL + Caitlin (Ireland), and Munich Re and Hannover Re (Germany).215
215 Direct insurance sales and reinsurance sales may be correlated to the extent that direct insurance firms purchase reinsurance on a fixed percentage of insurance sold, but reinsurance is also purchased for a variety of other risk management reasons.

Chapter 4: Insurance
110 | www.usitc.gov
Figure 4.2: Insurance services: Bermuda was the leading market for U.S. cross-border exports and imports of insurance in 2014
Source: USDOC, BEA, table 2.2., “U.S. Trade in Services, by Type of Service and by Country or Affiliation” (accessed March 4, 2016). (See appendix table B.16.)
Bermuda 20%
Canada 17%
Japan 12% United Kingdom 11%
Mexico 3%
Other Western Hemisphere 13%
Other Asia-Pacific 11%
Other Europe 11%
Africa & the Middle East 2%
U.S. exports Total = $17.4 billion
Bermuda 46%
Switzerland 12%
United Kingdom 10%
Ireland 6%
Germany 5%
Other Europe 3%
Other Western Hemisphere 16%
Asia-Pacific 2% Africa & the Middle
East <1%
U.S. imports Total = $50.1 billion

Recent Trends in U.S. Services Trade: 2016 Annual Report
U.S. International Trade Commission | 111
Figure 4.3: Insurance services: In 2014, the United States had its largest cross-border insurance trade deficit with Bermuda
Source: USDOC, BEA, table 2.2, “U.S. Trade in Services, by Type of Service and by Country or Affiliation” (accessed March 4, 2016). (See appendix table B.17.)
Affiliate Transactions In 2013, the United States sold $64.8 billion in insurance services through its overseas affiliates and purchased $69.5 billion of insurance from local affiliates of foreign-owned firms,216 resulting in a trade deficit of $4.7 billion (figure 4.4).217 Total sales by foreign affiliates of U.S. insurers have stayed nearly constant since 2008, growing at an average annual rate of 1 percent. However, this figure masks a redistribution of U.S. insurance sales: while affiliate sales in Canada and Europe shrank at an average annual rate of 5 percent and 1 percent respectively, affiliate sales in Japan and Latin America grew by 11 percent and 6 percent respectively. Purchases from U.S. affiliates of foreign insurers shrank by 3 percent from 2012 to 2013, but overall growth since 2008 has been strong, with U.S. purchases increasing at an
216 In many countries, cross-border insurance trade is restricted by regulators due to the difficulty of evaluating the solvency of foreign insurance companies. Most cross-border sales of insurance services are to large corporations operating in global markets. In contrast, foreign affiliates are licensed locally and subject to the full supervision of local insurance regulators, and therefore face fewer restrictions. USITC, Property and Casualty Insurance Services, March 2009, 3-1. 217 The 2013 trade deficit was 33 percent smaller than in 2012. Note that mode 3 sales had exceeded mode 3 purchases as recently as 2010.
-20,000 -15,000 -10,000 -5,000 0 5,000
Mexico
United Kingdom
Japan
Canada
Bermuda
Million $
Exports Trade balance

Chapter 4: Insurance
112 | www.usitc.gov
average annual rate of 8 percent. This growth has been driven by purchases from affiliates of Canadian firms (which increased at an average annual rate of 12 percent) and European firms (4 percent), while purchases from affiliates of Latin American firms have fallen at an average annual rate of 13 percent.
Figure 4.4: Insurance services: Since 2011, services purchased from U.S. affiliates of foreign-owned insurance firms have exceeded services supplied by foreign affiliates of U.S.-owned insurance firms
Source: USDOC, BEA, table 3.1, “Services Supplied to Foreign Persons by U.S.MNEs through Their MOFAs, by Industry of Affiliate and by Country of Affiliate,” and table 4.1 “Services Supplied to U.S. Persons by Foreign MNEs through Their MOUSA, by Industry of Affiliate and by Country of UBO” (both accessed March 4, 2016). (See appendix table B.18.)
Japan was the top market for sales by U.S.-owned foreign insurance affiliates in 2013, accounting for 35 percent of total sales (figure 4.5), while the UK and Canada accounted for 13 percent and 7 percent, respectively. Canadian firms accounted for 19 percent of purchases from foreign-owned U.S. insurance affiliates in 2013. Due to the limited availability of country-by-country data, it is necessary to look at earlier years to identify other top sources of U.S. affiliate purchases: the UK accounted for 13 percent of affiliate purchases in 2012, and Japan accounted for 1 percent of affiliate purchases in 2011.
0
10
20
30
40
50
60
70
80
2009 2010 2011 2012 2013
Billi
on $
U.S.-owned foreign affiliates Foreign-owned U.S. affiliates

Recent Trends in U.S. Services Trade: 2016 Annual Report
U.S. International Trade Commission | 113
Figure 4.5: Insurance services: Japan was the largest market for services supplied by foreign affiliates of U.S.-owned insurance firms in 2013
Source: USDOC, BEA table 3.1, “Services Supplied to Foreign Persons by U.S. NMEs through Their MOFAs, by Industry of Affiliate and by Country of Affiliate” (accessed March 4, 2016). (See appendix table B.19.) Note: Country-level data for U.S. affiliates of foreign-owned insurance firms are limited and thus are not included.
Outlook Emerging markets will likely remain the drivers of growth in the insurance industry, especially for property and casualty insurance. Swiss Re notes that insurance premium growth tends to track GDP growth at low income and high income levels, but at middle income levels, premiums grow faster than income.218 This will motivate insurers to increase their operations in emerging markets, although in some of these markets insurance penetration may be hampered by other factors, such as economic weakness or political instability. Insurers will also face decisions on whether to enter and operate in such markets through solo entry, partnerships, or acquisitions. Those decisions will be determined by the regulatory landscape, ease of integration, and desirability of established local platforms, among other considerations.
International trade agreements that cover insurance, such as the negotiated but not yet ratified Trans-Pacific Partnership, may create more opportunities for increasing cross-border and affiliate insurance trade.219 International expansion is also being encouraged by regulatory harmonization taking place in other arenas; for example, the ASEAN Insurance Integration Framework intends to liberalize the cross-border supply of marine and transportation 218 Swiss Re, “Insuring the Frontier Markets,” 2016, 3. 219 USITC, Trans-Pacific Partnership Agreement, May 2016, 362.
Japan 35%
United Kingdom 13% Canada 7%
Brazil 6%
Mexico 4%
All other countries 35%
U.S.-owned foreign insurance affiliates Total = $64.8 billion

Chapter 4: Insurance
114 | www.usitc.gov
insurance.220 Further, some countries may open their insurance markets autonomously; the China Insurance Regulatory Commission is encouraging foreign insurers by allowing investors to have ownership stakes in multiple insurance companies, and India recently increased the foreign ownership limit in domestic insurance firms from 26 percent to 49 percent.221
The operations of insurance companies will also be affected by regulatory changes. The EU is introducing the Solvency II insurance regulatory regime, which will establish new capital requirements, review risk management frameworks, and mandate transparency and disclosure. The goal is to improve resilience and efficiency in the industry, but it could alter competitive dynamics; for example, higher capital requirements may discourage U.S. insurance firms from establishing or maintaining affiliates in the EU.222 In emerging markets, regulations that introduce or enforce compulsory insurance, such as motor third-party liability coverage, medical insurance, or unemployment insurance, may boost demand.
Better data analytics (the discovery and interpretation of patterns in data) and predictive modeling techniques may improve risk management. This is especially important for new markets like cybersecurity insurance (see box 4.1) and in contexts where the rate of catastrophes may be changing, such as climate change. Additionally, the availability of large volumes of data may facilitate precise identification of individual risk profiles, which may help insurers to better match risks and market their services to consumers. The temptation for insurance companies is to differentiate individuals with high personal risk and charge them higher prices.223 However, many countries have various antidiscriminatory regulations in place (such as the 1970 Fair Credit Reporting Act and 1964 Civil Rights Act in the United States), but the increasing use of big data analytics could motivate additional privacy and customer protection regulations.224
220 Dezan Shira and Associates, “Understanding Financial Integration in ASEAN,” April 27, 2016. 221 EY, 2015 Global Insurance Outlook, 2015, 13. 222 FitchRatings, “Fitch: Solvency II Could Increase US (Re) Insurer Opportunities,” March 17, 2016. 223 FTC, Big Data, January 2016, i. 224 CEA, Big Data and Differential Pricing, February 2015, 16.

Recent Trends in U.S. Services Trade: 2016 Annual Report
U.S. International Trade Commission | 115
Bibliography American International Group (AIG). “Climate Change: A Call for Weatherproofing the Insurance
Industry,” 2012. http://www.aig.com/content/dam/aig/america-canada/us/documents/business/industry/ipg-real-estate-climate-change-paper-brochure.pdf.
Antolin, Pablo, Sebastian Schich, and Juan Yermo. “The Economic Impact of Protracted Low Interest Rates on Pension Funds and Insurance Companies.” OECD Journal: Financial Market Trends 2011, no. 1 (2011): 1–20. http://www.oecd.org/finance/financial-markets/48537395.pdf.
Bennett, Cory. “SEC Weighs Cybersecurity Disclosure Rules.” The Hill, January 14, 2015. http://thehill.com/policy/cybersecurity/229431-sec-weighs-cybersecurity-disclosure-rules.
Berkshire Hathaway. “2015 Letter to Shareholders,” 2015. http://www.berkshirehathaway.com/letters/2015ltr.pdf.
Book, Hunter. “Farmers Insurance Withdraws Class Action Alleging Failure to Adapt to Climate Change.” Climate Law Blog, Sabin Center for Climate Change Law, June 16, 2014. http://blogs.law.columbia.edu/climatechange/2014/06/16/farmers-insurance-withdraws-class-action-alleging-failure-to-adapt-to-climate-change.
Center for Strategic and International Studies (CSIS). Net Losses: Estimating the Global Cost of Cybercrime, June 2014. http://www.mcafee.com/us/resources/reports/rp-economic-impact-cybercrime2.pdf.
Conley, Janet. “Gathering Storm: Climate Change Prompts Allstate to Scale Back East Coast Coverage.” The Daily Report, September 18, 2007.
Conning. “Life Insurance Industry Investments: The Search for Yield Runs Dry.” Press release, November 2015. https://www.conning.com/pressrelease-detail.aspx?id=13016.
Cookson, Clive. “Climate Change Strongly Linked to UK Flooding.” Financial Times, January 8, 2016. http://www.ft.com/cms/s/0/831d04d4-b5ee-11e5-b147-e5e5bba42e51.html.

Chapter 4: Insurance
116 | www.usitc.gov
Council of Economic Advisors (CEA). Big Data and Differential Pricing, White House: CEA, February 2015. https://www.whitehouse.gov/sites/default/files/docs/Big_Data_Report_Nonembargo_v2.pdf.
Department of Homeland Security (DHS). “Insurance for Cyber-Related Critical Infrastructure Loss: Key Issues.” Insurance Industry Working Session Readout Report, July 2014. https://www.dhs.gov/sites/default/files/publications/July%202014%20Insurance%20Industry%20Working%20Session_1.pdf.
Dezan Shira and Associates. “Understanding Financial Integration in ASEAN.” ASEAN Briefing, April 27, 2016. http://www.aseanbriefing.com/news/2016/04/27/financial-integration-in-asean.html.
EY. 2015 Global Insurance Outlook, 2015. http://www.ey.com/Publication/vwLUAssets/ey-2015-global-insurance-outlook/$FILE/ey-2015-global-insurance-outlook.pdf.
Federal Trade Commission (FTC). Big Data: A Tool for Inclusion or Exclusion? FTC Report, January 2016. https://www.ftc.gov/system/files/documents/reports/big-data-tool-inclusion-or-exclusion-understanding-issues/160106big-data-rpt.pdf.
Finkle, Jim. “Cyber Insurance Premiums Rocket after High-Profile Attacks.” Reuters, October 12, 2015. http://www.reuters.com/article/us-cybersecurity-insurance-insight-idUSKCN0S609M20151012.
FitchRatings. “Fitch: Solvency II Could Increase US (Re)Insurer Opportunities.” Press release, March 17, 2016. https://www.fitchratings.com/site/pressrelease?id=1001071.
GAO, see U.S. Government Accountability Office.
Geneva Association. The Insurance Industry and Climate Change: Contribution to the Global Debate. Geneva: International Association for the Study of Insurance Economics, July 2009. https://www.genevaassociation.org/media/201070/Geneva_report[2].pdf.
Gray, Alistair. “US Life Insurers Shaken by Rock-Bottom Rates.” Financial Times, March 2, 2016. https://next.ft.com/content/c25a41d4-dc9a-11e5-827d-4dfbe0213e07.
Haltom, Renee. “Reaching for Yield.” Econ Focus 17, no. 3 (July 2013): 5–8. https://www.richmondfed.org/~/media/richmondfedorg/publications/research/econ_focus/2013/q3/pdf/federal_reserve.pdf.

Recent Trends in U.S. Services Trade: 2016 Annual Report
U.S. International Trade Commission | 117
Harvard Law Review. “FTC v. Wyndham Worldwide Corp.” Harvard Law Review 129, no. 4 (February 10, 2016): 1120. http://harvardlawreview.org/2016/02/ftc-v-wyndham-worldwide-corp/.
Hyuga, Takahiko. “Japan Post Shares Surge 29 Percent in the Biggest IPO of 2015.” Bloomberg, November 3, 2015. http://www.bloomberg.com/news/articles/2015-11-04/japan-post-poised-to-jump-on-debut-after-year-s-biggest-ipo.
Insurance Information Institute. “Climate Change: Insurance Issues,” September 2014. http://www.iii.org/issue-update/climate-change-insurance-issues.
———. “Climate Change: Insurance Issues.” September 2014. http://www.iii.org/issue-update/climate-change-insurance-issues
———. International Insurance Fact Book 2012. New York: III, 2012. http://www.iii.org/sites/default/files/docs/pdf/International_Insurance_Factbook_20121.pdf.
———. International Insurance Fact Book 2013. New York: III, 2013. http://www.iii.org/sites/default/files/docs/pdf/International_Insurance_Factbook_2013.pdf.
———. “Top 10 Countries by Life and Nonlife Direct Premiums Written, 2014,” 2014. http://www.iii.org/publications/insurance-handbook/economic-and-financial-data/world-insurance-marketplace.
Insurance Information Institute. “Top 10 Global Insurance Companies by Revenues, 2014,” 2014. http://www.iii.org/publications/international-insurance-fact-book-2016/world-rankings.
Insurance Journal. “Allstate Adds Maryland Coast to Its ‘No New Business’ List.” December 22, 2006. http://www.insurancejournal.com/news/east/2006/12/22/75390.htm.
Intergovernmental Panel on Climate Change (IPCC). Climate Change 2001: Impacts, Adaptation, and Vulnerability. Cambridge University Press, 2001. http://www.ipcc.ch/ipccreports/tar/wg2/index.php?idp=674.
Lloyd’s of London. Coastal Communities and Climate Change: Maintaining Future Insurability, 2008. https://www.lloyds.com/~/media/lloyds/reports/360/360%20climate%20reports/360_coastalcommunitiesandclimatechange.pdf.

Chapter 4: Insurance
118 | www.usitc.gov
Karlan, Dean, Robert Osei, Isaac Osei-Akoto, and Christopher Udry. “Agricultural Decisions After Relaxing Credit and Risk Constraints,” December 2013. http://www.econ.yale.edu/~cru2/pdf/eui.pdf.
Kirkpatrick, Keith. “Cyber Policies on the Rise.” Communications of the ACM 58, no. 10 (October 2015): 21–23. http://cacm.acm.org/magazines/2015/10/192376-cyber-policies-on-the-rise/fulltext.
Kousky, Carolyn, and Roger M. Cooke. “Climate Change and Risk Management: Challenges for Insurance, Adaptation, and Loss Estimation.” Resources for the Future. RFF DP 09-03, February 2009. http://www.rff.org/files/sharepoint/WorkImages/Download/RFF-DP-09-03.pdf.
Linnerooth-Bayer, Joanne, and Reinhard Mechler. “Insurance for Assisting Adaptation to Climate Change in Developing Countries: A Proposed Strategy.” Climate Policy 6 (December 2005). https://www.researchgate.net/profile/Reinhard_Mechler/publication/233651879_Insurance_for_Assisting_Adaptation_to_Climate_Change_in_Developing_Countries_A_Proposed_Strategy/links/00b49530a44c09ccf4000000.pdf.
Mackenzie, Kate. “Buffett's Climate Certainty.” Financial Times, March 7, 2016. http://ftalphaville.ft.com/2016/03/07/2155503/guest-post-buffetts-climate-certainty/.
McCann, David. “Hot Topic: Climate Change and Insurance.” CFO, March 23, 2016. http://ww2.cfo.com/risk-management/2016/03/hot-topic-climate-change-insurance/.
McNamara, Dylan, Sathya Gopalakrishnan, Martin Smith, and A. Brad Murray. “Climate Adaptation and Policy-Induced Inflation of Coastal Property Value.” Public Library of Science 10, no. 3 (March 25, 2015). http://journals.plos.org/plosone/article?id=10.1371/journal.pone.0121278.
Mills, Evan. “Responding to Climate Change: The Insurance Industry Perspective.” Lawrence Berkeley National Laboratory, 2007. http://evanmills.lbl.gov/pubs/pdf/climate-action-insurance.pdf.
Munich Re. “Climate Change.” https://www.munichre.com/en/group/focus/climate-change/index.html (accessed October 6, 2016).
National Academies Press. Attribution of Extreme Weather Events in the Context of Climate Change. Washington, DC: NAS, 2016. http://www.nap.edu/catalog/21852/attribution-of-extreme-weather-events-in-the-context-of-climate-change.

Recent Trends in U.S. Services Trade: 2016 Annual Report
U.S. International Trade Commission | 119
National Association of Insurance Commissioners (NAIC) and the Center for Insurance Policy Research. “Low Interest Rates,” February 2016. http://www.naic.org/cipr_topics/topic_low_interest_rates.htm.
———. State of the Life Insurance Industry: Implication of Industry Trends. Kansas City: NAIC, August 2013. http://www.naic.org/documents/cipr_home_130823_implications_industry_trends_final.pdf.
Organisation for Economic Co-operation and Development (OECD). Global Insurance Market Trends 2015, 2016. http://www.oecd.org/daf/fin/insurance/Global-Insurance-Market-Trends-2015.pdf.
———. OECD.Stat. Insurance Indicators. http://stats.oecd.org (accessed May 9, 2016).
Ponemon Institute. 2015 Cost of Data Breach Study: Global Analysis, May 2015. https://nhlearningsolutions.com/Portals/0/Documents/2015-Cost-of-Data-Breach-Study.pdf.
PricewaterhouseCoopers (PwC). Insurance 2020 and Beyond: Reaping the Dividends of Cyber Resilience, 2015. https://www.pwc.com/gx/en/insurance/publications/assets/reaping-dividends-cyber-resilience.pdf.
Property Casualty Insurers Association of America. “True Market-Risk Rates for Flood Insurance.” PCI White Paper, June 2011. https://www.pciaa.net/pciwebsite/common/page/attachment/13821.
PWC and Info Security Europe. 2015 Information Security Breaches Survey. Commissioned by U.K. Department for Business, Innovation, and Skills, 2015. https://www.gov.uk/government/uploads/system/uploads/attachment_data/file/432412/bis-15-302-information_security_breaches_survey_2015-full-report.pdf.
Risk-Based Security. “2015 Reported Data Breaches Surpasses All Previous Years,” February 2, 2016. https://www.riskbasedsecurity.com/2016/02/2015-reported-data-breaches-surpasses-all-previous-years/.
Risky Business. Come Heat and High Water: Climate Risk in the Southeastern U.S. and Texas. Risky Business Project, July 2015. http://riskybusiness.org/site/assets/uploads/2015/09/Climate-Risk-in-Southeast-and-Texas.pdf.

Chapter 4: Insurance
120 | www.usitc.gov
Scism, Leslie. “Low Rates Are Tormenting Insurers—And Their Customers.” Wall Street Journal, March 20, 2016.
SmarterSafer. Bracing for the Storm: How to Reform U.S. Disaster Policy to Prepare for a Riskier Future, April 2015. http://www.smartersafer.org/wp-content/uploads/Bracing-for-the-Storm.pdf.
Standard and Poor’s (S&P). “Climate Change Could Sting Reinsurers That Underestimate Its Impact,” September 3, 2014. https://www.globalcreditportal.com/ratingsdirect/renderArticle.do?articleId=1356905&SctArtId=260148&from=CM&nsl_code=LIME&sourceObjectId=8706036&sourceRevId=1&fee_ind=N&exp_date=20240902-15:44:53.
Swiss Re. “Insuring the Frontier Markets.” Sigma 2016, no. 2 (2016). http://media.swissre.com/documents/sigma2_2016_en.pdf.
———. “Stronger Advanced Markets' Performance Boosts Insurance Industry Growth in 2014, Swiss Re Sigma Says.” News release, June 24, 2015. http://www.swissre.com/media/news_releases/Stronger_advanced_markets_performance_boosts_insurance_industry_growth_in_2014.html.
———. “Underinsurance of Property Risks: Closing the Gap.” Sigma 2015, no. 5 (2015). http://media.swissre.com/documents/sigma5_2015_en.pdf.
United Nations Framework Convention on Climate Change (UNFCCC). “G7 Climate Risk Insurance Initiative: Stepping Up Protection for the Most Vulnerable.” http://newsroom.unfccc.int/lpaa/resilience/g7-climate-risk-insurance-initiative-stepping-up-protection-for-the-most-vulnerable/ (accessed October 6, 2016).
U.S. Department of Commerce (USDOC). Bureau of Economic Activity (BEA). Table 2.1., “U.S. Trade in Services, by Type of Service.” Interactive tables: International Data, International Services. http://bea.gov/iTable/iTable.cfm?ReqID=62&step=1#reqid=62&step=6&isuri=1&6221=1,26,27,28,29,30,69,94,95,96,97,98&6220=1,2,3,4,5,6&6210=4&6200=160&6224=&6211=167&6223=&6222=&6230=1 (accessed March 4, 2016).
———. Bureau of Economic Activity (BEA). Interactive Data, International Data, International Transactions. http://bea.gov/iTable/iTable.cfm?ReqID=62&step=1#reqid=62&step=2&isuri=1&6210=1 (accessed June 6, 2016).

Recent Trends in U.S. Services Trade: 2016 Annual Report
U.S. International Trade Commission | 121
———. Bureau of Economic Activity (BEA). Survey of Current Business 88, no. 10 (October 2008).
U.S. Department of Treasury (U.S. Treasury). Federal Insurance Office (FIO). Annual Report on the Insurance Industry, June 2013. https://www.treasury.gov/initiatives/fio/reports-and-notices/Documents/FIO%20Annual%20Report%202013.pdf.
———. Federal Insurance Office (FIO). Annual Report on the Insurance Industry, September 2015. https://www.treasury.gov/initiatives/fio/reports-and-notices/Documents/2015%20FIO%20Annual%20Report_Final.pdf.
U.S. Government Accountability Office (GAO). Climate Change: Better Management of Exposure to Potential Future Losses Is Needed for Federal Flood and Crop Insurance, October 2014. http://www.gao.gov/assets/670/666698.pdf.
———. Natural Catastrophe Insurance Coverage Remains a Challenge for State Programs. House Committee on Financial Services, Minority staff, GAO 10-568R, April 16, 2010. http://www.gao.gov/assets/310/304457.pdf.
U.S. International Trade Commission (USITC). Property and Casualty Insurance Services: Competitive Conditions in Foreign Markets. USITC Publication 4068. Washington, DC: USITC, March 2009.
———. Trans-Pacific Partnership Agreement: Likely Impact on the U.S. Economy and on Specific Industry Sectors. USITC Publication 4607. Washington, DC: USITC, May 2016. https://www.usitc.gov/publications/332/pub4607.pdf.
Veracode and New York Stock Exchange (NYSE). “Cybersecurity and Corporate Liability in the Boardroom,” November 5, 2015. https://info.veracode.com/whitepaper-nyse-cybersecurity-and-corporate-liability-in-the-boardroom.html.
Weitzman, Martin. “Fat-Tailed Uncertainty in the Economics of Catastrophic Climate Change.” Review of Environmental Economics and Policy 5, no. 2 (2011): 275–92. http://scholar.harvard.edu/files/weitzman/files/fattaileduncertaintyeconomics.pdf.
Wolf, Martin. “Negative Rates Are Not the Fault of Central Banks.” Financial Times, April 12, 2016. https://next.ft.com/content/9b1d8b04-0007-11e6-ac98-3c15a1aa2e62.

122 | www.usitc.gov

U.S. International Trade Commission | 123
Chapter 5 Securities Services Summary The United States remained the world’s largest securities services market in 2014; it accounted for 52 percent of total stocks traded worldwide and 46 percent of global investment banking revenues. Six of the top 10 investment banks are headquartered in the United States. U.S. affiliate trade in securities services continues to exceed U.S. cross-border trade in securities services, and the United States runs a sizable trade surplus in both types of trade ($28 billion and $40 billion, respectively).
As in recent years, the securities industry will continue to be shaped by new regulations and by evolving demands for financial assets. Securities services firms are currently exploring a new ledger-keeping technology called blockchains and navigating China’s emerging financial market.
Introduction Securities are financial instruments, such as company stocks and government bonds, that are bought and sold on capital markets, thereby transferring capital from savers to users. Many services are used to manage and trade securities, including debt and equity underwriting services, financial advisory services, dealing and brokerage, proprietary trading, and asset management services.
Securities services are provided by intermediaries between issuers (companies, governments, and state-owned enterprises) and investors (both individuals and institutional investors, such as mutual funds, pension funds, and insurance companies). The major providers of these services are large global investment banks, such as J.P. Morgan and Goldman Sachs, which broker securities transactions and help companies raise capital (e.g., by taking on the risks of equity or debt issuance, locating investors, and arranging mergers and acquisitions). These are joined by asset managers who help individuals and institutions invest their savings over particular time horizons. Many securities services firms are part of larger “universal banks” that also provide commercial and retail banking services, such as Citigroup and Bank of America Merrill Lynch.
The activities of securities services firms have changed since the 2008–09 financial crisis led to increased regulation of the industry. Firms are now required to hold more capital and be more rigorous and transparent in risk management, while firms designated as “systemically important financial institutions” are subject to especially strict oversight. Some activities are
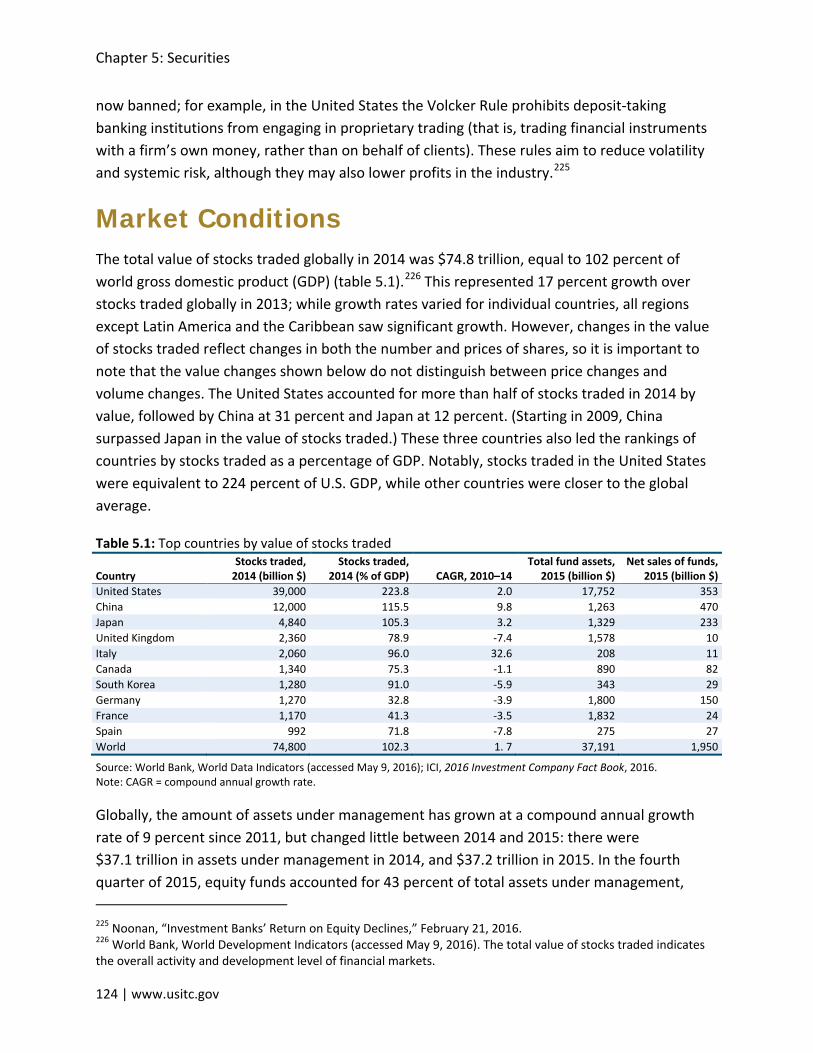
Chapter 5: Securities
124 | www.usitc.gov
now banned; for example, in the United States the Volcker Rule prohibits deposit-taking banking institutions from engaging in proprietary trading (that is, trading financial instruments with a firm’s own money, rather than on behalf of clients). These rules aim to reduce volatility and systemic risk, although they may also lower profits in the industry.225
Market Conditions The total value of stocks traded globally in 2014 was $74.8 trillion, equal to 102 percent of world gross domestic product (GDP) (table 5.1).226 This represented 17 percent growth over stocks traded globally in 2013; while growth rates varied for individual countries, all regions except Latin America and the Caribbean saw significant growth. However, changes in the value of stocks traded reflect changes in both the number and prices of shares, so it is important to note that the value changes shown below do not distinguish between price changes and volume changes. The United States accounted for more than half of stocks traded in 2014 by value, followed by China at 31 percent and Japan at 12 percent. (Starting in 2009, China surpassed Japan in the value of stocks traded.) These three countries also led the rankings of countries by stocks traded as a percentage of GDP. Notably, stocks traded in the United States were equivalent to 224 percent of U.S. GDP, while other countries were closer to the global average.
Table 5.1: Top countries by value of stocks traded
Country Stocks traded,
2014 (billion $) Stocks traded,
2014 (% of GDP) CAGR, 2010–14 Total fund assets,
2015 (billion $) Net sales of funds,
2015 (billion $) United States 39,000 223.8 2.0 17,752 353 China 12,000 115.5 9.8 1,263 470 Japan 4,840 105.3 3.2 1,329 233 United Kingdom 2,360 78.9 -7.4 1,578 10 Italy 2,060 96.0 32.6 208 11 Canada 1,340 75.3 -1.1 890 82 South Korea 1,280 91.0 -5.9 343 29 Germany 1,270 32.8 -3.9 1,800 150 France 1,170 41.3 -3.5 1,832 24 Spain 992 71.8 -7.8 275 27 World 74,800 102.3 1. 7 37,191 1,950
Source: World Bank, World Data Indicators (accessed May 9, 2016); ICI, 2016 Investment Company Fact Book, 2016. Note: CAGR = compound annual growth rate.
Globally, the amount of assets under management has grown at a compound annual growth rate of 9 percent since 2011, but changed little between 2014 and 2015: there were $37.1 trillion in assets under management in 2014, and $37.2 trillion in 2015. In the fourth quarter of 2015, equity funds accounted for 43 percent of total assets under management,
225 Noonan, “Investment Banks’ Return on Equity Declines,” February 21, 2016. 226 World Bank, World Development Indicators (accessed May 9, 2016). The total value of stocks traded indicates the overall activity and development level of financial markets.

Recent Trends in U.S. Services Trade: 2016 Annual Report
U.S. International Trade Commission | 125
while bond funds, mixed funds, and money market funds accounted for 21 percent, 14 percent, and 14 percent, respectively.227 The United States held nearly half of these assets, mostly in the form of equity funds ($9.9 trillion) and bond funds ($3.8 trillion). While the countries with the most assets under management are largely identical to the countries with the most stocks traded, Luxembourg and Ireland are also significant asset markets, partly due to their tax and regulatory environments; they held 10 percent and 6 percent of global assets, respectively.228 Globally, net sales of funds reached $2.0 trillion in 2015, a 9 percent increase over 2014. China had the highest net sales, at $470 billion, followed by the United States at $353 billion.229
Global investment banking revenues grew by 6 percent in 2014 to $81.6 billion, led by high growth in the European Union (EU) and BRIC markets, although revenues were still short of their 2007 peak of $89.8 billion (figure 5.1).230 The five largest investment banks (J.P. Morgan, Goldman Sachs, Bank of America Merrill Lynch, Morgan Stanley, and Citi) are all based in the United States, but have significant operations around the world; each holds between 5 percent and 7 percent of global market share (table 5.2).231 The top 10 investment banks together have nearly half of the total market share, and the list of the largest investment banks is unchanged from previous years. Many of these investment banks have faced steep fines recently: since 2015, J.P. Morgan has agreed to pay $300 million to settle allegations about conflicts of interest;232 Bank of America has agreed to pay $180 million to settle a lawsuit about manipulating foreign exchange rates;233 and Goldman Sachs has agreed to a civil settlement of $5 billion to resolve claims regarding sales of mortgage securities.234 However, these settlements have not altered the market position of these large investment banks.
227 ICI, “Worldwide Regulated Open-End Fund Assets and Flows,” March 22, 2016. 228 Luxembourg and Ireland do not tax the income or capital gains of mutual funds organized under the EU’s Undertakings for Collective Investment in Transferable Securities Directive, except for Luxembourg’s annual “taxe d’abonnement” (subscription tax). Carne, UCITS Guide for Investment Managers, August 2014, 16. 229 Net sales are calculated as total sales minus total redemptions, plus net exchanges (i.e., shareholders transferring money between different funds). 230 SIFMA, 2015 Factbook, 2015, 74. BRIC = Brazil, Russia, India, and China. 231 Thomson Reuters, “Global Investment Banking Review,” 2015. 232 Robinson and Weinberg, “J.P. Morgan Admits It Didn’t Tell Clients,” December 18, 2015. 233 Schoen, “Seven Years On from Crisis,” April 30, 2015. 234 Goldstein, “Goldman to Pay up to $5 Billion,” January 14, 2016.

Chapter 5: Securities
126 | www.usitc.gov
Figure 5.1: Securities services: Global investment banking revenues grew in 2014 but are still below their 2007 peak
Source: SIFMA, 2015 Factbook, 2015, 74. (See appendix table B.20.)
Table 5.2: Top investment banks by fees, 2015
Firm Country 2015 fees (billion $)
Growth %, 2014–15 Market share %
J.P. Morgan United States 6.0 -5.6 6.9 Goldman Sachs United States 5.9 6.4 6.8 Bank of America Merrill Lynch United States 5.4 -2.6 6.2 Morgan Stanley United States 5.0 -4.9 5.8 Citi United States 4.2 -6.8 4.8 Deutsche Bank Germany 3.4 -18.3 4.0 Credit Suisse Switzerland 3.3 -11.8 3.8 Barclays UK 3.3 -11.4 3.8 Wells Fargo & Co United States 2.1 -9.5 2.5 UBS Switzerland 1.9 -12.0 2.2
Source: Thomson Reuters, “Global Investment Banking Review,” 2015.
Emerging Supply and Demand Factors Three key developments in the global securities industry are new technologies, emerging markets, and international negotiations. The following sections discuss the ongoing impact of blockchains and the growth in China’s securities industry.
Blockchains Blockchains are a new ledger-keeping technology that can help address an enduring problem in digital financial transactions, that of “double-spending.” Physical money is rivalrous, meaning that it cannot be in two places at once: if a buyer hands a $20 bill to a seller, that bill has passed
0
10
20
30
40
50
60
70
80
90
100
2005 2006 2007 2008 2009 2010 2011 2012 2013 2014
Billi
on $
Other
BRICs (Brazil, Russia, India,China)Japan
European Union (ex.United Kingdom)United Kingdom
United States

Recent Trends in U.S. Services Trade: 2016 Annual Report
U.S. International Trade Commission | 127
from the possession of one person to another. In contrast, a digital record of money in an online account is pure information, and is easily manipulated or reproduced. Digital transactions involve the transfer of a record from a buyer to a seller, but there are no physical limits on how many times, or to how many merchants, that record can be transferred. A functioning digital financial system requires a trustworthy record of how money is spent, to ensure that money used in one transaction has not already been used somewhere else. This is usually accomplished by centralized record keepers. For example, individuals and businesses rely on their banks to maintain accurate records of their holdings and transactions. But reliance on a single entity creates risks that they may be deliberately untruthful, hacked, or manipulated.
Blockchains can mitigate these risks. They are decentralized databases that record valid, time-stamped financial transactions, allowing users to quickly make and verify transactions without a central authority. Blockchains give each user in the currency system a partial copy of the entire chain, which makes it difficult for a malicious actor to tamper with it. While a centralized ledger can be hacked at a single point, a distributed ledger is held by multiple nodes (or participants), making it resistant to manipulation. Consequently, blockchain records are nearly immutable. This may limit risk and improve productivity in the financial services industry.235
Blockchains were pioneered by the developers of bitcoin, a decentralized, open-source digital currency first released in January 2009. In bitcoin’s blockchain, every 10 minutes all bitcoin transactions are recorded as a “block,” with a consensus identifier (or “proof of work”) that is then linked to all previous blocks in the chain. The blockchain is updated with a new transaction only if more than half of all users agree that that transaction has taken place.236 Public keys (i.e., pieces of information that help encrypt and decrypt algorithms) allow the buyer and the seller to identify the money transfer.
While blockchains originated with the development of bitcoin, they are a distinct technology with applications beyond digital currencies. For example, one promising aspect of blockchains is that they may reduce accounting and compliance costs. Currently, settling trades is expensive and time-consuming: it is not fully automated, and financial firms often hold capital against transactions. By one estimate, blockchains could reduce up to 30 percent of annual back-office costs by 2021, including trade clearance and settlement, custody, books and records, and reconciliation costs.237 Last year these costs totaled an estimated $54 billion globally.
235 Norton Rose Fulbright, “Financial Institutions and Blockchain Technology,” March 2016. 236 In theory a malicious user could gain control of 51 percent of the network’s computational power and manipulate the blockchain, although they would not be able to alter historical transactions. Developers and regulators are aware of the “51 percent attack” problem and are working on safeguards. 237 Crowe, “What Is Blockchain?” March 5, 2016.

Chapter 5: Securities
128 | www.usitc.gov
These potential savings are driving investment in blockchains. Goldman Sachs, Citi, and J.P. Morgan are funding Digital Asset Holdings, a blockchain startup, in an effort to develop common standards and protocols.238 The New York Stock Exchange has invested in Coinbase, a digital asset exchange company, and NASDAQ is using technology from the blockchain infrastructure provider Chain for its private share-trading market.239 New firms like Symbiont are exploring the use of “smart contracts,” or logical executions whereby blockchain transactions automatically trigger the execution of a contract, to underpin securities transactions.240
Investments in blockchain technology are primarily happening in countries like the United States with large and sophisticated securities markets. If blockchains successfully reduce accounting and compliance costs, this will add to the competitive advantages enjoyed by financial firms in such countries. However, blockchains also have the potential to lower costs and fees in countries with underdeveloped financial services infrastructures. Some advocates note that the blockchain-based bitcoin system could facilitate low-cost remittances and provide decentralized global bank accounts to otherwise excluded individuals.241
Fundamentally, blockchains attempt to provide trustworthy records, which have applications beyond finance. For example, Honduras recently announced a plan to develop a blockchain-based land registry,242 and this year Estonia decided to secure its health records with blockchain technology.243 The technology is still young and will need further development (as well as approval by regulators), but could ultimately have a significant impact on global trade in securities services.
China’s Growing Securities Market In recent years China’s financial sector has been in a state of flux. The Shanghai Composite, the world’s fifth-largest stock market by market capitalization, has experienced extraordinary volatility: it rose by 250 percent from 2013 to 2015, but then fell by 30 percent between June 2015 and July 2015, a correction equal to nearly $4 trillion (including a one-day drop of nearly $700 billion).244 This volatility corresponded with an influx of inexperienced investors, who were seeking returns in the stock market in response to a slowdown in both economic
238 Stafford, “Blockchain Initiative Backed by 9 Large Investment Banks,” September 15, 2015. 239 Stafford and Bullock, “Nasdaq to Step Up Blockchain Trials,” May 26, 2015. 240 Rizzo, “Why Symbiont Believes Blockchain Securities,” August 25, 2015. 241 Scott, “How Can Cryptocurrency and Blockchain Technology Play a Role?” February, 2016. 242 Chavez-Dreyfuss, “Honduras to Build Land Title Registry,” May 15, 2015. 243 Allison, “Guardtime Secures over a Million Estonian Healthcare Records,” March 3, 2016. 244 Noble, “Why Are China’s Stock Markets So Volatile?” July 2, 2015.

Recent Trends in U.S. Services Trade: 2016 Annual Report
U.S. International Trade Commission | 129
growth and real estate appreciation.245 It also correlated with growth in margin lending, or stock market investment using borrowed money. The state-controlled China Securities Finance Corporation, which lends money to securities brokerages that in turn support margin lending, helped push margin loans to a peak of 14 percent of China’s stock market, compared to 6 percent in the United States.246
However, trades in any direction are a revenue source, so these stock market losses weren’t correlated with revenue losses in China’s securities industry. Many securities firms earn a significant portion of their income from brokerage fees; by one estimate, brokerage services accounted for 42 percent of the 2014 revenue of securities firms in China.247 Transaction volumes in China have grown rapidly: in 2015, bond issuance increased by 62 percent,248 while turnover in the stock markets exceeded the value of shares traded in the United States.249 Largely due to these high transaction volumes, revenue in China’s securities industry rose to an estimated $45 billion in 2015, a 154 percent increase over 2014.250
China’s financial market is still small relative to its economy: the value of shares available for trading is equivalent to 25 to 35 percent of the country’s GDP, compared to 150 percent in the United States.251 Additionally, there are still inefficiencies and opacities in the emerging market that present opportunities for financial analysts and firms using quantitative trading strategies.252 These factors, combined with ongoing structural reforms and inexpensive valuations, make many investors bullish on China’s financial sector.253
They also make China attractive to foreign securities firms. Opportunities for foreign securities firms in China have expanded in recent years as China has liberalized its financial sector. The country’s World Trade Organization (WTO) accession boosted inflows of foreign capital and introduced new financial services for Chinese consumers.254 China has limited the pace of liberalization—for example, by restricting foreign ownership in joint-venture securities firms (currently the ceiling is 49 percent). But it has also established a Qualified Foreign Institutional Investor (QFII) program which allows certain foreign institutional investors to buy a set amount of renminbi-denominated shares in the Shanghai and Shenzhen stock exchanges. As of October 245 By one estimate, over 60 percent of Chinese investors lack a high school diploma. Das, “China’s Stock Market Crash: Part 2,” November 18, 2015. 246 Das, “China’s Stock Market Crash: Part 2,” November 18, 2015. 247 KPMG, “Mainland China Securities Survey 2015,” October 2015, 6. 248 Economist, “Risky Returns,” May 7, 2016. 249 Kim, “Chinese Stock Market Turnover Surges to Record,” May 28, 2015. 250 IBISWorld, “Securities Brokerage and Transaction Services in China,” December 2015, 5. 251 Das, “China’s Stock Market Crash: Part 1,” November 11, 2015. 252 Economist, “Risky Returns,” May 7, 2016. 253 Nishizawa, “Goldman Sachs Still Bullish on China Stocks,” September 2, 2015. 254 At the same time, domestic banks lost both rich clients and senior executives to foreign firms. Stichele, Critical Issues in the Financial Sector, March 2004.

Chapter 5: Securities
130 | www.usitc.gov
2015, a QFII quota of $79 billion had been granted to 277 foreign institutions, including such U.S. firms as J.P. Morgan Chase, Matthews International Capital Management, and Oppenheimer Funds.255
China’s financial markets are controlled by the state in a way that few other financial markets are.256 After the mid-2015 collapse, the Chinese government made it an official policy to boost stock prices. Regulators heavily restricted short selling of stocks, barred major shareholders from selling shares for six months, and launched investigations into alleged short sellers, while the state-controlled Securities Association of China coordinated the purchase of shares by large brokerage firms.257 In response to recent capital flight—an estimated $1 trillion flowed out of the country in 2015—China has limited the channels through which renminbi can leave, including suspending outbound investment programs that allowed Chinese investors to buy foreign securities.258 Additionally, requirements that foreign technology companies give source code and encryption keys to the China Banking and Regulatory Commission may make it difficult for foreign financial firms to operate in the country.259 These interventions and other factors have sown ambivalence among some foreign investors. For example, Hong Kong-based China Merchants Securities (CMS) Asset Management (H.K.) Co. Ltd. and the Swedish financial group Skandinaviska Enskilda Banken both reduced their demand for Chinese securities in early 2016.260
In the years ahead, China will likely allow more competition in the industry. In 2010 it let large securities firms offer margin trading,261 and in 2015 it permitted investors to open multiple accounts without closing existing accounts, which made it cheaper for customers to transfer accounts between firms.262 The 2015 Administrative Measures on Issuance and Trading of Corporate Bonds, a set of rules adopted by the China Securities Regulatory Commission, allowed corporate bonds to be issued and traded through more channels.263 And the country will likely permit derivatives and other financial products to be traded on securities exchanges.264 Evidence for increased competition is suggested by the fact that the average brokerage fee for securities firms fell by 13 percent from 2013 to 2014, at the same time as
255 Prasad, “China’s Economy and Financial Markets,” April 27, 2016. 256 Noble, “Why Are China’s Stock Markets So Volatile?” July 2, 2015. 257 Das, “China’s Stock Market Crash: Part 2,” November 18, 2015. 258 Weinland, “China Halts Overseas Investment Scheme,” February 28, 2016. 259 As of 2015 those regulations have been temporarily suspended. USCIB, “Business Urges China to Halt,” April 15, 2015. 260 Weinland, Sender, and Wildau, “Foreign Funds Cut Quotas in China Investment Scheme,” February 3, 2016. 261 IBISWorld, Securities Brokerage and Transaction Services in China, December 2015, 5. 262 KPMG, Mainland China Securities Survey 2015, October 2015, 38. 263 Ibid. 264 IBISWorld, Securities Brokerage and Transaction Services in China, December 2015, 6.

Recent Trends in U.S. Services Trade: 2016 Annual Report
U.S. International Trade Commission | 131
industry revenue increased by 34 percent.265 These reforms may help address distortions in the incentives and governance structures of China’s financial markets, but the timing and sequencing will determine whether lenders and investors face a hard landing.266
Trade Trends
Cross-border Trade The United States consistently runs a large cross-border trade surplus in securities services. In 2015, the United States exported $28.2 billion of securities services, which included $11.8 billion of brokerage and underwriting services and $16.4 billion of securities lending and electronic funds transfer services (figure 5.2).267 The United States imported $7.2 billion of securities services, comprising $4.4 billion of brokerage and underwriting services and $2.8 billion of lending and electronic funds transfer services. The cross-border trade surplus in 2015 was $20.9 billion.
Figure 5.2: Securities services: U.S. cross-border trade in securities services resulted in a U.S. trade surplus each year during 2010–15
Source: USDOC, BEA, table 3.1, “U.S. International Trade in Services” (accessed June 6, 2016). (See appendix table B.21.)
265 Ibid. 266 Mitchell and McGee, “World Bank Warns China to Reform,” July 1, 2015. 267 Brokerage services execute orders to purchase or sell equity securities. Underwriting services buy and resell newly issued securities. Securities lending services arrange loan terms and conditions, monitor collateral, and provide guarantees against default. Electronic funds transfer services electronically transfer money or financial assets received directly from, or paid directly to, foreign persons.
0
5
10
15
20
25
30
35
40
2010 2011 2012 2013 2014 2015
Billi
on $
Exports Imports
2015 trade surplus: $20.9 billion

Chapter 5: Securities
132 | www.usitc.gov
Securities services exports declined by 6 percent between 2014 and 2015, remaining well below their 2011 peak of $36.3 billion. Exports of lending and electronic funds transfer services have increased steadily over time, with an annual growth rate of 5 percent during 2010–14, suggesting the growing use of electronic payment technology and e-commerce. However, exports of brokerage and underwriting services have decreased by 10 percent annually during 2010–14. Imports of securities services have also stagnated. Between 2014 and 2015 they grew by less than 1 percent, leaving total imports at about two-thirds of their 2007 levels. Brokerage and underwriting imports had a steady 2010–14 growth rate of 4 percent annually, but lending and electronic funds transfer imports decreased by 7 percent annually during the same period. Overall, revenues in the U.S. securities industry declined by $95 billion between 2007 and 2015.268
This stagnation, however, is not due to slowing trade in securities themselves. In 2014, foreign holdings of U.S. securities reached an all-time high of $16.4 trillion, while U.S. holdings of foreign securities reached an all-time high of $9.6 trillion.269 Annual 2009–13 growth was strong at just under 11 percent for foreign holdings of U.S. securities and just over 11 percent for U.S. holdings of foreign securities. In the past, international trade in securities services tended to move in parallel with cross-border purchases of securities, reflecting the intermediary role of financial firms that facilitate sales. However, more securities are being moved across borders with less cross-border activity by brokerage firms.
Securities and securities services are mostly traded between countries with well-established financial centers and large markets, such as the United States, the UK, and Japan. Some small countries also figure prominently, such as the Cayman Islands, Bermuda, and Luxembourg, because they play a custodial role for third-country purchases of U.S. securities due to their friendly tax and regulatory regimes. For example, if a German investor purchases a U.S. security and places it in the custody of a bank in the Cayman Islands, it would be recorded as a U.S. security held by the Cayman Islands.270 The foreign countries that held the most U.S. securities in 2014 were Japan, China, and the Cayman Islands, while the United States held the most foreign securities from the UK, the Cayman Islands, and Canada.271
268 Hoffman, Investment Banking and Securities Dealing in the U.S., November 2015, 39. 269 U.S. Treasury, Annual Cross-U.S. Border Portfolio Holdings (accessed March 31, 2016). 270 U.S. Treasury, “Frequently Asked Questions Regarding the TIC System” (accessed March 31, 2016). 271 U.S. Treasury, Treasury International Capital System (accessed March 31, 2016).

Recent Trends in U.S. Services Trade: 2016 Annual Report
U.S. International Trade Commission | 133
Affiliate Transactions Securities services are traded at much larger volumes through affiliates than through cross-border trade. In 2013, foreign affiliates of U.S. firms sold $102 billion of securities services abroad, while purchases from U.S. affiliates of foreign firms totaled $62 billion (figure 5.3). Compared to 2012, this represents 3 percent growth in exports by U.S. affiliates abroad and 16 percent growth in imports from U.S. affiliates of foreign firms. While sales by foreign affiliates of U.S. firms have not yet climbed back to their 2010 peak of $128 billion, the 2013 purchases from U.S. affiliates of foreign firms represented an all-time high.
Figure 5.3: Securities services: Services supplied by foreign affiliates of U.S.-owned firms, and services purchased from U.S. affiliates of foreign-owned firms, both increased slightly in 2013
Source: USDOC, BEA, table 3.1, “Services Supplied to Foreign Persons by U.S.MNEs through Their MOFAs, by Industry of Affiliate and by Country of Affiliate,” and table 4.1, “Services Supplied to U.S. Persons by Foreign MNEs through Their MOUSA, by Industry of Affiliate and by Country of UBO” (both accessed April 28, 2016). (See appendix table B.22.)
The UK bought the most securities services from foreign affiliates of U.S. firms in 2013, accounting for $29 billion (or 29 percent) of U.S. exports (figure 5.4); these sales accounted for more than half of total sales to Europe. Canada and Japan were also significant markets, accounting for 6 percent and 5 percent of affiliate sales, respectively. Sales in the UK were robust, but were still down by $11 billion compared to 2009, and the UK’s share of U.S. exports fell from 35 percent in 2009 to 29 percent in 2013. During the same period, the Asia-Pacific region’s share of affiliate sales grew from 23 percent to 27 percent.
It is not clear which countries account for the largest shares of U.S. affiliate purchases of securities services, as the BEA does not currently report country-specific data on purchases of non-banking financial services from U.S. affiliates of foreign firms.
0
20
40
60
80
100
120
140
2009 2010 2011 2012 2013
Billi
on $
U.S.-owned foreign affiliates Foreign-owned U.S. affiliates

Chapter 5: Securities
134 | www.usitc.gov
Figure 5.4: Securities services: The United Kingdom was the largest market for securities services supplied by U.S.-owned foreign affiliates in 2013
Source: USDOC, BEA, table 3.1, “Services Supplied to Foreign Persons by U.S. NMEs through Their MOFAs, by Industry of Affiliate and by Country of Affiliate” (accessed March 4, 2016). (See appendix table B.23.) Note: Country-level data for foreign-owned U.S affiliates of banking firms are limited and thus are not included.
Box 5.1: Understanding Data on Cross-border Trade and Affiliate Transactions in Securities Services
The Bureau of Economic Analysis (BEA) at the U.S. Department of Commerce tracks cross-border trade in total financial services on a country-by-country basis. The BEA also breaks financial services down into the following subcategories, which are recorded at the level of total exports and total imports (i.e., not country by country):
• Brokerage
• Underwriting and private placement
• Credit card and other credit-related
• Financial management
• Financial advisory and custody
• Securities lending, electronic funds transfer, and other
These services do not divide cleanly into “banking” and “securities” services, but the USITC characterizes brokerage, underwriting, securities lending, and electronic funds transfer as securities services, while financial management, advisory, and credit card and credit-related services are characterized as banking services. These data encompass explicit fees or commissions, but many financial services include implicit payments as well: for example, the difference between the buying and the selling price of a financial
United Kingdom 29%
Canada 6%
Japan 5%
Australia 5% France 3%
All other countries 52%
U.S.-owned foreign affiliates Total = $53.1 billion

Recent Trends in U.S. Services Trade: 2016 Annual Report
U.S. International Trade Commission | 135
asset, or the service charge embedded in the interest rate offered to a depositor. The value of these unpriced financial services (sometimes called “Financial Intermediation Services Indirectly Measured”) is only partly captured by BEA data.a
The BEA also tracks financial services supplied abroad through foreign affiliates of U.S.-owned firms, and financial services supplied in the United States by affiliates of foreign-owned firms. These services are tracked for some individual countries, but country-level data are often suppressed to avoid disclosing financial information of individual companies.
The U.S. Treasury reports data on international trade in securities themselves, which are related to securities services but are distinct. The Treasury International Capital (TIC) data-reporting system measures gross U.S. purchases of foreign long-term securities (government and corporate bonds as well as company stocks) and gross foreign purchases of U.S. long-term securities, measured by the market value of portfolio holdings. The TIC system uses monthly and quarterly cross-border data as reported by banks and broker dealers, annual surveys of cross-border holdings of short- and long-term securities, and quarterly positional data reported by other financial institutions.b
a Whichard and Borga, “Selected Issues in the Measurement,” June 2002, 47. Also see Hood, “Research Spotlight,” November 2013.
b Bertaut, Griever, and Tryon, “Understanding U.S. Cross-Border Securities Data,” 2006, A60; U.S. Treasury, “Frequently Asked Questions Regarding the TIC System,” n.d. (accessed March 31, 2016).
Outlook The global securities services industry is seeing increased demand for low-cost, passively managed index funds. These funds have portfolios that automatically reflect the components of a market index, such as the S&P 500, and therefore do not require managers who actively buy and sell securities (and charge fees for doing so). Between 1975 and 2015, index fund assets grew from $11 million to $4 trillion,272 and since 2007 assets in passive funds have grown four times faster than those in actively managed funds.273 This growth is partly driven by the recent underperformance of actively managed funds as compared to index funds: one study found that 99 percent of actively managed U.S. equity funds underperformed the S&P 500 over the past decade.274 This was true of hedge funds in particular—the average hedge fund gained 3 percent in 2014, while the S&P 500 index rose by 11 percent—despite typically charging high fees of 2 percent on assets (regardless of performance) plus 20 percent of fund profits.275 Leading firms in the passively managed index fund industry, such as State Street, Vanguard, and BlackRock, will likely benefit from continued demand for index funds. However, the concentration of capital has implications; for instance, the shift to passive investment has driven up the valuation premium of stocks that happen to be included in indexes like the S&P
272 Udland, “The Incredible Rise of the $4 Trillion,” January 4, 2016. 273 Mooney, “Passive Funds Grow 230 Percent to $6 Trillion,” May 29, 2016. 274 Ung, Fernandes, and Hahn, “SPIVA Europe Scorecard,” 2015. 275 Ritholtz, “The Most Fascinating Investing Paradox,” February 12, 2015.

Chapter 5: Securities
136 | www.usitc.gov
500 relative to comparable stocks that fall outside the index.276 High demand could in time lead to overvaluation, underperformance, and eventual migration back toward other assets, but unless and until such a reversal takes place, the growth of index fund assets is expected to continue. Indeed, new rules that hold some financial advisors to a fiduciary standard (which will discourage them from recommending expensive products with high commissions) should attract even more money into index funds in the years ahead.277
The securities industry and the global economy have been shaped in recent years by high demand for safe assets, a trend that may continue. Safe assets, usually defined as securities with low market and credit risk and high liquidity, are generally supplied by developed-country governments; U.S. Treasuries are the most significant type of safe asset, accounting for 45 percent of central government securities rated AAA or AA.278 The high global demand for safe assets is largely driven by emerging economies with high savings rates and few available savings vehicles. Additionally, pension funds, endowments, and other financial institutions are often constrained by rules that require them to invest in safe assets. Demand has outstripped supply in recent years, pushing yields on government bonds to historical lows; more than $3 trillion in such bonds have negative nominal interest rates, meaning investors are losing money on their loans to governments.279 A continued imbalance between the demand for and supply of safe assets could lead to short-term volatility spikes, asset bubbles, and a lack of liquidity in key markets.280 It also creates incentives for securities firms to create seemingly safe financial instruments by engineering tranches from risky loans.281
The regulatory environment for securities firms continues to evolve. In the United States, the 2010 Dodd-Frank Act established several new organizations, including a Financial Stability Oversight Council that monitors the stability of “too big to fail” securities firms, a Consumer Financial Protection Bureau that seeks to prevent predatory lending, and an Office of Credit Ratings that oversees credit ratings agencies.282 The Basel III accord, a voluntary regulatory framework endorsed by the G20 countries, imposes new capital requirements, leverage ratios, and liquidity thresholds on the securities industry. The European Market Infrastructure
276 Alster, “The Ease of Index Funds Comes with Risk,” October 9, 2015. 277 Economist, “Index We Trust,” June 11, 2016. 278 Fitch Ratings, “The Return of Safe Assets,” January 2016. 279 Plender, “Who’s Fooling Whom in Haven Asset Hunt?” March 3, 2015. 280 IMF, Global Financial Stability Report, April 2012, 113. 281 Caballero and Farhi, “On the Role of Safe Asset Shortages,” August 11, 2014. A tranche is a portion or slice of a pool of securities. 282 Dodd-Frank has largely been implemented, but as of 2015, 32 percent of the required rulemakings had not yet been finalized. Davis Polk, “Dodd-Frank Progress Report,” 2015.

Recent Trends in U.S. Services Trade: 2016 Annual Report
U.S. International Trade Commission | 137
Regulation establishes protocols for derivative contracts, and the EU’s Credit Rating Agency Regulation requires disclosure of the relationships between issuers and ratings agencies.283
These new regulations have required securities firms to raise large amounts of new capital. The 31 holding companies supervised under the Federal Reserve’s Comprehensive Capital Analysis and Review program—a group that includes J.P. Morgan Chase, Goldman Sachs, Morgan Stanley, and Citi, among others—have added $641 billion in capital since 2009 to meet regulatory requirements.284 Regulations impose costs on firms, which to an extent are passed on to the broader economy. A 2012 IMF paper estimated that new capital and liquidity regulations would increase lending rates in Europe, Japan, and the United States by 18 basis points, 8 basis points, and 28 basis points respectively, as compared to a baseline scenario.285 Furthermore, a 2015 survey found substantial “compliance fatigue” among employees of financial services firms who struggle to keep up with evolving regulations.286 However, the costs of new regulations are countered by the benefits of a more resilient financial system with lower probabilities of crises and recessions. Going forward, regulators will likely continue to finalize and implement these new rules, while facing pressure from the securities industry to be flexible in their application and enforcement.287
283 Segoviano et al., “Securitization: The Road Ahead,” January 2015, 12. 284 Federal Reserve, Comprehensive Capital Analysis and Review 2015, March 2015, 2. 285 Elliott, Salloy, and Santos, “Assessing the Cost of Financial Regulation,” September 2012. A basis point is 0.01 percent. 286 Thomson Reuters, “Thomson Reuters Annual Cost of Compliance Survey,” May 13, 2015. 287 Brush and Hamilton, “Wall Street Banks Have Basel’s Ear in Pushback,” April 1, 2016.

Chapter 5: Securities
138 | www.usitc.gov
Bibliography Allison, Ian. “Guardtime Secures over a Million Estonian Healthcare Records on the Blockchain.”
International Business Times, March 3, 2016. http://www.ibtimes.co.uk/guardtime-secures-over-million-estonian-healthcare-records-blockchain-1547367.
Alster, Norm. “The Ease of Index Funds Comes with Risk.” New York Times, October 9, 2015. http://www.nytimes.com/2015/10/11/business/mutfund/the-ease-of-index-funds-comes-with-risk.html.
Bertaut, Carol, William Griever, and Ralph Tryon. “Understanding U.S. Cross-Border Securities Data.” Federal Reserve Bulletin, 2006. http://www.federalreserve.gov/pubs/bulletin/2006/cross_border_securities.pdf.
Bickel, Brett. “Harmonizing Regulations in the Financial Services Industry through the Transatlantic Trade and Investment Partnership.” Emory International Law Review 29, no. 3 (2015): 557–87. http://law.emory.edu/eilr/content/volume-29/issue-3/comments/harmonizing-regulations-in-financial-services-industry.html.
Brush, Silla, and Jesse Hamilton. “Wall Street Banks Have Basel’s Ear in Pushback on Market Risk.” Bloomberg, April 1, 2016. http://www.bloomberg.com/enterprise/blog/wall-street-banks-have-basels-ear-in-pushback-on-market-risk/.
Caballero, Ricardo, and Emmanuel Farhi. “On the Role of Safe Asset Shortages in Secular Stagnation.” VoxEU, August 11, 2014. http://voxeu.org/article/role-safe-asset-shortages-secular-stagnation.
Carne. UCITS Guide for Investment Managers. Carne Group, August 2014. http://www.carnegroup.com/wp-content/uploads/2014/08/UCITS-Guide-for-Investment-Managers-August-2014.pdf.
Chavez-Dreyfuss, Gertrude. “Honduras to Build Land Title Registry Using Bitcoin Technology.” Reuters, May 15, 2015. http://in.reuters.com/article/usa-honduras-technology-idINKBN0O01V720150515.
Crowe, Portia. “What Is Blockchain?” Business Insider, March 5, 2016. http://www.businessinsider.com/what-is-blockchain-2016-3.
Das, Satyajit. “China’s Stock Market Crash: Part 1—Communist Shares.” EconoMonitor (blog), November 11, 2015. http://www.economonitor.com/blog/2015/11/chinas-stock-market-crash-part-1-communist-shares/.

Recent Trends in U.S. Services Trade: 2016 Annual Report
U.S. International Trade Commission | 139
Das, Satyajit. “China’s Stock Market Crash: Part 2—A Little Capitalist Problem.” EconoMonitor, November 18, 2015. http://www.economonitor.com/blog/2015/11/chinas-stock-market-crash-part-2-a-little-capitalist-problem/.
Davis Polk. “Dodd-Frank Progress Report,” Fourth Quarter 2015. http://prod.davispolk.com/sites/default/files/Q4_2015_Dodd-Frank_Progress_Report.pdf.
Economist. “Index We Trust,” June 11, 2016. http://www.economist.com/news/finance-and-economics/21700401-vanguard-has-radically-changed-money-management-being-boring-and-cheap-index-we.
Economist. “Risky Returns,” May 7, 2016. http://www.economist.com/news/special-report/21697984-china-struggling-unleash-power-stocks-and-bonds-risky-returns.
Elliott, Douglas, Suzanne Salloy, and André Oliveira Santos. “Assessing the Cost of Financial Regulation.” IMF Working Paper WP/12/233, September 2012. https://www.imf.org/external/pubs/ft/wp/2012/wp12233.pdf.
Federal Reserve System (Federal Reserve). Comprehensive Capital Analysis and Review 2015: Assessment Framework and Results, March 2015. http://www.federalreserve.gov/newsevents/press/bcreg/bcreg20150311a1.pdf.
Fitch Ratings. “The Return of Safe Assets,” January 2016. https://www.fitchratings.com/site/sovereigns/globalperspectives.
Goldstein, Matthew. “Goldman to Pay up to $5 Billion to Settle Claims of Faulty Mortgages.” New York Times, January 14, 2016. http://www.nytimes.com/2016/01/15/business/dealbook/goldman-to-pay-5-billion-to-settle-claims-of-faulty-mortgages.html.
Guida, Victoria. “Lew Defends Financial Services Data Carveout.” Politico, February 11, 2016. http://www.politico.com/tipsheets/morning-trade/2016/02/lew-defends-financial-services-data-carveout-senate-to-vote-on-customs-bill-democrats-weigh-in-on-tpp-212657.
Hoffman, Evan. Investment Banking and Securities Dealing in the U.S. IBISWorld Industry Report 52311, November 2015.

Chapter 5: Securities
140 | www.usitc.gov
Hood, Kyle. “Research Spotlight: Alternative Measures of Implicitly Priced Financial Services of Savings Institutions and Credit Unions.” Survey of Current Business, November 2013. http://www.bea.gov/scb/pdf/2013/11%20November/1113_finance_services.pdf.
IBISWorld. Securities Brokerage and Transaction Services in China. IBISWorld Industry Report, December 2015.
Industry Trade Advisory Committee on Services and Finance Industries (ITAC-10). Advisory Committee Report to the President, the Congress, and the United States Trade Representative on the Trans-Pacific Partnership Trade Agreement, December 3, 2015. https://ustr.gov/sites/default/files/ITAC-10-Services-and-Finance-Industries.pdf.
International Monetary Fund (IMF). Global Financial Stability Report: The Quest for Lasting Stability, April 2012. https://www.imf.org/external/pubs/ft/gfsr/2012/01/pdf/text.pdf.
———. “Reference Note on Trade in Financial Services,” September 3, 2010. https://www.imf.org/external/np/pp/eng/2010/090310.pdf.
Investment Company Institute (ICI). 2016 Investment Company Fact Book, 2016. https://www.ici.org/pdf/2016_factbook.pdf.
———. “Worldwide Regulated Open-End Fund Assets and Flows, Fourth Quarter 2015,” March 22, 2016. https://www.ici.org/research/stats/worldwide/ww_q4_15.
Kim, Kyoungwha. “Chinese Stock Market Turnover Surges to Record.” Bloomberg, May 28, 2015. http://www.bloomberg.com/news/articles/2015-05-28/china-stock-turnover-tops-u-s-as-greed-fear-fuel-trading-fever.
KPMG. “Mainland China Securities Survey 2015,” October 2015. http://www.kpmg.com/CN/en/IssuesAndInsights/ArticlesPublications/Documents/China-Securities-Survey-201510.pdf.
Lang, Andrew, and Caitlin Conyers. Financial Services in EU Trade Agreements. European Parliament Directorate General for Internal Policies, October 2014. http://www.europarl.europa.eu/RegData/etudes/STUD/2014/536300/IPOL_STU(2014)536300_EN.pdf.
Mitchell, Tom, and Patrick McGee. “World Bank Warns China to Reform ‘Distorted’ Financial System.” Financial Times, July 1, 2015. https://next.ft.com/content/bf01a54c-1fa1-11e5-aa5a-398b2169cf79.

Recent Trends in U.S. Services Trade: 2016 Annual Report
U.S. International Trade Commission | 141
Mooney, Attracta. “Passive Funds Grow 230 Percent to $6 Trillion.” Financial Times, May 29, 2016. http://www.ft.com/intl/cms/s/2/2552ce62-2400-11e6-aa98-db1e01fabc0c.html.
Nishizawa, Kana. “Goldman Sachs Still Bullish on China Stocks.” Bloomberg, September 2, 2015. http://www.bloomberg.com/news/articles/2015-09-02/goldman-sachs-sees-snap-back-in-china-stocks-as-growth-steadies.
Noble, Josh. “Why Are China’s Stock Markets So Volatile?” FT Explainer, Financial Times, July 2, 2015. https://next.ft.com/content/e5af8da0-1fc7-11e5-aa5a-398b2169cf79.
Noonan, Laura. “Investment Banks’ Return on Equity Declines.” Financial Times, February 21, 2016. https://next.ft.com/content/0c65e85a-d719-11e5-8887-98e7feb46f27.
Norton Rose Fulbright. “Financial Institutions and Blockchain Technology,” March 2016. http://www.nortonrosefulbright.com/knowledge/publications/138038/financial-institutions-and-blockchain-technology.
Plender, John. “Who’s Fooling Whom in Haven Asset Hunt?” Financial Times, March 3, 2015. https://next.ft.com/content/8a9c2730-c0f8-11e4-88ca-00144feab7de#axzz4AFal54KO.
Prasad, Eswar. “China’s Economy and Financial Markets: Reforms and Risks.” Brookings, April 27, 2016. http://www.brookings.edu/research/testimony/2016/04/27-china-economy-financial-markets-prasad.
Puccio, Laura. TTIP and Regulation of Financial Markets: Regulatory Autonomy versus Fragmentation. European Parliamentary Research Service, June 2015. http://www.europarl.europa.eu/RegData/etudes/IDAN/2015/559494/EPRS_IDA (2015)559494_EN.pdf.
Ritholtz, Barry. “The Most Fascinating Investing Paradox.” Bloomberg, February 12, 2015. https://www.bloomberg.com/view/articles/2015-02-12/hedge-funds-underperform-as-investors-give-them-more-money.
Rizzo, Pete. “Why Symbiont Believes Blockchain Securities Are Wall Street’s Future.” Coindesk, August 25, 2015. http://www.coindesk.com/why-symbiont-believes-blockchain-securities-are-wall-streets-future/.

Chapter 5: Securities
142 | www.usitc.gov
Robinson, Matt, and Neil Weinberg. “JP Morgan Admits It Didn’t Tell Clients about Conflicts.” Bloomberg, December 18, 2015. http://www.bloomberg.com/news/articles/2015-12-18/jpmorgan-pays-267-million-to-settle-conflict-of-interest-claims.
Schoen, John. “Seven Years On from Crisis, $150 Billion in Bank Fines and Penalties.” CNBC, April 30, 2015. http://www.cnbc.com/2015/04/30/7-years-on-from-crisis-150-billion-in-bank-fines-and-penalties.html.
Scott, Brett. “How Can Cryptocurrency and Blockchain Technology Play a Role in Building Social and Solidarity Finance?” United Nations Research Institute for Social Development, Working Paper 2016-1, February 2016. http://www.unrisd.org/brett-scott.
Securities Industry and Financial Markets Association (SIFMA). “2015 Factbook,” 2015. http://www.sifma.org/factbook/.
Securities Industry and Financial Markets Association (SIFMA). “SIFMA Joins U.S. and EU Entities Urging TTIP to Include Full Coverage of Financial Services to Address Market Fragmentation.” Press release, February 21, 2016. http://www.sifma.org/newsroom/2016/sifma-joins-u_s_-and-eu-entities-urging-ttip-to-include-full-coverage-of-financial-services-to-address-market-fragmentation/.
Segoviano, Miguel, Bradley Jones, Peter Lindner, and Johannes Blankenheim. “Securitization: The Road Ahead.” IMF Staff Discussion Note, SDN/15/01, January 2015. http://www.imf.org/external/pubs/ft/sdn/2015/sdn1501.pdf.
Stafford, Philip, and Nicole Bullock. “Nasdaq to Step Up Blockchain Trials.” Financial Times, May 26, 2015. https://next.ft.com/content/81b6145c-0309-11e5-b31d-00144feabdc0.
Stafford, Philip. “Blockchain Initiative Backed by 9 Large Investment Banks.” Financial Times, September 15, 2015. http://www.ft.com/cms/s/0/f358ed6c-5ae0-11e5-9846-de406ccb37f2.html.
Stichele, M. Vander. Critical Issues in the Financial Sector. SOMO sector report, March 2004. http://www.somo.nl/publications-en/Publication_415.
Thomson Reuters. “Global Investment Banking Review: Full Year 2015,” 2015. http://dmi.thomsonreuters.com/Content/Files/4Q2015_Global_Investment_Banking_Review.pdf.

Recent Trends in U.S. Services Trade: 2016 Annual Report
U.S. International Trade Commission | 143
Thomson Reuters. “Thomson Reuters Annual Cost of Compliance Survey Shows Regulatory Fatigue, Resource Challenges and Personal Liability to Increase throughout 2015.” Press release, May 13, 2015. http://thomsonreuters.com/en/press-releases/2015/05/cost-of-compliance-survey-shows-regulatory-fatigue-resource-challenges-personal-liability-to-increase.html.
Udland, Myles. “The Incredible Rise of the $4 Trillion Equity Index Fund Business in One Chart.” Business Insider, January 4, 2016. http://www.businessinsider.com/index-fund-assets-under-management-2016-1.
Ung, Daniel, Rodney Fernandes, and Bryan Hahn. “SPIVA Europe Scorecard.” S&P Dow Jones Indices, 2015. http://www.spindices.com/documents/spiva/spiva-europe-year-end-2015.pdf.
United States Council for International Business. “Business Urges China to Halt Controversial Cyber Banking Regulations,” April 15, 2015. http://www.uscib.org/business-urges-china-to-halt-controversial-cyber-banking-regulations/.
U.S. Department of Commerce (USDOC). Bureau of Economic Activity (BEA). Table 3.1, “Services Supplied to Foreign Persons by U.S.MNEs through Their MOFAs, by Industry of Affiliate and by Country of Affiliate,” Interactive Data: International Data, International Transactions. http://bea.gov/iTable/iTable.cfm?ReqID=62&step=1#reqid=62&step=2&isuri=1&6210=1 (accessed June 16, 2016).
———. Bureau of Economic Activity (BEA). Table 4.1, “Services Supplied to U.S. Persons by Foreign MNEs through Their MOUSA, by Industry of Affiliate and by Country of UBO,” Interactive Data: International Data, International Transactions. http://bea.gov/iTable/iTable.cfm?ReqID=62&step=1#reqid=62&step=2&isuri=1&6210=1 (accessed June 16, 2016).
———. Bureau of Economic Activity (BEA). Table 2.1, “U.S. Trade in Services, by Type of Service.” Interactive Data: International Data, International Services. http://bea.gov/iTable/iTable.cfm?ReqID=62&step=1#reqid=62&step=6&isuri=1&6221=1,26,27,28,29,30,69,94,95,96,97,98&6220=1,2,3,4,5,6&6210=4&6200=160&6224=&6211=167&6223=&6222=&6230=1 (accessed March 4, 2016).
U.S. Department of the Treasury (U.S. Treasury). Annual Cross-U.S. Border Portfolio Holdings. https://www.treasury.gov/resource-center/data-chart-center/tic/Pages/fpis.aspx (accessed March 31, 2016).

Chapter 5: Securities
144 | www.usitc.gov
———. “Frequently Asked Questions Regarding the TIC System and TIC Data.” https://www.treasury.gov/resource-center/data-chart-center/tic/Pages/ticfaq2.aspx#q7 (accessed March 31, 2016).
———. Treasury International Capital System. https://www.treasury.gov/resource-center/data-chart-center/tic/Pages/index.aspx (accessed March 31, 2016).
Weinland, Don. “China Halts Overseas Investment Scheme.” Financial Times, February 28, 2016. https://next.ft.com/content/c64b3fc6-dc2e-11e5-a72f-1e7744c66818.
Weinland, Don, Henny Sender, and Gabriel Wildau. “Foreign Funds Cut Quotas in China Investment Scheme.” Financial Times, February 3, 2016. https://next.ft.com/content/fcacb912-ca1a-11e5-a8ef-ea66e967dd44.
Whichard, Obie, and Maria Borga. “Selected Issues in the Measurement of U.S. International Services.” Survey of Current Business 82, no. 6, June 2002. http://www.bea.gov/scb/pdf/2002/06June/0602intlservices.pdf.
World Bank. World DataBank. World Development Indicators. http://databank.worldbank.org/data/reports.aspx?source=world-development-indicators (accessed May 9, 2016).

U.S. International Trade Commission | 145
Chapter 6 Services Roundtable The Commission hosted its ninth annual Services Roundtable on November 5, 2015.288 Commissioner Rhonda Schmidtlein moderated the first half of the discussion, and Chairman Meredith Broadbent moderated the second half. The Commission regularly holds these roundtables to encourage discussion among individuals from government, industry, and academia about important issues affecting services trade. This year’s event focused on the evolution and effectiveness of services trade provisions in existing trade agreements as well as the impact of digital technologies on the cross-border provision and liberalization of services.
Evolution and Effectiveness of Services Trade Provisions The roundtable began with an assessment of the progress being made in recent free trade agreements. One participant observed that the development of digital technologies has required trade agreements to tackle new issues such as e-commerce and cross-border data flows. This prompted other panelists to note the importance of the negative list approach, which requires the liberalization of all discriminatory measures in covered sectors unless specific exceptions are listed. As one attendee explained, the negative list approach allows agreements to capture unforeseen developments in covered sectors; the attendee went on to describe the importance of negative lists in minimizing ambiguity surrounding market access provisions, particularly when dealing with new technologies. Another panelist concurred, stating that a negative list approach allows innovation to continue while still creating space for exceptions based on legitimate regulatory purposes.
Increased transparency was identified by several panelists as one of the principal benefits provided by free trade agreements. The transparency chapter in the Trans-Pacific Partnership (TPP) will have a positive impact on services trade, one participant suggested. Another noted the importance of the TPP for the commitments it contains on consultation and public comment; these processes would allow governments to react to new developments in services markets while providing firms with the transparency and accountability they need to operate.
288 The Services Roundtable is an off-the-record event. As such, its participants are not named in this summary, and no transcript is available to the general public.

Chapter 6: Services Roundtable
146 | www.usitc.gov
Other specific provisions in the TPP and other trade agreements were also referenced as being particularly important for services. One participant noted that many current laws and regulations affecting the provision of services exist behind borders, where governments may act more favorably toward domestic firms. According to the participant, this tendency increases the importance of enforcing the national treatment provisions found in many trade agreements, which deter discriminatory treatment and provide for investments in new markets. The commitments on data flows contained in the Trans-Pacific Partnership (TPP) agreement were praised by another panelist, who noted that they appear to be the most comprehensive yet in any trade agreement. Additionally, a participant noted that the TPP contains innovations in its e-commerce chapter that ensure the free flow of data across borders for most services industries.
The subject of trade agreements’ impact on services attracted a number of other observations. One participant proposed that while trade agreements may not be liberalizing applied policies as much as they are binding governments to the policies that already exist, these agreements do create an environment in which services firms can operate with greater certainty about the type of treatment they will receive. Another attendee suggested that trade agreements have importance beyond their specific provisions. This attendee stated that TPP may become an anchor in a rules-based system of trade that brings additional countries such as Japan and Vietnam into free trade agreements with the United States, and that it allows for the possibility of future entry by other important economies in Asia. Finally, a panelist observed that the Safe Harbor framework,289 while not a free trade agreement, was a model of regulatory cooperation for countries that allowed data to flow back and forth between the United States and the European Union (EU).
Participants also discussed a number of challenges posed by trade agreements. One panelist asserted that negative lists could raise issues involving governments’ ability to regulate in the public interest and not on economic grounds. Another attendee pointed out the difficulty of limiting the number or extent of exceptions in trade agreements, since governments want to preserve their regulatory authority and may be less willing to make commitments without certain exceptions. Participants also noted that the administrative practices for implementing commitments in trade agreements vary widely among countries; those practices could lead to differences between the text of the agreement and how the rules translate into practice. Finally, another panelist raised the issue of whether newer services posed any greater regulatory challenges than those services that existed when the agreements were originally
289 The Safe Harbor framework was an agreement between the United States and the European Union (EU) in which U.S. firms agreed to abide by EU data privacy rules in return for the ability to transfer data across borders. The framework was struck down by the European Court of Justice in late 2015 and a replacement agreement, the EU-U.S. Privacy Shield, was announced in July 2016.

Recent Trends in U.S. Services Trade: 2016 Annual Report
U.S. International Trade Commission | 147
negotiated. For example, many exceptions contained in article 14 of the General Agreement on Trade and Tariffs (GATT) agreement in 1947 were repurposed in 1994 for the General Agreement on Trade in Services (GATS).
Turning specifically to the TPP, several participants highlighted issues with the agreement that could prove challenging for trade in services. One attendee indicated that some firms are concerned by the lack of a commitment in the TPP restricting mandatory data localization for financial services. Another participant said that the exceptions Malaysia negotiated for its financial services sector in the TPP could set a precedent that may encourage other countries to request similar exceptions in future trade agreements. Additionally, one panelist expressed the view that the growing complexity of trade agreements like the TPP was undermining their effectiveness in liberalizing trade. As an example, this panelist suggested that differing rules of origin in various trade agreements create complications for retailers with global supply chains.
In addition to addressing specific problems contained in trade agreements, several participants suggested alternative ways to facilitate trade in services. One attendee stated that trade agreements with binding rules might act as a baseline for liberalization, while regulatory cooperation could be used to move forward on issues where less consensus exists among trading partners. The attendee stated that this was necessary to balance limited exceptions to trade agreement commitments with the need of governments to maintain their ability to regulate. Another participant noted that mutual recognition agreements—such as those in which parties agree to recognize the licenses held by professionals in certain services sectors—were a form of cooperation on trade issues that is worth exploring further in the future. Lastly, a panelist proposed using the World Trade Organization as a forum for regulatory cooperation where administrative support would be given to countries who wanted to participate.
The Impact of Digital Technologies on Services Trade and Liberalization The second half of the roundtable began with an assessment of the impact of services-related TPP provisions on digital technologies and trade in services. One panelist stated that TPP commitments on the free flow of data and the prohibition on data localization requirements were key provisions for facilitating digital trade. Another participant added that these provisions on data flows represented a major innovation in services trade regulation. Additionally, this participant said that while provisions on some electronic cross-border transactions have been included in some form in trade agreements since 1994, provisions covering issues related to e-commerce and data flows are a new innovation in the TPP. One attendee also connected the free flow of data with growth in small and medium-sized enterprises (SMEs), noting that as services like insurance become automated through

Chapter 6: Services Roundtable
148 | www.usitc.gov
digitalization, SMEs are able to access these services more efficiently. The attendee then stated that introducing data localization requirements cuts off these gains of efficiency for SMEs.
As mentioned earlier, another panelist suggested that the TPP fell short in addressing financial services regulation, noting in particular that there was no prohibition on data localization for financial services. This panelist also stated that for financial services in particular, there should be a balance between maintaining safeguards for protecting consumer data and the liberalization of trade. A second participant added that an additional challenge in financial services liberalization is determining whether data privacy laws offer the same level of protection and are enforced similarly across countries.
The potential impact of the Trade Facilitation Agreement (TFA) and the Trade in Services Agreement (TISA) was assessed by participants later in the discussion. One participant stated that the TPP was able to establish a higher standard for trade in services than the TFA, since the TPP includes fewer parties (12) than the TFA (which was negotiated through the World Trade Organization and has been ratified by 90 WTO members).290 This participant observed that the TFA should lead to improvements in customs procedures if the countries involved take the agreement seriously. Another attendee expressed the view that the TISA represented a new negotiating model for trade agreements—one that, unlike the Doha Round model, no longer relies on an exchange of concessions. The attendee also stated that TISA membership could set the standard for services trade, giving Mauritius, which agreed to join the TISA negotiations, as an example of the appeal of these new trade agreements.
Participants also considered some of the challenges U.S. firms may face when exporting services abroad, in particular for the e-commerce sector. One panelist stated that one challenge for e-commerce SMEs is that overseas consumers may begin to order products online before these firms can create a strategy to sell products internationally. Another participant explained that although Chinese firms see e-commerce as an opportunity, other developing economies see U.S. e-commerce providers as a threat to domestic firms. This participant cited as an example an incremental increase in paperwork for low-value shipments in many developing economies, which adds to the cost of trade. As a result, this participant observed, developing countries may need to be convinced that e-commerce can benefit local producers by giving them a platform to sell globally.
Finally, roundtable participants discussed measurement issues, from current practices for measuring digital technology exports to future challenges for measurement. One attendee noted that technology-enabled trade in services is growing faster than the ability to measure it. The attendee cited trends in services trade growth, where more services are becoming tradable
290 As of July 28, 2016. WTO, “Peru, Saudi Arabia ratify Trade Facilitation Agreement,” July 28, 2016.

Recent Trends in U.S. Services Trade: 2016 Annual Report
U.S. International Trade Commission | 149
due to technology advances. Statistically, however, services continue to account for only about one-fifth of total trade, and this could be an indication that the trade data may be failing to fully capture technologically enabled services activity. A second participant raised the question how digital services such as social media sites, which do not charge a fee to users, are captured in official service statistics beyond advertising revenue. A third panelist confirmed that although these activities have some value, they do not show up in statistics outside of advertising and royalties, and there is no clear methodology for including them in future statistical accounts.
As a specific challenge, a participant gave the example of measuring information technology (IT) capacity: initially seen as an investment, IT capacity is increasingly categorized as a consumption expenditure due to advances in cloud computing. Another attendee observed that it is unclear how to measure the services component of value added when creating a product, such as a microchip, which is designed in the United States and then manufactured in other countries. A third participant stated that international standards for measuring trade in services were released by the International Monetary Fund in 2009, but there have been problems applying these changes to trade statistics. Additionally, a panelist pointed out that digital technology enables some firms to sell their services across borders without having to establish affiliates in foreign countries. This ability can create discrepancies in trade statistics, depending on whether the services are purchased directly by a foreign national and if a U.S.-owned foreign affiliate is incorporated in the country where the services are delivered.
These issues, in turn, complicate efforts to measure the impact of trade agreements on services: several participants remarked on the difficulties of quantifying the economic effects of certain restrictions in seeking to determine what types of policy environments enable services trade. While one attendee pointed out the lack of detail or clarity in official services trade data—in particular for digital services—another observed that services trade statistics have become more detailed in recent years and that the frequency of publication has increased. Panelists also highlighted the importance of resources such as indexes of services trade restrictiveness published by the Organisation for Economic Co-operation and Development and the World Bank for services research.

Chapter 6: Services Roundtable
150 | www.usitc.gov
Bibliography World Trade Organization (WTO). “Peru, Saudi Arabia Ratify Trade Facilitation Agreement.”
July 28, 2016. https://www.wto.org/english/news_e/news16_e/fac_28jul16_e.htm.

U.S. International Trade Commission | 151
Appendix A Summary of Selected Services Research

152 | www.usitc.gov
Recent Trends in U.S. Services Trade: 2016 Annual Report
U.S. International Trade Commission | 153
Selected Services Research
This appendix provides summaries and links to recent Commission reports that feature topics in services trade. With the exception of the Executive Briefings on Trade, these reports were prepared under section 332(g) of the Tariff Act of 1930 (19 U.S.C. § 1332(g)) in response to requests from the U.S. Trade Representative, the House Committee on Ways and Means, and/or the Senate Committee on Finance.
Services-related Reports and Investigations
• Trans-Pacific Partnership Agreement: Likely Impact on the U.S. Economy and on Specific Industry Sectors
• Economic Impact of Trade Agreements Implemented under Trade Authorities Procedures, 2016 Report
• Overview of Cuban Imports of Goods and Services and Effects of U.S. Restrictions • Trade and Investment Policies in India, 2014–2015
Executive Briefings on Trade
• “Factors Affecting Growth In Ghana’s Services Economy” • “South Africa Is a Leading Producer and Supplier of Services in Africa” • “Sub-Saharan African Travel Services Trade” • “Transport Corridors Have Improved Trade in Sub-Saharan Africa, but Issues Remain” • “Trends in U.S. Health Travel Services Trade” • “Factors Contributing to the Rapid Growth of Mauritius’ Services Economy” • “World Bank Indicators Suggest That Sub-Saharan African Countries Are Open to
Services Trade” • “Mobile Money in Kenya” • “The Undersea Cable Boom in Sub-Saharan Africa” • “The Impact of Brexit on Financial Services”
Journal of International Commerce and Economics Articles
• “Green Building Services”
Staff Publications and Working Papers
• “Services Trade Restrictions and Company Profits: Telecommunications”

Appendix A: Summary of Selected Services Research
154 | www.usitc.gov
Services-related Reports and Investigations
Trade and Investment Policies in India, 2014–2015 James Stamps, project leader Investigation No. 332-550, Publication 4566, September 2015 https://www.usitc.gov/publications/332/pub4566.pdf
Abstract
This report by the U.S. International Trade Commission (Commission), Trade and Investment Policies in India, 2014–2015, reviews significant changes made to India’s trade and investment policies by the government of Narendra Modi since he took office in May 2014. It also describes changes to policies identified in Trade, Investment, and Industrial Policies in India: Effects on the U.S. Economy (hereafter India 2014), a December 2014 report by the Commission. Both reports were requested by the U.S. House Committee on Ways and Means and the U.S. Senate Committee on Finance.
The Modi government made significant changes to certain barriers to trade and investment described in India 2014. The Modi government also announced several new trade and investment-related policies between May 2014 and July 2015. The Commission found significant changes or new policies in four areas: foreign direct investment; tariffs and customs procedures; local-content requirements, particularly concerning information and communications technology goods; and standards and technical regulations.
U.S. industry representatives and other observers viewed some of the policy changes described in this report as promising from the standpoint of U.S. trade and investment opportunities in India; other policies, as less so. The Modi government enacted no new laws to address intellectual property rights (IPR)-related barriers. However, U.S. industry representatives report that the Modi government has shown more interest in improving IPR policy transparency and more willingness to engage with the United States in this area than Indian governments in the past.
Recent Trends in U.S. Services Trade: 2016 Annual Report
U.S. International Trade Commission | 155
Overview of Cuban Imports of Goods and Services and Effects of U.S. Restrictions Heidi Colby-Oizumi, project leader Investigation No. 332-552, Publication 4597, March 2016 https://www.usitc.gov/publications/332/pub4597.pdf
Excerpt from the Executive Summary
This report examines Cuban imports of goods and services from 2005 to the present; the effects of U.S. restrictions on trade with and travel to Cuba; and Cuban nontariff measures, institutional and infrastructural factors, and other barriers that may inhibit or otherwise affect the ability of firms to conduct business in and with Cuba. It also presents a qualitative and quantitative sectoral analysis of potential U.S. exports of goods and services to Cuba in the event that U.S. restrictions are lifted and Cuban import barriers are reduced.
Both U.S. trade restrictions and Cuban import barriers heavily inhibit trade between the two countries. U.S. restrictions on trade with and travel to Cuba have reportedly shut U.S. suppliers out of a market in which they could be competitive on price, quality, and proximity. Inability to offer credit, to travel to or invest in Cuba, and to use funds sourced and administered by the U.S. government are cited as the most problematic U.S. restrictions. In addition, Cuban nontariff measures and other factors may limit U.S. exports to and investment in Cuba if U.S. restrictions are lifted. These include Cuban government control of trade and distribution, legal limits on foreign investment and property ownership, and politically motivated decision making regarding trade and investment.
Absent U.S. restrictions, U.S. exports in several sectors would likely rise somewhat in the short term, with prospects for larger increases in the longer term, subject to changes in Cuban policy and economic growth. U.S. exports could rise further if Cuban import barriers were lowered.
Cuba’s services imports are quite small relative to its services exports. Cuba’s surplus in services trade, owing to strong exports of medical and tourism services, is a crucial source of the foreign currency required to sustain the country’s high import levels. While Cuba’s tourism sector will likely continue to grow in coming years, and U.S. regulations on U.S. participation in Cuba’s telecommunications and financial services sectors have eased, these areas are characterized by heavy state control, and thus are unlikely growth sectors for U.S. exports in the near term. However, in the medium to long term, these and other services sectors may prove to have significant potential for U.S. exports of services, as well as for exports of goods to support the provision of these services.

Appendix A: Summary of Selected Services Research
156 | www.usitc.gov
Trans-Pacific Partnership Agreement: Likely Impact on the U.S. Economy and on Specific Industry Sectors Jose Signoret, project leader Investigation No. TPA-105-001, USITC Publication 4607, May 2016 https://www.usitc.gov/publications/332/pub4607.pdf.
Excerpt from the Executive Summary
In accordance with section 105(c) of the Bipartisan Congressional Trade Priorities and Accountability Act of 2015, this report, by the U.S. International Trade Commission (Commission or USITC), assesses the likely effects of the Trans-Pacific Partnership Agreement (TPP, TPP Agreement, or the agreement) on the U.S. economy as a whole and on specific industry sectors. It encompasses TPP’s impact on the United States’ gross domestic product (GDP), exports, and imports; U.S. aggregate employment and employment opportunities; the production, employment, and competitive position of U.S. industries likely to be significantly affected by TPP; and the interests of U.S. consumers. The report also reviews other assessments of TPP’s economic effects available in the literature, and discusses areas of consensus and divergence between the Commission’s analyses and conclusions and those in the literature reviewed.
Among broad sectors of the U.S. economy, agriculture and food would see the greatest percentage gain relative to the baseline projections; output would be $10.0 billion, or 0.5 percent, higher by year 15. The services sector would benefit, with a gain of $42.3 billion (0.1 percent) in output. Output in manufacturing, natural resources, and energy would be $10.8 billion (0.1 percent) lower with the TPP Agreement than it would be compared with baseline estimates without the agreement.
The Commission’s model estimates that output for the U.S. services sector under TPP would be $42.3 billion higher (a 0.1 percent increase) relative to the 2032 baseline level; employment would also be 0.1 percent higher. U.S. exports of services to TPP partner markets would be 10.8 percent ($16.6 billion) higher than the baseline estimate, but exports to non-TPP countries would be 1.9 percent ($11.8 billion) less than the baseline estimate. Overall, global U.S. services exports would be 0.6 percent ($4.8 billion) higher, relative to baseline estimates. Exports in two services sectors would be lower than the baseline under TPP; these are sectors that would not experience significant liberalization under TPP, so the model assumes that economic resources would shift away from them, towards sectors that would be liberalized under the agreement.

Recent Trends in U.S. Services Trade: 2016 Annual Report
U.S. International Trade Commission | 157
At the same time, overall U.S. services imports are estimated to be 1.2 percent higher ($7 billion) than the baseline estimate.
Appendix A: Summary of Selected Services Research
158 | www.usitc.gov
Economic Impact of Trade Agreements Implemented under Trade Authorities Procedures, 2016 Report
Tamar Khachaturian and David Riker, project leaders Investigation No. 332-555, USITC Publication 4614, June 2016 https://www.usitc.gov/publications/332/pub4614.pdf
Excerpt from the Executive Summary
This report assesses the economic impact on the United States of U.S. trade agreements implemented under trade authorities procedures since 1984. Its scope includes the multilateral Uruguay Round agreements as well as 15 U.S. bilateral and regional trade agreements. The report analyzes many of the diverse effects of the trade agreements, including effects on international trade in goods and services, consumers, labor markets, international investment, receipts for intellectual property, and the trade position of small and medium-sized enterprises (SMEs).
The Commission’s economic analysis finds that in 2012 U.S. bilateral and regional trade agreements increased U.S. aggregate trade, expanding it by about 3 percent. They also increased U.S. real GDP and U.S. employment, expanding these by less than 1 percent ($32.2 billion and 159,300 fulltime equivalent employees, respectively). In addition, these agreements increased bilateral trade with partner countries by 26.3 percent. The Commission’s analysis of agreements that focus on specific industries but include many partners, such as the Information Technology Agreement, show that they have had larger impacts on trade in their targeted industries than do bilateral agreements that cover many sectors.
The trade agreements analyzed here have affected the U.S. economy in many different ways, including gains to consumers through lower prices and greater product variety, increased receipts for intellectual property, and a positive effect, on average, on U.S. bilateral merchandise trade balances with partner countries. Case studies highlight several types of agreement provisions that have impacted U.S. industries. Ranging from avocados to steel and to express delivery services, the case studies show that while in most instances trade agreements have generated gains, in others they have led to negative outcomes.

Recent Trends in U.S. Services Trade: 2016 Annual Report
U.S. International Trade Commission | 159
Executive Briefings on Trade “Mobile Money in Kenya” Eric Forden, June 2015
https://www.usitc.gov/publications/332/executive_briefings/forden_mobile_money_kenya_june2015_0.pdf
M-Pesa—the M stands for “mobile,” while pesa means “money” in Swahili—was launched in Kenya as the world’s first mobile money service in 2007. Mobile money services, which allow users to conduct financial transactions using mobile phones (cellphones), have given Kenya’s “un-banked” population a safe and easy way to transfer funds and pay for goods and services. Over the past seven years, mobile money services have grown very rapidly in Kenya due to several factors unique to its market, including an effective marketing strategy, high mobile penetration rates, strong demand for domestic remittances, and limited regulation.
“The Undersea Cable Boom in Sub-Saharan Africa” Eric Forden, June 2015 https://www.usitc.gov/publications/332/executive_briefings/forden_submarine_cables_june2015.pdf
During 2009–12, seven fiber-optic undersea cable systems were installed on the seabed around the east and west coasts of sub-Saharan Africa (SSA). Many observers hope these cables’ telecommunications transmission capacity will stimulate demand for Internet services (and promote economic growth) in the region. However, in the near term several factors will likely restrain demand for these services among the general population, including low per capita income, low levels of computer/smartphone ownership, and poor-quality domestic networks. Instead, during this period the main beneficiaries of SSA’s cables will likely be large domestic companies and multinational corporations operating in Africa.
“Factors Contributing to the Rapid Growth of Mauritius’ Services Economy” Jennifer Baumert Powell, July 2015 https://www.usitc.gov/publications/332/executive_briefings/powell_mauritian_services_economy_7-14-15.pdf
Several factors have contributed to the recent growth of the Mauritian services sector, including government efforts to promote economic diversification, a favorable business climate, and solid infrastructure. The services sector is a large and growing component of the Mauritian economy. A favorable business environment and business-friendly regulations have contributed to the growth of Mauritius’ services sector. Certain Mauritian services industries

Appendix A: Summary of Selected Services Research
160 | www.usitc.gov
have experienced, or may experience, very rapid growth due to favorable business conditions, regulations, and government initiatives targeting these industries.
“World Bank Indicators Suggest That Sub-Saharan African Countries Are Open to Services Trade” Cynthia Payne, July 2015 https://www.usitc.gov/publications/332/executive_briefings/payne_africa_stri.pdf
Despite significant differences in the size, composition, and regulation of their economies, most of the 23 sub- Saharan African (SSA) countries included in the World Bank’s Services Trade Restrictions Database have overall STRI scores similar to those posted by higher-income countries. Like high-income countries, many SSA countries included in the database have overall and industry-specific STRI scores in the “virtually open” range, suggesting that SSA countries typically maintain low barriers to services trade.
“Trends in U.S. Health Travel Services Trade” Art Chambers, August 2015 https://www.usitc.gov/publications/332/executive_briefings/chambers_health-related_travel_final.pdf
U.S. trade in health travel services (often called “medical tourism”) has grown steadily in recent years; exports (i.e., travelers coming to the United States) have doubled, and imports (U.S. travelers going abroad) have increased almost ninefold from a low base in the early 2000s. Despite rising costs, the U.S. health system continues to attract foreigners because of its high-quality services and its closeness to large patient markets. At the same time, more Americans are seeking more affordable care abroad, even if they must pay for their expenses out of pocket. The two most important barriers to increasing cross-border trade in health services are visa restrictions for travelers from certain countries entering the United States and a lack of coverage by many U.S. health insurers for treatments provided abroad.
“Factors Affecting Growth in Ghana’s Services Economy” Jennifer Baumert Powell, October 2015 https://www.usitc.gov/publications/332/executive_briefings/powell_ghana_ebot10-15-2015.pdf
The Ghanaian government has actively encouraged the development of the country’s services sector, whose rapid expansion has broadened overall economic growth and contributed to low unemployment in Ghana. Services account for almost half of Ghanaian gross domestic product (GDP) and a substantial share of Ghanaian trade. Favorable government actions and relative political and economic stability have helped support strong growth and earnings in several

Recent Trends in U.S. Services Trade: 2016 Annual Report
U.S. International Trade Commission | 161
Ghanaian service industries. However, infrastructure weaknesses and other issues hinder business activity in these same services industries and limit their contribution to growth in other sectors.
“South Africa Is a Leading Producer and Supplier of Services in Africa” George Serletis, October 2015 https://www.usitc.gov/publications/332/executive_briefings/sa_services_ebot10_16.pdf
South Africa is a diversified and well-developed middle-income country and the second-largest economy in Africa after Nigeria. Yet it also suffers from high unemployment, income inequality, and poverty. Services accounted for over two-thirds of the nation’s output in 2013. While most of South Africa’s economic sectors have grown slowly since the global recession in 2008–09, services posted double-digit growth. As a financial, transportation, retail, and business services hub for the sub-Saharan African region, South Africa is a vital supplier of infrastructure and business services that are key to national and regional economic growth.
“Sub-Saharan African Travel Services Trade” Art Chambers, October 2015 https://www.usitc.gov/publications/332/executive_briefings/chambers_africa_travel_ebot_final.pdf
The share of Sub-Saharan Africa (SSA) in the world tourism market is small but growing, up from 2.4 percent of total arrivals for all transportation modes in 1990 to 3.3 percent in 2010. Over the last eight years, SSA exports of travel services (including personal travel, business travel, and travel for health and education purposes) have risen steadily, while import growth has been more volatile owing to currency fluctuations. South Africa is the largest exporter of travel services, while Nigeria is the largest importer; the United States and the European Union (EU) are the largest sources of travelers (for all purposes) to SSA. Investment in hotels in SSA is rising to meet potential demand expansion driven by both overseas tourism and growth in the African middle class; however, relatively costly transportation and lodging compared to other global destinations, as well as perceived political instability, pose challenges for future growth.

Appendix A: Summary of Selected Services Research
162 | www.usitc.gov
“Transport Corridors Have Improved Trade in Sub-Saharan Africa, but Issues Remain” Joann Peterson, October 2015 https://www.usitc.gov/publications/332/executive_briefings/peterson_ebot_ssa_transit_corridors_1014.pdf
Infrastructure improvements in the transport corridors of sub-Saharan Africa (SSA) have led to growth in the region’s international trade; however, these gains are partially offset by corruption and lack of regulatory oversight at customs checkpoints. For transport corridors to successfully foster trade in the region, SSA countries should continue to reform customs procedures. In fact, some researchers suggest that customs reform is just as important to facilitating trade and corridor performance in SSA as is the continued improvement of the region’s transport infrastructure.
“The Impact of Brexit on Financial Services” Isaac Wohl, October 2016 https://www.usitc.gov/sites/default/files/publications/332/executive_briefings/wohl_brexit_and_financial_services_final.pdf
London is the financial center of Europe, and its financial services industry generates large amounts of international trade. Several financial firms in London have indicated they may shift resources from the UK to subsidiaries in the EU in order to retain access to their clients, but the consequences for financial services will depend on new UK-EU arrangements to be negotiated. In any scenario, London will likely retain competitive advantages in financial services by virtue of its legal system, business environment, and skilled labor, and the city will incentivize financial firms to stay. However, many firms have indicated that they will wait and see what happens before making new investments or hiring new employees in the UK, and in the meantime will prepare to move some of their operations to the EU.

Recent Trends in U.S. Services Trade: 2016 Annual Report
U.S. International Trade Commission | 163
Journal of International Commerce and Economics Articles
“Green Building Services” Jennifer Baumert Powell, October 2015 https://www.usitc.gov/publications/332/journals/vol_iii_article3_green_building_services.pdf
Abstract
Green building services include construction, architecture, engineering, and related activities aimed at creating sustainable structures using environmentally responsible processes and materials. While the concept of building a structure to complement its surrounding environment is not new, there has been a sharp increase in the demand for green buildings and green retrofits in recent years. This trend can be linked to several factors, including a growing interest in cutting the costs associated with operating a structure, government regulations and incentives, and environmental concerns, among others.
Available evidence suggests that U.S. exports and overseas sales of green building services are currently small. However, U.S. firms are internationally competitive, and growth in world markets offers substantial opportunities to green building firms that aim to provide their services abroad. This overview of the U.S. and global markets for green building services discusses factors that affect supply and demand for sustainable structures; examines trade in green building services as a component of overall trade in construction, architectural, and engineering services; and considers the outlook for the green building industry.
Staff Publications and Working Papers
“Services Trade Restrictions and Company Profits: Telecommunications” Tamar Khachaturian, November 2015 https://www.usitc.gov/publications/332/id_042telecommunication_final_0.pdf
Abstract
This paper examines the effect of trade barriers on telecommunications companies’ profit margins using both one-step and two-step estimation methods. Its main finding is that barriers to entry inflate the profits of incumbent companies, a result which is fairly robust across estimation methods. Additionally, there is some evidence that the effect of trade policies on

Appendix A: Summary of Selected Services Research
164 | www.usitc.gov
firm profits is related to firm characteristics. However, further research is necessary to improve modeling of profits in the telecommunications industry.
Forthcoming Research: 332 Investigations
The Economic Effects of Significant U.S. Import Restraints: Ninth Update, 2015 Investigation No. 332-325, December 2016 (tentative)

U.S. International Trade Commission | 165
Appendix B Data Tables for Figures

166 | www.usitc.gov

Recent Trends in U.S. Services Trade: 2016 Annual Report
U.S. International Trade Commission | 167
Table B.1: Global services: The United States led the world in cross-border exports and imports of commercial services in 2014 (million dollars)291 Country/region Exports Country/region Imports Americas
Americas
United States 687,600 United States 451,700 Other Americas 254,300 Other Americas 332,600
Total Americas 941,900 Total Americas 784,300 Europe Europe
United Kingdom 337,200 Germany 326,400 France 267,100 France 247,900 Germany 266,200 United Kingdom 196,900 Other Europe 1,531,200 Other Europe 1,230,200
Total Europe 2,401,700 Total Europe 2,001,400 Asia/Pacific Asia/Pacific
China 232,500 China 381,600 Other Asia 951,300 Other Asia 1,002,400
Total Asia 1,183,800 Total Asia 1,384,000 Middle East and Africa 226,500 Middle East and Africa 440,700 Commonwealth of Independent States 111,400 Commonwealth of Independent States 171,900
Total exports 4,865,600 Total imports292 4,782,400 Source: WTO, International Trade Statistics 2015. Table A8, “World Exports of Commercial Services by Region and Selected Economy, 2004–2014.” https://www.wto.org/english/res_e/statis_e/its2015_e/appendix_e/a08.xls (accessed April 1, 2016) and Table A9, “World Imports of Commercial Services by Region and Selected Economy, 2004–2014.” https://www.wto.org/english/res_e/statis_e/its2015_e/appendix_e/a09.xls (accessed April 1, 2016). Notes: Excludes public-sector transactions.
Table B.2: U.S. services: Sales and purchases of services through affiliate transactions are almost twice the value of cross-border trade in services
Year Services supplied by U.S.
firms' foreign affiliates Services supplied by U.S. affiliates of foreign firms U.S. cross-border exports U.S. cross-border imports
2006 890 648 398 314 2007 1,019 684 467 344 2008 1,117 702 514 380 2009 1,072 669 492 355 2010 1,155 701 544 377 2011 1,247 782 606 404 2012 1,286 813 634 424 2013 1,321 878 665 438 2014 690 453 Source: USDOC, BEA, International Data, interactive tables, Table 2.1, “U.S. Trade in Services, by Type of Service,” table 3.1, “Services Supplied to Foreign Persons by U.S. MNEs through Their MOFAs, by Industry of Affiliate and by Country of Affiliate,” and Table 4.1, “Services Supplied to U.S. Persons by Foreign MNEs through Their MOUSA, by Industry of Affiliate and by Country of UBO,” March 4, 2016. http://www.bea.gov/iTable/iTable.cfm?ReqID=62&step=1#reqid=62&step=6&isuri=1&6210=4&6200=160. Notes: Data for affiliates are available only through 2013. Total cross-border exports and imports are based on revised 2014 data from the BEA; the most recent data for 2015 have not been included due to their preliminary nature.
291 The WTO includes the following countries under the Commonwealth of Independent States: Armenia, Azerbaijan, Belarus, Georgia, Kazakhstan, Kyrgyzstan, Moldova, Russia, Tajikistan, Ukraine, and Uzbekistan. 292 The value of global exports differs from that of global imports due to several factors, including time lags, differences in methodology, and other measurement errors.

Appendix B: Data Tables for Figures
168 | www.usitc.gov
Table B.3: U.S. services: Travel and passenger fares accounted for the largest share of U.S. cross-border trade in 2014 (million dollars) Services industry Exports Imports Travel and passenger fares 220,757 145,677 Professional services 134,010 87,617 Royalties and license fees 110,949 30,670 Financial services 104,707 69,599 Electronics 55,299 40,957 Distribution 47,784 60,719 Other 16,622 14,214
Total 690,128 449,453 Source: USDOC, BEA, Interactive Data, International Data, International Services, Table 2.1., “U.S. Trade in Services, by Type of Service,” October 15, 2015. http://www.bea.gov/iTable/iTable.cfm?ReqID=62&step=1#reqid=62&step=6&isuri=1&6210=4&6200=160. Note: Excludes public-sector transactions. Total exports and imports by sector are based on the latest BEA data for which all sectors are available.
Table B.4: U.S. services: Distribution accounted for the largest share of U.S. affiliate transactions in 2013 (million dollars)
Services industry Services supplied by foreign affiliates
of U.S. firms293 Purchases from U.S. affiliates of
foreign firms294 Distribution services 408,558 244,698 Financial services 259,460 182,924 Electronic services295 141,869 127,188 Professional services 72,441 88,336 Manufacturing296 30,138 82,562 Other services (includes suppressed data) 408,409 152,763
Total 1,320,875 878,471
Source: USDOC, BEA, Table 3.1 “Services Supplied to Foreign Persons by U.S. MNEs through Their MOFAs, by Industry of Affiliate and by Country of Affiliate,” October 15, 2015, and Table 4.1, “Services Supplied to U.S. Persons by Foreign MNEs through Their MOUSA, by Industry of Affiliate and by Country of UBO,” Interactive tables: International Data, International Services, March 4, 2016. http://www.bea.gov/iTable/iTable.cfm?ReqID=62&step=1#reqid=62&step=6&isuri=1&6210=4&6200=231. Table B.5: U.S. financial services: Banking services led cross-border exports, and insurance services led cross-border imports of financial services in 2015 (million dollars) Services industry Exports Imports Banking services 74,245 17,870 Securities services 28,215 7,292 Insurance services 17,142 47,772
Financial services total 119,602 72,934
Source: USDOC, BEA, Interactive Data, International Data, International Services Table 2.1., “U.S. Trade in Services, by Type of Service.” International Data, Interactive tables: October 15, 2015. http://www.bea.gov/iTable/iTable.cfm?ReqID=62&step=1#reqid=62&step=6&isuri=1&6210=4&6200=160.
293 Services supplied by majority-owned foreign affiliates of U.S. parent firms. 294 Services supplied by majority-owned U.S. affiliates of foreign parent firms. 295 Data are underreported by the BEA to avoid disclosing individual companies’ information. 296 Includes ancillary services provided by goods manufacturers, such as computer hardware services.

Recent Trends in U.S. Services Trade: 2016 Annual Report
U.S. International Trade Commission | 169
Table B.6: U.S. financial services: Securities services were the largest category of financial services sales by foreign affiliates of U.S. firms in 2013, and insurance was the largest category of purchases from U.S. affiliates of foreign firms (billion dollars)
Services industry
Services supplied by foreign affiliates of
U.S. firms297
Purchases from U.S. affiliates of foreign
firms298 Securities services 102 62 Insurance services 65 69 Banking services 54 45 Rental and leasing (except real estate) 39 7 Source: USDOC, BEA, Table 3.1 “Services Supplied to Foreign Persons by U.S. MNEs through Their MOFAs, by Industry of Affiliate and by Country of Affiliate,” October 15, 2015, and table 4.1, “Services Supplied to U.S. Persons by Foreign MNEs through Their MOUSA, by Industry of Affiliate and by Country of UBO,” March 4, 2016. http://www.bea.gov/iTable/iTable.cfm?ReqID=62&step=1#reqid=62&step=6&isuri=1&6210=4&6200=231.
Table B.7: Banking Services: Europe had the largest share of bank assets by region in 2014 Region Percent Europe 41 North Asia 16 North America 14 India and Central Asia 7 Africa and Middle East 6 South America 5 Southeast Asia 6 Oceania 5
Source: IBISWorld, Global Commercial Banking, March 2016.
Table B.8: Banking Services: Bank branch concentration was highest in North America and Europe in 2014 Region Branches per 100,000 Sub-Saharan Africa 4 South Asia 9 Middle East and North Africa 15 OECD members 24 Latin America and Caribbean 16 European Union 28 East Asia and Pacific 11 North America 28
Source: World Bank, World Development Indicators, http://databank.worldbank.org/data/reports.aspx?source=world-development-indicators (accessed June 14, 2016).
Table B.9: Banking services: In 2015, global revenues for fintech firms were highest for payment transactions, followed by lending and financing (percent) Industry Account management Lending and financing Payments Financial assets Retail 10 14 25 13 Commercial 3 9 12 4 Large corporate 2 1 6 2
Source: McKinsey, “Cutting through the Fintech Noise,” December 2015, 2. https://www.febelfin.be/en/cutting-through-fintech-noise-markers-success-imperatives-banks.
297 Services supplied by majority-owned foreign affiliates of U.S. parent firms. 298 Services supplied by majority-owned U.S. affiliates of foreign parent firms.

Appendix B: Data Tables for Figures
170 | www.usitc.gov
Table B.10: Global investment and loan issuance in fintech grew rapidly after 2012 (billion dollars) Year Global Fintech investment Global marketplace loan issuance 2010 1 2 2011 1 3 2012 2 3 2013 9 5 2014 24 13
Source: Accenture, “Fintech and the Evolving Landscape,” 2016, 3; Morgan Stanley, “Can P2P Lending Reinvent Banking?” June 17, 2015. http://www.fintechinnovationlablondon.co.uk/fintech-evolving-landscape.aspx.
Table B.11: Banking Services: U.S. firms led global fintech lending in 2014 (billion dollars) Country Lending United States 12 China 9 United Kingdom 2 Australia 1
Source: Morgan Stanley, “Can P2P Lending Reinvent Banking?” June 17, 2015. http://www.morganstanley.com/ideas/p2p-marketplace-lending.
Table B.12: Banking services: U.S. cross-border trade in banking services resulted in a U.S. trade surplus each year during 2010–15 (billion dollars) 2010 2011 2012 2013 2014 2015 Exports 38 42 45 69 78 74 Imports 8 10 10 15 18 18
Trade balance 30 32 35 54 60 56 Source: USDOC, BEA Table 2.1, “U.S. Trade in Services, by Type of Service.” Interactive tables: International Data. http://bea.gov/iTable/iTable.cfm?ReqID=62&step=1#reqid=62&step=2&isuri=1&6210=1 (accessed June 16, 2016). Note: BEA conducted a benchmark survey that greatly increased the number of respondents reporting international trade flows of banking services. This increase is reported for the years 2013, 2014, and 2015, and is responsible for the sharp increase in flows between 2012 and 2013.
Table B.13: Banking services: U.S.-owned foreign affiliate sales outpaced purchases from foreign-owned U.S. affiliates during 2009–13 (billion dollars) Year U.S.-owned foreign affiliates Foreign-owned U.S. affiliates 2009 53 41 2010 51 44 2011 56 53 2012 58 49 2013 54 45
Source: USDOC, BEA, table 3.1, “Services Supplied to Foreign Persons by U.S. MNEs through Their MOFAs, by Industry of Affiliate and by Country of Affiliate,” and table 4.1, “Services Supplied to U.S. Persons by Foreign MNEs through Their MOUSA, by Industry of Affiliate and by Country of UBO,” Interactive tables: International Data. http://bea.gov/iTable/iTable.cfm?ReqID=62&step=1#reqid=62&step=2&isuri=1&6210=1 (both accessed March 3, 2016).

Recent Trends in U.S. Services Trade: 2016 Annual Report
U.S. International Trade Commission | 171
Table B.14: Banking services: In 2013, the United Kingdom was the largest purchaser of banking services from U.S.-owned foreign affiliates (million dollars) Country United Kingdom 13,586 Australia 2,332 Canada 2,126 China 1,033 Germany 947 All other countries 33,827 Total 53,851
Source: USDOC, BEA, table 3.1, “Services Supplied to Foreign Persons by U.S. MNEs through Their MOFAs, by Industry of Affiliate and by Country of Affiliate,” and table 4.1, “Services Supplied to U.S. Persons by Foreign MNEs through Their MOUSA, by Industry of Affiliate and by Country of UBO,” Interactive tables: International Data. http://bea.gov/iTable/iTable.cfm?ReqID=62&step=1#reqid=62&step=2&isuri=1&6210=1 (accessed March 3, 2016).
Table B.15: Insurance services: U.S. cross-border trade in insurance services resulted in a large but shrinking U.S. trade deficit each year during 2010–15 (billion dollars) 2010 2011 2012 2013 2014 2015 Exports 14 15 17 17 17 17 Imports 61 56 56 53 52 48
Trade balance -47 -41 -39 -37 -35 -31
Source: USDOC, BEA, Table 2.1, “U.S. International Trade in Services,” Interactive Data, International Data, International Transactions. http://bea.gov/iTable/iTable.cfm?ReqID=62&step=1#reqid=62&step=2&isuri=1&6210=1 (accessed June 16, 2016).
Table B.16: Insurance services: Bermuda was the leading market for U.S. cross-border exports and imports of insurance in 2014 (million dollars) Country/region Exports Country/region Imports Bermuda 3,452 Bermuda 22,893 Canada 2,898 Switzerland 6,319 Japan 2,074 United Kingdom 4,874 United Kingdom 1,906 Ireland 2,909 Mexico 484 Germany 2,733 All other All other
Other Western Hemisphere 2,208 Other Europe 1,459 Other Asia-Pacific 1,996 Other Western Hemisphere 7,888 Other Europe 1,901 Asia-Pacific 906 Africa and the Middle East 431 Africa and the Middle East 105
Total all other 6,536 Total all other 10,358 Total 17,350 Total 50,086
Source: USDOC, BEA, table 2.2., “U.S. Trade in Services, by Type of Service and by Country or Affiliation,” Interactive Data, International Data, International Transactions. http://bea.gov/iTable/iTable.cfm?ReqID=62&step=1#reqid=62&step=2&isuri=1&6210=1 (accessed March 4, 2016).

Appendix B: Data Tables for Figures
172 | www.usitc.gov
Table B.17: Insurance services: In 2014, the United States had its largest cross-border insurance trade deficit with Bermuda (million dollars) Country Exports Trade balance Bermuda 3,452 -19,441 Canada 2,898 2,338 Japan 2,074 1,713 United Kingdom 1,906 -2,968 Mexico 484 444
Source: USDOC, BEA, table 2.2., “U.S. Trade in Services, by Type of Service and by Country or Affiliation,” Interactive Data, International Data, International Transactions. http://bea.gov/iTable/iTable.cfm?ReqID=62&step=1#reqid=62&step=2&isuri=1&6210=1 (accessed March 4, 2016).
Table B.18: Insurance services: Since 2011, services purchased from U.S. affiliates of foreign-owned insurance firms have exceeded services supplied by foreign affiliates of U.S.-owned insurance firms (million dollars) 2009 2010 2011 2012 2013 U.S.-owned foreign affiliates 61,609 58,379 59,942 64,346 64,805 Foreign-owned U.S. affiliates 48,568 52,141 66,284 71,272 69,456
Source: USDOC, BEA, table 3.1, “Services Supplied to Foreign Persons by U.S.MNEs through Their MOFAs, by Industry of Affiliate and by Country of Affiliate,” and table 4.1 “Services Supplied to U.S. Persons by Foreign MNEs through Their MOUSA, by Industry of Affiliate and by Country of UBO,” Interactive Data, International Data, International Transactions. http://bea.gov/iTable/iTable.cfm?ReqID=62&step=1#reqid=62&step=2&isuri=1&6210=1 (both accessed March 4, 2016).
Table B.19: Insurance services: Japan was the largest market for services supplied by foreign affiliates of U.S.-owned insurance firms in 2013 (million dollars) Country Japan 22,644 United Kingdom 8,849 Canada 4,338 Brazil 3,889 Mexico 2,369 All other countries 22,716
Total 64,805
Source: USDOC, BEA, Table 3.1, “Services Supplied to Foreign Persons by U.S.MNEs through Their MOFAs, by Industry of Affiliate and by Country of Affiliate,” Interactive Data, International Data, International Transactions. http://bea.gov/iTable/iTable.cfm?ReqID=62&step=1#reqid=62&step=2&isuri=1&6210=1 (both accessed March 4, 2016).
Table B.20: Securities services: Global investment banking revenues grew in 2014 but are still below their 2007 peak (million dollars) Country 2005 2006 2007 2008 2009 2010 2011 2012 2013 2014 United States 26,955 33,048 36,288 22,848 20,266 28,246 30,834 32,288 38,310 37,712 United Kingdom 5,888 6,906 7,316 5,305 5,094 4,052 3,628 3,514 4,065 4,851 European Union (excluding United Kingdom)
16,141 18,219 20,480 13,504 12,445 11,010 11,900 9,956 11,962 14,798
Japan 3,227 4,439 2,671 2,639 4,410 3,971 2,915 3,045 3,620 3,059 BRICs (Brazil, Russia, India, China)
2,655 4,617 7,266 4,345 5,089 8,388 6,908 6,318 6,043 7,539
Other 9,606 12,319 15,784 11,045 11,369 12,566 13,552 13,790 13249 13596
Source: SIFMA, “2015 Factbook,” 2015, 74. http://www.sifma.org/newsroom/2016/sifma-joins-u_s_-and-eu-entities-urging-ttip-to-include-full-coverage-of-financial-services-to-address-market-fragmentation/.

Recent Trends in U.S. Services Trade: 2016 Annual Report
U.S. International Trade Commission | 173
Table B.21: Securities services: U.S. cross-border trade in securities services resulted in a U.S. trade surplus each year during 2010–15 (billion dollars) 2010 2011 2012 2013 2014 2015 Exports 35 36 32 26 30 28 Imports 8 8 7 7 7 7 Trade balance 27 29 25 19 23 21
Source: USDOC, BEA, Table 3.1, “Services Supplied to Foreign Persons by U.S.MNEs through Their MOFAs, by Industry of Affiliate and by Country of Affiliate,” Interactive Data, International Data, International Transactions. http://bea.gov/iTable/iTable.cfm?ReqID=62&step=1#reqid=62&step=2&isuri=1&6210=1 (both accessed March 4, 2016).
Table B.22: Securities services: Services supplied by foreign affiliates of U.S.-owned firms, and services purchased from U.S. affiliates of foreign-owned firms, both increased slightly in 2013 (million dollars) 2009 2010 2011 2012 2013 U.S.-owned foreign affiliates 116,713 127,847 108,821 99,538 102,261 Foreign-owned U.S. affiliates 55,173 50,496 50,689 53,430 61,791
Source: USDOC, BEA, table 3.1, “Services Supplied to Foreign Persons by U.S.MNEs through Their MOFAs, by Industry of Affiliate and by Country of Affiliate,” and table 4.1, “Services Supplied to U.S. Persons by Foreign MNEs through Their MOUSA, by Industry of Affiliate and by Country of UBO,” Interactive Data, International Data, International Transactions. http://bea.gov/iTable/iTable.cfm?ReqID=62&step=1#reqid=62&step=2&isuri=1&6210=1 (both accessed April 28, 2016).
Table B.23: Securities services: The United Kingdom was the largest market for securities services supplied by U.S.-owned foreign affiliates in 2013 (million dollars) Country United Kingdom 29,382 Canada 5,672 Japan 5,581 Australia 5,487 France 2,995 All other countries 53,144
Total 102,261
Source: USDOC, BEA, table 3.1, “Services Supplied to Foreign Persons by U.S. NMEs through Their MOFAs, by Industry of Affiliate and by Country of Affiliate,” Interactive Data, International Data, International Transactions. http://bea.gov/iTable/iTable.cfm?ReqID=62&step=1#reqid=62&step=2&isuri=1&6210=1 (accessed March 4, 2016). Note: Country-level data for foreign-owned U.S affiliates of banking firms are limited and thus are not included.
