recent trends in rural wages
DESCRIPTION
Recent Trends in Rural Wages: An Analysis of Infl ationary ImplicationsTRANSCRIPT

RECENT TRENDS IN RURAL WAGES: AN ANALYSIS 89 OF INFLATIONARY IMPLICATIONS
Reserve Bank of India Occasional Papers
Vol. 33, No. 1 & 2: 2012
Recent Trends in Rural Wages: An Analysis of Infl ationary Implications
G V Nadhanael*The study looks at the recent increase in rural wages and its implication for infl ation. Using Vector Error Correction Model (VECM), the paper empirically tests for the presence of a wage-price spiral in rural India. The analysis in this paper brings out the following major inferences: (a) increases in real wages have been a recent phenomenon; (b) during 2000-2007 period, real wages remained constant or declined in rural areas and money wages were largely responding to infl ation; (c) since 2007, wage changes are not explained by changes in prices, but wages impact prices as increase in real wages has been feeding into cost of production; (d) MGNREGA wages were higher than market wages for most labour supply states indicating that the pressure on market wages in those states could be signifi cant; (e) the coverage of MGNREGA has remained relatively low to exert pressure from demand arising out of cash transfers and (f) reduced work force participation rates in recent period both on account of increased participation in education and withdrawal of female work force as well as shift of labour away from agriculture could have contributed to labour market tightening and increase in wages. The paper also fi nds that the recent period increase in wages have not resulted in convergence of rural wages across states.
JEL : E24, E31Keywords : Infl ation, Wage-price Spiral, Labour Market Tightening
Introduction
Recent developments in rural wages, especially since 2007 has received much public attention. It has, by now been a well established fact that in the recent years, wages in rural areas have increased at a rate higher than the infl ation thereby contributing to increase in real wages (RBI, 2012). This period is also characterised by the introduction of the Mahatma Gandhi National Rural Employment Guarantee Act (MGNREGA) which provides 100 days of wage employment for one member of a family. It has been argued that MGNREGA has been one of the factors that has contributed to increase in wages (CACP, 2012).
* Research Offi cer, Prices and Monetary Research Division, Department of Economic and Policy Research, Reserve Bank of India, Mumbai. The views expressed in this paper are personal and does not belong to the institution to which the author belong.
90 RESERVE BANK OF INDIA OCCASIONAL PAPERS
While increase in wages could be benefi cial for the rural labourers from a social welfare point of view, sustained increase in wages have a number of macroeconomic implications. First, increase in wages, unaccompanied by productivity increases, could lead to a wage-price spiral, thereby offsetting the positive impact of initial increase in real wages on welfare. Second, the ability of public policy, particularly monetary policy to keep infl ation under control could be limited if there is pressure from wage-price spiral. Also, if increase in wages in one sector leads to subsequent increase in wages across the economy, the competitiveness of the economy could be negatively impacted, if such wage increases are not matched with productivity increases. In this context, the present study looks at the recent trends in wages to identify whether there has been a structural break in the trend in wages and what are the factors that could explain the recent trends. The paper also looks at the inter-state distribution of wage rates so as to understand whether the recent increase in wages could exert more persistent pressure or it could be a one-off shock.
The paper is organised as follows. Following the introduction we look at the major debates on rural wages in India. This is followed by a short section on data sources available on rural wages. Trends in rural wages are analysed in the next section with special focus on the recent period. This is followed by the analysis of factors that could explain the recent trends in rural wages. The implications of increase in wages for infl ation are discussed in the next section followed by conclusions.
Section IIDebates on Trends in Rural Wages in India
The studies in rural wage trends in India started in early 1970s when different scholars tried to analyse the impact of green revolution on rural standard of living. Agricultural wage change was considered an indicator of changes in rural standard of living. A pioneering study on trends in agricultural wages was been undertaken by Bardhan (1970). He found that real wages in Punjab (including Haryana), Delhi and Himachal Pradesh and Western Uttar Pradesh did not show any signifi cant responsiveness to increase in agriculture productivity while

RECENT TRENDS IN RURAL WAGES: AN ANALYSIS 91 OF INFLATIONARY IMPLICATIONS
in Kerala, agricultural wages increased more than proportionately to increase in productivity. After analysing the different possible reasons for this, he came to the conclusion that peasant organisations were the most important factor determining this increase in the level of wages. He also concluded that Green Revolution did not have substantial effects on the rural standard of living because it failed to improve the share of rural agricultural labourers in total produce. Krishnaji (1971) and Jose (1974) made use of Agricultural Wages in India (AWI) data to analyse the movements of money wages and real wages across the States and over time. Studying wage movements of male agricultural labourers, they found that money wages were lagging behind rise in prices. They also concluded that interstate variations in wage rates did widen over time. The general conclusion of these studies was that Green Revolution did not have signifi cant impact on the rural standard of living.
Lall (1976) questioned the fi ndings of the earlier studies and argued that these studies had used AWI data, which is subject to a lot of methodological problems, and the conclusions will be altered if one uses National Sample Survey (NSS) data. Again, selection of mid-1960s as the terminal period in the earlier studies would lead to misleading conclusions as the impact of green revolution was felt only after a lag. Sreedhar (1988) also questioned the use of peak period wage rates as the representative wage rate for the year because the peak wage for each crop differed and the time of peak rate also differed in different States.
Another set of studies, which focused on agricultural wage movements, tried to analyse agricultural wage using a demand and supply framework. The fi rst major study in this framework was done by Herdt and Baker (1972). Using AWI data they tried to analyse the trends in agricultural wages. The study concluded that in India the supply curve of labour was perfectly elastic while the demand curve for labour was negatively sloped. This led to a situation in which increases in the demand for labour pushed up the total employment rather than increasing the wages. The study thus gave some useful insights into the problems of the existence of surplus labour. Using

92 RESERVE BANK OF INDIA OCCASIONAL PAPERS
the data from NSS surveys Lall (1976) argued that wages did operate in a demand-supply framework and responded to agricultural growth. According to the study, decline in rural poverty in the 1970s could be considered as an indicator for improving the rural standard of living in India. He argued that the benefi ts of new technology were shared by both workers and the producers. Acharya (1989) sought to focus on the demand and supply aspects of wage determination. To him there was a decline in real wages during the 1970s, but it was not uniform across States. Effect of poor monsoon, the infl ationary spiral created by oil shock and Bangladesh war were some of the factors found to be affecting the agricultural wages in all the States. Coming to the State-specifi c factors, immobility of people and resources and differential productivity were found to be signifi cant in infl uencing the wage disparities across States.
Srivastava and Singh (2005) focussed on the rate of growth of real wages in agricultural sector in pre-reform and post-reform period and tried to examine the factors affecting the growth in real wages in the two time periods. The study made use of both rural labour enquiry (RLE) and AWI data for the analysis. The paper argued that there had been an increased growth of real wages in agriculture in the pre reform period. But in the post reform period there was a substantial decline in the growth rate of agricultural real wages in poor States though money wages continued to rise. With regard to the determinants of growth rate, the study found that during the post reform period, the agricultural growth variables have a lesser effect on the growth of real wages. Moreover, investments in agriculture have declined. The growth in wages in post reform period was more from the non-farm diversifi cation of workforce than from the growth of the sector itself. Nadhanael (2005) found that agricultural productivity affects growth of wages over time whereas sectoral distribution of labour force is one of the key determinants of wage disparities across states.
Recent works on rural wages have focused on the determinants of sudden increase in rural wages. Gulati et al (2013) found that both ‘push’ and ‘pull’ factors have played a signifi cant role in rising real

RECENT TRENDS IN RURAL WAGES: AN ANALYSIS 93 OF INFLATIONARY IMPLICATIONS
farm wages. However, the impact of growth variables was much higher than MGNREGA. Datta et al (2012) found that the MGNREGA wages remain more or less equal with the rural wages in majority of the states and therefore, the role of MGNREGA in pushing up market wages may be limited. Majority of these studies, however, remain silent about the infl ationary implications of this sudden increase in wages.
Section IIIData sources on Rural Wages
There are fi ve different sources from which data on rural wages are available. They are Agricultural Wages in India (AWI), Rural Labour Enquiry (RLE), National Sample Survey Organisation (NSSO) surveys on Employment and Unemployment, Wage Rates in Rural India (WRRI) and Commission on Agriculture Costs and Prices (CACP) Studies. Before analysing the trends in rural wages, it would be worthwhile to summarise the characteristics of the data available from various sources.
The studies in the 1970s and 1980s mostly used the AWI database as it was the principal data source available. The data is published by the Directorate of Economics and Statistics in two publications viz., Agricultural Situation in India (monthly publication) and annual publication of Agricultural Wages in India. AWI data has, however, always been used by researchers with a precaution. The data is collected without adequate conceptual clarity or proper data collection methodology (Rao, 1972; Himanshu, 2005; and Sharma, 2001; Chavan and Rajashree, 2006). There is no clear defi nition of wage or worker given by AWI data. There is also no well-defi ned method to convert kind wages to cash wages.
Rural Labour Enquiry and NSSO are other major sources of data for agricultural and rural wages in India which are compiled from the quinquennial employment and unemployment survey conducted by the NSSO. The data are available only with a gap of fi ve to six years, and therefore is less suitable for analysing the trends over the period due to the problems of end-point comparison (Baby, 1996). However, this data source is considered to be superior to AWI because of its defi nitional clarity in concepts used and better sampling methodology (Lall, 1976).
94 RESERVE BANK OF INDIA OCCASIONAL PAPERS
It is to be noted that the concept of wage earnings as defi ned in RLE/NSSO is the total sum of earnings received in cash and kind (kind being converted into money value) on a current weekly status (employment status of the seven days preceding the date of survey). Earnings in kind include recurring perquisites like food grains, cooked meals, fuel, tobacco etc. and also housing, clothes, shoes, bonus etc. which is non-recurring perquisites. Rural retail price is used for converting kind wages into monetary equivalence (Labour Bureau, 2004).
Costs of cultivation studies, which are an extension of earlier Farm Management Studies, also provide data on wages. The wage rates obtained through these studies are based on a better sampling and estimation technique and are considered as superior to other data sources. However, cost of cultivation studies do not publish the wage estimates on a regular basis. Moreover, there have been changes overtime with respect to the number of crops included in the cost of cultivation studies. Though several independent scholars have tried to work out the wage rates using the CACP studies, lack of data in a published format still act as a problem for using these to analyse the trends in wages.
The Technical Working Group on Rural Retail Prices, set up by the NSSO in 1976 to revise the estimates of Consumer Price Index of Agricultural Labourers (CPI-AL) recommended that wage data of rural workers are to be collected on a continuous basis. Though the data collection started from 1986-87, due to the questions about the veracity of data it was not published till 1998. The wage data are collected on a monthly basis from around 600 villages spread over 66 NSSO defi ned agro-climatic regions of different states. From 1998 onwards, the data is available in the monthly publication of Indian Labour Journal.
The above review of data sources on rural wages in India brings out the conclusion that the data available from the labour bureau survey of wage rates in rural India could serve as the appropriate database for analysis. The only drawback of this data source is that it is not available for years prior to 1998. Also for our analysis of overall wage movements, we restrict our focus only on the trends in wages of rural unskilled labourers (male) on account of the following reasons. First averaging
RECENT TRENDS IN RURAL WAGES: AN ANALYSIS 95 OF INFLATIONARY IMPLICATIONS
of agricultural wages across occupations may not be meaningful given the seasonal characteristics of agricultural occupations. Also, unskilled labourers have the least bargaining power in the rural areas and therefore, the trends in their wages could be representative of the movements in subsistence wages. Finally, given the greater inter-connectedness of rural labour markets, analysis of wage trends in a single occupation which provides consistent information could be more desirable. For the present analysis, we use data from June 2000 as the all India aggregated data for period 1998-2000 is not comparable with the later data due to changes in methodology of aggregation.
Section IVTrends in Rural Wages in India
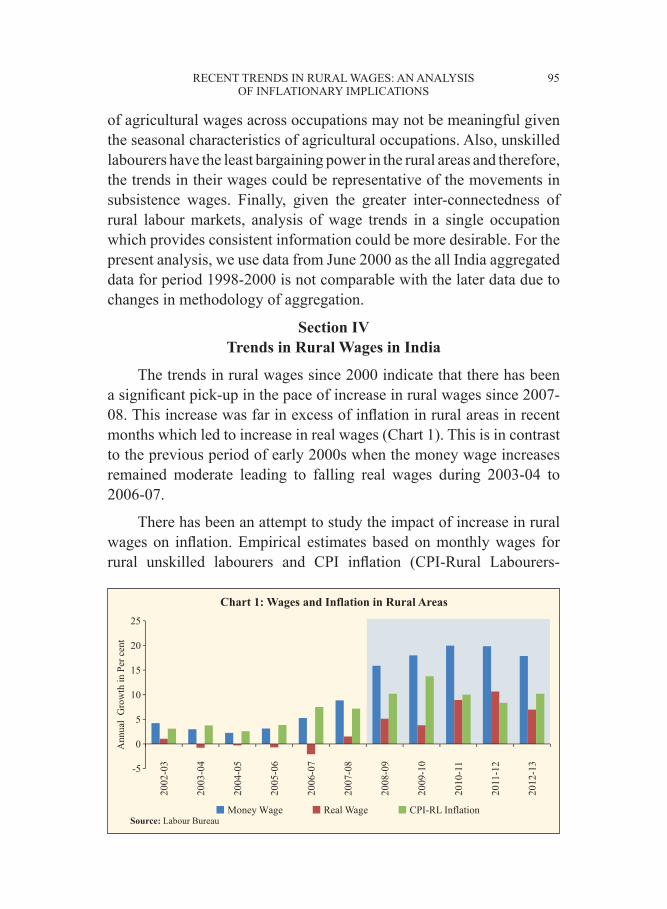
The trends in rural wages since 2000 indicate that there has been a signifi cant pick-up in the pace of increase in rural wages since 2007-08. This increase was far in excess of infl ation in rural areas in recent months which led to increase in real wages (Chart 1). This is in contrast to the previous period of early 2000s when the money wage increases remained moderate leading to falling real wages during 2003-04 to 2006-07.
There has been an attempt to study the impact of increase in rural wages on infl ation. Empirical estimates based on monthly wages for rural unskilled labourers and CPI infl ation (CPI-Rural Labourers-

96 RESERVE BANK OF INDIA OCCASIONAL PAPERS
RL), using granger causality indicated that there is a bi-directional causality between wage infl ation and price infl ation implying that there is evidence of a wage-price spiral (RBI Annual Report 2011-12, Box: II.8).
This analysis however, presumes that the underlying trend in both wages and infl ation has not undergone any major change over the entire period of analysis. However, as we saw above, there has been a signifi cant change in the behaviour of money wages in the recent years. Therefore, one may have to look for the structural break in the wages and infl ation and then estimate the relationship separately for the different regimes. Therefore, we fi rst empirically test for the structural break in wage series. Though there are a number of methods to identify the structural break within the series, most of the conventional methodologies like the ‘Chow test’ require the researcher to make prior assumptions regarding the timing of the structural break. Recent work by Bai and Perron (2003) however, help to estimate and test for structural breaks in a time series endogenously rather than one based on exogenous information. This reduces the risk of specifi cation error by the researcher while making judgement on the timing of structural break. The methodology considers all possible combination of breaks in the series to select that point which minimises the sum of squared residuals in the full-sample. We use the methodology proposed by Bai and Perron (2003) to identify the structural break in wage data1. From a time series point of view, though there could be multiple breaks present in the series but we are interested in the most signifi cant break in the wage series and therefore, the test was conducted by imposing a restriction of a single structural break. The result of structural break test is provided in Table 2.
We see that there is a signifi cant break in the money wage growth since July 2007, a comparison of the coeffi cient of time (growth rate as the specifi cation is log linear) is almost fi ve times higher in the second period as compared to the fi rst. It may noted that this is the period of large scale implementation of MGNREGA which could be a regime change in terms of the overall rural labour market. Therefore, analysing
1 See Balakrishnan and Parameswaran (2007) for a detailed discussion on use of Bai-perron structural break test.

RECENT TRENDS IN RURAL WAGES: AN ANALYSIS 97 OF INFLATIONARY IMPLICATIONS
Table 2: Test for Structural Break in Money Wage Growth
Dependent Variable: Log of Money WageSequential F-statistic determined breaks: 1
Break Test F-statistic ScaledF-statistic
CriticalValue**
0 vs. 1 * 8024.672 16049.34 14.34
* Signifi cant at the 0.01 level.** Bai-Perron (2003) critical values.
Break dates: 2007M07
Variable Coeffi cient Std. Error t-Statistic Prob.
2000M07 - 2007M06
C 3.892824 0.003640 1069.450 0.0000@TREND 0.002910 5.21E-05 55.83045 0.0000
2007M07 - 2012M11 -- 65 obs
C 2.656859 0.010815 245.6573 0.0000@TREND 0.014381 7.66E-05 187.8268 0.0000
the wage-price linkage in these two periods in a combined way may lead to distorted results as these two periods are characterised by two distinct regimes.
The earlier study has used granger causality test to see the link between wages and infl ation. However, the granger causality is usually conducted in a stationary series by differencing the non-stationary series. This entails a signifi cant loss of information. Moreover, if the series are co-integrated in levels, the granger causality on differenced series may not represent the underlying long-term relation between the variables. In this context, we look at the wages and prices (as represented by price index) at levels to see whether they exhibit stable relationships over the two different regimes.
Section VEstimation of Wage-Price Linkage
The approach to empirical estimation in the paper for understanding the link between wages and infl ation follows the cointegration analysis by estimating long-run relationship between the variables and the short-run dynamics employing vector error correction model (VECM). First,
98 RESERVE BANK OF INDIA OCCASIONAL PAPERS
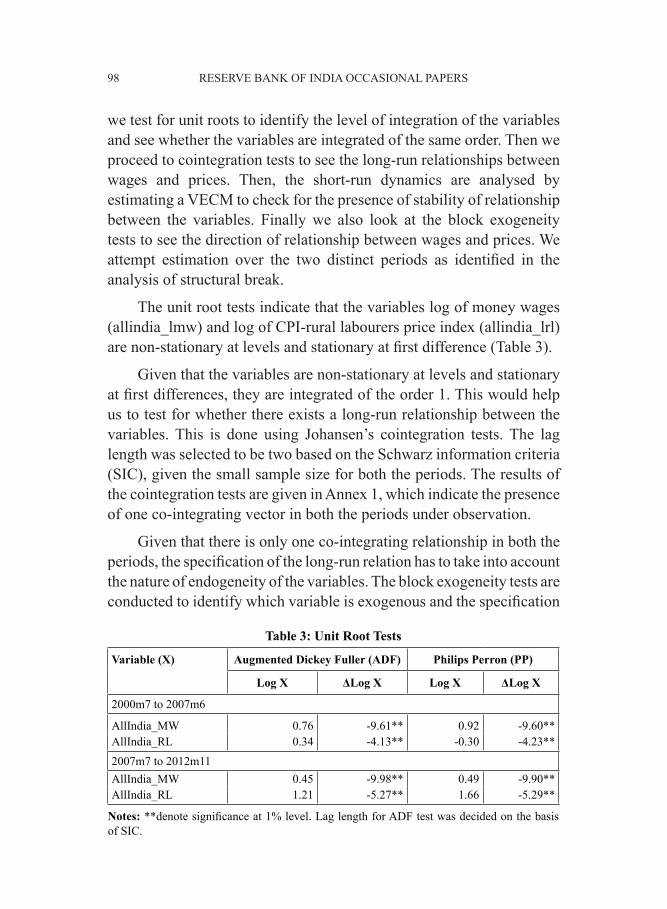
we test for unit roots to identify the level of integration of the variables and see whether the variables are integrated of the same order. Then we proceed to cointegration tests to see the long-run relationships between wages and prices. Then, the short-run dynamics are analysed by estimating a VECM to check for the presence of stability of relationship between the variables. Finally we also look at the block exogeneity tests to see the direction of relationship between wages and prices. We attempt estimation over the two distinct periods as identifi ed in the analysis of structural break.
The unit root tests indicate that the variables log of money wages (allindia_lmw) and log of CPI-rural labourers price index (allindia_lrl) are non-stationary at levels and stationary at fi rst difference (Table 3).
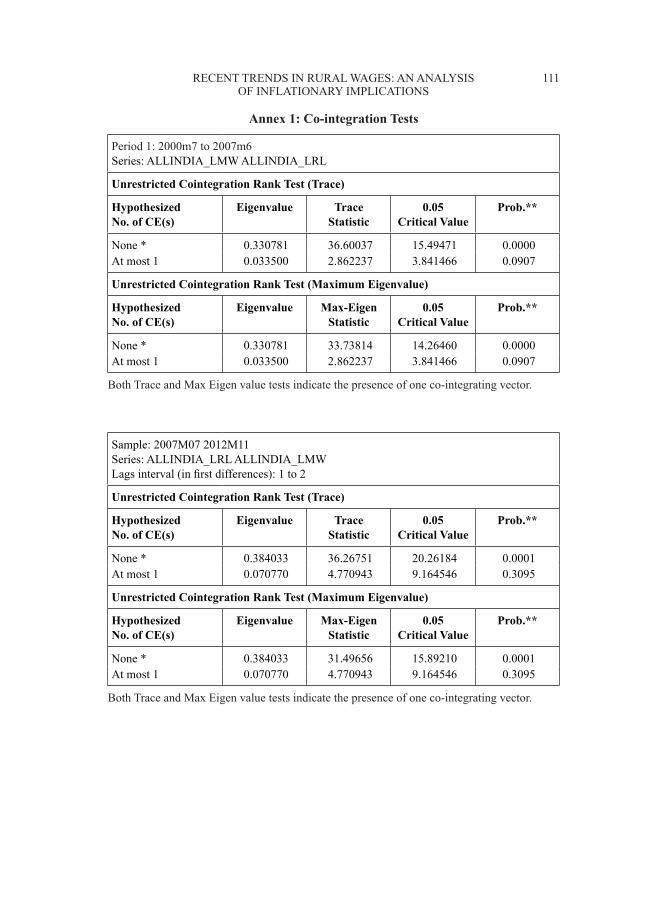
Given that the variables are non-stationary at levels and stationary at fi rst differences, they are integrated of the order 1. This would help us to test for whether there exists a long-run relationship between the variables. This is done using Johansen’s cointegration tests. The lag length was selected to be two based on the Schwarz information criteria (SIC), given the small sample size for both the periods. The results of the cointegration tests are given in Annex 1, which indicate the presence of one co-integrating vector in both the periods under observation.
Given that there is only one co-integrating relationship in both the periods, the specifi cation of the long-run relation has to take into account the nature of endogeneity of the variables. The block exogeneity tests are conducted to identify which variable is exogenous and the specifi cation
Table 3: Unit Root Tests
Variable (X) Augmented Dickey Fuller (ADF) Philips Perron (PP)
Log X ΔLog X Log X ΔLog X
2000m7 to 2007m6
AllIndia_MW 0.76 -9.61** 0.92 -9.60**AllIndia_RL 0.34 -4.13** -0.30 -4.23**2007m7 to 2012m11AllIndia_MW 0.45 -9.98** 0.49 -9.90**AllIndia_RL 1.21 -5.27** 1.66 -5.29**
Notes: **denote signifi cance at 1% level. Lag length for ADF test was decided on the basis of SIC.

RECENT TRENDS IN RURAL WAGES: AN ANALYSIS 99 OF INFLATIONARY IMPLICATIONS
is formulated appropriately. The results of Wald exogeneity tests for both the periods are presented in Annex 2.
The block exogeneity tests indicate that the long-run relationship in the fi rst period could be specifi ed as one where money wages is the dependant variable and CPI-RL as the explanatory variable. In the second period, the relationship reverses and CPI-RL turn out to be the dependant variable and money wage turn out to be the explanatory variable. The specifi cation and estimated results both for the co-integrating equation and the error correction equation are given below. The lag length for short run equation was selected on the basis of SIC.
ECM Specifi cationVariables: Y=log (Money Wage), X=log (CPI-RL)
Period 1: July 2000 to June 2007
Long run equation:Yt =α11 +
β11 Xt + μ1t …. (1)Short run equation:ΔYt = σ1 + γ11ΔYt-1 +γ12 ΔYt-2+ λ11 ΔXt-1 + λ12 ΔXt-2+ θ1μ1t-1 +ε1t …. (2)
Period 2: July 2007 to November 2012
Long run equation:Xt =α21 +
β21 Yt + μ2t …. (3)Short run equation:ΔXt= σ2 + λ21 ΔXt-1 + λ22 ΔXt-2+ γ21ΔYt-1 +γ22 ΔYt-2+ θ2μ2t-1 +ε1t …. (4)
ECM ResultsPeriod 1: July 2000 to June 2007
Long run equation: Yt =1.24 + 0.91Xt Adj R2=0.99t value (2.3) (-28.6) Short run equation: ΔYt = 0.0 + 0.16ΔYt-1 +0.18 ΔYt-2+ 0.36ΔXt-1 -0.56ΔXt-2-0.49μ1t-1 Adj R2=0.27t value (1.3) (1.6) (1.8) (1.4) (-2.3) (-5.4) Period 2: July 2007 to November 2012
100 RESERVE BANK OF INDIA OCCASIONAL PAPERS
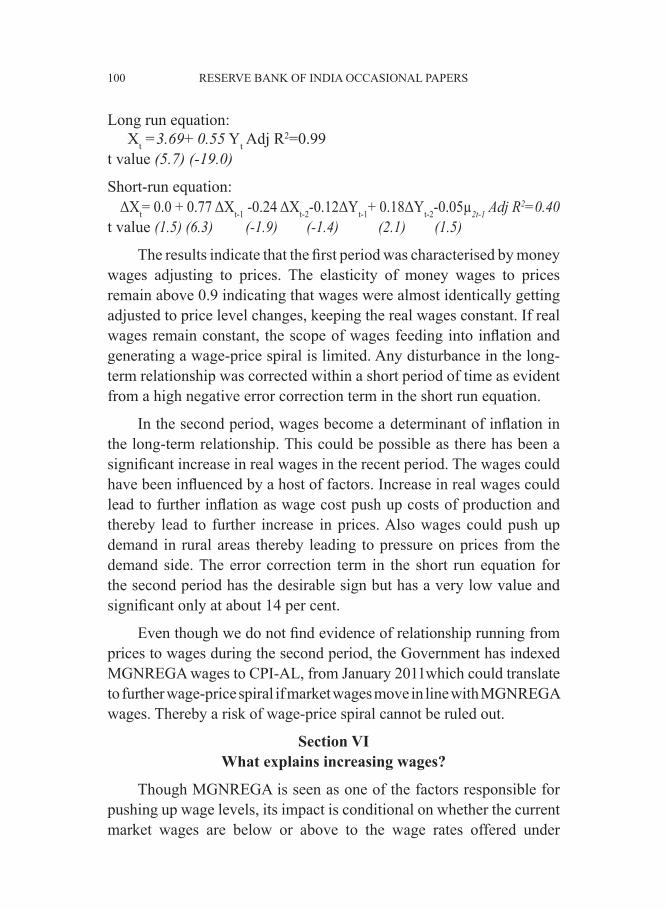
Long run equation: Xt =3.69+ 0.55 Yt Adj R2=0.99t value (5.7) (-19.0)
Short-run equation: ΔXt= 0.0 + 0.77 ΔXt-1 -0.24 ΔXt-2-0.12ΔYt-1+ 0.18ΔYt-2-0.05μ2t-1 Adj R2=0.40
t value (1.5) (6.3) (-1.9) (-1.4) (2.1) (1.5)
The results indicate that the fi rst period was characterised by money wages adjusting to prices. The elasticity of money wages to prices remain above 0.9 indicating that wages were almost identically getting adjusted to price level changes, keeping the real wages constant. If real wages remain constant, the scope of wages feeding into infl ation and generating a wage-price spiral is limited. Any disturbance in the long-term relationship was corrected within a short period of time as evident from a high negative error correction term in the short run equation.
In the second period, wages become a determinant of infl ation in the long-term relationship. This could be possible as there has been a signifi cant increase in real wages in the recent period. The wages could have been infl uenced by a host of factors. Increase in real wages could lead to further infl ation as wage cost push up costs of production and thereby lead to further increase in prices. Also wages could push up demand in rural areas thereby leading to pressure on prices from the demand side. The error correction term in the short run equation for the second period has the desirable sign but has a very low value and signifi cant only at about 14 per cent.
Even though we do not fi nd evidence of relationship running from prices to wages during the second period, the Government has indexed MGNREGA wages to CPI-AL, from January 2011which could translate to further wage-price spiral if market wages move in line with MGNREGA wages. Thereby a risk of wage-price spiral cannot be ruled out.
Section VIWhat explains increasing wages?
Though MGNREGA is seen as one of the factors responsible for pushing up wage levels, its impact is conditional on whether the current market wages are below or above to the wage rates offered under
RECENT TRENDS IN RURAL WAGES: AN ANALYSIS 101 OF INFLATIONARY IMPLICATIONS
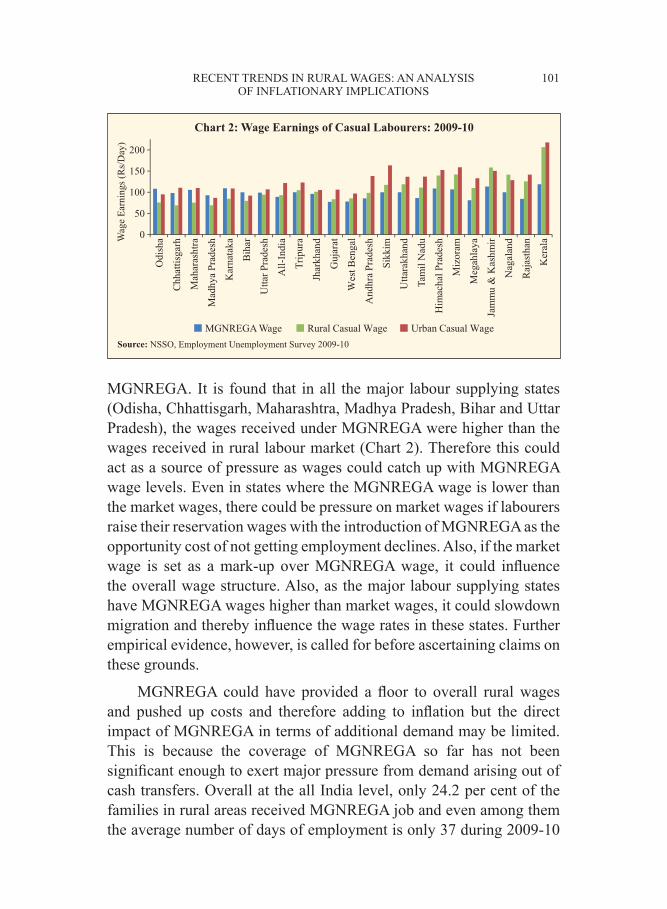
MGNREGA. It is found that in all the major labour supplying states (Odisha, Chhattisgarh, Maharashtra, Madhya Pradesh, Bihar and Uttar Pradesh), the wages received under MGNREGA were higher than the wages received in rural labour market (Chart 2). Therefore this could act as a source of pressure as wages could catch up with MGNREGA wage levels. Even in states where the MGNREGA wage is lower than the market wages, there could be pressure on market wages if labourers raise their reservation wages with the introduction of MGNREGA as the opportunity cost of not getting employment declines. Also, if the market wage is set as a mark-up over MGNREGA wage, it could infl uence the overall wage structure. Also, as the major labour supplying states have MGNREGA wages higher than market wages, it could slowdown migration and thereby infl uence the wage rates in these states. Further empirical evidence, however, is called for before ascertaining claims on these grounds.
MGNREGA could have provided a fl oor to overall rural wages and pushed up costs and therefore adding to infl ation but the direct impact of MGNREGA in terms of additional demand may be limited. This is because the coverage of MGNREGA so far has not been signifi cant enough to exert major pressure from demand arising out of cash transfers. Overall at the all India level, only 24.2 per cent of the families in rural areas received MGNREGA job and even among them the average number of days of employment is only 37 during 2009-10

102 RESERVE BANK OF INDIA OCCASIONAL PAPERS
(Chart 3). It is seen that in most states, the number of families covered under MGNREGA is low (less than 50 per cent of rural families) and the number of days of employment under MGNREGA is also much lower than the offer of 100 days of employment.
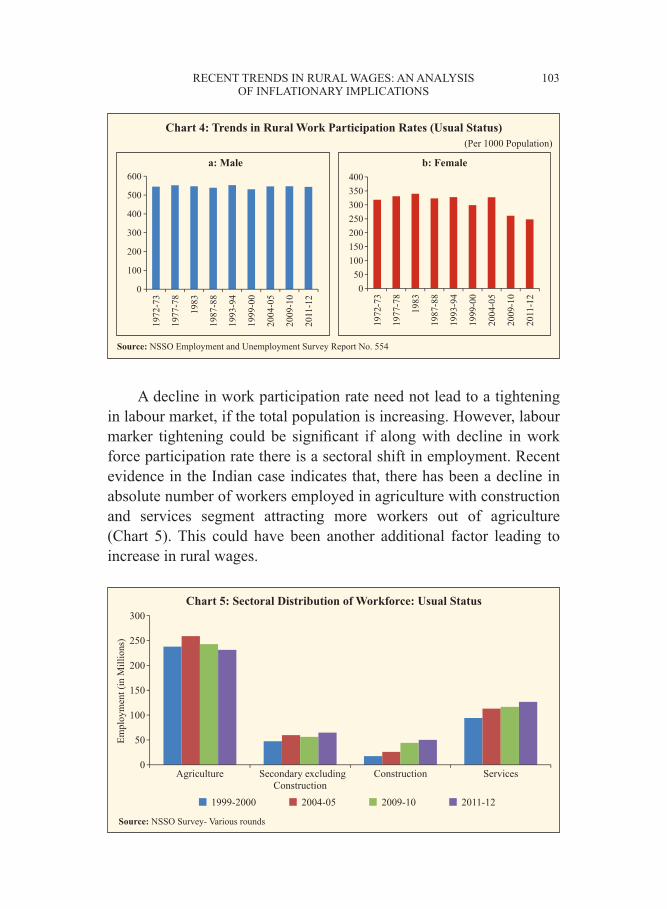
Apart from the impact of higher infl ation and institutional factors such as MGNREGA on wages, another factor which could have infl uenced the overall wage structure in the rural areas in the recent period is the trends in work force participation rates (WPR). It has been found that there has been a signifi cant decline in work force participation among women in most age groups (Chart 4a&b). Among men, though overall work participation remains almost stable, within the age group of 15-24 there is a signifi cant fall in WPR. Improved educational facilities could explain the withdrawal of young population from work force while decline in female work force participation could be part of the overall development process where with economic development; there is a decline in female work force participation initially before increasing again (the ‘U’ shaped pattern as referred to in the economic theory). It is also recognised that declining work force participation among women could also be an effect of increasing wages (and therefore increasing welfare) and therefore it would be diffi cult to establish a one way relationship between increasing wages and work force participation.
RECENT TRENDS IN RURAL WAGES: AN ANALYSIS 103 OF INFLATIONARY IMPLICATIONS
A decline in work participation rate need not lead to a tightening in labour market, if the total population is increasing. However, labour marker tightening could be signifi cant if along with decline in work force participation rate there is a sectoral shift in employment. Recent evidence in the Indian case indicates that, there has been a decline in absolute number of workers employed in agriculture with construction and services segment attracting more workers out of agriculture (Chart 5). This could have been another additional factor leading to increase in rural wages.

104 RESERVE BANK OF INDIA OCCASIONAL PAPERS
Section VIIHas wages converged in the recent period?
As there has been a signifi cant increase in rural wages since 2007, one critical aspect could be whether this period is also associated with convergence of wage rates across different states. Given that the MGNREGA provides near-uniform wage rates across the states, the low wage states are expected to have a larger pressure from MGNREGA scheme on market wages as compared to the high wage states. On the other hand, if the increase in wages is driven by a reduction in labour supply, or that the market wage is set as a mark-up over the statutory wage, the pressure on wages could be similar in different states. Therefore, identifying whether the wages have converged across states in the recent period could provide important insights into whether the pressure from wages could be temporary or more persistent.
The co-effi cient of variation of wages across 20 major states for the period under study is plotted in Chart 6. The chart indicate an increase in variability since 2007 which could indicate that the convergence of wage rates did not occur during the period of high wage infl ation.
Following the convergence literature in economic growth, we test for wage convergence across states. Two common ways to assess convergence in the literature is Sigma (σ) convergence and Beta (β)

RECENT TRENDS IN RURAL WAGES: AN ANALYSIS 105 OF INFLATIONARY IMPLICATIONS
convergence. Under σ convergence, if the measure of dispersion of wage across regions declines over time, it could be concluded that the wages are converging and vice-versa. The empirical estimation of σ convergence could be attempted by regressing the measure of variation (co-effi cient of variation in the present case) over time. A positive and signifi cant coeffi cient for time variable (t) would imply divergence and negative and signifi cant coeffi cient for t would denote divergence. The estimated results are:
CV_Wage = 39.9** - 0.018**t (period 2000m7 to 2007m6)
CV_Wage = 30.65** + 0.062**t (period 2007m7 to 2012m11)
** Signfi cant at 1 per cent
The results indicate that in the fi rst period wages exhibited convergence whereas in the second period wages exhibited divergence.
β convergence is estimated by regressing the growth rate of wages over the initial values. The specifi cation of the regression equation takes the form
Wgi=α+ βWit
where Wgi is the growth rate of wage in state i over the time period under observation and Wit is the initial wage level in the state. If wages are converging, then the low wage states should have a faster growth than high wage states. This would imply a negative relationship between the initial levels and the growth rates. We have estimated trend growth of wages in each state for both the periods using a log linear specifi cation for both the periods. Subsequently, we have regressed the estimated growth rates over the initial wage levels. The estimated results for both the period are as:
Wg=0.037**-0.00W2000 (period 2000m7 to 2007m6)
Wg=0.014**+0.00W2007 (period 2000m7 to 2007m6) N=20
The β convergence results presented here do not show evidence of either convergence or divergence. The limited number of observations could be a major limitation is estimating β convergence.

106 RESERVE BANK OF INDIA OCCASIONAL PAPERS
Section VIIIImpact of Rising Wages on Cost of Production
In order to understand the infl ationary implications of rising wages, one has to also look at the contribution of wage costs to overall cost of production. Using the limited data available from the CACP reports, we have tried to see how the increase in wages would impact the cost of production. We have computed the share of labour cost in total operational cost for key food items by taking paddy as representative item for cereals, tur (arhar) for pulses and groundnut for oilseeds. The data indicate that labour cost account for a majority of the operational cost in all the crops (Table 4).
Given that labour cost constitute the most important operational cost, the increase in cost of production has been dominated by rising wages. Other costs to production have also gone up signifi cantly in the recent period. However, a comparative analysis of trends in cost of
Table 4: Share of Labour Cost in Total Operational Cost during 2010-11
Paddy Tur (Arhar) Groundnut
States Share in %
States Share in %
States Share in %
Andhra Pradesh 57.1 Andhra Pradesh 51.5 Andhra Pradesh 51.9Assam 60.6 Bihar 60.2 Gujarat 29.6Bihar 60.9 Gujarat 44.2 Karnataka 44.7Chhattisgarh 45.5 Karnataka 47.5 Maharashtra 43.6Gujarat 48.4 Madhya Pradesh 51.0 Odisha 58.8Haryana 54.4 Maharashtra 47.6 Tamil Nadu 54.6Himachal Pradesh 61.8 Odisha 63.3Jharkhand 57.5 Tamil Nadu 61.3Karnataka 51.4 Uttar Pradesh 40.1Kerala 54.9Madhya Pradesh 49.3Maharashtra 50.1Odisha 64.5Punjab 43.8Tamil Nadu 47.2Uttar Pradesh 48.4Uttarakhand 40.1West Bengal 63.2
RECENT TRENDS IN RURAL WAGES: AN ANALYSIS 107 OF INFLATIONARY IMPLICATIONS
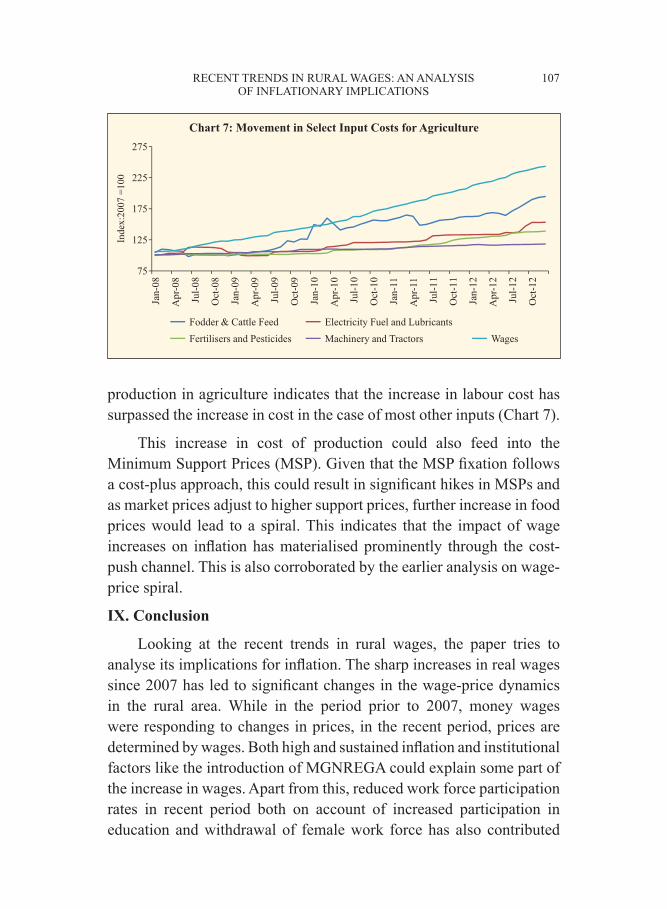
production in agriculture indicates that the increase in labour cost has surpassed the increase in cost in the case of most other inputs (Chart 7).
This increase in cost of production could also feed into the Minimum Support Prices (MSP). Given that the MSP fi xation follows a cost-plus approach, this could result in signifi cant hikes in MSPs and as market prices adjust to higher support prices, further increase in food prices would lead to a spiral. This indicates that the impact of wage increases on infl ation has materialised prominently through the cost-push channel. This is also corroborated by the earlier analysis on wage-price spiral.
IX. Conclusion
Looking at the recent trends in rural wages, the paper tries to analyse its implications for infl ation. The sharp increases in real wages since 2007 has led to signifi cant changes in the wage-price dynamics in the rural area. While in the period prior to 2007, money wages were responding to changes in prices, in the recent period, prices are determined by wages. Both high and sustained infl ation and institutional factors like the introduction of MGNREGA could explain some part of the increase in wages. Apart from this, reduced work force participation rates in recent period both on account of increased participation in education and withdrawal of female work force has also contributed
108 RESERVE BANK OF INDIA OCCASIONAL PAPERS
to labour market tightening and increase in wages. There has also been a shift of labour away from agriculture, further contributing to labour market tightening. State-wise analysis indicates that wages have not converged in the recent period, despite signifi cant increase in wages. This could be on account of signifi cant pressure on market wages even in high wage states. The pressure on infl ation from rising wages has been mostly from the cost-push side, given the dominant contribution of increasing wage costs to overall cost of production. This calls for raising agricultural productivity to reduce unit labour costs, so as to enable a real wage growth environment in a non-infl ationary manner.
The present study does not empirically test the impact of MGNREGA on rural wages. However, given that the MGNREGA wages are indexed to rural infl ation, this could lead to a potential wage-price spiral as the fi nding indicates that in the recent period causality runs from wages to prices. Also, MGNREGA wages were found to be higher than market wages for most labour supply states indicating that the pressure on market wages in those states could be signifi cant. However, it is also recognised that the coverage of MGNREGA has remained relatively low which could limit the demand pressures. This calls for future work in terms of exploring the possibility of exploring variations in wages across states on the dimensions of participation rates in MGNREGA; the differences in the MGNREGA wage and the market wage as well as indicators of structural changes in rural labour market.
RECENT TRENDS IN RURAL WAGES: AN ANALYSIS 109 OF INFLATIONARY IMPLICATIONS
References
Acharya, S. (1989), “Agriculture Wages in India: A Disaggragated Analysis”, Indian Journal of Agricultural Economics, Vol. 44, No.2.
Baby, A.A. (1996), Trends in Agricultural Wages in Kerala, Occasional Paper Series Centre for Development Studies, Trivandrum.
Balakrishnan, Pulapre and M. Parameswaran (2007), “Understanding Economic Growth in India: A Prerequisite” Economic and Political Weekly, Vol - 42 No. 27-28, July 14.
Bardhan, P.K. (1970), “The Green Revolution and Agricultural Laborers”, Economic and Political Weekly, Special Number, July 1970.
Chavan, P. and B. Rajshree (2006), “Trends in Agricultural Wages in India”, Economic and Political Weekly, Vol. 41, No.38
CACP (2012), “Report of the Commission on Agricutural Costs and Prices, Khariff, 2012”, Government of India.
Dutta. Puja, Rinku Murgai, Martin Ravallion and Dominique van de Walle (2012), “Does India‘s Employment Guarantee Scheme Guarantee Employment?” World Bank Policy Research Working Paper 6003.
Gulati. Ashok, Surbhi Jain and Nidhi Satija (2013) “Rising Farm Wages in India The ‘Pull’ and ‘Push’ Factors” CACP, Department of Agriculture and Co-operation, Government of India
Herdt, R.W. and Baker, E.A. (1972), “Agricultural Wages Production and High Yielding Varieties” Economic and Political Weekly, Vol. 7, No. 13.
Himanshu (2005), “Wages in Rural India: Sources, Trends and Comparability”, Indian Journal of Labour Economics, Vol. 48, Number 2, April-June.
Jose A.V. (1974), “Trends in Real Wage Rates of Agricultural Labourers” Economic and Political Weekly Vol. 9, No. 13.
Jushan Bai and Pierre Perron, (2003). “Computation and analysis of multiple structural change models,” Journal of Applied Econometrics, Vol. 18 No 1 pages 1-22.
110 RESERVE BANK OF INDIA OCCASIONAL PAPERS
Krishnaji, N. (1971), “Wages of Agricultural Labourers”, Economic and Political Weekly Vol. 6, No. 39.
Labour Bureau (2004), Rural Labour Enquiry Report on Employment and Unemployment of rural Labour Households 1999-2000, Ministry of Labour Government of India, Shimla.
Lall, D. (1976), “Agricultural Growth: Real Wages and the Rural Poor in India” Economic and Political Weekly, Vol. 11, No. 26.
Nadhanael, G. V (2005), “Wages and Earnings of Agricultural Labourers in India: An Inter- State Analysis”, M.Phil Dissertation submitted to the Jawaharlal Nehru University, Centre for Development Studies, Thiruvananthapuram (unpublished).
Rao, V.M. (1972), “Agricultural Wages in India: A Reliability Analysis” Indian Journal of Agricultural Economics. Vol 8, No.2.
Reserve Bank of India (RBI), (2012) “Macroeconomic and Monetary Developments in India 2011-12”.
Sreedhar,V. (1988) “Agricultural Wages in TamilNadu 1950-51 to 1980-81”, MPhil Dissertation Submitted to JNU, Centre for Development Studies, Trivandrum (Unpublished).
Srivastava, R and R. Singh (2005) “Economic Reforms and Agricultural Wages in India” Indian Journal of Labour Economics Vol. 51. No.3.
Sharma, H.R. (2001), “Employment and Wage Earnings of Agricultural Labourers: A State wise Analysis” The Indian Journal of Labour Economics, Vol. 44, No.1.
RECENT TRENDS IN RURAL WAGES: AN ANALYSIS 111 OF INFLATIONARY IMPLICATIONS
Annex 1: Co-integration Tests
Period 1: 2000m7 to 2007m6Series: ALLINDIA_LMW ALLINDIA_LRL
Unrestricted Cointegration Rank Test (Trace)
HypothesizedNo. of CE(s)
Eigenvalue TraceStatistic
0.05Critical Value
Prob.**
None * 0.330781 36.60037 15.49471 0.0000At most 1 0.033500 2.862237 3.841466 0.0907
Unrestricted Cointegration Rank Test (Maximum Eigenvalue)
HypothesizedNo. of CE(s)
Eigenvalue Max-EigenStatistic
0.05Critical Value
Prob.**
None * 0.330781 33.73814 14.26460 0.0000At most 1 0.033500 2.862237 3.841466 0.0907
Both Trace and Max Eigen value tests indicate the presence of one co-integrating vector.
Sample: 2007M07 2012M11Series: ALLINDIA_LRL ALLINDIA_LMWLags interval (in fi rst differences): 1 to 2
Unrestricted Cointegration Rank Test (Trace)
HypothesizedNo. of CE(s)
Eigenvalue TraceStatistic
0.05Critical Value
Prob.**
None * 0.384033 36.26751 20.26184 0.0001At most 1 0.070770 4.770943 9.164546 0.3095
Unrestricted Cointegration Rank Test (Maximum Eigenvalue)
HypothesizedNo. of CE(s)
Eigenvalue Max-EigenStatistic
0.05Critical Value
Prob.**
None * 0.384033 31.49656 15.89210 0.0001At most 1 0.070770 4.770943 9.164546 0.3095
Both Trace and Max Eigen value tests indicate the presence of one co-integrating vector.

112 RESERVE BANK OF INDIA OCCASIONAL PAPERS
Annex 2: VEC Granger Causality/Block Exogeneity Wald Tests
Sample: 2000M07 2007M06
Dependent variable: D(ALLINDIA_LMW)
Excluded Chi-sq df Prob.
D(ALLINDIA_LRL) 5.300195 2 0.0706All 5.300195 2 0.0706
Dependent variable: D(ALLINDIA_LRL)
Excluded Chi-sq df Prob.
D(ALLINDIA_LMW) 1.074988 2 0.5842All 1.074988 2 0.5842
Sample: 2007M07 2012M11
Dependent variable: D(ALLINDIA_LMW)
Excluded Chi-sq df Prob.
D(ALLINDIA_LRL) 3.556590 2 0.1689All 3.556590 2 0.1689
Dependent variable: D(ALLINDIA_LRL)
Excluded Chi-sq df Prob.
D(ALLINDIA_LMW) 7.320708 2 0.0257All 7.320708 2 0.0257