job contact networks and wages of rural-urban migrants in - iza
TRANSCRIPT

DI
SC
US
SI
ON
P
AP
ER
S
ER
IE
S
Forschungsinstitut zur Zukunft der ArbeitInstitute for the Study of Labor
Job Contact Networks and Wages of Rural-Urban Migrants in China
IZA DP No. 7577
August 2013
Wenjin LongSimon AppletonLina Song

Job Contact Networks and Wages of Rural-Urban Migrants in China
Wenjin Long University of Nottingham
Simon Appleton University of Nottingham
and IZA
Lina Song University of Nottingham
and IZA
Discussion Paper No. 7577 August 2013
IZA
P.O. Box 7240 53072 Bonn
Germany
Phone: +49-228-3894-0 Fax: +49-228-3894-180
E-mail: [email protected]
Any opinions expressed here are those of the author(s) and not those of IZA. Research published in this series may include views on policy, but the institute itself takes no institutional policy positions. The IZA research network is committed to the IZA Guiding Principles of Research Integrity. The Institute for the Study of Labor (IZA) in Bonn is a local and virtual international research center and a place of communication between science, politics and business. IZA is an independent nonprofit organization supported by Deutsche Post Foundation. The center is associated with the University of Bonn and offers a stimulating research environment through its international network, workshops and conferences, data service, project support, research visits and doctoral program. IZA engages in (i) original and internationally competitive research in all fields of labor economics, (ii) development of policy concepts, and (iii) dissemination of research results and concepts to the interested public. IZA Discussion Papers often represent preliminary work and are circulated to encourage discussion. Citation of such a paper should account for its provisional character. A revised version may be available directly from the author.

IZA Discussion Paper No. 7577 August 2013
ABSTRACT
Job Contact Networks and Wages of Rural-Urban Migrants in China* In nationally representative household data from the 2008 wave of the Rural to Urban Migration in China survey, nearly two thirds of rural-urban migrants found their employment through family members, relatives, friends or acquaintances. This paper investigates why the use of social network to find jobs is so prevalent among rural-urban migrants in China, and whether migrants face a wage penalty as a result of adopting this job search method. We find evidence of positive selection effects of the use of networks on wages. Users of networks tend to be older, to have migrated longer ago and to be less educated. In addition, married workers and those from villages with more out-migrant are more likely to use networks, while those without local residential registration status are less likely. Controlling for selectivity, we find a large negative impact of network use on wages. Using job contacts brings open access to urban employment, but at the cost of markedly lower wages. JEL Classification: J24, J31, O15 Keywords: social network, job contact, wage, rural-urban migrants, switching regression,
China Corresponding author: Wenjin Long School of Contemporary Chinese Studies Jubilee Campus, University of Nottingham Nottingham, NG8 1BB United Kingdom E-mail: [email protected]
* We thank Yanjie Bian, Yucheng Liang, Xiaoyuan Dong and participants at the International Network for Social Network Analysis Conference 2013 and the Brow Bag seminar at School of Contemporary Chinese Studies, University of Nottingham for helpful comments. Financial support from ESRC under Grant RES-238-25-0035 is gratefully acknowledged.

1 Introduction
There has been increased interest in the role of social networks and relationsin economic development. Following Coleman (1988),``social capital"" has beenhypothesised to be a determinant of productivity, much as human capital was earlieradded to the conventional factors of production (land, labour and capital). Socialcapital has variously been understood as norms of behaviour such as ``trust"" thatmay underpin economic relations or as ``networks"" of contacts that may provide thevaluable economic information. Early empirical studies often found large economicbenefits to social capital, for example, for household income in rural Tanzania(Narayan and Pritchett, 1999); for manufacturing productivity in Ghana (Barr,2000); or agricultural traders in Madagascar (Fafchamps and Minten, 2002). Thesignificant role of job contacts in obtaining employment has long been recognised,although what is less well understood is the possible effects on subsequent wagesor labour productivity of using such networks. In this paper, we estimate the effectof using social networks on the wages of migrants in urban China.
Much as the general literature on social capital focussed on productivity benefits,theoretical models of labour markets often predict beneficial effects on wages fromusing job contacts. In line with the ``social capital as networks"" interpretation,using job contacts may give job searchers more information about opportunities andensure a better matching of workers to jobs, translating into higher wages for usersof networks (Montgomery, 1991; Mortensen and Vishwanath, 1994). Additionally,following the ``social capital as trust"" approach, those who find jobs by usingcontacts may feel additional peer pressure to perform and thus attain higherproductivity and wages (Kandel and Lazear, 1992). However, while positive wageeffects from using job contacts are sometimes found, this is far from universal andhas led to consideration being given as to why using job contacts may appearto lower wages (Delattre and Sabatier, 2007). One explanation centres aroundtraining costs (Pellizzari, 2010). Firms may only be able to expend extra effort inusing formal means of filling posts (for example, advertising or using recruitmentagencies), rather than informal means (using social networks). Consequently, theuse of formal means of filling posts will be more common where the costs of theposts remaining unfilled are high, as is likely to be the case with posts with hightraining costs (and consequent high wages). A second explanation centres aroundjob seeker impatience: those keen to find employment quickly may use job contacts,sacrificing potentially higher wages from better matched posts for quicker entryinto work (Bentolila et al., 2010).
Given the ambiguous theoretical predictions about the impact of using jobcontacts on subsequent wages, it is worthwhile to test the hypothesis empirically.However, while it is straightforward to measure the correlation between the use of
3
job contacts and subsequent wages, one must be cautious about drawing causalinferences from this due to unobservables that may affect both use of social networksand labour market outcomes (Mouw, 2006). Users of job contacts typically differfrom non-users in various observed characteristics - for example, they are oftenolder. They may also differ in unobserved characteristics. If they are found tohave higher (or lower) wages than non-users, the suspicion arises that this maysimply reflect higher (or lower) unobserved productivity. In order to control for thepossible selectivity of use of job contacts, we employ a switching regression modelof wages.
We focus on the impact of using social network on labour market outcomesfor rural-urban migrants in China. This is an interesting case to study, not onlybecause rural-urban migration in China is the largest human movement in thehistory of the world in terms of quantity, but also because migrants in China cannotaccess to institutional assistance from government at destinations. They are oftenforced to rely on using their social contacts to find work but the effect of this onlabour market outcomes in China is not yet well understood.
Our intention in this study is to answer three main questions. First, whatdetermines whether rural-urban migrants use contacts to find employment? Second,is the use of job contacts endogenous to wages: that is to ask, are the unobservableswhich influence job search methods related to those which determine wages? Third,what is the causal effect of using job contacts on subsequent wages: do usersof networks enjoy higher or lower wages than non-users, ceteris paribus? Thesequestions may have implications for policy - for example, people would questionthe existence of public employment agencies if social network has a positive impacton job search and wages (Delattre and Sabatier, 2007). Conversely, in the Chinesecontext, if using networks appears to incur a wage penalty, it may spur policy-makers to find ways to increase rural people's access to formal means of findingurban jobs.
The structure of the remainder of the paper is as follows. Section 2 reviewsthe literature, focusing on the measures of social networks and on methods foridentifying their effects on labour market outcomes. Section 3 describes the dataand the switching regressions model to be estimated. Section 4 reports descriptivestatistics while Section 5 presents the econometric results. Section 6 concludes.
2 Literature review
There are a great number of studies on the relationship between the social networksand labour market outcomes. Studies may disagree because they analyse differentcontexts or use different data-sets. However, they may also disagree for twomethodological reasons. First, studies use different proxies to measure social
4

networks. Second, studies employ different econometric models to estimate therelation between social networks and labour market outcomes. Consequently, inthis section, we will discuss the measures of social network and the econometricmethods commonly used in the literature.
2.1 Measures of social network
Recent literature has mainly focused on econometric methods and tended toneglect the issue of the measurement of social networks. However, using differentmeasures of social network may result in different estimates of the relation betweensocial networks and labour market outcomes. Obtaining agreement on suitableeconometric methods only and ignoring the definition of social network may stilllead to incomparable estimates.
Zhang and Li (2003) ) equate guanxi to social networks and define three typesof guanxi for migrants: receiving help from relative or family member during theprocess of finding a job; having contacts outside the region or receiving remittancetransactions from non-resident family members; having family member who arecadres.
Giulietti et al. (2010) use direct measures of social network, including both thequality and quantity of contacts. The size of the social network is measured as thetotal number of people living in cities that the migrant greeted during last SpringFestival. The quality of social network is a dummy variable which equal to 1 if thefirst supporter is currently employed.
Mouw (2010) uses the number of relatives in the U.S. to measure Hispanicworkers' social capital. Wahba and Zenou (2005) use population density as a proxyfor the size of social network and use the unemployment rate as a proxy for thequality of social network.
Chen (2011) reviews three kinds of social network: 1) using contacts as socialcapital, which focuses on the treatment effects of using contacts or social networkson individuals' labour market outcomes; 2) used social capital, which refers toquantity or quality of social resources already mobilized or used from a certainhelper(s); 3) accessed social capital or network social capital, which concerns thequantity or quality of the social resources to which the respondent has access.
This study uses the first of Chen's three definitions of social network: the useof contacts to find jobs. This is the most common measure of social networks usedin labour market studies and makes our analysis easy readily comparable with thework of other researchers.
5

2.2 Models exploring the relation between social networkand wages
The most common method to explore the relationship between social network andwages is to estimate an Ordinary Least Squares wage equation which includes a ex-planatory variable that measures social networks (see Aguilera (2005); Granovetter(1973, 1983); Montgomery (1991); Bian (1997) and Zhang and Li (2003). Forexample, it is common to include in the wage equation a dummy variable thatequals to 1 when people use their social network to find jobs. The coefficient of thisdummy variable captures the level effect of using social networks. An assumptionof this method is the restriction of the coefficient to be the same for users of socialnetwork and non-users of social network, which might be not true in reality.
Another problem with OLS estimation is that there might be endogeneity bias,with users of social networks differing from non-users in unobserved characteristicsthat affect wages. For example, migrants with high skills may be more likelyto choose market-methods. Such a bias is to be expected if the use of socialnetwork to find a job is correlated with the expectation of labour market outcomes(Giulietti et al., 2011).Omitted variables that are positively correlated with bothsocial network and earnings may lead to overestimation of the effect of networkson wages. This potential endogeneity must be addressed and several methods havebeen applied to do this.
Random assignment including social and natural experiments is the best wayto correct self-selection bias (Mouw, 2006). Beaman and Magruder (2012) createshort-term jobs in a laboratory to investigate who gets job referrals. They askevery participant to refer a friend who is most suitable for the job. Thus the typeof referral contract and amount offered is randomised and selection bias is avoided.Khan and Lehrer (2013) try to identify the effects of changes of social networks onemployment by using the random assignment method.
Using panel data is another way to eliminate unobserved fixed effects (Battuet al., 2011; Yakubovich, 2005). However, the use of panel data may depend onthe definition of social network. For example, Knight and Yueh (2008) use ChineseCommunist Party membership and the number of close contacts of the respondentas measures of social capital. They admit that panel data might fail to explorethe effect of social capital on labour market as CCP membership and the numberof close contacts does not vary much over time or may even be time-invariant formany observations.
Where experimental or panel data are not available, endogeneity concerns aretypically addressed by modelling the selection process - whether or not migrantsuse social networks - and building a model of labour market outcomes that con-trols for the selectivity. Instrumental variable methods (IV), treatment effectsmodel, Heckman's Sample Selection model, endogenous switching regression model,
6

propensity score matching (Ye et al., 2012), and structural equation model (SEM)are typical methods to discover the selection process with non-experimental crosssectional data.
With most of these methods, finding an appropriate instrumental variable forthe use of social networks on wages is a common problem in practice. The distancefrom home village to destination might be a potential instrumental variable forsocial network. However, Zhang and Zhao (2013) argue that migrant wages will becorrelated with the distance from home village to destination as migrants face anincome-distance trade-off.
Both the treatment effects model and the Heckman selection model are two-stage processes. The first stage uses a probit model on the full data. They thencalculate an inverse Mills ratio (non-selection hazard rate) for selected samples and(with the treatment effects model) selection hazard rate for unselected samples.The hazard rate variable is then used as an additional regressor in the second stagemodel of wage determination. Both approaches can be estimated by either themaximum likelihood method or by a two-step method. The difference between theHeckman selection model and the treatment effects model is that the former onlyuses the selected sample whereas the latter uses the full sample but restricts theuse of social networks to have only a shift effect on wages Fraser (2009).
The switching regression uses the Heckman two-stage procedure twice, one forselected sample and the other for the unselected sample. Like the treatment effectsmodel, the switching regression estimates effect of networks on wages directly usingthe full sample. However, it relaxes the assumption that the effect is only a shifteffect and, like the Heckman sample selection model, does not restrict users andnon-users to having the same coefficients in the wage equations. Studies usingswitching regressions include Delattre and Sabatier (2007) and Liang (2010).
In this paper, we use the switching regression approach as the best method forinvestigating the effect of social networks on wages available for non-experimentalcross-sectional data.
7

3 Data and methodology
3.1 Data
The empirical analysis is based on the first wave of the Rural to Urban Migrationin China survey (RUMIC 20081). This survey was conducted in 2008 and includesapproximately 5,000 rural-urban migrant households. Samples were randomlychosen in the fifteen migrant destination cities nationally. The dataset includesdetailed information about socio-demographic characteristics, labour market out-comes, health conditions, major life events and social network information. Ouranalysis is based on 5453 employed migrant workers, aged 16-60 years old.
Our focus in this paper is on real wages, defined to include bonuses, allowancesand income in-kind. Results from the survey are reported in Dmurger and Li(2012), Qu and Zhao (2011) and Meng et al. (2010).
Granovetter (1974) notes that individuals may use several methods to find ajob and only one method leads to success. But the dataset we use only ask themain source of job finding. The dataset does not have variables about informationflows between employers, contacts, and employees, so we are limited in what wecan analyse about the process of job search.
3.2 Endogenous Switching Regression Model
The endogenous switching regression is used to estimate the relation between usingof social network and wages, controlling for self-selection bias. The endogenousswitching regression can predict the expected outcome for users of social networkwho self-selected in to non-users of social network and vice versa (Dutoit, 2007;Lokshin and Sajaia, 2004; Powers, 2007). This methods has proved to be usefulin dealing with endogeneity from self-selection by Adamchik and Bedi (2000)and Heitmueller (2006). OLS regression and treatment effects model will also beestimated to give comparisons and gauge robustness.
Let Z\ast denote a latent variable for the propensity to use social networks withthe following index function:
Z\ast = W\gamma + \upsilon , \upsilon \sim N(0, \sigma 2\upsilon )
Z = 1 if Z\ast > 0, Z = 0 otherwise
1The Longitudinal Survey on Rural Urban Migration in China (RUMiC) consists of three parts:the Urban Household Survey, the Rural Household Survey and the Migrant Household Survey.It was initiated by a group of researchers at the Australian National University, the Universityof Queensland and the Beijing Normal University and was supported by the Institute for theStudy of Labor (IZA), which provides the Scientific Use Files. The financial support for RUMiCwas obtained from the Australian Research Council, the Australian Agency for InternationalDevelopment (AusAID), the Ford Foundation, IZA and the Chinese Foundation of Social Sciences.
8

where Z = 1 if the individual chooses social networks to find a job and Z = 0otherwise. Z\ast can be estimated using models for binary data. Let Y1 be theearnings for users of social networks and let Y0 be the earnings for non-users ofsocial networks.
Y1 = X1\beta 1 + \mu 1, \mu 1 \sim N(0, \sigma 21) if Z = 1
and
Y0 = X0\beta 0 + \mu 0 , \mu 0 \sim N(0, \sigma 20) if Z = 0
That is, we observe Y1 when Z = 1, in which case Y0 is unobserved, latent, ormissing. Similarly, we observe Y0 when Z = 0, in which case Y1 is missing. Notethat in practice, we observe sample respondents in only one state Z = 1 or Z = 0.
Assume that \upsilon , \mu 1, \mu 0 have a trivariate normal distribution with mean vectorzero and covariance matrix:
\Omega =
\left[ \sigma 2\upsilon \sigma 1\upsilon \sigma 0\upsilon
\sigma 1\upsilon \sigma 21 .
\sigma 0\upsilon . \sigma 20
\right] where \sigma 2
\upsilon is a variance of the error term in the selection equation. We can assumethat \sigma 2
\upsilon = 1 . \sigma 21 and \sigma 2
0 are variances of the error terms in the wage equations. \sigma 1\upsilon
is a covariance of \mu 1 and \upsilon , and \sigma 0\upsilon is a covariance of \mu 0 and \upsilon . The covariancebetween \mu 1 and \mu 0 is not defined, as Y1 and Y0 are never observed simultaneously.
The model presented above is referred to as an endogenous switching regressionsmodel. It is used to address issues of self-selection.
Using direct maximum likelihood methods, the log-likelihood function associatedwith our model is written as
logL =\sum Z=1
[log \Phi (\eta 1) - 1
2\{ log(2\pi \sigma 1\upsilon ) - (
Y - X\beta 1
\sigma 1
)2\} ]
+\sum Z=0
[log \Phi (\eta 0) - 1
2\{ log(2\pi \sigma 0\upsilon ) - (
Y - X\beta 0
\sigma 0
)2\} ]
where
\eta 1 =W\gamma + (Y - X\beta 1)\sigma 1\upsilon /\sigma
21\sqrt{}
1 - \rho 21\upsilon
and
9
\eta 0 =W\gamma + (Y - X\beta 0)\sigma 0\upsilon /\sigma
20\sqrt{}
1 - \rho 20\upsilon
Note:
\rho 0\upsilon =\sigma 20\upsilon
\sigma 0\sigma \upsilon
=\sigma 0\upsilon
\sigma 0
is the correlation coefficient between \mu 0 and \upsilon .
\rho 1\upsilon =\sigma 21\upsilon
\sigma 1\sigma \upsilon
=\sigma 1\upsilon
\sigma 1
is the correlation coefficient between \mu 1 and \upsilon .
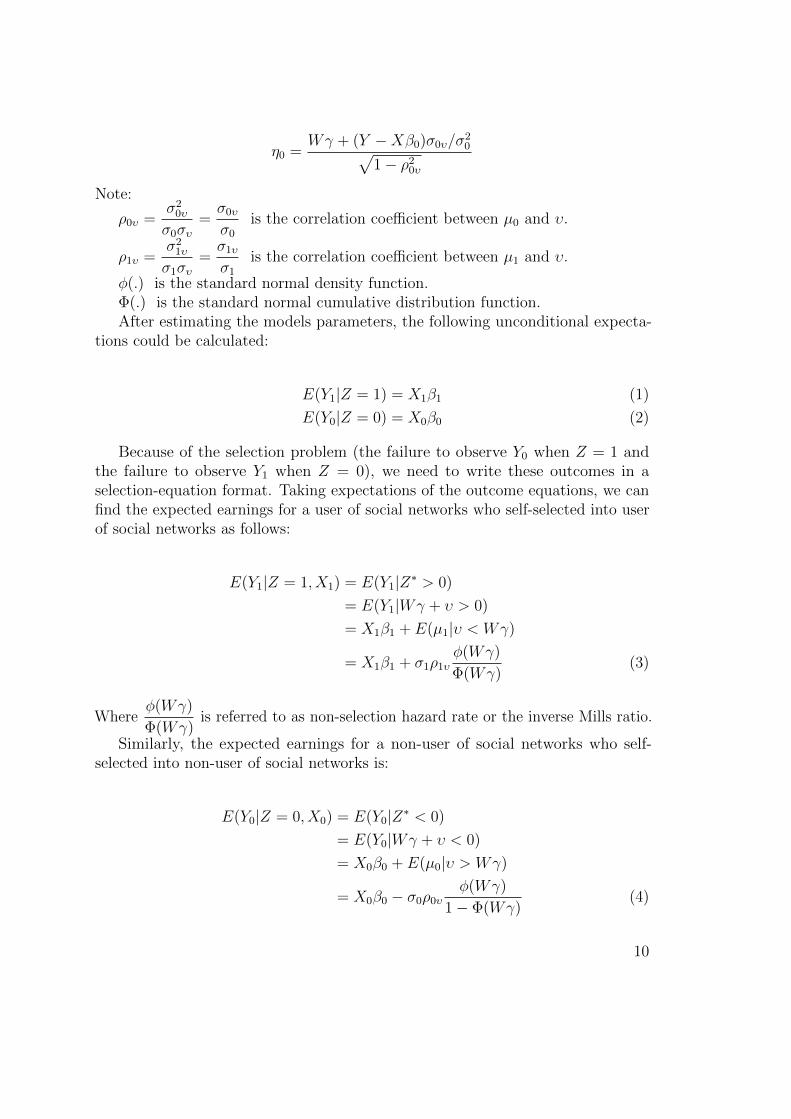
\phi (.) is the standard normal density function.\Phi (.) is the standard normal cumulative distribution function.After estimating the models parameters, the following unconditional expecta-
tions could be calculated:
E(Y1| Z = 1) = X1\beta 1 (1)
E(Y0| Z = 0) = X0\beta 0 (2)
Because of the selection problem (the failure to observe Y0 when Z = 1 andthe failure to observe Y1 when Z = 0), we need to write these outcomes in aselection-equation format. Taking expectations of the outcome equations, we canfind the expected earnings for a user of social networks who self-selected into userof social networks as follows:
E(Y1| Z = 1, X1) = E(Y1| Z\ast > 0)
= E(Y1| W\gamma + \upsilon > 0)
= X1\beta 1 + E(\mu 1| \upsilon < W\gamma )
= X1\beta 1 + \sigma 1\rho 1\upsilon \phi (W\gamma )
\Phi (W\gamma )(3)
Where\phi (W\gamma )
\Phi (W\gamma )is referred to as non-selection hazard rate or the inverse Mills ratio.
Similarly, the expected earnings for a non-user of social networks who self-selected into non-user of social networks is:
E(Y0| Z = 0, X0) = E(Y0| Z\ast < 0)
= E(Y0| W\gamma + \upsilon < 0)
= X0\beta 0 + E(\mu 0| \upsilon > W\gamma )
= X0\beta 0 - \sigma 0\rho 0\upsilon \phi (W\gamma )
1 - \Phi (W\gamma )(4)
10
Where\phi (W\gamma )
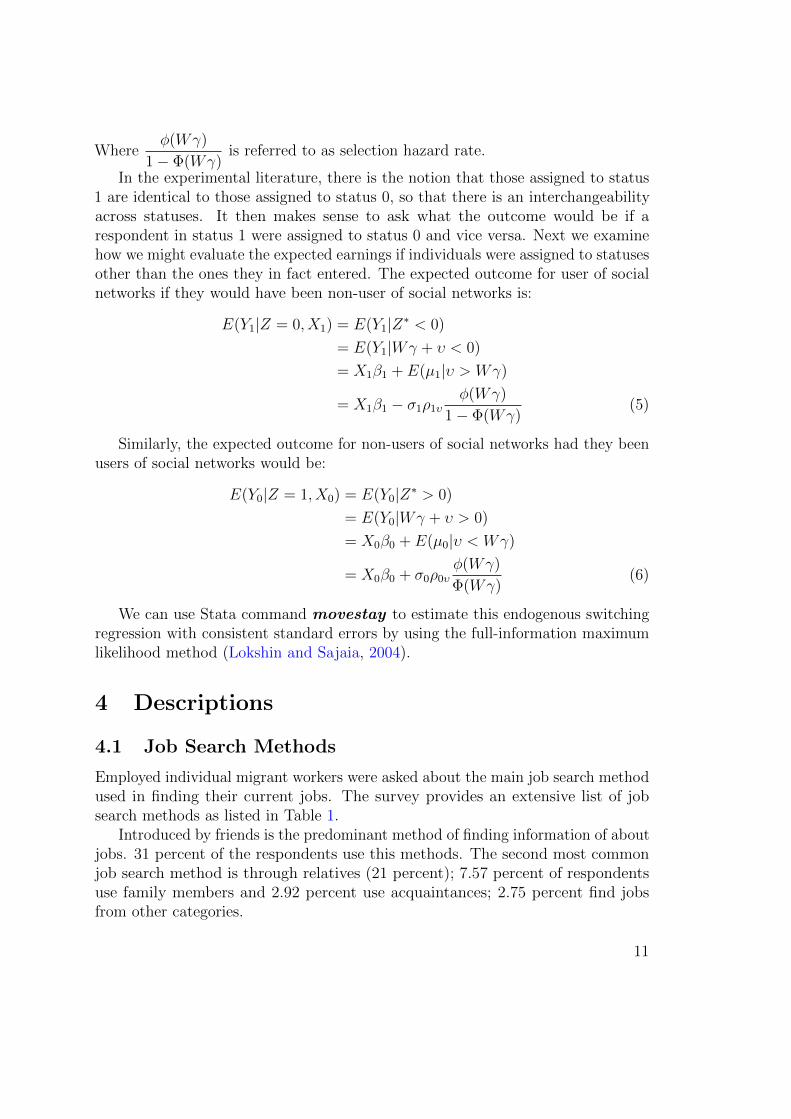
1 - \Phi (W\gamma )is referred to as selection hazard rate.
In the experimental literature, there is the notion that those assigned to status1 are identical to those assigned to status 0, so that there is an interchangeabilityacross statuses. It then makes sense to ask what the outcome would be if arespondent in status 1 were assigned to status 0 and vice versa. Next we examinehow we might evaluate the expected earnings if individuals were assigned to statusesother than the ones they in fact entered. The expected outcome for user of socialnetworks if they would have been non-user of social networks is:
E(Y1| Z = 0, X1) = E(Y1| Z\ast < 0)
= E(Y1| W\gamma + \upsilon < 0)
= X1\beta 1 + E(\mu 1| \upsilon > W\gamma )
= X1\beta 1 - \sigma 1\rho 1\upsilon \phi (W\gamma )
1 - \Phi (W\gamma )(5)
Similarly, the expected outcome for non-users of social networks had they beenusers of social networks would be:
E(Y0| Z = 1, X0) = E(Y0| Z\ast > 0)
= E(Y0| W\gamma + \upsilon > 0)
= X0\beta 0 + E(\mu 0| \upsilon < W\gamma )
= X0\beta 0 + \sigma 0\rho 0\upsilon \phi (W\gamma )
\Phi (W\gamma )(6)
We can use Stata command movestay to estimate this endogenous switchingregression with consistent standard errors by using the full-information maximumlikelihood method (Lokshin and Sajaia, 2004).
4 Descriptions
4.1 Job Search Methods
Employed individual migrant workers were asked about the main job search methodused in finding their current jobs. The survey provides an extensive list of jobsearch methods as listed in Table 1.
Introduced by friends is the predominant method of finding information of aboutjobs. 31 percent of the respondents use this methods. The second most commonjob search method is through relatives (21 percent); 7.57 percent of respondentsuse family members and 2.92 percent use acquaintances; 2.75 percent find jobsfrom other categories.
11
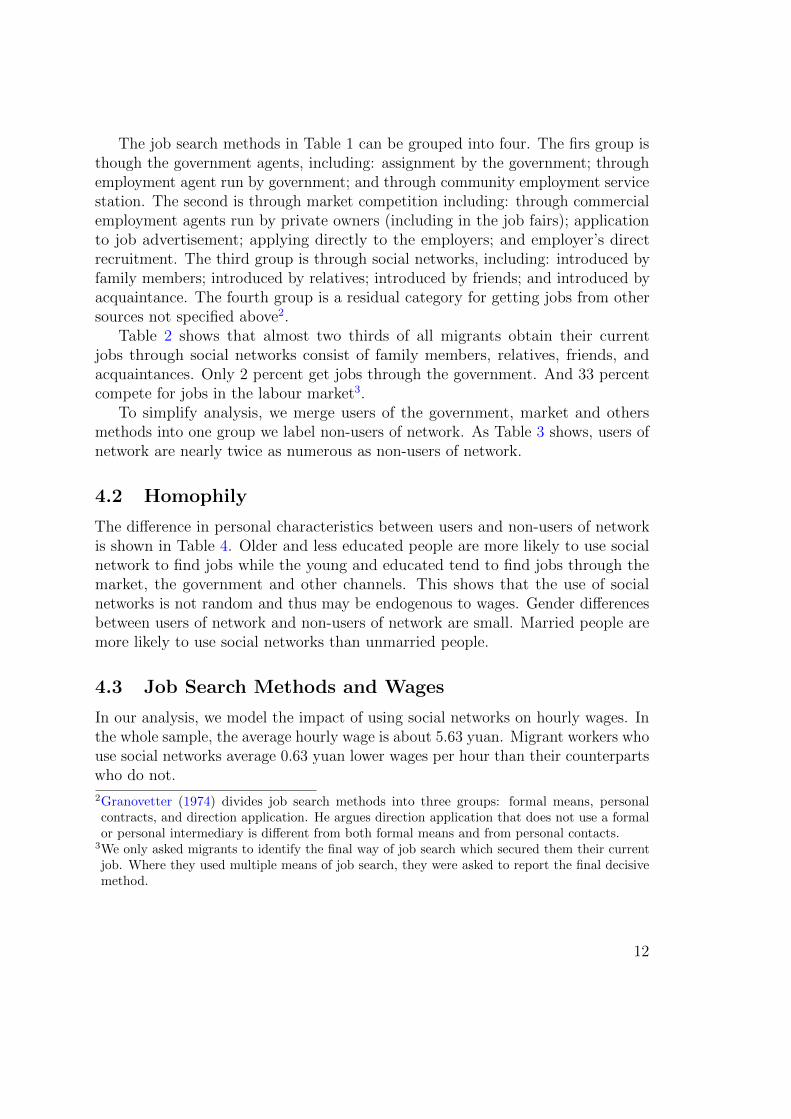
The job search methods in Table 1 can be grouped into four. The firs group isthough the government agents, including: assignment by the government; throughemployment agent run by government; and through community employment servicestation. The second is through market competition including: through commercialemployment agents run by private owners (including in the job fairs); applicationto job advertisement; applying directly to the employers; and employer's directrecruitment. The third group is through social networks, including: introduced byfamily members; introduced by relatives; introduced by friends; and introduced byacquaintance. The fourth group is a residual category for getting jobs from othersources not specified above2.
Table 2 shows that almost two thirds of all migrants obtain their currentjobs through social networks consist of family members, relatives, friends, andacquaintances. Only 2 percent get jobs through the government. And 33 percentcompete for jobs in the labour market3.
To simplify analysis, we merge users of the government, market and othersmethods into one group we label non-users of network. As Table 3 shows, users ofnetwork are nearly twice as numerous as non-users of network.
4.2 Homophily
The difference in personal characteristics between users and non-users of networkis shown in Table 4. Older and less educated people are more likely to use socialnetwork to find jobs while the young and educated tend to find jobs through themarket, the government and other channels. This shows that the use of socialnetworks is not random and thus may be endogenous to wages. Gender differencesbetween users of network and non-users of network are small. Married people aremore likely to use social networks than unmarried people.
4.3 Job Search Methods and Wages
In our analysis, we model the impact of using social networks on hourly wages. Inthe whole sample, the average hourly wage is about 5.63 yuan. Migrant workers whouse social networks average 0.63 yuan lower wages per hour than their counterpartswho do not.
2Granovetter (1974) divides job search methods into three groups: formal means, personalcontracts, and direction application. He argues direction application that does not use a formalor personal intermediary is different from both formal means and from personal contacts.
3We only asked migrants to identify the final way of job search which secured them their currentjob. Where they used multiple means of job search, they were asked to report the final decisivemethod.
12
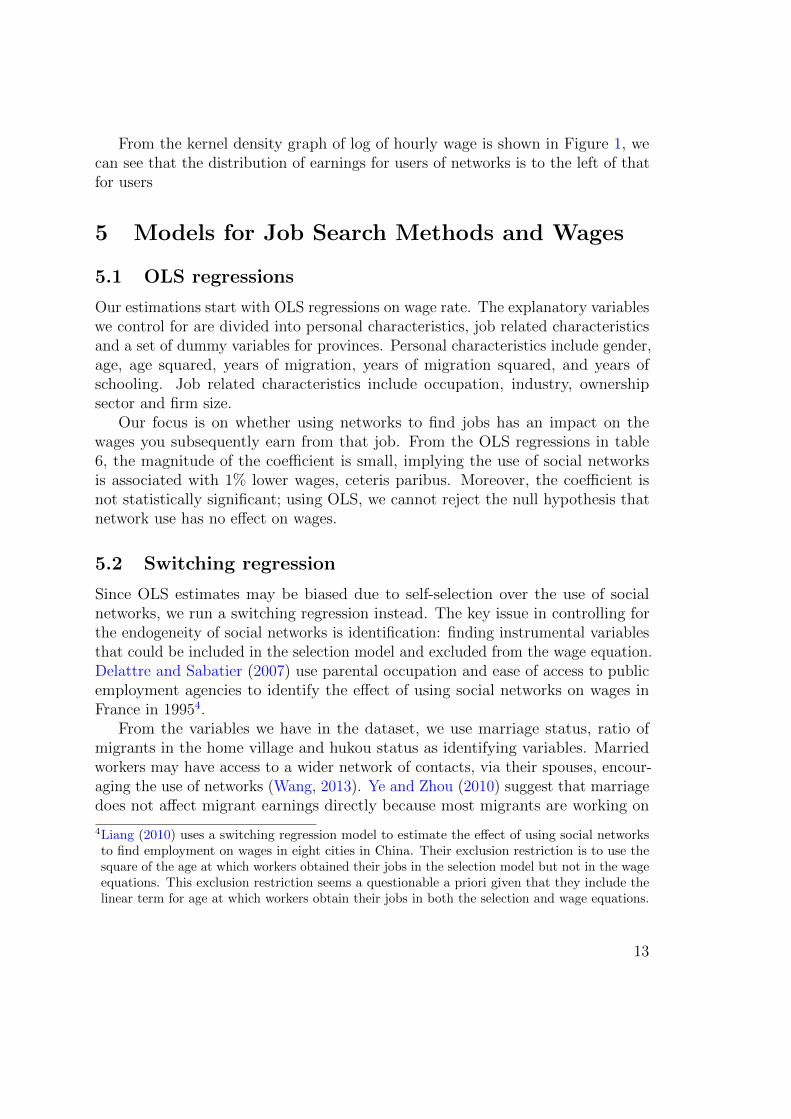
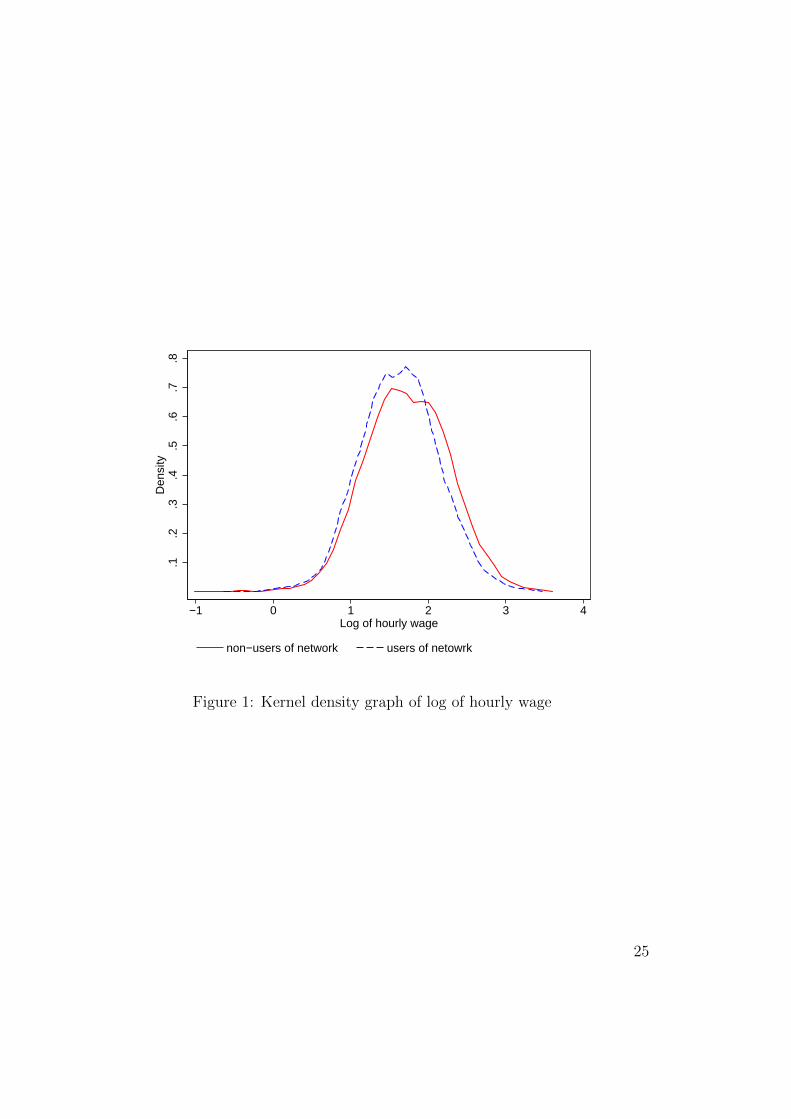
From the kernel density graph of log of hourly wage is shown in Figure 1, wecan see that the distribution of earnings for users of networks is to the left of thatfor users
5 Models for Job Search Methods and Wages
5.1 OLS regressions
Our estimations start with OLS regressions on wage rate. The explanatory variableswe control for are divided into personal characteristics, job related characteristicsand a set of dummy variables for provinces. Personal characteristics include gender,age, age squared, years of migration, years of migration squared, and years ofschooling. Job related characteristics include occupation, industry, ownershipsector and firm size.
Our focus is on whether using networks to find jobs has an impact on thewages you subsequently earn from that job. From the OLS regressions in table6, the magnitude of the coefficient is small, implying the use of social networksis associated with 1\% lower wages, ceteris paribus. Moreover, the coefficient isnot statistically significant; using OLS, we cannot reject the null hypothesis thatnetwork use has no effect on wages.
5.2 Switching regression
Since OLS estimates may be biased due to self-selection over the use of socialnetworks, we run a switching regression instead. The key issue in controlling forthe endogeneity of social networks is identification: finding instrumental variablesthat could be included in the selection model and excluded from the wage equation.Delattre and Sabatier (2007) use parental occupation and ease of access to publicemployment agencies to identify the effect of using social networks on wages inFrance in 19954.
From the variables we have in the dataset, we use marriage status, ratio ofmigrants in the home village and hukou status as identifying variables. Marriedworkers may have access to a wider network of contacts, via their spouses, encour-aging the use of networks (Wang, 2013). Ye and Zhou (2010) suggest that marriagedoes not affect migrant earnings directly because most migrants are working on
4Liang (2010) uses a switching regression model to estimate the effect of using social networksto find employment on wages in eight cities in China. Their exclusion restriction is to use thesquare of the age at which workers obtained their jobs in the selection model but not in the wageequations. This exclusion restriction seems a questionable a priori given that they include thelinear term for age at which workers obtain their jobs in both the selection and wage equations.
13

less skilled jobs. Where there is a large proportion of rural-urban migrants beingsent from the worker's home village, workers in that village are likely to have morecontacts who can help them find urban jobs. Hence we follow Chen (2009) andChen et al. (2010) in using the proportion of labour migrants in the home village asan indicator of the village social network. When the household registration (hukou)of the worker is not local, they may have fewer contacts with local people and thusless chance of using their networks to find employment. We assume that theseidentifying variables influence the selection choice to use social networks but notimpact wages directly (assumptions that we test empirically).
Age, age squared, years of migration, years of migration squared, and educationallevel are included in selection model.
The selection model from Table 7 shows that each of three hypothesised identi-fying variables have significant effects on the likelihood of using social networks tofind employment, with the predicted signs. Amongst the other control variables,the use of social networks declines with education level and increases with ageand with years of migration. Older workers are likely to have accumulated moreacquaintances and thus have access to a wider social network. Educated workersmay have less need to use social networks to find jobs, as their qualifications givethem an edge in job competition.
Table 8 shows the results of wage equations from the switching regressions. Therho values in Table 8 , which measure the correlation coefficients between the errorterms in the selection model and the wage equation, are both statistically significant.This implies that the use of social network is endogenous to wage determination.Thus the switching regression is more appropriate than the OLS regression. Therho term of non-users of networks, corresponds to \rho 0\upsilon discussed earlier: its positivevalue implies that unobserved factors \upsilon which increase the likelihood of using socialnetworks are positive correlated with the unobserved determinants \mu 0 of the wagesof those not using networks. Similarly, the positive value of the rho term for usersof networks, corresponds to \rho 1\upsilon and implies \upsilon is positively correlated with theunobserved determinants \mu 1 of the wages of those using networks. There is thuspositive selection in network use-those who use social networks are likely to be paidmore due to unobservable factors. Note that this positive selectivity is present inboth regimes - users of networks have unobservables that would imply higher wagesconditional on using networks, but also conditional on not using networks. Thisimplies that users of networks tend to have unobserved characteristics (``ability"")that raise wages, or perhaps to work in jobs with unobserved characteristics thatare associated with higher pay. Not controlling for this, for example in the OLSmodels, will bias upwards estimates of the impact of network usage on wages.Delattre and Sabatier (2007) obtained the same finding when analysing data fromFrance in 1995.
14

The switching regression model differs from an endogenous dummy variablemodel in allowing explanatory variables to impact wages differently between users ofnetwork and non-users of network. However, comparing the wage equations for usersof networks and for non-users, few differences are apparent. Generally, speakingthe determinants of wages appear similar in the two sub-samples. Wald tests fordifferences in the individual coefficients reveal no differences in the explanatoryvariables that are statistically significant at the 5\% level. The coefficients on ageand age squared are each significant different in the two samples at the 10\% level.Plotting the joint effects of the age quadratics, it is apparent that wages fall withage at a faster rate for users of networks than for non-users. The constant terms inthe two wage equations are significantly different from each other at the 1\% level,suggesting wage differences between the two sub-samples.
5.3 Wage difference
Table 9 compares the predicted log wages from the wage equations in Table 8 withthe observed values. Unconditional log wages are predicted from the switchingmodel using equation 1 and 2. Conditional log wages are predicted from theswitching model using equation 3, 4, 5 and 6. The predicted unconditional logwages are the most useful for calculating the effect of using social networks onwages, since they are not subject to any selectivity bias.
Non-users of networks have somewhat higher observed mean log wages thanusers, implying a wage differential of around 9\%. However, the gap in unconditionalpredicted mean wages is much greater, consistent with a wage differential of around59\%. This reflects the positive selectivity of network use - network users haveunobservable factors that raise their wages and thus the observed wage gaps masksthe extent of the negative effect of using networks to find jobs on wages.
It is not uncommon in the literature to find wage discounts from using socialnetworks. However, what is striking about our results is the magnitude of the effect.For example, Delattre and Sabatier (2007) find a 7\% wage discount in France in1995. Bentolila et al. (2010) report discounts of at least 2.5\% in the EU and US.While of the same sign, the wage differentials we estimate for rural-urban migrantsin China are of an order of magnitude higher than those found in industrialisedcountries. We can only speculate on why the wage discount from using socialnetworks is so much higher in China, but one factor is likely to be the large rural-urban gap in labour productivity in China. Potential rural-urban migrants may befaced with a choice between staying in low return agriculture or finding a muchmore remunerative non-agricultural job if they migrate. It is not uncommon tofind estimates of labour productivity outside of agriculture being ten times as highas in agriculture (Knight and Song, 2003). In such a situation, it is quite plausiblethat rural workers will accept a sizable urban wage discount from using networks,
15

if that gives them access to urban jobs.
5.4 Robustness tests
OID test
In our selection model, we use three identifying instrumental variables: marriagestatus, the ratio of labour migrants in home village and hukou status. We assumethese three instrumental variables only effect wages through network use. We testthis assumption by an over-identifying test for instrumental variables in Table10. The dependent variable is the residual of wage equation from the switchingregressions. The independent variables are all the exogenous regressors in the wageequations together with the three instrumental variables. This auxiliary regressionshows that all the instrumental variables do not affect the residuals of the wageequations, so we cannot reject our assumption that they can be excluded from thewage equations.
In preliminary work, we explored various other potential instruments for net-work usage, including family political background, parental education, parentaloccupation, number of siblings, number of friends living in urban areas and thedistance from home province to working province. However, these were rejected asinstruments either because they were not correlated with network user or becausethey were correlated with wage residuals from the switching regressions. Specifically,although family political background is a good IV in Zhang and Lu (2009), it is notcorrelated with the use of networks in our data. Likewise, parents' education andoccupation are not significantly correlated with the use of network. The numberof siblings, the number of friends living in city and the distance from the homeprovince to the workplace province are correlated with the use of network, but failthe OID test.
Treatment effects models
An alternative to the switching regressions approach is to use a treatment effectsmodel, in which use of social networks in job search is included as an endogenousdummy variable in a wage equation. Both Maximumum Likelihood (ML) andtwo-step estimators imply the dummy variable has a large, significant negativeimpacts on wages. The coefficient implies use of networks would lower log wagesby 0.438 points. This is of a similar order of magnitude to that implied by acomparison of the predicted unconditional mean log wages from the switchingregression models.
16

Job change
There might be a difference in the selectivity of network use between migrantswho still hold their first jobs and those who changed their jobs. Migrants who relymore on social network to find their first migrant jobs may be totally unfamiliarwith the environment when they come to cities. So we divide all sample into twogroups: those who still hold their first jobs and those who changed their jobs.We run the same switching regression for both of them. Table 12 reveals thatselectivity bias between network use and wage equation exists for both first jobholders and for migrants who changed their jobs. This indicates the contingency ofthe effect of social network on wages. However, the selectivity bias for non-networkusers is much lower in people changed jobs than for first job holders. Thus theunconditional wage gap between users of network and non-users of network issmaller for migrants changed jobs than that for first job holders.
6 Conclusion
It is well understood that social networks play an important role in labour markets,with many people finding jobs through their friends, acquaintances and relatives. Inour survey of rural-urban migrants in China in 2008, nearly two thirds found theiremployment by such job contacts. However, what is less clear is the impact of suchjob search mechanisms on subsequent wages. Addressing this issue in a convincingmanner requires explicit consideration of the selection process which determineswhether or not workers use social networks to find their jobs and whether thiscauses any selectivity bias for wages.
In this paper, we model the selection of job search methods. We find thatusers of networks to find jobs tended to be older, to have been migrants for longerand to be less educated. In addition, married workers and those from villageswhich sent out many migrants were more likely to use networks, while those withnon-local household registration were less likely. The last three effects - maritalstatus, migration rates in home village and household registration - were used asinstrumental variables to identify the impact of network use on wages.
We find evidence of positive selection effects between use of networks and wages.Those using networks to find their jobs appear to have unobservables that areassociated with higher pay - this could be unobserved personal characteristics suchas ability or perhaps remunerative job characteristics. Thus, although users ofnetworks are less educated than non-users, they appear to have other, unobservedadvantages for pay determination. This implies that simple estimations of theimpact of network use on migration that do not control for selectivity are upwardsbiased - benefits would be ascribed to networks that more properly reflect the
17

favourable unobserved characteristics of network users.Controlling for selectivity, we find a large negative impact of network use on
wages. Using job contacts brings benefits in terms of giving people from ruralChina access to urban employment. However, it also imposes a substantial cost- those urban jobs found using job contacts pay markedly less than those foundby impersonal means. This negative effect of using employment has been foundbefore, using comparable methods, in industrialised countries. However, what isstriking about our results is the magnitude of the effect. This may be explicablegiven the greater segmentation of labour in China and the consequent large gapin labour productivity between agriculture and the employment of rural-urbanmigrants. At first look it appears a puzzle, why so many rural-urban migrants usefriends and relatives to find jobs if they face a wage penalty as a result. However,such migrants may have less chance of finding jobs if they rely on formal meansof job search. Given the large gap in labour productivity rural and urban areas,it may well be worth accepting a wage discount by using social networks if it isthe means by which the migrants can escape low return farming and find moreremunerative work in urban areas. A potential policy implication of this is thatefforts to increase the access of rural people to urban employment through moreformal means - labour exchanges, rural recruitment etc. - may well bring largebenefits to them in terms of higher wages.
18

References
Adamchik, V. A. and Bedi, A. S. (2000), `Wage differentials between the public andthe private sectors: evidence from an economy in transition', Labour Economics7(2), 203--224.
Aguilera, M. B. (2005), `The impact of social capital on the earnings of puertorican migrants', The Sociological Quarterly 46(4), 569--592.
Barr, A. (2000), `Social capital and technical information flows in the ghanaianmanufacturing sector', Oxford Economic Papers 52(3), 539--559.
Battu, H., Seaman, P. and Zenou, Y. (2011), `Job contact networks and the ethnicminorities', Labour Economics 18(1), 48--56.
Beaman, L. and Magruder, J. (2012), `Who gets the job referral? evidence from asocial networks experiment', American Economic Review 102(7), 3574--93.
Bentolila, S., Michelacci, C. and Suarez, J. (2010), `Social contacts and occupationalchoice', Economica 77(305), 20--45.
Bian, Y. (1997), `Bringing strong ties back in: Indirect ties, network bridges, andjob searches in china', American Sociological Review 62(3), 366--385.
Chen, Y. (2009), Network effects among rural-to-urban migrants in china, SociologyWorking Papers 2009-06, Department of Sociology, Oxford University.
Chen, Y. (2011), `The causal effect of social capital in the labor market identificationchallenges and strategies', Chinese Sociological Review 44(2), 25.
Chen, Y., Jin, G. Z. and Yue, Y. (2010), Peer migration in china, Working Paper15671, National Bureau of Economic Research.URL: http://www.nber.org/papers/w15671
Coleman, J. S. (1988), `Social capital in the creation of human capital', AmericanJournal of Sociology 94, S95--S120.
Delattre, E. and Sabatier, M. (2007), `Social capital and wages: An econometricevaluation of social networking's effects', LABOUR 21(2), 209--236.
Dmurger, S. and Li, S. (2012), Migration, remittances and rural employmentpatterns: Evidence from china, Working Papers halshs-00744438, HAL.
19

Dutoit, L. C. (2007), Heckman selection model, endogenous and exogenous switchingmodels, a survey, Working paper.URL: http://works.bepress.com/laure dutoit/3/
Fafchamps, M. and Minten, B. (2002), `Returns to social network capital amongtraders', Oxford Economic Papers 54(2), 173--206.
Fraser, S. G. M. W. (2009), Propensity Score Analysis: Statistical Methods andApplications, Sage Publications.
Giulietti, C., Guzi, M., Zhao, Z. and Zimmermann, K. F. (2010), Social networksand the labour market outcomes of rural to urban migrants in china, Workingpaper.URL: www.iza.org/conference files/ReLabEco2010/guzi m5347.pdf?
Giulietti, C., Schlutery, C. and Wahba, J. (2011), Migrants and social networks:Old ideas, lasting myths and new findings, Working paper.URL: www.iza.org/conference files/Transatlantic2011/giulietti c5931.pdf?
Granovetter, M. (1983), `The strength of weak ties: A network theory revisited',Sociological Theory 1, 201--233.
Granovetter, M. S. (1973), `The strength of weak ties', The American Journal ofSociology 78(6), 1360--1380.
Granovetter, M. S. (1974), Getting A Job: A Study of Contacts and Careers,Harvard University Press, Cambridge.
Heitmueller, A. (2006), `Public-private sector pay differentials in a devolved scot-land', Journal of Applied Economics 9(2), 295--323.
Kandel, E. and Lazear, E. P. (1992), `Peer pressure and partnerships', Journal ofPolitical Economy 100(4), pp. 801--817.
Khan, A. Q. and Lehrer, S. F. (2013), The impact of social networks on labour mar-ket outcomes: New evidence from cape breton, Working Paper 18786, NationalBureau of Economic Research.
Knight, J. and Song, L. (2003), `Chinese peasant choices: Migration, rural industryor farming', Oxford Development Studies 31(2), 123--148.
Knight, J. and Yueh, L. (2008), `The role of social capital in the labour market inchina', Economics of Transition 16(3), 389--414.
20

Liang, Y. (2010), `Is social capital and social networks useless?', Sociological Studies(5).
Lokshin, M. and Sajaia, Z. (2004), `Maximum likelihood estimation of endogenousswitching regression models', The Stata Journal 4(3), 10.
Meng, X., Kong, S. T. and Zhang, D. (2010), How much do we know aboutthe impact of the economic downturn on the employment of migrants?, ADBIWorking Papers 194, Asian Development Bank Institute.
Montgomery, J. D. (1991), `Social networks and labor-market outcomes: Towardan economic analysis', The American Economic Review 81(5), 1408--1418.
Mortensen, D. T. and Vishwanath, T. (1994), `Personal contacts and earnings: Itis who you know!', Labour Economics 1(2), 187--201.
Mouw, T. (2006), `Estimating the causal effect of social capital: A review of recentresearch', Annual Review of Sociology 32(1), 79--102.
Mouw, T. (2010), The use of social networks among hispanic workers: An indirecttest of the effect of social capital, Working paper.URL: http://www.unc.edu/ tedmouw/papers/hispcontacts.pdf
Narayan, D. and Pritchett, L. (1999), `Cents and sociability: Household income andsocial capital in rural tanzania', Economic Development and Cultural Change47(4), pp. 871--897.
Pellizzari, M. (2010), `Do friends and relatives really help in getting a good job?',Industrial and Labor Relations Review 63(3), 494--510.
Powers, D. (2007), Censored regression, sample selection, endogenous switching,and treatment-effect regression models, Working paper.URL: http://www.oir.pku.edu.cn/umich/teaching/download/20092/CDAcoursematerials/handouts/SelectRegQ.pdf
Qu, Z. F. and Zhao, Z. (2011), Evolution of the chinese rural-urban migrant labormarket from 2002 to 2007, IZA Discussion Papers 5421, Institute for the Studyof Labor (IZA).
Wahba, J. and Zenou, Y. (2005), `Density, social networks and job search methods:Theory and application to egypt', Journal of Development Economics 78(2), 443--473.
Wang, S.-Y. (2013), `Marriage networks, nepotism, and labor market outcomes inchina', American Economic Journal: Applied Economics 5(3), 91--112.
21

Yakubovich, V. (2005), `Weak ties, information, and influence: How workers findjobs in a local russian labor market', American Sociological Review 70(3), 408--421.
Ye, J., Bo, S., Liu, C. and Zhou, Y. (2012), `The levels of social network and wageof rural-urban migrants:from a perspective of indentity model', Economic Review(4), 31--42.
Ye, J. and Zhou, Y. (2010), `Socail captial transformation and migrants' wage----evidence from an survey in beijing', Management World (10), 34--46.
Zhang, J. and Zhao, Z. (2013), Measuring the income-distance tradeoff for rural-urban migrants in china, IZA Discussion Papers 7160, Institute for the Study ofLabor (IZA).
Zhang, X. and Li, G. (2003), `Does guanxi matter to nonfarm employment?',Journal of Comparative Economics 31(2), 315--331.
Zhang, Y. and Lu, M. (2009), `Whether rural-urban migrants' social networkimprove their salary?', Management World (3), 45--54.
22

Table 1: Composition of Job Search Methods
Job search methods Frequency Percent
Assigned by the government 30 0.55Through employment agent run by government 52 0.95Through community employment service station 37 0.68Through commercial Employment agent run by private 316 5.79Applied for advertised job 395 7.24Applied directly 613 11.24Introduced by family members 413 7.57Introduced by relatives 1145 21.00Introduced by friends 1696 31.10Introduced by acquaintance 159 2.92Employer recruitment 447 8.20Other (please specify) 150 2.75Total 5453 100
Table 2: Regrouped Composition of Job Search Methods
Job search methods Frequency Percent
Through the government 119 2.18Through the market 1,771 32.48Through social network 3,413 62.59Other methods 150 2.75Total 5453 100
23

Table 3: Users of network and non-users of network
Job search methods Frequency Percent
users of network 3413 62.59non-users of network 2040 37.41Total 5453 100
Table 4: Individual Attributes and Networks Use (in per cent)non-users of network Users of network Total
Female 42.25 42.43 42.36Male 57.75 57.57 57.64
Married 52.99 60.01 57.38Unmarried 47.01 39.99 42.62
Age 16-25 45.54 40.2 42.2Age 26-35 28.53 28.77 28.68Age 36-45 20.05 22.21 21.4Age 46 and above 5.88 8.82 7.72
Elementary school or blew 10.1 14.7 12.98Junior middle school 48.77 58.16 54.64Senior middle school 20.83 16.87 18.36Specialized secondary or above 20.29 10.27 14.02
Table 5: Wages for users of network and non-users of networkN hourly wage log hourly wage
Mean SD Mean SDnon-users of network 2030 6.02 3.96 1.73 0.54users of network 3389 5.39 3.39 1.63 0.50Total 5419 5.63 3.62 1.67 0.52
24
.1.2
.3.4
.5.6
.7.8
Den
sity
−1 0 1 2 3 4Log of hourly wage
non−users of network users of netowrk
Figure 1: Kernel density graph of log of hourly wage
25

Table 6: Wage equations: OLS regressionsAll Sample non-users of network Users of network
Coef. SE Coef. SE Coef. SEUsers of network - 0.0091 0.0135age 0.0417\ast \ast \ast 0.0047 0.0294\ast \ast \ast 0.0085 0.0477\ast \ast \ast 0.0057age squared - 0.0647\ast \ast \ast 0.0068 - 0.0481\ast \ast \ast 0.0124 - 0.0729\ast \ast \ast 0.0081years of migration 0.0218\ast \ast \ast 0.0035 0.0316\ast \ast \ast 0.0055 0.0174\ast \ast \ast 0.0042years of migration squared - 0.0478\ast \ast \ast 0.0126 - 0.0823\ast \ast \ast 0.0181 - 0.0322\ast \ast 0.0153male 0.1096\ast \ast \ast 0.0130 0.0841\ast \ast \ast 0.0223 0.1283\ast \ast \ast 0.0160years of schooling 0.0424\ast \ast \ast 0.0027 0.0500\ast \ast \ast 0.0048 0.0372\ast \ast \ast 0.0034Occupation: base group=White collarBlue collar - 0.1953\ast \ast \ast 0.0247 - 0.2360\ast \ast \ast 0.0360 - 0.1470\ast \ast \ast 0.0342other occupation - 0.1643 0.1012 - 0.0748 0.1460 - 0.1961 0.1330Industry: base group=manufactoryconstruction 0.1204\ast \ast \ast 0.0240 0.1506\ast \ast \ast 0.0465 0.1141\ast \ast \ast 0.0281Electricity, gas, water,transportation and IT
0.0217 0.0331 - 0.0073 0.0544 0.0476 0.0418
Commerce and trade 0.0091 0.0228 0.0191 0.0413 0.0112 0.0271Restaurant and catering - 0.1232\ast \ast \ast 0.0210 - 0.1361\ast \ast \ast 0.0340 - 0.1046\ast \ast \ast 0.0266Finance, estate,health, education
- 0.0374 0.0236 - 0.0158 0.0395 - 0.0421 0.0293
services - 0.0626\ast \ast 0.0266 - 0.0636 0.0445 - 0.0490 0.0331Ownership: base group=state and collectivePrivate enterprises - 0.0477\ast \ast 0.0223 - 0.0724\ast 0.0410 - 0.0367 0.0263Self-employed Individuals - 0.0790\ast \ast \ast 0.0256 - 0.0807\ast 0.0468 - 0.0848\ast \ast \ast 0.0303Foreign, joint venture 0.0368 0.0277 0.0240 0.0477 0.0328 0.0345shared company 0.0340 0.0283 0.0565 0.0495 0.0006 0.0342other enterprises - 0.2063 0.1403 - 0.4682\ast \ast \ast 0.1528 0.1451 0.1379Firm size: base group= below 88-50 0.0921\ast \ast \ast 0.0192 0.0870\ast \ast 0.0341 0.0925\ast \ast \ast 0.0234above 50 0.1347\ast \ast \ast 0.0200 0.1619\ast \ast \ast 0.0354 0.1216\ast \ast \ast 0.0241constant 0.7124\ast \ast \ast 0.0870 0.7912\ast \ast \ast 0.1478 0.6458\ast \ast \ast 0.1065adjust R2 0.3330 0.3384 0.3283N 4845 1819 3026Note: Dependent variable=log of hourly wage; SE refers to robust standard error; Provinces controlled.\ast p < 0.10, \ast \ast p < 0.05, \ast \ast \ast p < 0.01
26

Table 7: Switching regression: selection modelCoefficient SE
unmarried - 0.1572\ast \ast \ast 0.0524non-local rural hukou - 0.1193\ast \ast \ast 0.0436ratio of labour migrants in home village 0.0044\ast \ast \ast 0.0008age - 0.0382\ast \ast 0.0158age squared 0.0528\ast \ast 0.0218years of migration - 0.0139 0.0113years of migration squared 0.0848\ast \ast 0.0426male 0.0288 0.0395Education:base group=Junior middle schoolElementary school or blow 0.1265\ast \ast 0.0593Senior middle school - 0.1854\ast \ast \ast 0.0443Specialized secondary school - 0.4888\ast \ast \ast 0.0519constant 0.9628\ast \ast \ast 0.2633N 4723Note: Dependent variable: dummy=1 if user of network.\ast p < 0.10, \ast \ast p < 0.05, \ast \ast \ast p < 0.01
27

Table 8: Switching regression: wage equationnon-users of network users of networkCoefficient SE Coefficient SE
age 0.0255\ast \ast \ast 0.0091 0.0463\ast \ast \ast 0.0059age squared - 0.0412\ast \ast \ast 0.0133 - 0.0700\ast \ast \ast 0.0084years of migration 0.0284\ast \ast \ast 0.0070 0.0150\ast \ast \ast 0.0045years of migration squared - 0.0615\ast \ast 0.0269 - 0.0174 0.0161male 0.0923\ast \ast \ast 0.0244 0.1278\ast \ast \ast 0.0176years of schooling 0.0346\ast \ast \ast 0.0052 0.0288\ast \ast \ast 0.0036Occupation: base group=white collarBlue collar - 0.2137\ast \ast \ast 0.0345 - 0.1376\ast \ast \ast 0.0315other occupation - 0.0708 0.1655 - 0.1754 0.1231Industry: base group=manufactoryconstruction 0.1572\ast \ast \ast 0.0425 0.1066\ast \ast \ast 0.0281Electricity, gas, water,transportation and IT
- 0.0054 0.0572 0.0506 0.0414
Commerce and trade 0.0254 0.0383 0.0076 0.0280Restaurants and catering - 0.1379\ast \ast \ast 0.0348 - 0.1109\ast \ast \ast 0.0268Finance, estate, health,education, science
- 0.0250 0.0378 - 0.0437 0.0295
services - 0.0599 0.0393 - 0.0588\ast 0.0310Ownership: base group=state and collectivePrivate enterprises - 0.0501 0.0399 - 0.0411 0.0261Self-employed Individuals - 0.0595 0.0454 - 0.0902\ast \ast \ast 0.0297Foreign, joint venture 0.0411 0.0454 0.0248 0.0349shared company 0.0721 0.0475 0.0024 0.0350other enterprises - 0.4367\ast \ast 0.1797 0.1040 0.2394Firm size: base group= below 88-50 0.0846\ast \ast \ast 0.0321 0.0987\ast \ast \ast 0.0223above 50 0.1512\ast \ast \ast 0.0325 0.1235\ast \ast \ast 0.0235constant 1.2765\ast \ast \ast 0.1733 0.5617\ast \ast \ast 0.1073rho 0.6613\ast \ast \ast 0.0662 0.6227\ast \ast \ast 0.0647sigma 0.5107 0.0239 0.4604 0.0144R2 0.3614 0.3366N 1765 2958Note: Dependent variable=log of hourly wage; Province controlled.\ast p < 0.10, \ast \ast p < 0.05, \ast \ast \ast p < 0.01
28

Table 9: Observed and predicted log hourly wagesMean SD
users of networkobserved 1.6285 0.5015unconditional 1.4608 0.2784conditional on users of network 1.6286 0.2897conditional on non-users of network 2.1705 0.3014
non-users of networkobserved 1.7181 0.5317unconditional 2.0490 0.2971conditional on users of network 1.2349 0.2915conditional on non-users of network 1.7176 0.3166
Table 10: Over-identifying testCoefficient SE
unmarried - 0.0103 0.0200non-local rural hukou - 0.0066 0.0184ratio of labour migrants in home village - 0.0004 0.0003constant 0.0237 0.0267Adjust R2 - 0.0062N 4723Note: Dependent variable: residual of wage equation from switching regression.
All variables used in wage equation are controlled.\ast p < 0.10, \ast \ast p < 0.05, \ast \ast \ast p < 0.01
Table 11: Wage equations from Treatment effect models: ML and two-stepsML two-steps
Coefficient SE Coefficient SEusers of network - 0.4380\ast \ast \ast 0.0558 - 0.5303\ast \ast \ast 0.1131rho 0.5705\ast \ast \ast 0.6631\ast \ast \ast
sigma 0.4662 0.4871lambda 0.2660 0.3230N 4723 4723Note: Dependent variable=log of hourly wage.
Personal characteristics, job characteristics and Province dummies controlled.\ast p < 0.10, \ast \ast p < 0.05, \ast \ast \ast p < 0.01
29

Table 12: Observed and predicted log hourly wagesFirst Jobs holders People changed Jobs
N=2056 N=2658Mean SD Mean SD
users of network rho 0.5418\ast \ast \ast 0.6721\ast \ast \ast
sigma 0.4329 0.4707observed 1.6269 0.5106 1.6293 0.4937unconditional 1.4993 0.3116 1.4358 0.2667
non-users of network rho 0.8838\ast \ast \ast 0.3047\ast
sigma 0.6388 0.4268observed 1.7607 0.5633 1.6898 0.5086unconditional 2.3477 0.3275 1.8105 0.2892
Note: \ast p < 0.10, \ast \ast p < 0.05, \ast \ast \ast p < 0.01
30

Table A.1: Data descriptions (mean or frequencies)non-users of network users of network total
age 29.16 30.60 30.06years of migration 7.73 8.34 8.11years of schooling 9.46 8.68 8.97ratio of labour migrants inhome village
56.46 59.38 58.28
female 42.25 42.43 42.36male 57.75 57.57 57.64
married 52.99 60.01 57.38unmarried 47.01 39.99 42.62
local rural hukou 16.72 20.77 19.26non-local rural hukou 83.28 79.23 80.74
Occupationwhite collar 10.87 6.25 7.98Blue collar 83.82 89.11 87.13other occupation 5.31 4.64 4.89
Industrymanufactory 26.71 20.95 23.10construction 8.44 14.41 12.18Electricity, gas, water,transportation and IT
3.58 4.20 3.97
Commerce and trade 17.18 19.31 18.51Restaurants and catering 20.23 19.04 19.49Finance, estate, health,education, science
12.86 11.53 12.03
services 11.00 10.56 10.73
Ownershipstate and collective 8.38 10.17 9.50Private enterprises 40.65 43.61 42.50Self-employed Individuals 24.39 28.73 27.10Foreign, joint venture 15.31 9.15 11.46shared company 10.97 8.22 9.25other enterprises 0.30 0.12 0.19
Firm sizebelow 8 23.93 27.31 26.058-50 25.11 30.16 28.27above 50 50.96 42.53 45.69
31

Table A.2: Switching regression: selection modelMarginal Effect SE
unmarried - 0.0547 0.0236non-local rural hukou - 0.0594 0.0183ratio of labour migrants in home village 0.0013 0.0004age - 0.0019 0.0016years of migration - 0.0009 0.0021male 0.0099 0.0154Education:base group=Junior middle schoolElementary school or blow 0.0404 0.0237Senior middle school - 0.0890 0.0194Specialized secondary school - 0.2046 0.0218N 4723Note: Dependent variable: dummy=1 if user of network
32

Table A.3: Wage equations from Treatment effect models: ML and two-stepsML two-steps
Coefficient SE Coefficient SEusers of network - 0.4380\ast \ast \ast 0.0558 - 0.5303\ast \ast \ast 0.1131age 0.0403\ast \ast \ast 0.0051 0.0401\ast \ast \ast 0.0054age squared - 0.0619\ast \ast \ast 0.0074 - 0.0615\ast \ast \ast 0.0077years of migration 0.0185\ast \ast \ast 0.0039 0.0183\ast \ast \ast 0.0041years of migration squared - 0.0291\ast \ast 0.0143 - 0.0271\ast 0.0150male 0.1113\ast \ast \ast 0.0147 0.1118\ast \ast \ast 0.0153years of schooling 0.0328\ast \ast \ast 0.0031 0.0303\ast \ast \ast 0.0039Occupation: base group=white collarBlue collar - 0.1781\ast \ast \ast 0.0230 - 0.1759\ast \ast \ast 0.0231other occupation - 0.1389 0.0985 - 0.1389 0.0991Industry: base group=manufactoryconstruction 0.1156\ast \ast \ast 0.0233 0.1131\ast \ast \ast 0.0234Electricity, gas, water,transportation and IT
0.0250 0.0337 0.0250 0.0337
Commerce and trade 0.0082 0.0227 0.0065 0.0227Restaurants and catering - 0.1281\ast \ast \ast 0.0213 - 0.1281\ast \ast \ast 0.0213Finance, estate, health,education, science
- 0.0438\ast 0.0232 - 0.0467\ast \ast 0.0232
services - 0.0665\ast \ast \ast 0.0243 - 0.0657\ast \ast \ast 0.0242Ownership: base group=state and collectivePrivate enterprises - 0.0450\ast \ast 0.0221 - 0.0456\ast \ast 0.0221Self-employed Individuals - 0.0770\ast \ast \ast 0.0251 - 0.0762\ast \ast \ast 0.0251Foreign, joint venture 0.0376 0.0274 0.0357 0.0274shared company 0.0367 0.0280 0.0342 0.0281other enterprises - 0.2643\ast 0.1430 - 0.2612\ast 0.1402Firm size: base group= below 88-50 0.0957\ast \ast \ast 0.0184 0.0951\ast \ast \ast 0.0184above 50 0.1330\ast \ast \ast 0.0191 0.1316\ast \ast \ast 0.0192constant 1.0695\ast \ast \ast 0.1014 1.1502\ast \ast \ast 0.1333rho 0.5705 0.6631sigma 0.4662 0.4871lambda 0.2660 0.3230N 4723 4723Note: Dependent variable=log of hourly wage; Province controlled\ast p < 0.10, \ast \ast p < 0.05, \ast \ast \ast p < 0.01
33