recent evolution of income and wealth inequality: …wk2110/bin/pikettynyu.pdfrecent evolution of...
TRANSCRIPT

Recent Evolution ofIncome and Wealth Inequality:
Comments on Piketty'sCapital in the Twenty-First Century
WOJCIECH KOPCZUK*
I. INTRODUCTION
The astounding success of Thomas Piketty's book' makes it clearthat the topic of changing inequality in recent decades is of great in-terest to the public. There is huge demand for understanding whathas happened and, even more so, the consequences for the future.
Piketty does three basic things in the book. First, he documentswhat has happened in the past to the (relative) importance of capitalstock,2 as well as to income and wealth inequality.3 Second, he pro-vides an economic framework for organizing the historical data anduses this framework to project into the future.4 Third, having con-cluded that wealth concentration will increase, he makes policyrecommendations.5
The book has received a tremendous amount of attention and muchhas been written about the strengths and weaknesses of the argumentsin each of these parts.6 In what follows, I make a few critical and,given how much has already been written, not always original com-ments. That should not detract though from the fact that-whateverone thinks about details or even the whole message-the book is veryimportant. It is based on the truly astounding data collection effort ofPiketty and his co-authors over the last fifteen years that allowed fordocumenting basic facts about the evolution of inequality. It has be-hind it scholarship at the frontier of economic research on this topic.As with any academic work, it is never the last word but Piketty's
* Professor, Economics and International and Public Affairs, Columbia University.1 See Thomas Piketty, Capital in the Twenty-First Century (Arthur Goldhammer trans.,
Harvard Univ. Press 2014).2 Id. at 113-63.3 Id. at 304-76.4 Id. at 430-67.5 Id. at 515-39.6 See, e.g., Symposium, Wealth and Inequality, J. Econ. Persp., Winter 2015, at 3.
545

research has already accomplished what everyone in his positionwould wish to accomplish: It set the agenda and inspired a lot of addi-tional work. The book further cements his previous work and goesbeyond it by making all of it accessible to the masses (or at least, themasses that are educated, motivated, and curious enough to pushthrough a 700-page long book of academic origin).
I start by providing a few remarks about why one may be concernedwith inequality at all. I follow with a discussion of possible explana-tions for an increase in inequality in recent decades, stressing the im-portance of technological change and being skeptical about theimportance of institutional changes that play a prominent role in thebook. I then comment on changes in income and wealth inequality inthe United States, pointing out measurement problems that make theanalysis of wealth inequality (which is central to the book's thesis) dif-ficult. Subsequently, I argue that technological transition helps in un-derstanding the patterns of wealth and income inequality, in particularcontroversy about whether wealth inequality has increased as much asincome inequality has. In the final Part, I comment on the reasonswhy having the right story for why inequality has increased matters.
II. Do WE CARE ABOUT INEQUALITY (AND OF WHAT)?
There are many ways to approach inequality-one may be inter-ested in inequality of well-being or proxies for it, such as consumption,earnings, income, or wealth. A welfarist with a preference for equity(in an ideal world, with ideal data) would focus on inequality of well-being.7 Consumption is a close second, though perhaps one wouldlike to see it corrected for effort that different people exert to achieveit. Well-being is very hard to measure directly (notwithstanding aninteresting line of research on subjective well-being8 ) and comprehen-sive consumption data is very hard to come by, so that earnings, in-come, and wealth that are somewhat easier to measure are of naturalfocus. Even then, measurement issues abound-tax sources and sur-vey data are the source of information but they all have variousproblems (and relative benefits). One can think about inequality ofindividuals, households, or families; adjust (or not) for taxes, transfers,or fringe benefits; correct (or not) for cross-sectional and over-timedifferences in the cost of living; consider annual, multi-year, or per-haps lifetime measures. Inequality has many aspects to it-under-standing the bottom of the distribution is not the same asunderstanding its top.
7 See Louis Kaplow, The Theory of Taxation and Public Economics 347 (2011).8 See, e.g., Daniel Kahneman & Alan B. Krueger, Developments in the Measurement of
Subjective Well-Being, J. Econ. Persp., Winter 2006, at 3.
546 TAX LAW REVIEW [Vol. 68:

2015] RECENT EVOLUTION OF INCOME AND WEALTH INEQUALITY 547
The attractiveness of earnings, income, or wealth is not just that thedata is somewhat easier to come by than is the case with well-being orconsumption. It is also due to the fact that these variables get uscloser to the notion of opportunities rather than outcomes. Few peo-ple would be upset about inequality in earnings or wealth arising fromdifferent decisions about how much to work or save. However, a pos-sible normative rationale for the analysis of inequality in earnings orwealth rather than economic well-being is the (often implicit) beliefthat the former reflect opportunities rather than tastes. Even then,there are different aspects of opportunities that have very differentramifications. Commanding a high salary because of one's productiveskills is different than earning large incomes because of access, con-nections, or corruption. A billionaire hedge fund manager testing thefine line of insider trading is likely to be viewed differently than abillionaire Silicon Valley entrepreneur. Simply measuring inequalitydoes not discriminate between these explanations.
Focusing on the very top of the distribution raises one other issue:Beyond preferences for equity in either outcomes or opportunities,one may be concerned about the direct effect that the well-to-do haveon others. The notion that high wealth concentration affects the na-ture of the society is plausible. Piketty certainly thinks so: "The Ren-tier, Enemy of Democracy" is a subtitle of one of the chapters.9
Money can buy political influence, perpetuate differences across gen-erations, and on a more local level, stratify neighborhoods and ex-clude others. But it can also pay for vaccines in developing countries,museums, or education. The net effect is an empirical question.
The reason for the success of the book probably has something todo with all three motivations: redistributive concerns, a sense thatgrowing inequality reflects growing inequality of opportunities, andthe possibility that changing inequality may have an adverse effect onthe whole society in the future.
III. WHY HAS INCOME INEQUALITY INCREASED?
The redistributive concern is the easiest to evaluate. Inequality hasincreased.10 Since the book focuses on the very top of the distribu-tion, I focus on it as well. Income tax data has been used to constructmeasures of income concentration in the United States. Early work ofDaniel Feenberg and James Poterball drew attention to changes at the
9 See Piketty, note 1, at 422.10 See id. at 471.11 Daniel R. Feenberg & James M. Poterba, Income Inequality and the Incomes of Very
High Income Taxpayers: Evidence from Tax Returns, in 7 Tax Policy and the Economy145, 158 (James M. Poterba ed., 1993).

548 TAX LAW REVIEW [Vol. 68:
top of the distribution, but it is work of Piketty and Emmanuel Saezl2
that comprehensively documented the patterns of income concentra-tion since the early twentieth century and its increase in recent de-cades. Figure 1 shows the evolution of the top 1% of income usingtheir updated series.
FIGURE 1Top 1% INCOME AND EARNINGS SHARE13
0.25-
0.0
2 0.20-
0.15
CYaa)0.5
0a) 0.10-E0
.2 0.05-0
csr e Top 1% household incomesand c i m h t Top 1% individual earnings
1920 1940 1960 1980 2000Year
A lot of subsequent literature probed the importance of various mea-surement issues (such as changing form of compensation, householdcomposition, robustness to accounting for transfers or fringe benefits,and changing demographic structure).'14 The increase in income con-centration since the 1970's is very robust to these considerations. Fig-ure 1 also shows labor earnings (rather than income) concentrationbased on payroll tax records of commerce and industry workers fromthe Social Security Administration analyzed by the author, Saez, andJae Song'5 to illustrate that labor income is the key component of
12 Thomas Piketty & Emmanuel Saez, Income Inequality in the United States, 1913-1998, 118 Q.J. Econ. 1, 7-14 (2003).
13 Id. The figures have been updated to 2013 and are available in Excel format at http://eml.berkeley.edu/-saez/.
14 See David H. Autor, Skills, Education, and the Rise of Earnings Inequality Amongthe "Other 99 Percent," 344 Sci. 843, 841-51 (2014); Jesper Rome & Daniel Waldenstrdm,Long-Run Trends in the Distribution of Income and Wealth, in 2 Handbook of IncomeDistribution 469 (Anthony B. Atkinson & Francois Bourguignon eds., 2015).
15 Wojciech Kopczuk, Emmanuel Saez & Jae Song, Earnings Inequality and Mobility inthe United States: Evidence from Social Security Data Since 1937, 125 Q.J. Econ. 91, 94-95(2009).

2015] RECENT EVOLUTION OF INCOME AND WEALTH INEQUALITY 549
these changes. The same qualitative pattern over time prevails whenincome tax data is used and capital income is ignored completely.
The evidence that the concentration of incomes has grown is over-whelming and it is not limited to the top of the distribution, althoughthe patterns are most spectacular there. Rising earnings differentialsby measures of skills (such as.education) have been well documentedand the literature has probed various explanations for it.16 There aremany pieces to the story, including changing demographics, increasinglabor force participation of women, the declining trade barriers andchanging patterns of international trade, and changing labor marketinstitutions (unions, minimum wage, and taxation). There is a nearconsensus that the most important explanation in accounting for gen-eral patterns of inequality is the changing technology-economists re-fer to "skill-biased technological change""7-and its interaction witheducation.18 The idea is that the economy has evolved in a way thatfavors certain types of skills-"nonroutine," that is, those that cannotbe easily substituted by technology.19
Piketty has a different explanation than technology for the growthof inequality. When summarizing his major conclusions, he states:
[T]he reduction of inequality that took place in most devel-oped countries between 1910 and 1950 was above all a conse-quence of war and of polices adopted to cope with the shocksof war. Similarly, the resurgence of inequality after 1980 isdue largely to the political shifts of the past several decades,especially in regard to taxation and finance.20
This is a bold hypothesis that rings somewhat true, because it wouldbe hard to argue that wars and redistributive taxation have no effecton the distribution. Indeed, the book is persuasive that they do. Fig-ure 1 shows that the drop in the share of top incomes and earnings didnot occur immediately after the Great Depression but instead hap-pened in the 1940's-the exact timing is hard to pin down, but otherwork also suggests that the 1940's were the period of "Great Com-pression" in wages.21 This nicely coincides with wartime wage controland a rapid increase in progessivity occurring around the time. Simi-larly, large tax reforms of the early- to mid-1980's coincide with the
16 See Autor, note 14, at 843, 845-48.17 See, e.g., Claudia Goldin & Lawrence F. Katz, The Race Between Education and
Technology (2010).18 See, e.g., Autor, note 14, at 844-45.19 See id. at 846.20 Piketty, note 1, at 20.21 Claudia Goldin & Robert A. Margo, The Great Compression, 107 Q.J. Econ. 1, 1-3
(1992).
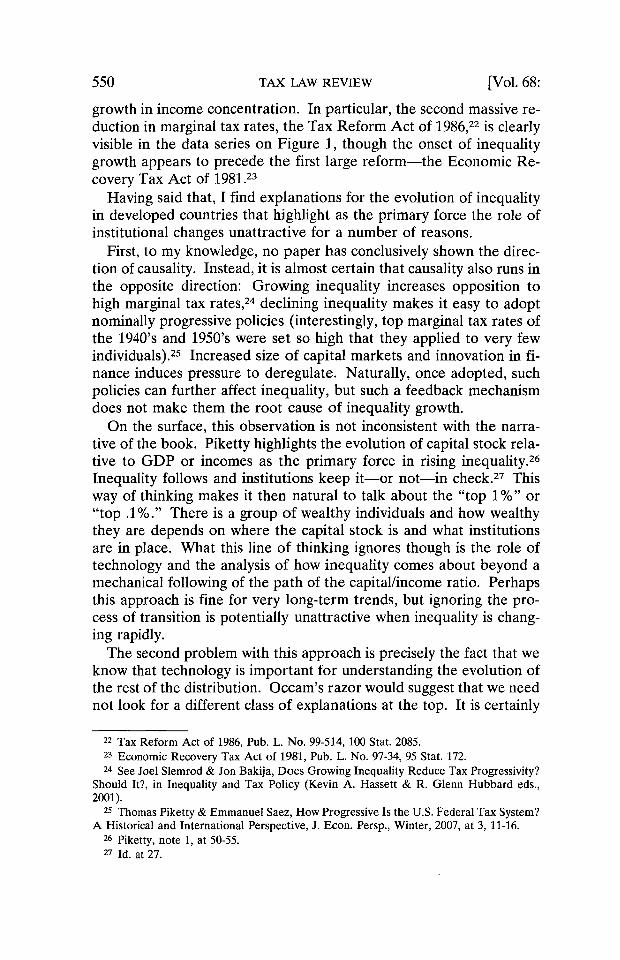
growth in income concentration. In particular, the second massive re-duction in marginal tax rates, the Tax Reform Act of 1986,22 is clearlyvisible in the data series on Figure 1, though the onset of inequalitygrowth appears to precede the first large reform-the Economic Re-covery Tax Act of 1981.23
Having said that, I find explanations for the evolution of inequalityin developed countries that highlight as the primary force the role ofinstitutional changes unattractive for a number of reasons.
First, to my knowledge, no paper has conclusively shown the direc-tion of causality. Instead, it is almost certain that causality also runs inthe opposite direction: Growing inequality increases opposition tohigh marginal tax rates,24 declining inequality makes it easy to adoptnominally progressive policies (interestingly, top marginal tax rates ofthe 1940's and 1950's were set so high that they applied to very fewindividuals).2 5 Increased size of capital markets and innovation in fi-nance induces pressure to deregulate. Naturally, once adopted, suchpolicies can further affect inequality, but such a feedback mechanismdoes not make them the root cause of inequality growth.
On the surface, this observation is not inconsistent with the narra-tive of the book. Piketty highlights the evolution of capital stock rela-tive to GDP or incomes as the primary force in rising inequality.26
Inequality follows and institutions keep it-or not-in check.27 Thisway of thinking makes it then natural to talk about the "top 1%" or"top .1%." There is a group of wealthy individuals and how wealthythey are depends on where the capital stock is and what institutionsare in place. What this line of thinking ignores though is the role oftechnology and the analysis of how inequality comes about beyond amechanical following of the path of the capital/income ratio. Perhapsthis approach is fine for very long-term trends, but ignoring the pro-cess of transition is potentially unattractive when inequality is chang-ing rapidly.
The second problem with this approach is precisely the fact that weknow that technology is important for understanding the evolution ofthe rest of the distribution. Occam's razor would suggest that we neednot look for a different class of explanations at the top. It is certainly
22 Tax Reform Act of 1986, Pub. L. No. 99-514, 100 Stat. 2085.23 Economic Recovery Tax Act of 1981, Pub. L. No. 97-34, 95 Stat. 172.24 See Joel Slemrod & Jon Bakija, Does Growing Inequality Reduce Tax Progressivity?
Should It?, in Inequality and Tax Policy (Kevin A. Hassett & R. Glenn Hubbard eds.,2001).
25 Thomas Piketty & Emmanuel Saez, How Progressive Is the U.S. Federal Tax System?A Historical and International Perspective, J. Econ. Persp., Winter, 2007, at 3, 11-16.
26 Piketty, note 1, at 50-55.27 Id. at 27.
550 [Vol. 68:TAX LAW REVIEW

2015] RECENT EVOLUTION OF INCOME AND WEALTH INEQUALITY 551
in principle possible that the dynamics of the top of the distributionhave been driven by different forces, such as reduced progressivity,deregulation, and rent-seeking, than those that shaped the rest of thedistribution. It is even more likely that these forces have contributed.However, it is hard to believe that skill-biased technological progressis the primary force necessary for understanding the evolution of theeducation/college premium and the relative performance of blue- ver-sus white-collar workers, but that it does not play the important rolein explaining the top 1%.
How has technology influenced the very top of the distribution?Some ways are obvious-Apple is the world's most valuable com-pany,28 Microsoft's founder Bill Gates has been the richest person inthe United States for years,29 and technology-based fortunes aboundin Forbes 400.30 More subtly, fortunes of companies like Walmart thatwere the first in their industry to take advantage of information tech-nology using streamlined supply chain) can be traced to the samesource as well.3 ' Finance is a very different industry than it was fortyyears ago-technology allowed the introduction of sophisticated newproducts, analysis, and trading strategies. Of course, technology wasimproving before the 1970's. However, the argument is that informa-tion technology is a general purpose technology: Once it arrives, itchanges most sectors of the economy.32 Smaller inventions do not;hence they generate isolated fortunes, but do not change the wholestructure of the economy and thus have a relatively small effect oninequality. One has to go back to the development of mass transpor-tation or electricity to find similar examples.33
None of this argument says that smaller stories such as rent-seeking,decoupling CEO pay from performance, rigging financial markets,and insider trading do not happen, just that they accompany (and per-haps contribute to) rather than drive the evolution of inequality. For
28 Kevin Kingsbury, Apple Is Now More Than Double the Size of Exxon-and Every-one Else, MoneyBeat, Wall St. J. Blog (Feb. 23, 2015, 1:09 AM), http://blogs.wsj.com/moneybeat/2015/02/23/apple-is-now-more-than-double-the-size-of-exxon-and-everyone-else.
29 Kerry A. Dolan & Luisa Kroll, Inside the 2015 Forbes Billionaires List: Facts andFigures, Forbes (Mar. 2, 2015, 6:45 AM), http://www.forbes.com/sites/kerryadolan/2015/03/02/inside-the-2015-forbes-billionaires-list-facts-and-figures.
30 The Forbes 400, Forbes, Oct. 20, 2014, at 125-232.31 Todd Traub, Wal-Mart Used Technology to Become Supply Chain Leader, Ark. Busi-
ness, July 2, 2012, at S36.32 Boyan Jovanovic & Peter L. Rousseau, General Purpose Technologies, in 1B Hand-
book of Economic Growth 1181, 1185-86 (Philippe Aghion & Steven N. Durlauf eds.,2005).
33 See id.

TAX LAW REVIEW [Vol. 68:
all the talk about CEO pay, the Forbes list has few nonfounder CEOson it.34
IV. WEALTH VERSUS INCOME INEQUALITY
The book is primarily about wealth but our best evidence is aboutincome. I focus on the recent decades. The most systematic evidenceon wealth and inheritances that is presented in the book comes fromFrance. In a nutshell, wealth inequality in France has been quite sta-ble since the 1970's and so has labor income inequality.35 At the sametime Piketty documents that inheritances in France have beenincreasing.36
The U.S. evidence is less systematic and somewhat more controver-sial, as I explain below. Figure 2 presents estimates of the shares ofwealth held by the top 1% and the top 0.1% of the wealthiest in theUnited States. Until recently, all existing estimates of wealth concen-tration in the United States (based on surveys and estate tax data)suggested that this pattern has not changed much. This is the evidencethat is reported in Piketty.37
0.5-
0.4-
-a0.3-
0a)co
.r 0.2-
0.1 -
0.0
FIGURE 2WEALTH SHARES38
Estate tax multiplierSCFCapitalization
1920 1940 1960Year
1980 2000
34 See the Forbes 400, note 30.35 Piketty, note 1, at 272.36 Id. at 380.37 Id. at 347-50.38 Wojciech Kopczuk, What Do We Know About the Evolution of Top Wealth Shares in
552
1*\d\ Top 1%
'4 .4:
44'4..
/A ; */'4 4
~ 3~. r-.
~A.. -, ~ 4TopO.1%

2015] RECENT EVOLUTION OF INCOME AND WEALTH INEQUALITY 553
In very recent work, however, Saez and Gabriel Zucman documentan increase in the concentration of capital income on individual taxreturns and interpret the data as reflecting increased wealth concen-tration (the so called "capitalization method").39 I discuss these vari-ous sources of data below. I acknowledge uncertainty of what weknow, but personally find the direct measures of wealth concentration(which show little change) more compelling.
A. Measurement of Wealth Inequality
In a recent paper I discuss in detail the existing estimates of wealthconcentration, methodological issues that underlie these series, andthe potential explanations for discrepancies where they exist.4 0
In a nutshell, there are three ways of measuring wealth at the verytop of the distribution.41 The first one is surveys that oversamplehigh-net-worth families. The only such survey in the United States isthe Survey of Consumer Finances.42 Second, one can estimate wealthdistribution based on estate tax returns by adjusting wealth holdingsof decedents to be representative of the whole population.43 Third,much (though not all) of income that wealth generates (capital in-come) is taxable and potentially observable. One can attempt to learnfrom income about the underlying capital stock and construct esti-mates of wealth distribution in this fashion-this is known as capitali-zation method.44
the United States?, J. Econ. Persp., Winter 2015, at 47, 50.39 Emmanuel Saez & Gabriel Zucman, Wealth Inequality in the United States Since
1913: Evidence from Capitalized Income Tax Data 37-38 (Nat'l Bureau Econ. Research,Working Paper No. 20265, 2014), available at http://www.nber.org/papers/w20625.
40 Kopczuk, note 38, at 48-64.41 Separately, named lists of the wealthiest (such as Forbes 400) provide a less system-
atic supplementary source of information.42 Jesse Bricker, Lisa J. Dettling, Alice Henriques, Joanne W. Hsu, Kevin B. Moore,
John Sabelhaus, Jeffrey Thompson & Richard A. Windle, Changes in U.S. Family Financesfrom 2010 to 2013: Evidence from the Survey of Consumer Finances, Fed. Res. Bull., Sept.2014, at 5-6.
43 This is known as the "estate multiplier" approach. Robert J. Lampman, Changes inthe Share of Wealth Held by Top Wealth-Holders, 1922-1956, 41 Rev. Econ. & Stat. 379,380 (1959). The idea is to consider people indexed by i who died as being sampled fromthe living population-the sampling rate is the mortality rate mi. If mi is known, the distri-bution for the living population can be simply obtained by reweighting the data for dece-dents by inverse sampling weights 1/rm ("estate multipliers"). Lampman was the first toprovide such estimates for the United States (there are earlier estimates for the UnitedKingdom). Id. at 384-90. The key methodological difficulty has to do with selecting themortality rate appropriate for the group studied. Id. at 380. Wealth measured in this wayreflects wealth at death and hence is skewed by any tax avoidance and planning in anticipa-tion of death.
44 Saez & Zucman, note 39, at 9-11.

The SCF series in Figure 2 was compiled by Jesper Roine andDaniel Waldenstrm.45 The estate tax series is based on work by theauthor and Saez.46 Capitalization estimates are the most recent andare based on unpublished work of Saez and Zucman.47 Shortcomingsin coverage of data that have their source in availability in tax andsurvey information explain why not all series contain estimates foreach year. Differences in the wealth accounted for by differentsources and in the unit of observation (that is, individual versus house-hold) account for level differences but probably do not spill over todifferences in trends.
As Figure 2 shows, different series produce very different patterns.This is most stark in recent decades.48 In recent decades, the concen-tration of capital income has increased but that increase does notseem to be reflected by direct ways of measuring wealth in the SCFseries49 and estate tax data. Saez and Zucman have their preferredexplanations: They propose that the SCF series fails to adequatelysample the rising top of the wealth distribution and suggest that theestate tax estimates err by assuming that the difference in mortalityrates of the wealthy and general public stayed constant when, in fact,they may have diverged.50
These are plausible explanations but not without weaknesses. TheSCF series would have to become progressively worse over time toexplain the difference in trends. A significant nonresponse rate inparticular is certainly an issue with the SCF series, but as far as I cantell, it does not result in systematic bias.51
45 Roine & Waldenstrom, note 14, at 537-38. Roine and Waldenstrom's data is based onPeter H. Lindert, Three Centuries of Inequality in America, in 1 Handbook of IncomeInequality 167,189 (Anthony B. Atkinson & Francois Bourguignon eds., 2000); Edward N.Wolff, International Comparisons of Wealth Inequality, 42 Rev. Income & Wealth 433, 436(1996); Arthur B. Kennickell, Ponds and Streams: Wealth and Income in the U.S., 1989 to2007, at 35 (Fin. & Econ. Discussion Series, Working Paper No. 2009-13, 2009), available athttp://www.federalreserve.gov/pubs/feds/2009/200913/200913pap.pdf; Arthur B. Kennick-ell, Tossed and Turned: Wealth Dynamics of U.S. Households 2007-2009, at 13 (Fin. &Econ. Discussion Series, Working Paper No. 2011-51, 2011), available at http://www.federalreserve.gov/pubs/feds/2011/201151/revision/201151pap.pdf.
46 Wojciech Kopczuk & Emmanuel Saez, Top Wealth Shares in the United States, 1916-2000: Evidence from Estate Tax Returns, 57 Nat'l Tax J. 445, 450-81 (2004).
47 Saez & Zucman, note 39, at app. fig. 1.48 However, even for prior decades, relying on capital incomes produces a much
smoother pattern in the decline of wealth concentration in the 1930's and 1940's than doesthe estate tax series. See Kopczuk, note 38, at 50.
49 Roine & Waldenstrom, note 14, at 537-44.5o Saez & Zucman, note 39, at 3-4.51 See Arthur B. Kennickell, Getting to the Top: Reaching Wealthy Respondents in the
SCF 3-5, 23 (2009), available at http://www.federalreserve.gov/econresdata/scf/files/ASA200911.pdf. For further discussion, see generally Jesse Bricker, Alice M. Henriques, JakeA. Krimmel & John E. Sabelhaus, Measuring Income and Wealth at the Top Using Admin-istrative and Survey Data, (Federal Reserve Bd. Fin. & Econ. Discussion Series, Working
[Vol. 68:554 TAX LAW REVIEW

2015] RECENT EVOLUTION OF INCOME AND WEALTH INEQUALITY 555
Saez and Zucman show that the people that they classify as verywealthy (say the wealthiest 1% of "tax units") have significantly lowermortality rates than the general public and that the differential hasincreased over time.52 However, the magnitude of this change is notsufficient for explaining the difference between estate tax estimatesand capitalization estimates.53 Furthermore, the mortality rates thatunderlie Saez and Zucman's evidence are much lower than thosebased on other sources (such as Social Security data), suggesting thatderiving mortality estimates from the tax data is a perilous exercisedue to the fact that not everyone files a tax return.54
The evidence of increasing differentials in mortality rates observedin tax data that Saez and Zucman document, however, points to aninteresting possibility. Their evidence pertains not to the people thatare classified as wealthy based on their wealth holdings (because thoseare not observable directly), but rather the evidence is about peoplewith high capital incomes.55 It is possible and likely that, as incomeinequality has increased, people with the highest capital income areincreasingly active rather than passive earners, and that capital in-come increasingly reflects compensation rather than return on wealth.Furthermore, tax incentives, such as a step-up in basis at death,56 dis-courage realizing capital income shortly before death, so that the pop-ulation of high-capital-income earners is likely to have a longerexpected lifespan. A shift to representation of more active earners atthe top of the distribution may very well explain why the top of thecapital income distribution appears much healthier.
The problems with the capitalization approach are significant. Oneneeds to assume that the observed capital income reflects the normalrate of return on broadly defined asset classes.57 This presumes thatpeople at the top of the distribution do not earn rents in the form ofcapital income but, instead, effectively invest like everyone else withineach asset class, so that the sole source of differences are differences
Paper 2015-030, 2015), available at http://www.federalreserve.gov/econresdata/feds/2015/files/2015030pap.pdf; Kopczuk, note 38.
52 Saez & Zucman, note 39, at 35-36.53 See Kopczuk, note 38, at 62 n.5.54 Saez & Zucman, note 39, at 35. They also show that using their mortality rates to
apply an estate multiplier technique on the population of decedents in their data replicatestheir capitalization estimates, and they interpret this in favor of their approach. Id. at 35-37. This exercise has, however, a tautological element to it: By construction, the mortalityrates reflect a sampling rate corresponding to the population of decedents in the samedata. Hence, mechanically, the two approaches should produce the same result except forthe sampling error and do not provide independent evidence about the performance of theestate multiplier approach.
55 Id. at 5-21.56 IRC § 1014.57 See, e.g., Saez & Zucman, note 39, at 15-21.

in portfolio composition. It also presumes that the quantitative im-portance of the level and/or changes in the compensation componentof capital income is small, ruling out the increased importance of car-ried interest, stock option compensation, and various other ways ofreclassifying labor as capital income. Furthermore, tax incentiveshave changed over time in a way that favors capital income and realiz-ing income on individual income tax returns rather than retaining itwithin a firm. As an illustrative data point, the effect of the Tax Re-form Act of 198658 is again visible in the capitalization-based wealthseries without similar effects being present using the other twomethods.
The most surprising aspect of the estimates presented by Saez andZucman is that the growth in wealth concentration since 2000 is fullyaccounted for by assets generating fixed income.59 One possibility isthat it is true, although I would like to see some additional corroborat-ing evidence. The alternative explanation is that declining rates of re-turn require adjusting capital income from these types of assets by alarge factor and relatively small mistakes in estimating the rate of re-turn translate into very large errors in capitalization factors.
FIGURE 3COMPOSITION OF THE Top 0.1% WEALTH SHARE6 0
0.20
0.15-
Co
20.10-0
fl)
C/)
0.05-
0.001920 1940 1960
Year1980 2000
58 Pub. L. No. 99-514, 100 Stat. 2085 (1986).59 See Figure 3.6 Kopczuk, note 38, at 58.
Esaetxmliler aiaiain
Estate tax multiplier:- Net of fixed incomeI- Fixed income
¾
556 [Vol. 68:TAX LAW REVIEW
Capitalization:Net of fixed incomeFixed income
Y'
2015] RECENT EVOLUTION OF INCOME AND WEALTH INEQUALITY 557
As a final point, the assumption of no extraordinary capital incomesfor the wealthy is inconsistent with what Piketty appears to think.Piketty notes that large investors are likely to rely on intermediariesand be both more patient and more willing to take risk, resulting in ahigher rate of return.61 In fact, one of the important claims of thebook is that large fortunes have been growing faster than averagewealth in recent decades.62 While part of the explanation may be dif-ferences in portfolio composition, the rough division into stocks,bonds, housing, entrepreneurial wealth, and bank accounts is unlikelyto account for it.
V. CHANGES IN THE COMPOSITION OF THE Top WEALTH HOLDERS
At the end of the day, I suspect that estimates that are based ondirect observation of wealth (the SCF series or the estate tax method)are more reliable: While they may suffer from some sampling issues,it seems unlikely that the bias is sufficient to explain the difference intrends between capitalization and the direct methods; at the sametime the assumptions behind the capitalization method are heroic andsome of the patterns that emerge from it are quite puzzling. However,I acknowledge uncertainty of what we know, so that which of theseapproaches provides the right picture of wealth concentration is cer-tainly not a settled question.
The discrepancy between the different approaches starts in the early1980's. If, in fact, there has been no rapid trend in wealth shares, asthe SCF series and estate tax approaches indicate, how can it be con-sistent with rapidly growing income inequality? Alternatively, if topwealth has been trending, why did the other two approaches get pro-gressively worse?
I suspect that the difficulty with measurement in this case reflectsthe changing nature of inequality in the United States and it is not anaccident that results start to diverge at the same time that inequalityhas started growing. Explanations for differences between series havea common theme. Being based on individual income tax data, thecapitalization method captures the changing patterns of capital in-comes. Any reporting bias in the SCF series that increases over timeprobably would have its sources in the difficulties of capturing newwealth. Mortality assumptions and the perceived massive improve-ment in mortality of top capital income earners are likely to corre-spond to changes in the composition of that group. The bottom line is
61 Piketty, note 1, at 430-31.62 Id. at 431-35.
that the top of the wealth distribution has likely been fluid in recentdecades.
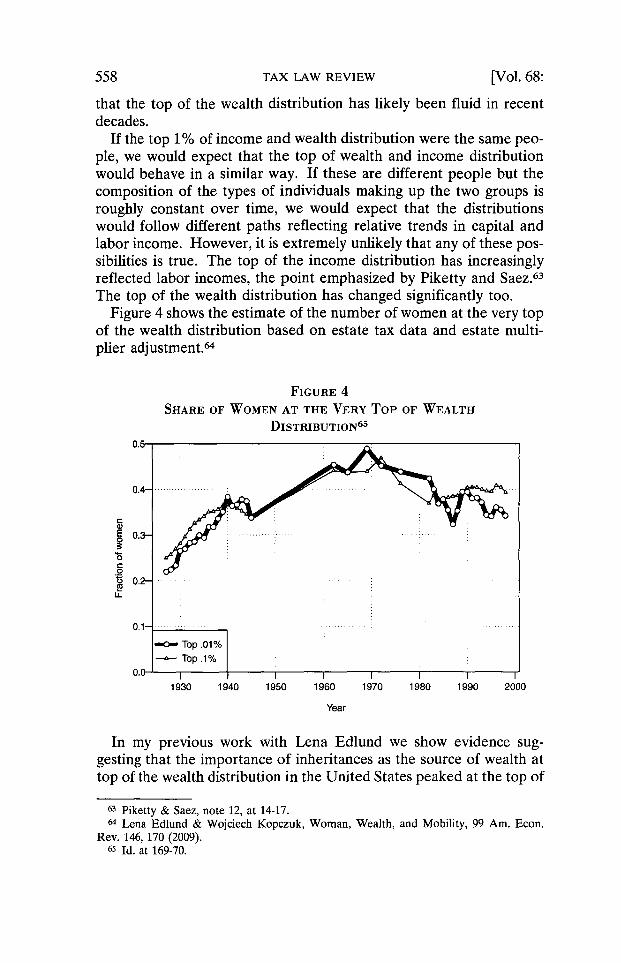
If the top 1% of income and wealth distribution were the same peo-ple, we would expect that the top of wealth and income distributionwould behave in a similar way. If these are different people but thecomposition of the types of individuals making up the two groups isroughly constant over time, we would expect that the distributionswould follow different paths reflecting relative trends in capital andlabor income. However, it is extremely unlikely that any of these pos-sibilities is true. The top of the income distribution has increasinglyreflected labor incomes, the point emphasized by Piketty and Saez.63
The top of the wealth distribution has changed significantly too.Figure 4 shows the estimate of the number of women at the very top
of the wealth distribution based on estate tax data and estate multi-plier adjustment.64
FIGURE 4SHARE OF WOMEN AT THE VERY Top OF WEALTH
DiSTRIBUTION 65
0.4-
E 0.3 -. ....... ..
0
0.1-
-- Top. 01%- Top .1%
0.0 1 1111111930 1940 1950 1960 1970 1980 1990 2000
Year
In my previous work with Lena Edlund we show evidence sug-gesting that the importance of inheritances as the source of wealth attop of the wealth distribution in the United States peaked at the top of
63 Piketty & Saez, note 12, at 14-17.64 Lena Edlund & Wojciech Kopczuk, Woman, Wealth, and Mobility, 99 Am. Econ.
Rev. 146, 170 (2009).65 Id. at 169-70.
[Vol. 68:558 TAX LAW REVIEW

2015] RECENT EVOLUTION OF INCOME AND WEALTH INEQUALITY 559
the wealth distribution in the 1970's and has declined since.66 Ourmain piece of evidence relies on the changing gender composition ofthe wealthiest estate taxpayers. Since the 1970's, the number of wo-men among those with the highest estates has actually declined.67
This is during the era when women have been making significantstrides in the labor market, including the top groups. We concludedthat this change reflects a shift away from inherited wealth and towardself-made wealth-inherited wealth is split roughly equally across gen-ders but self-made wealth is skewed toward men.6 8 This is also visiblein the Forbes 400 list (Table 1) that shows both a decline in the num-ber of women and the corresponding decline in inheritance as thesource of wealth.69
TABLE 1FORBEs 400 By GENDER: 1982-200370
# with inheritanceYear #Women %Women Total Women
1982198319841985198619871988198919901991199219931994199519961997199819992000200120022003
72746783888766677074707376757673696749474952
0.180.190.170.180.190.180.140.140.160.160.160.160.170.170.170.160.150.140.120.120.120.13
143142135159150143107114109110107104105969991878458605866
64676075767352515151494950464742403724252630
Men
78747483736955635859585555505249474734353236
% with inheritanceTotal Women Men
0.360.360.340.340.320.290.230.240.240.240.240.230.230.210.220.200.190.180.140.150.140.16
0.890.910.900.900.870.840.790.760.730.690.700.670.660.610.620.580.580.550.490.530.530.58
0.240.230.220.220.190.170.140.160.150.160.150.150.150.130.140.130.120.120.100.100.090.10
66 Id.67 Id.68 Id. at 165.69 Stephen Kaplan and Joshua Rauh also analyze the Forbes list (including more recent
years), reaching similar conclusions. Steven N. Kaplan & Joshua D. Rauh, Family, Educa-tion and Sources of Wealth Among the Richest Americans, 1982-2012, 103 Am. Econ. Rev.158, 160 (2013).
7o Edlund & Kopczuk, note 64, at 164 tbl.4. The authors used data about popular babynames to classify members of the Forbes lists by gender from 1982 to 2003. Id. at 176.
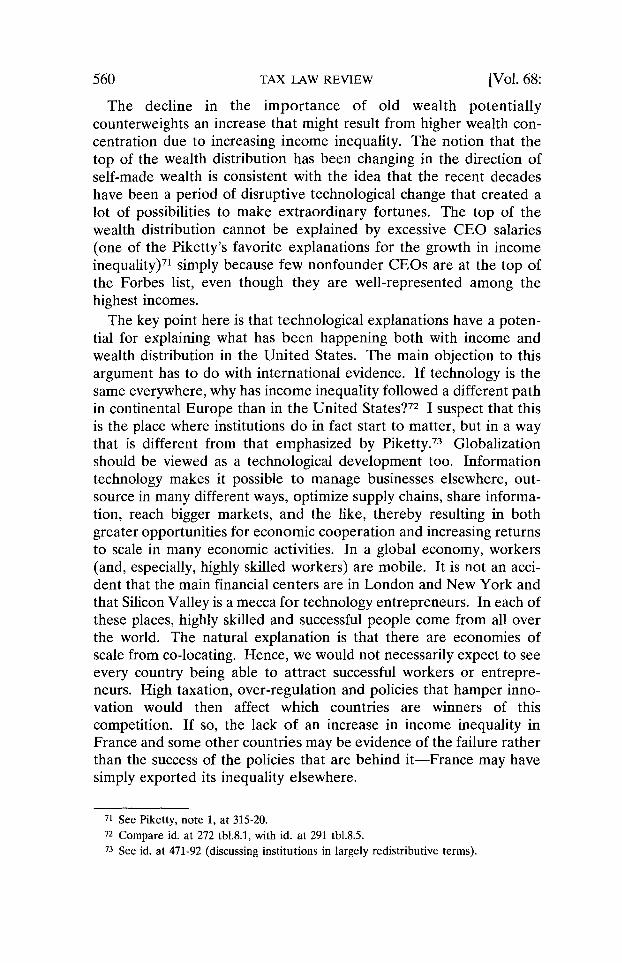
The decline in the importance of old wealth potentiallycounterweights an increase that might result from higher wealth con-centration due to increasing income inequality. The notion that thetop of the wealth distribution has been changing in the direction ofself-made wealth is consistent with the idea that the recent decadeshave been a period of disruptive technological change that created alot of possibilities to make extraordinary fortunes. The top of thewealth distribution cannot be explained by excessive CEO salaries(one of the Piketty's favorite explanations for the growth in incomeinequality)71 simply because few nonfounder CEOs are at the top ofthe Forbes list, even though they are well-represented among thehighest incomes.
The key point here is that technological explanations have a poten-tial for explaining what has been happening both with income andwealth distribution in the United States. The main objection to thisargument has to do with international evidence. If technology is thesame everywhere, why has income inequality followed a different pathin continental Europe than in the United States?72 I suspect that thisis the place where institutions do in fact start to matter, but in a waythat is different from that emphasized by Piketty.73 Globalizationshould be viewed as a technological development too. Informationtechnology makes it possible to manage businesses elsewhere, out-source in many different ways, optimize supply chains, share informa-tion, reach bigger markets, and the like, thereby resulting in bothgreater opportunities for economic cooperation and increasing returnsto scale in many economic activities. In a global economy, workers(and, especially, highly skilled workers) are mobile. It is not an acci-dent that the main financial centers are in London and New York andthat Silicon Valley is a mecca for technology entrepreneurs. In each ofthese places, highly skilled and successful people come from all overthe world. The natural explanation is that there are economies ofscale from co-locating. Hence, we would not necessarily expect to seeevery country being able to attract successful workers or entrepre-neurs. High taxation, over-regulation and policies that hamper inno-vation would then affect which countries are winners of thiscompetition. If so, the lack of an increase in income inequality inFrance and some other countries may be evidence of the failure ratherthan the success of the policies that are behind it-France may havesimply exported its inequality elsewhere.
71 See Piketty, note 1, at 315-20.72 Compare id. at 272 tbl.8.1, with id. at 291 tbl.8.5.73 See id. at 471-92 (discussing institutions in largely redistributive terms).
[Vol. 68:560 TAX IAW REVIEW

2015] RECENT EVOLUTION OF INCOME AND WEALTH INEQUALITY 561
VI. CONCLUSIONS
Why does the explanation for changes in inequality in recent de-cades matter? There are multiple reasons.
The first one is simply to have the right description of who we aretalking about when referring to the top of the distribution. CEOs,entrepreneurs, highly skilled workers, and inheritors are all very dif-ferent groups. If the composition of the top income and wealth hold-ers is changing, then presumably our view of the appropriate policyreaction changes as well.
The second reason has to do with merits. I subscribe to Piketty'sview that large inheritances are not meritocratic and I have written onthe role of estate taxation in addressing externalities that may resultfrom concentration of inheritances.74 Many members of the newelites are highly educated and entrepreneurial. There is certainly acontribution of family background to being successful based on thesecharacteristics, but nevertheless there is an important meritocraticcomponent to the growth in inequality that stems from favoringskilled labor.
The third reason has to do with projecting into the future. If tech-nological change is an explanation for the current transition in ine-quality, predictions about future changes in inequality becomedifficult. Clearly, today, we are no longer talking about ownership ofcapital just as a way of controlling means of production. The nature ofthe information-technology-based economy does not necessarily favorphysical capital. The importance of capital versus labor in the futureremains to be seen, but it is not clear at all that patterns from agricul-tural or industrial economies provide any information about sub-stitutability of labor and capital in the future.
The fourth point is about the potentially transitional nature of cur-rent inequality. The Kuznets curve is a useful framework for thinkingabout the evolution of inequality over the course of economic devel-opment: Inequality first increases when early adopters benefit, butthen technology spreads out, benefits others, and ultimately inequalitydeclines.75 There is no reason why there should be a single Kuznetscurve and every reason to believe that we are at the stage of techno-logical change in which early adoption is happening. In fact, multipletransitions can be happening at once: Evidence of improvements inthe standard of living in less developed economies (declining globalincome inequality, though not necessarily income or wealth concen-
74 Wojciech Kopczuk, Economics of Estate Taxation: Review of Theory and Evidence,63 Tax L. Rev. 139, 151-52 (2009); see also Piketty, note 1, at 417.
75 Simon Kuznets, Economic Growth and Income Inequality, 45 Am. Econ. Rev. 1, 3-6(1955).
TAX LAW REVIEW
tration) suggests that this process may be happening on the globalscale.76
The final point has to do with the recommended policy prescription.Piketty predicts a mechanically increasing role of capital and wealthinequality that will follow and proposes a global wealth tax as a way ofaddressing the problem.77 Implementing a policy like this would yieldno benefit but only distortions if the problem that it intends to addressultimately does not materialize. Of course, Piketty is also well awareof administrative issues that make implementation of such a tax diffi-cult.78 Similar administrative issues that would need to be resolved toimplement wealth taxation would also help in improving our ability totax capital income, so that I find a preference for taxing wealth overcapital income difficult to justify.
A separate point that I want to emphasize has to do with the poorequity properties of such a tax. A tax on wealth is primarily a tax onthe normal return to capital-precisely the opposite of what best taxpractice would suggest. To see that, imagine a 5% normal rate of re-turn and 1% wealth tax. Such a tax would collect slightly more than1% of the original principal. A 10% or so income tax would do so aswell. However, consider the possibility of extraordinary returns-rents, privileged investments, and the like. Such extraordinary returnswould be taxed lightly (at 1%) by a wealth tax but would be taxedhighly (say at 10%) by an equivalent income tax. A wealth tax pro-vides a tax break for precisely the wrong component of return oncapital.
If there is one thing to take from these comments, it is that the lastthirty years have been a period of technological transition. We havemade progress in documenting and understanding changes in incomeinequality, although we clearly still do not have the full picture of theforces behind it. The research on wealth inequality is still incom-plete-both in terms of reaching consensus about what has happenedand understanding how changes in income and wealth concentrationare related. Understanding the causes of wealth and income inequal-ity changes is key for informing policy.
76 See Piketty, note 1, at 430-70.77 Id. at 515-39.78 See id. at 515-18.
562