rebates as incentives - robert f. wagner graduate school
TRANSCRIPT
Rebates as Incentives:
The Effects of a Gym Membership Reimbursement Program
By TATIANA HOMONOFF, BARTON WILLAGE AND ALEXANDER WILLÉN*
A rich experimental literature demonstrates positive effects of pay-per-visit fitness incentives. However,
most insurance plans that provide fitness incentives follow a different structure, offering membership
reimbursements conditional on meeting a specific attendance threshold. We provide the first evidence in
the literature on gym incentives of this structure, exploiting the introduction and subsequent discontinuation
of a large-scale wellness program at a major American university. Our analysis leverages individual-level
administrative data on gym attendance for the universe of students over a five-year period: the three years
that the policy was in place, one year before implementation, and one year after termination. This provides
us with 100,000 student-year observations and 1.5 million gym visits. Using bunching methods and
difference-in-difference designs, we provide four empirical results. First, we document that the policy led
to significant bunching at the attendance threshold. Second, we show that the program increased average
gym visits by almost five visits per semester, a 20% increase from the mean. Third, we find that the policy
not only motivated students who were previously near the threshold, but rather increased attendance across
the entire visit distribution. Finally, we show that approximately 50% of the effect persists a year after
program termination. Taken together, these results suggest that rebate-framed incentives with a high
attendance threshold can induce healthy behaviors in the short-term, and that these positive behaviors
persist even after the incentives have been removed.
* Homonoff: Robert F. Wagner Graduate School of Public Service, New York University and NBER, 295 Lafayette
Street, New York, NY 10012 (e-mail: [email protected]). Willage: Department of Economics, Louisiana State
University, 2322 Business Education Complex South, 501 South Quad Drive, Baton Rouge, LA 70803 (e-mail:
[email protected]). Willén: Department of Economics and FAIR, Norwegian School of Economics, Helleveien 30,
5045 Bergen, Norway (e-mail: [email protected]). Willén gratefully acknowledges financial support from the
Research Council of Norway through its Centres of Excellence Scheme, FAIR project no. 262675. We thank James
Elwell, Mathias Ekström, Uri Gneezy, and Travis St. Clair as well as several other colleagues and seminar participants
for valuable feedback and suggestions.
2
1. Introduction
Less than 5 percent of the adult population in the US engage in the recommended level of daily physical
activity (Troiano et al. 2008), and this high level of inactivity may lead to increased medical costs, lowered
labor productivity and reduced well-being (e.g. Baicker et al. 2010; Deslandes et al. 2009; Lechner 2015).
These costs are often born by third parties such as employers, health insurers and state governments. In
response to the rising costs of physical inactivity, many of these organizations have initiated a number of
different wellness incentive programs to encourage physical activity, with financial subsidies and rebates
being the most common ones (NBGH 2011, Reis 2012).1 In 2013, close to 70 percent of all US firms with
more than 200 employees offered on-site gyms or gym membership discounts (Cawley 2014).
A rich experimental literature demonstrates positive effects of pay-per-visit fitness incentives on
gym attendance (Charness and Gneezy 2009; Acland and Levy 2012; Royer et al. 2015). However, the
policies implemented by health insurers rarely follow this incentive structure. Instead, most insurance plans
that provide fitness incentives offer membership reimbursements, often conditioning the rebate on meeting
a specific attendance threshold instead of compensating each visit. For example, Aetna’s “Fitness
Reimbursement Program,” UnitedHealthcare’s “Sweat Equity Program,” and Affinity’s “Fitness Rewards,”
each offer a membership reimbursement of up to $200 to members who attended the gym 50 times in a six-
month period.2 To our knowledge, there exists no research on the effects of gym incentive programs framed
as rebates, nor on programs that condition receipt on a high attendance threshold. As a consequence, little
is known about the effectiveness of one of the most common incentive programs currently in use.
This paper provides the first evidence in the literature on the effect of gym incentives of this
structure by analyzing the introduction and subsequent discontinuation of a large-scale wellness program
at a major American university. Conditional on receiving health insurance through the Student Health Plan
(SHP), the program offers full reimbursement of the university fitness membership fees ($75) for students
who attend the gym at least 50 times during the semester. The SHP requirement means that the program
disproportionately benefits graduate students at the university: while almost all of the university’s graduate
students have SHP, far fewer undergraduate students rely on this form of health insurance. Both the rebate-
framing of the incentive program as well as the high attendance threshold closely resemble many recent
fitness programs implemented by US health insurers, state governments, and higher education institutions,
making this an important program to evaluate.
1 The Patient Protection and Affordable Care Act (ACA) further encouraged the expansion of health-contingent
wellness programs by increasing the cap on the maximum reward provided. 2 Additionally, several state governments, including Maine, New York and New Hampshire, and higher education
institutions, including University of Minnesota, Binghamton University and University of North Dakota, offer gym
reimbursements with a similar attendance threshold.
3
To perform our analysis, we exploit individual-level administrative data on gym memberships and
gym attendance for the universe of students over a five-year period: the three years that the policy was in
place, one year before implementation, and one year after termination. Our data includes 100,000 student-
year observations and more than 1.5 million gym visits. This provides us with a larger sample and longer
time frame than many of the field experiments on gym incentives that dominate the literature.
We begin by documenting significant bunching at the 50-visit threshold among graduate students
in years when the policy is in place, consistent with the policy’s non-linear incentive scheme. Specifically,
using the nonparametric bunching method developed in Chetty et al. (2011), we find a large and statistically
significant excess mass right above the 50-visit threshold. We find no evidence of bunching among graduate
students in the year before the policy took effect nor in the year after the policy was discontinued. In
addition, we do not observe bunching for undergraduate students, a group that is largely ineligible for the
reimbursement.
The bunching estimator relies on a number of assumptions regarding the exclusion window,
functional form, and counterfactual distribution (e.g. Dekker et al. 2016; Blomquist and Newey 2017;
Aronsson et al. 2017; Marx 2018; Bertanha 2018). To ensure that our results are not driven by the
assumptions underlying this estimator, we employ a second estimation strategy, a difference-in-differences
design. This approach takes advantage of the fact that we have both pre- and post-policy data as well as a
population with almost universal exposure to the policy (graduate students) and a population with very
limited exposure (undergraduate students). Results from this analysis reveal that the policy led to a 7
percentage point increase in the likelihood of meeting the 50-visit threshold required for reimbursement.
More than half of this effect is driven by an increase in the likelihood of just crossing the threshold (i.e.,
attending between 50 and 60 times).
Given the design of the incentive, it is not necessarily the case that the observed effects on meeting
the attendance threshold translate into a substantial impact on gym attendance; if those who are incentivized
to change their gym attendance were very close to the threshold, then the impact of the policy on gym visits
will be small. However, we find large increases in average gym attendance as well: the introduction of the
policy increased overall gym attendance by almost 5 visits per semester, a 20% increase from the mean.
We show that these overall effects are not solely driven by individuals increasing gym attendance just
before the end of the reimbursement period. Rather, we find increased gym attendance in each month of
the reimbursement period. We find no effects of the policy on the extensive margin (i.e., becoming a gym
member).
After identifying a large effect of the policy on gym attendance across all eligible students, we
exploit the panel structure of our data to investigate whether these effects are driven by students who were
4
low- or high-frequency gym users prior to the policy’s introduction. While we find the largest effects on
crossing the threshold among students who were just below the threshold in the pre-period (a 16 percentage
point increase), we also find significant increases among students who attended the gym less than 10 times
in the year prior to the policy (a 7 percentage point increase). Thus, even though the threshold for
reimbursement was quite high, it still served as motivation for students at the bottom of the attendance
distribution.
In our final analysis, we take advantage of the unexpected discontinuation of the program in 2017
to examine if the effects persist over time. Using a difference-in-difference framework similar to our main
specification, we compare the post-policy/pre-policy difference in gym attendance of graduate students
with that same difference of undergraduate students. We find that the average gym attendance was 2 visits
higher per semester in the post-policy period relative to the pre-policy period among graduate students
compared to undergraduate students. This finding suggests that roughly half of the program effect persisted
in the year after the policy was terminated, suggesting a higher degree of persistence than observed in prior
studies (Acland and Levy 2012; Royer et al. 2015). Given the high attendance requirement under our policy,
these findings are consistent with the theoretical model in Carrera et al. (2017) and the empirical results in
Harris and Kessler (2019), which suggests that crossing a habit “threshold” may be necessary in order to
achieve sustained effects on gym attendance and exercise.
This paper makes several important contributions to the literature. First, to the best of our
knowledge, this is the first paper to explore the effects of a gym incentive program framed as a rebate. This
type of program closely models what many institutions and employers have implemented in recent years,
both in design (reimbursement conditional on attendance) and with respect to the attendance threshold level
(50 visits in six months), making our results informative about the effectiveness of existing programs.
Additionally, while other studies have examined the effect of providing free memberships on attendance
(Cappelen et al. 2017; Carrera et al. 2017), the loss-framing nature of the reimbursement program we study
may be more effective at encouraging attendance (Kahneman and Tversky 1979; Levitt et al. 2016; Field
2009; Hossain and List 2010; Rees-Jones 2018).3
Second, while a number of papers have evaluated the effectiveness of incentives for gym attendance
(Charness and Gneezy 2009; Acland and Levy 2012; Royer et al. 2015; Carrera et al. 2017; Cappelen et al.
2017; Carrera et al. 2018), this literature relies on results from field experiments rather than evaluations of
3 Fricke et al. (2017) presents results of a field experiment at a Swiss university in which gym incentives were
designed explicitly to evoke loss aversion by paying students upfront, then deducting payments if they failed to go to
the gym twice per week. This stands in contrast to earlier studies that frame the incentives as gains by only paying
participants once they have attended the gym (Charness and Gneezy 2009; Acland and Levy 2012; Royer et al.
2016).
5
institution-wide policies. The benefit of the natural experiment that we examine is that incentives were
available for a longer time period and that it provides us with a larger sample size. In addition, we do not
actively recruit participants. This is important, as individuals who selectively enroll in a study on gym
incentives might be more likely to respond to the incentive in question, yielding effects that may be larger
than what would be observed in the general population. However, it should be noted that our study
population consists of students at a higher education institution. These individuals are more educated, and
likely face tighter budget constraints, than the general population. While this represents a large and
important population, an interesting question for future research is to what extent these results can be
generalized to the regular (non-student) workplace settings.
Third, our paper contributes to a large literature evaluating the benefits of workplace wellness
programs. While a meta-analysis of the effectiveness of these programs shows substantial cost savings in
the form of reduced medical costs and worker absenteeism (Baicker et al. 2010), a recent study by Jones et
al. (2018) finds no effects of a large university’s wellness program on health expenditures and health
behaviors (including gym attendance). One key difference between the wellness program studied in Jones
et al. (2018) and the program studied in our setting, is that their program was more comprehensive,
providing financial incentives for a wide variety of wellness activities. Our results suggest that programs
that target a specific activity, such as gym attendance, may be more successful at changing behaviors. This
is interesting in light of recent studies showing that increased gym attendance leads to improved academic
performance (Cappelen et al. 2017).
Lastly, our results contribute to the debate on whether the effects of gym incentives persist after
the incentive is removed. While some studies in the gym attendance literature find evidence of persistent
effects (Charness and Gneezy 2009), others show that effects fade shortly after the incentives are removed
(Acland and Levy 2012; Royer et al. 2015). We find that roughly half of the treatment effect persists in the
year after the program was discontinued. This is particularly encouraging since prior studies that have
identified persistent effects of gym incentive programs only considered a follow-up period of a few months
(Charness and Gneezy 2009; Acland and Levy 2012).4
This rest of this paper is organized as follows: Section 2 provides institutional background and
economic intuition. Section 3 introduces our data and empirical strategy. Section 4 presents the main results
4 One exception is the study by Royer et al. (2015) which follows participants for three years after the removal of the
incentives. The authors find that participants who were offered financial incentives to attend the gym in addition to
the ability to contribute to a voluntary commitment device showed persistent effects on gym attendance, though the
effects were roughly one quarter of the increase in attendance while receiving incentives. In contrast, an incentive-
only group showed no evidence of habit formation after the first few post-intervention months.

6
on bunching and overall gym attendance. Section 5 investigates heterogeneity in response by pre-policy
attendance. Section 6 presents results on effect persistence. Section 7 concludes.
2. Institutional Background and Economic Intuition
i. SHP Membership Reimbursement Program
In 2014, a major American university launched a gym reimbursement program to incentivize physical
activity among its students. This initiative emerged from a collaboration between the university’s fitness
facilities and the SHP provider. The program’s stated objective was to promote healthy behaviors and help
enhance student well-being. The university decided to discontinue the program in 2017, three years after
its inception.5
The gym reimbursement initiative was a bi-annual rebate program, operating both in the
Spring/Summer (March through August) and in the Fall/Winter (September through February). The Fitness
Centers as well as the Student Health Center announced the implementation of the program through posters,
on their websites, and in their facilities.6 Program participants were eligible for a reimbursement of 50% of
the annual gym membership ($75) conditional on attending the gym 50 times during one of the two
reimbursement periods, approximately 2 gym visits per week.7 Participants who attended the gym 50 times
in both reimbursement periods received a reimbursement of 100% of their annual gym membership ($150).
Gym attendance was recorded by the Fitness Center staff, who swiped the student’s university card
and logged the visit in an online system when the student entered the gym area of one of the Fitness Centers.
The fact that the staff registered the visit alleviates program concerns regarding cheating (i.e., logging a
gym visit without actually attending the gym). Even though students can attend the Fitness Centers multiple
times per day, a maximum of one swipe is counted towards the reimbursement program per day.
Students can purchase a gym membership for the current semester (academic year) at any time, but
since the price of the membership is held fixed, the overwhelming majority of students purchase it during
the beginning of the semester (academic year). To encourage gym enrollment, the university advertises the
fitness facilities through posters, on their websites, and through emails. Among the students purchasing a
5 The discontinuation of the program was first announced to students on the Exercise Facility Reimbursement
webpage during the summer of 2017. Shortly after the announcement, multiple threads appeared on the university’s
“ask the dean” online student communication service (an online service in which graduate students can pose
questions to deans at the school about university life) regarding the discontinuation of the program, suggesting that
students did not anticipate the discontinuation. 6 In the second year of the policy, advertisement for the reimbursement program expanded to academic buildings
across campus. 7 More than 90% of gym memberships are purchased at the beginning of the academic year. This is because the
annual membership is only valid for the current academic year irrespective of when during the academic year the
membership is purchased, while the cost of the membership is fixed.
7
gym membership, those with SHP were automatically enrolled in the reimbursement program, while non-
SHP students were ineligible for the program.8 This eligibility requirement was imposed because the SHP
provider – and not the university – financed the initiative and reimbursements. In practice, this meant that
the program disproportionately benefited graduate students at the university: for example, in the 2015-2016
academic year, 98% of the university’s graduate students have SHP, while only 36% of undergraduate
students rely on this form of health insurance.
All students were able to track their daily gym attendance in the current membership period on the
university’s fitness website (Appendix Figure A1). To receive the reimbursement, a student had to submit
a simple form to the Office of Student Health Benefits (SHB) that included her name, student ID, and a
statement certifying that she had attended the gym at least 50 times in the six-month period. To verify that
the student had met the required visit threshold, SHB used the student's ID to retrieve data on gym
attendance for the reimbursement period from the Fitness Center Database, which tracks daily gym
attendance for all students. Following the verification process, a check was sent to the student for the
reimbursement amount.
ii. Economic Intuition and Predictions
While there exists a rich literature examining various wellness and fitness incentive programs, the design
of the incentive considered in this paper differs from those previously evaluated. Earlier studies commonly
provide participants free gym memberships (Royer et al. 2015; Cappelen et al. 2017) or pay participants
for each gym visit (Charness and Gneezy 2009; Acland and Levy 2012; Royer et al. 2015). In contrast,
individuals in our study must pay for their membership upfront and only receive the financial incentive
after they have met the 50-visit attendance requirement. As a result, the behavioral response to our policy
may be different from responses to gym incentives previously documented in the literature. For example,
the loss-framing of the incentive might be especially effective at encouraging attendance and the high
threshold for reimbursement may lead to particularly large behavioral changes.9 In contrast, the high
attendance threshold may discourage individuals from even attempting to earn the rebate. In this regard,
our contribution to the literature is important as the program we evaluate closely models what many
institutions and employers have implemented in recent years, both in design and with respect to the
attendance threshold level.
8 SHP status is determined prior to the start of each academic year, as enrollment and course selection is conditional
on students showing proof of valid health insurance. 9 Fricke et al. (2017) study a gym incentive program that most closely resembles the loss-framed incentives
considered in our study; however, in their study, participants are still rewarded for every gym visit rather than
conditioning payment on meeting an attendance threshold as in our setting.

8
We begin by investigating whether the rebate program led to bunching at the 50-visit threshold.
Since eligible students must attend the gym 50 times in a six-month period to obtain the reimbursement,
the rebate program incentivizes graduate students to attend the gym 50 times, but provides no additional
incentive for attending the gym more than 50 times. Thus, one likely implication of the program is that the
fraction of students who attend the gym exactly 50 times increases.
The second question we examine is whether the reimbursement program had a positive impact on
average gym attendance. This effect may be small or large even in the presence of significant bunching at
the 50-visit threshold. For example, if the policy only induces a behavioral response from students who
would have been very close to the policy threshold in the absence of the rebate, we would observe bunching
at the threshold, but only small increases in overall attendance. In contrast, if low-attendance students also
are incentivized by the policy, the effects on average gym attendance may be quite large, with the potential
for extensive margin effects (i.e., increases in gym memberships) as well.
A third, related question, asks who responds to the incentive: previously high- or low-frequency
attendees? We analyze heterogeneous treatment effects across the pre-reform gym attendance distribution.
While individuals close to the 50-visit threshold only need to increase attendance by a few visits, those far
below the threshold will have to greatly increase their gym attendance to reap the benefits of the incentive
program. We predict an increase in gym attendance for students who would have gone to the gym less than
50 times in the absence of the program. The predictions for students who would have attended the gym
more than 50 times are less clear. Specifically, individuals who typically attend the gym more than 50 times
may interpret the 50-count threshold as a reference point or a sign of what constitutes a healthy amount of
exercise, and adjust their gym behavior downwards. Because of this possibility, we also investigate if high-
frequency gym users decrease their gym attendance down to the 50-visit threshold.
The final question we investigate is whether the rebate program led to a change in gym behavior
that persists even after the termination of the program. The rationale underlying this question is that the
potential increase in gym attendance among graduate students may cause these individuals to form lasting
habits.10 If graduate students develop exercise habits, their post-policy gym count would be higher than if
they had never been exposed to the rebate program. The theoretical model in Carrera et al. (2017) suggests
that habit formation might be particularly likely in our setting, since the high attendance requirement to
receive the reimbursement requires that students develop a sufficient “habit stock” which they argue is
necessary for sustained increases in physical activity.
10 While the literature often refers to persistence in the effect of gym incentives as habit formation, it is important to
note that persistence in our context may be due to channels other than an accumulation of habit stock, such as
learning or building social networks around attendance.

9
3. Data and Empirical Methodology
i. Data
To evaluate the effect of the reimbursement program on gym attendance, we rely on individual-level
administrative data. These data contain information on gym membership and daily gym attendance over a
five-year period. Our data spans academic years 2013-14 to 2017-18, covering one year before the policy
was implemented, the three years in which the reimbursement was available, and one year after the policy
was discontinued. The data include the universe of undergraduates and graduate students with gym
memberships. During our analysis period, university enrollment averaged just under 20,000 students per
year, with undergraduates comprising roughly three quarters of the student body.11
The membership data set includes a unique identifier for each student, student type (undergraduate
or graduate), membership start date, and whether the membership was for the Fall, Spring, or full academic
year. While we do not have data on students who did not purchase gym memberships, we collected annual
Fall enrollments for each student type from the Office of the Bursar, allowing us to calculate annual
membership rates for both graduate and undergraduate students.
We link the membership data to visit-level data on gym attendance. These data come from the
Fitness Center Database, which records each time a student swipes his student ID card at a university
facility. These data include a unique student identifier, visit date, and location, allowing us to calculate
individual-level attendance measures within each semester and across years. In total, our data set includes
approximately 100,000 student-year observations and more than 1.5 million gym visits. Our data set is
substantially larger than most other studies that have examined responses to gym incentives, both in terms
of sample size and study period.
While this data set includes detailed data on gym attendance, it does not include information on
whether a student is enrolled in SHP, so we are unable to determine who is eligible for the gym
reimbursement. However, while a smaller fraction of undergraduate students enroll in SHP, nearly all
graduate students are SHP members. Therefore, in our difference-in-difference analysis, we proxy for
11 While we have individual-level identifiers in the data we received from the fitness center, it is important to note
that a student is only in this data set if s/he has a gym membership. We are therefore unable to identify whether a
given student is present at the university in a certain year, only whether that student has a gym membership. In other
words, we cannot track individual students across years that do not have gym memberships. However, in Section 4
we will show that there is no extensive margin effect of the policy (i.e., an effect on gym memberships), so this data
limitation should not bias our results on the intensive margin.
10
rebate eligibility using the graduate student population, and we use undergraduates as a control.12 Our
results are therefore best interpreted as intent-to-treat effects, and likely represent a lower bound of the true
treatment effects.
ii. Empirical Methodology
To examine whether eligible students appear to bunch just above the 50-visit threshold in response to the
program, we first rely on the nonparametric bunching method proposed by Saez (2010) and further
developed by Chetty et al. (2011). This method compares the observed distribution of gym attendance
around the 50-visit threshold to a counterfactual attendance distribution in which there is no policy
response.
While we can observe the actual mass around the threshold, we cannot observe what the mass
would have been in the absence of the policy. To obtain a counterfactual distribution, we follow the methods
detailed in Chetty et al. (2011). We begin by choosing an analysis window which specifies the sample that
we use to estimate the counterfactual distribution. We then fit a flexible polynomial to this distribution,
excluding observations in a window just above the threshold where we expect individuals to bunch (i.e. the
region of excess mass) and just below the threshold where we believe the bunchers are coming from (i.e.
the region of missing mass). To identify this window, we iteratively vary the bounds of the manipulation
region (the region of excess mass and the region of missing mass) until excess mass equals missing mass
(i.e., until the integration constraint has been satisfied). This method relies on an identifying assumption
that the counterfactual density distribution would have been smooth around the threshold in the absence of
the financial incentive.
We estimate the size of the excess mass around the threshold by comparing the observed density
to the estimated counterfactual density. This provides us with two parameters, both detailed in Dee et al.
(2019): total manipulation and in-range manipulation. The total manipulation parameter estimates the
excess mass as a percent of the number of observations in the analysis window, while the in-range
12 Around one third of undergraduates are eligible for the rebate, and there are several reasons why these students
may be less likely to respond to the policy. First, undergraduates may be more likely to bill their gym membership to
their parents than graduate students; at the same time, undergraduates who do not rely on their parents’ finances may
find it difficult to pay the upfront fees. Additionally, student athletes receive gym memberships for free. For these
reasons, the reimbursement policy may be a weaker incentive for undergraduate students even among those who are
eligible for the program.

11
manipulation parameter provides an estimate of the excess mass as a fraction of the number of observations
in the region of missing mass measured by the counterfactual distribution.13
The advantage of the bunching method is that it can nonparametrically identify behavioral
responses at the incentive threshold using a single cross-section of data. However, the assumptions required
to construct the counterfactual distribution represent a limitation of this method. Specifically, the
counterfactual distribution is obtained using nonparametric polynomial smoothing based on a visual
identification of the region of excess mass. The counterfactual density in the specified manipulation range
is thus an out-of-sample prediction that may not be well fitted, especially if the policy leads to behavioral
changes in the density distribution far from the threshold. Many of these concerns have been discussed in
the literature (e.g. Dekker et al. 2016; Blomquist and Newey 2017; Aronsson et al. 2017; Marx 2018;
Bertanha 2018).
One key benefit of our data and setting is that we do not need to rely on a single cross-section of
treated individuals to construct a counterfactual distribution. Specifically, we have data from before and
after the rebate program, for a treatment group (graduate students) as well as a control group (undergraduate
students). These two features permit us to examine the effect of the policy using a difference-in-difference
design, comparing gym attendance during periods in which the policy was available to periods in which it
was not for graduate students relative to undergraduate students. An additional advantage of this method is
that it allows us to estimate an effect that is less local to the threshold compared to the bunching method,
and to estimate the effect of the policy on overall gym attendance.
To estimate the causal effect of the rebate program on individual gym behavior using our
difference-in-difference design, we rely on the following equation:
(1) 𝑌𝑖𝑡 = 𝛽0 + 𝛽1[𝐺𝑟𝑎𝑑𝑖 ∗ 𝑃𝑜𝑙𝑖𝑐𝑦𝑂𝑛𝑡] + 𝛽2𝐺𝑟𝑎𝑑𝑖 + 𝛽3𝑃𝑜𝑙𝑖𝑐𝑦𝑂𝑛𝑡 + 휀𝑖𝑡,
where 𝑌𝑖𝑡 is one of our gym attendance measures for individual i at time t. The outcomes are measured at
the 6-month level – the length of the reimbursement periods. The dichotomous variable 𝐺𝑟𝑎𝑑𝑖 takes the
value of 1 if person i is a graduate student, and 𝑃𝑜𝑙𝑖𝑐𝑦𝑂𝑛𝑡 is an indicator variable that equals 1 if the rebate
program was active at time t. 𝛽1 is the parameter of interest, and measures the intent-to-treat effect of the
rebate program on gym behavior.14 In Section 4, we also demonstrate that our results are robust to the
13 We calculate standard errors using the parametric bootstrapping method described in Chetty et al. (2011) in which
we create a new density distribution, drawn with replacement from the distribution of residuals in our estimated
counterfactual distribution, to generate our bootstrapped estimates. 14 In our setting, treatment is assigned at the student type level (graduate/undergraduate); however, standard
inference techniques require more than two clusters to compute standard errors. One potential solution to this issue
is to rely on bootstrapped standard errors, in which we take samples (with replacement) from our data, calculate our

12
inclusion of individual-level fixed effects, which controls for time-invariant differences in gym attendance
across the individuals in our sample. It is important to note that we use graduate student status as a proxy
for treatment, such that the effects produced by (1) should be interpreted as the intent-to-treat (ITT) effect
of the policy. Assuming that the SHP rates for graduate and undergraduate students with a gym membership
are the same as the aggregate university-wide SHP rates for graduate and undergraduate students, the ITT
estimates can be converted to treatment-on-the-treated (TOT) effect by scaling them with the difference in
the fraction of graduate students eligible for the rebate (0.98) and the fraction of undergraduate students
eligible for the rebate (0.36). While we focus on the ITT effects in the paper, we provide the implied TOT
effect in the discussion.
The key identifying assumption for our difference-in-differences analysis is that there are no secular
trends, shocks or policies that occurred concurrently with the implementation of the reimbursement
program that differentially affect the gym attendance of graduate and undergraduate students.15 While data
limitations prevent us from examining the parallel trend assumption using conventional nonparametric
event studies (due to the availability of only one year of pre-policy data), several factors help guard us
against such concerns. First, we have access to a year of data on gym attendance after the policy was
discontinued. If temporal trends drive our results, we would not expect a reduction in the effect after policy
termination, something that we examine directly. Second, bias from secular trends and concurrent shocks
specific to graduate students would lead to differences in overall gym attendance, but not to differences in
attendance specifically at the 50-visit threshold, something which we directly investigate. Third, to the best
of our knowledge, there were no other policy changes at the university during out analysis period that
affected the gym attendance of graduate students.
4. Effect of Rebate on Gym Attendance A. Bunching at the 50-visit Threshold
i. Graphical Depiction
In Section 2, we note that the rebate program may incentivize individuals to bunch just above the 50-visit
threshold. The rationale underlying this hypothesis is that the program rewards individuals who attend the
gym 50 times, but provides no additional incentive to students who visit the gym more than 50 times. If
estimate of interest, and use the sample standard deviation of these estimates (across bootstraps) as an estimate of
the standard error. All our results are based on this technique, using 1000 bootstrap repetitions. All our results are
robust to clustering at the individual level. 15 In other words, while there may be differences in gym attendance levels and characteristics between graduate and
undergraduate students, these differences do not pose a threat to our identification strategy as long as they have the
same counterfactual trend.
13
students minimize the effort required to earn the rebate, we would expect a high level of bunching just
above the reimbursement threshold.
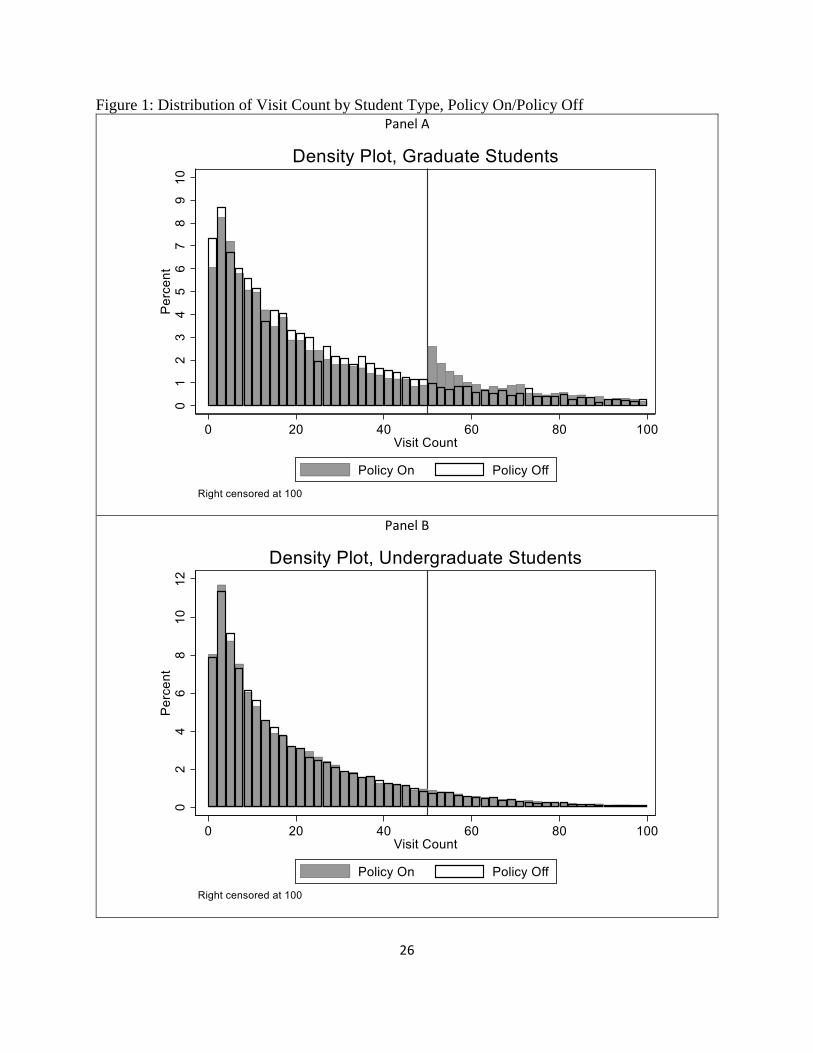
To investigate this question, we first plot the density of gym visits among graduate students for the
years in which the program was in effect, and overlay the same density when rebates were not available.
The results from this exercise are provided in Panel A of Figure 1. The figure shows that the distribution of
gym visits is smooth across the threshold in years without rebates, and that there is clear evidence of
bunching just above the 50-visit threshold in the years when reimbursements were available.
Panel B of Figure 1 replicates this analysis for undergraduate students, the majority of whom were
ineligible for the rebate. The distributions of gym attendance for undergraduates versus graduates are
similar in the pre-period, both in terms of level and shape. However, the distribution for undergraduates is
nearly identical for the policy-on and policy-off periods and shows no evidence of bunching at the 50-visit
threshold.
ii. Bunching Estimation
In this section, we use the bunching estimator outlined in Section 2 to estimate the size of the excess mass
just above the 50-visit threshold. A graphical illustration of our results are provided in Panel A of Figure 2,
which plots the observed density of gym attendance among graduate students during the year in which the
reimbursement was available (solid line) as well as the constructed counterfactual density function obtained
by fitting a flexible polynomial through the observed density excluding the manipulation region.16 These
distributions suggest that there is a large excess mass just above the 50-visit threshold.
Table 1 uses these two distributions to estimate the extent of bunching. Column (i) presents our
estimate of the total manipulation for graduate students during the years in which the reimbursement was
available. We find that the proportion of excess students with gym attendance between 50 and 60 visits per
semester is 3.9 percent of all students in our estimation window, i.e., just under 4 percent of students alter
their gym attendance to bunch just above the threshold.17 Column (ii) presents the estimate of the in-range
manipulation, the probability of bunching conditional on falling just below the insolvency threshold, and
finds that 13.6 percent of students just below the threshold (20 to 49 visits) increase their attendance level
to be above the threshold.
16 We define the analysis window as 1 to 70 visits, the manipulation region as 20 to 60 visits, and the region of
excess mass as 50 and 60 visits so as to satisfy the integration constraint. We use a fourth-order polynomial based on
the sharp drop that occurs in the Akaike Information Criterion (AIC) between orders three and four. 17 The McCrary Density Test – another common test for examining discontinuities in densities around certain
thresholds – also provides strong evidence of bunching at the 50-visit threshold (see Appendix Figure A2).

14
A strength of our data and setting is that we have information on gym attendance from before and
after the rebate program was implemented. To ensure that our results in Panel A of Figure 2 are not driven
by potentially unobserved confounders, we take advantage of this feature and perform the same bunching
estimation for graduate students during the years when the reimbursement was not available. Panel B of
Figure 2 replicates Panel A for this placebo sample and shows no visual evidence of bunching in years
when the reimbursement was not available. Column (iii) of Table 1 presents the estimate of the total
manipulation for this sample and shows that the estimate is near zero and not statistically significant. We
can also use the observed data in Panel B of Figure 2 as an alternative counterfactual distribution in our
bunching analysis. We find very similar estimates as those in Table 1: our total manipulation estimate is
4.2 percent and our in-range manipulation estimate is 14.5 percent.
Another unique feature of our data is that we also have information on gym attendance for a group
of students that largely was unexposed to the policy – undergraduate students. We take advantage of this
feature and perform the bunching estimation on undergraduate students as well, both during the policy years
(Panel C) and in years without the policy (Panel D). In both cases, we would not expect to see any bunching
behavior around the 50-visit threshold. Looking at these two panels of Figure 2 along with our estimates of
the total manipulation in Columns (iv) and (v) of Table 1, we find small and not statistically significant
estimates for bunching at the 50-visit threshold.
iii. Difference-in-Difference
The results provided above suggest that students who were eligible for the rebate responded to the
reimbursement policy by bunching just above the 50-visit threshold. In this section, we take advantage of
data on pre-policy years as well as on a population of students who were largely unaffected by the policy,
to provide additional evidence on the behavioral response to the policy through the difference-in-differences
design outlined in Section 2.
Difference-in-differences results based on equation (1) are presented in Table 2, where the outcome
is a binary variable for attending the gym between 50 and 60 times in the six-month reimbursement period.
The table estimates the effect of the policy using three different comparisons: comparing the rebate period
to both the pre-rebate and post-rebate period (Column i), comparing only the pre-period and the rebate
period (Column ii), and comparing only the post-period and the rebate period (Column iii). Each
specification shows that the policy led to a 4 percentage point increase in the probability of attending the
gym between 50 and 60 times. Reassuringly, this estimate is nearly identical to our total manipulation
estimate from the prior section.

15
While the estimates in Table 2 are helpful for verifying the results obtained through our non-
parametric bunching estimator (Table 1), we do not need to specify a bunching window when using the
difference-in-difference specification. We can therefore redefine the outcome variable to represent the
probability of reaching the threshold (attending the gym 50 or more times) rather than the probability of
bunching (attending the gym between 50 and 60 times). This allows us to answer a separate but related and
policy-relevant question: what is the effect of the policy on the likelihood of meeting the reimbursement
attendance requirement (i.e., attending the gym at least 50 times in a semester)? Results from this exercise
are shown in Table 3. We find that, regardless of specification choice, the policy led to an increase of 7
percentage points in the likelihood of crossing the reimbursement threshold. Taken together with the results
from Table 2, this suggests that more than half of the effect is driven by an increase in the likelihood of just
crossing the threshold.
B. Number of Gym Visits
In this section, we examine if the program led to an increase in the number of gym visits conditional on
having a gym membership. As mentioned in Section 2, even with large effects on crossing the
reimbursement threshold, the effect on the average number of visits could be large or small depending on
the counterfactual attendance of the students who responded to the incentive.
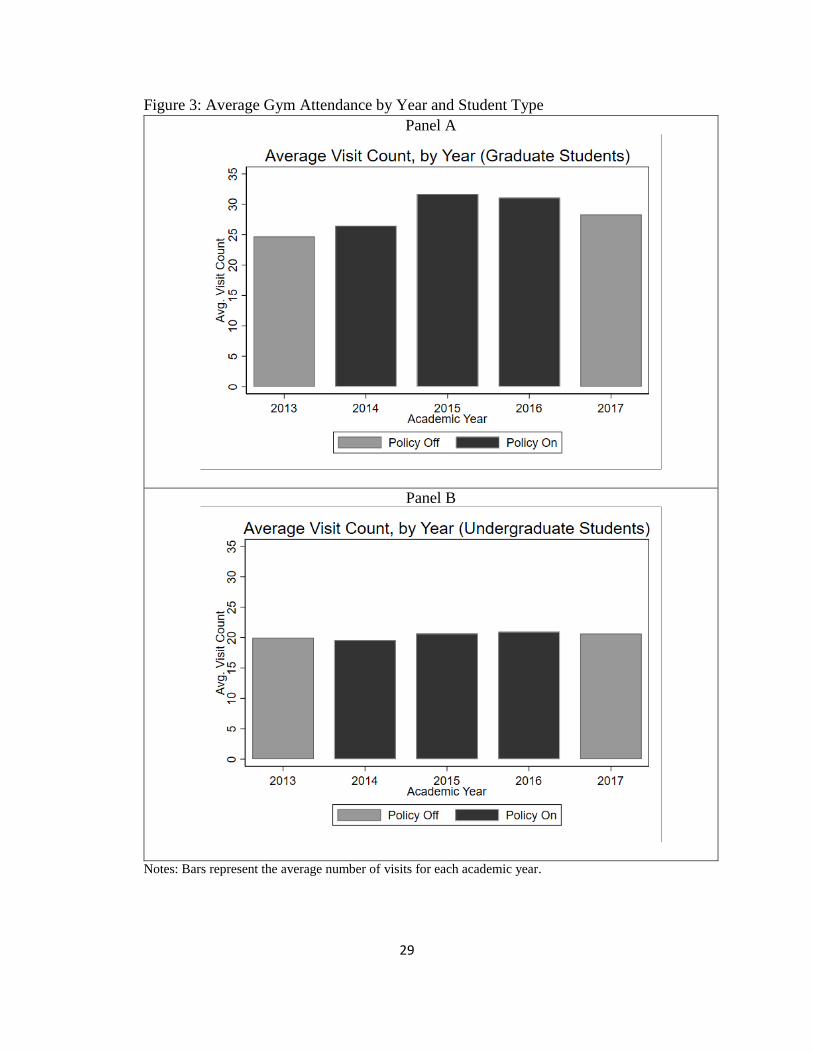
Figure 3 plots the average visit count over time for graduate students (Panel A) and undergraduate
students (Panel B). This figure provides evidence that graduate students visit the gym more often during
the years in which the policy was in effect (AY 2014 - AY 2016), while no such behavior can be observed
among undergraduate students. Specifically, Panel A of Figure 3 shows that graduate students attended the
gym an average of 25 times per semester prior to the introduction of the rebate program. This number
increased slightly in the first year of the program, and increased even more in second and third years of the
program (around 30 visits). The gradual increase in gym attendance over time could be due to imperfect
information about the existence of the program in the first year and the increased advertisement of the rebate
in the second year of the policy. Panel B of Figure 3 shows that undergraduate attendance remained constant
throughout the entire period.
Table 4 shows the difference-in-differences results obtained from estimating equation (1) using
number of gym visits as the dependent variable. In Column (i), we compare the rebate period to both the
pre- and the post-period. The results demonstrate that graduate students increase gym visits when rebates
are available. Specifically, the gym reimbursement program led to a significant increase in the number of
gym visits of approximately 3.5 visits per six-month period.
In Column (ii) of Table 4, we restrict the comparison to the pre-period and the rebate period, and
in Column (iii) we only compare the post-period with the rebate period. We find that the magnitude of the

16
point estimate is larger when we restrict the comparison to the pre-period and the rebate period (4.6 visits)
compared to when we compare the post-period with the rebate period (2.4 visits). These findings are
consistent with a model in which the reimbursement program led to habit formation in the year after the
policy was discontinued, an outcome we address in Section 6. Therefore, results in Column (i) that use both
the pre- and post-policy period are likely to be downward biased. Thus, we consider the specification
underlying the results in Column (ii) to be our preferred specification.
To obtain the implied treatment-on-the-treated effect based on this result, we can scale the point
estimate by the difference in the fraction of graduate students eligible for the rebate and the fraction of
undergraduate students eligible for the rebate. This yields an implied treatment-on-the-treated effect of
approximately 7.4 visits per semester (4.6
(0.98−0.36)), representing a 33% increase from the mean.18
It should be noted that the composition of our sample naturally changes across years due to
incoming and graduating students. One possible concern is that these compositional shifts are larger among
graduate students due to the potential shorter duration of their study programs, in particular master’s
programs. However, at the start of our sample period, roughly 60 percent of the university’s graduate
students were PhDs. This suggests that the two student populations (graduates and undergraduates) are
enrolled at the university for a similar number of years. The results displayed in Appendix Table A1 show
that our findings are robust to including individual-level fixed effects and restricting the sample to students
who are present in the year before the policy was implemented and at least two of the three policy-on years.
To explore this issue further, we perform an auxiliary analysis in which we repeat the analyses in Tables 3
and 4, but restrict the sample to individuals who were present in our data for the entire five year period.
Reassuringly, the results from this exercise in Appendix Table A2 are consistent with our main findings,
though the magnitude of the effects are larger. This is expected, because these individuals are students who
have purchased a gym membership for five years in a row, and therefore have much higher baseline gym
attendance. As a percentage of the mean, the effect is very similar to our main results. This suggests that
the naturally-occurring compositional shifts caused by incoming and graduating students are unlikely to
drive our effects.
While the policy’s stated goal is to increase overall gym attendance, it is also interesting to examine
the pattern of increases in gym attendance induced by the policy. For example, overconfident students may
increase gym attendance at the start of the semester in anticipation of attending 50 times, but decrease
attendance when they realize they are unlikely to meet the threshold. Alternatively, students who are close
18 However, since we do not know the SHP rates among graduate and undergraduate students with a gym
membership, but only the aggregate SHP rates among graduate and undergraduate students in general, we
recommend caution when interpreting the implied treatment-on-the-treated effects.

17
to the threshold near the end of the semester may increase attendance in the last month of the semester in
order to qualify for the reimbursement.
To examine the time pattern of the attendance effects, Figure 4 shows the estimate for Column (ii)
of Table 4 separately for each month of the reimbursement period.19 While there is month-to-month
variation in the effect of the policy, and some evidence of increased effects towards the end of the six-
month reimbursement period, all months’ estimates are meaningfully large and statistically significant at
conventional levels.20 This suggests that the attendance effects identified in Table 4 are not driven
exclusively by individuals substantially increasing their gym attendance just before the reimbursement
period ends, or by individuals substantially increasing their gym attendance in the beginning of the period
to then decrease attendance when they realize they are unlikely to meet the threshold.
C. Gym Membership
The analyses above estimate the intensive margin effect of the reimbursement program, i.e., the effect of
the policy among students with gym memberships. However, the reimbursement program may also serve
as an incentive for eligible students to purchase a membership. Specifically, eligible students who may have
been deterred from joining the gym due to the cost of the membership, but who expect to meet the 50-visit
threshold if they had a membership, may be incentivized to enroll. If the rebate policy has a separate effect
on purchasing a gym membership, our intensive margin estimates will suffer from selection bias. For
example, students who purchase memberships in response to the policy may be more likely to meet the
attendance threshold than those who purchased memberships in the absence of the policy. While there exists
a large literature examining the effectiveness of various fitness incentive programs through field
experiments, the majority of these studies either provide free gym memberships or incentives to join for all
experiment participants (Royer et al. 2015), or target populations that already have gym memberships
(Charness and Gneezy 2009; Carrera et al. 2018). Therefore, our ability to look at potential extensive margin
effects provides an important contribution.
Suggestive evidence of the program’s effect on membership take-up is shown in Figure 5, which
plots the gym membership rate for graduate students (Panel A) and undergraduate students (Panel B) over
19Each dot in the figure presents the coefficient estimate from a modified version of equation (1) in which we
interact our main treatment variable with the specific month of the reimbursement period: Estimating equation:
𝑌𝑖𝑡𝑚 = 𝛽0 + ∑ 𝛼𝑚6𝑚=1 [𝐺𝑟𝑎𝑑𝑖 ∗ 𝑃𝑜𝑙𝑖𝑐𝑦𝑂𝑛𝑡 ∗ 𝑀𝑜𝑛𝑡ℎ𝑚] + ∑ 𝛾𝑚
6𝑚=1 [𝐺𝑟𝑎𝑑𝑖 ∗ 𝑀𝑜𝑛𝑡ℎ𝑚] + ∑ 𝛿𝑚
6𝑚=1 [𝑃𝑜𝑙𝑖𝑐𝑦𝑂𝑛𝑡 ∗
𝑀𝑜𝑛𝑡ℎ𝑚] + ∑ 휁𝑚6𝑚=1 [𝑀𝑜𝑛𝑡ℎ𝑚] + 휀𝑖𝑡𝑚.
20 P-values for each month range from 0.088 to less than 0.001. To the extent that cheating, i.e., swiping a
membership card but not actually attending the gym, is more likely to occur in the last month of the reimbursement
period, these results suggest that our main results are unlikely to be substantially affected. Separately, as described
in Section 2, the fact that gym attendants (and not students) swipe the card, we believe that our data is unlikely to
include these types of visits.

18
time. While the figure shows that membership rates differed across the two groups – 26% of graduate
students had a membership compared to 42% of undergraduates – the within-group rates remained stable
throughout the study period.
To formally estimate if the program led to an increase in membership take-up, Table 5 shows
difference-in-differences results obtained from estimating equation (1) with membership enrollment as the
dependent variable. In Column (i) we use all years of data comparing both the pre- and post-period to the
rebate period, in Column (ii) we restrict the comparison to the pre-period and the rebate period, and in
Column (iii) we only compare the post-period with the rebate period. The results in Table 5 are consistent
with Figure 5; the policy’s effect on membership take-up is very small and not statistically significant.
These results suggest that any potential effects on the intensive margin are not driven by changes in sample
composition.
5. Heterogeneity by Prior Gym Attendance A unique feature of our panel data is that we have information on pre-policy gym attendance for both
graduate and undergraduate students. This allows us to separately estimate the behavioral response to the
policy conditional on various levels of pre-policy gym attendance. In other words, we can determine
whether we observe changes in gym attendance only among students who were previously close to the 50-
visit threshold, or if the policy induced students from across the pre-policy distribution to increase their
gym attendance.
To explore this question, we estimate our difference-in-difference model separately by pre-policy
gym attendance. Specifically, we estimate the model separately for students based on how often they visited
the gym in the Fall prior to policy implementation: less than 10 times, 10-19 times, 20-29 times, 30-49
times, or more than 50 times.21 Estimating the effect of the policy on both the likelihood of meeting the 50-
visit threshold and average gym attendance in this heterogeneity analysis is interesting, since individuals
will need to increase their gym attendance by differential amounts to reach the reimbursement threshold
depending on their pre-period attendance. The use of undergrads as a counterfactual allows us to control
for factors such as mean reversion and other changes in attendance over time.
Panel A of Table 6 presents results on the likelihood of meeting the 50-visit threshold. Consistent
with our hypothesis, we find the largest effects among students just below the threshold in year prior to the
policy. Specifically, for students with a pre-policy attendance of 30 to 49 visits, the policy led to a 16
21 Since this analysis relies on observing gym attendance in the pre-period, these regressions are restricted to
students who were gym members in the Fall of 2013 as well as during the period in which the reimbursement was
available.

19
percentage point increase in the likelihood of crossing the 50-visit threshold. For students with a pre-policy
attendance of 20-29 visits, the estimate is smaller, but only marginally so (13 percentage points). These
estimates are very similar to our in-range manipulation estimates from the bunching analysis, which show
that 13 percent of students just below the threshold (20 to 49 visits) increase their attendance level to meet
the 50-visit threshold.
With respect to students who attended the gym more than 50 times prior to the introduction of the
reimbursement program, we see slightly smaller - but still large and statistically significant - effects.
Somewhat surprisingly, we also observe a statistically significant increase of 7 percentage points among
students who attended the gym less than 10 times in the pre-period. This is approximately half the size of
the effect of the policy on those who previously attended the gym between 30 and 49 times. This result
suggests that although the policy presents a high bar for participants to meet in order to claim the
reimbursement, it still generates behavioral responses among previously low-attendance students.22
Panel B of Table 6 presents results for average gym attendance. Here we find statistically significant
and economically meaningful results for all groups that were below the 50 visit threshold in the pre-policy
period. We observe increases in average attendance between 3 and 6 visits per semester for those who went
to the gym less than 20 times in the pre-period, and increases between 9 and 10 visits for those who attended
the gym between 20 and 49 times in the pre-period. In contrast, we do not find a statistically significant
change in attendance among students who had met the reimbursement threshold prior to the policy’s
implementation.23 Taken together with the results from Panel A, this suggests that the policy incentivizes
high-attendance students to remain above the reimbursement threshold, but this change in behavior does
not translate to meaningful increases in overall attendance among this group.
6. Persistence of Effects
In Section 2, we note that the gym reimbursement program may have an effect on individual gym attendance
that persist even after the program is terminated. Data on gym attendance both before program
implementation and after its discontinuation allow us to examine this question directly. As mentioned
above, persistence of the effects may be due to the accumulation of habit stock, but may also be due to other
factors such as learning or social networks.
22 An interesting implication of this result is that one of the assumptions required for the formal bunching estimator
discussed in Section 2 – that the policy did not induce a behavioral response from far outside the bunching interval –
is violated. 23 While our bunching estimates in Table 1 do allow for bunching from both above and below the threshold, the
visual evidence presented in Figure 2A shows that the overwhelming majority of the manipulation is driven by
individuals below the threshold. This is consistent with the small and not statistically significant coefficient in
Column (v) of Panel B of Table 6.
20
A subset of the prior literature on fitness incentive programs has examined persistence of the
effects of gym incentives, with mixed results. For example, Charness and Gneezy (2009) find that the
effects of a one-time, 4-week gym incentive persist over a two-month follow-up period. Acland and Levy
(2015) replicate these findings using a similar experiment, but find that the effects fade when using a slightly
longer follow-up period.24 Royer et al. (2015) analyze a gym incentive program at a large company over a
substantially longer post-intervention period (three years) and find that the effects of financial incentives
alone persist for only two months.25
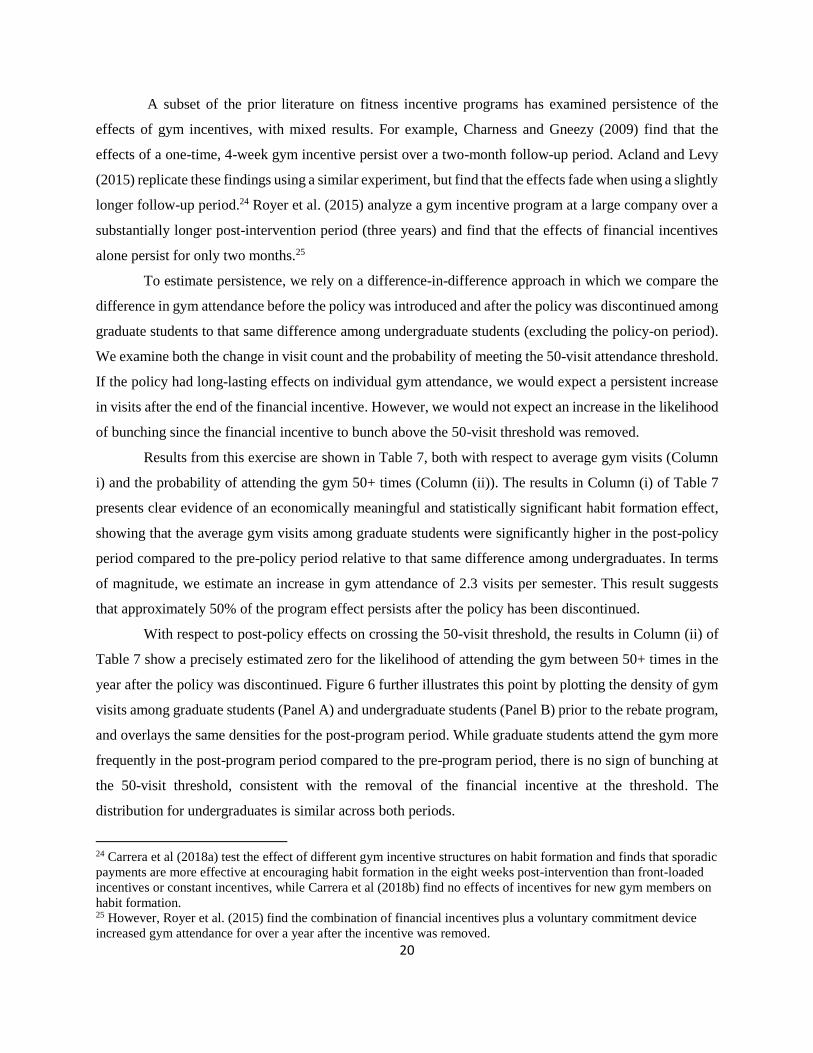
To estimate persistence, we rely on a difference-in-difference approach in which we compare the
difference in gym attendance before the policy was introduced and after the policy was discontinued among
graduate students to that same difference among undergraduate students (excluding the policy-on period).
We examine both the change in visit count and the probability of meeting the 50-visit attendance threshold.
If the policy had long-lasting effects on individual gym attendance, we would expect a persistent increase
in visits after the end of the financial incentive. However, we would not expect an increase in the likelihood
of bunching since the financial incentive to bunch above the 50-visit threshold was removed.
Results from this exercise are shown in Table 7, both with respect to average gym visits (Column
i) and the probability of attending the gym 50+ times (Column (ii)). The results in Column (i) of Table 7
presents clear evidence of an economically meaningful and statistically significant habit formation effect,
showing that the average gym visits among graduate students were significantly higher in the post-policy
period compared to the pre-policy period relative to that same difference among undergraduates. In terms
of magnitude, we estimate an increase in gym attendance of 2.3 visits per semester. This result suggests
that approximately 50% of the program effect persists after the policy has been discontinued.
With respect to post-policy effects on crossing the 50-visit threshold, the results in Column (ii) of
Table 7 show a precisely estimated zero for the likelihood of attending the gym between 50+ times in the
year after the policy was discontinued. Figure 6 further illustrates this point by plotting the density of gym
visits among graduate students (Panel A) and undergraduate students (Panel B) prior to the rebate program,
and overlays the same densities for the post-program period. While graduate students attend the gym more
frequently in the post-program period compared to the pre-program period, there is no sign of bunching at
the 50-visit threshold, consistent with the removal of the financial incentive at the threshold. The
distribution for undergraduates is similar across both periods.
24 Carrera et al (2018a) test the effect of different gym incentive structures on habit formation and finds that sporadic
payments are more effective at encouraging habit formation in the eight weeks post-intervention than front-loaded
incentives or constant incentives, while Carrera et al (2018b) find no effects of incentives for new gym members on
habit formation. 25 However, Royer et al. (2015) find the combination of financial incentives plus a voluntary commitment device
increased gym attendance for over a year after the incentive was removed.

21
7. Discussion and Conclusion
Physical inactivity represents a major problem for policymakers, potentially contributing to rising medical
costs, lower labor productivity and reduced well-being. In response to the rising costs of physical inactivity,
employers, health insurers, and state governments, have introduced a number of different wellness incentive
programs to encourage physical activity. This paper evaluates the effect of the introduction and subsequent
termination of one such wellness program at a major American university. This program provides gym
membership reimbursements to members who attend the gym 50 times in a six-month period.
We document significant bunching at the 50-visit threshold in years when the policy is in place,
and we find that this bunching effect translates into a statistically significant and economically meaningful
effect on overall gym attendance. Specifically, we find that exposure to the reimbursement program
increased students’ gym visits by 4.6 visits per semester, representing a 20% increase from the mean. The
effect we identify is driven exclusively by the intensive margin; we find no effect on membership take-up.
Examining heterogeneous treatment effects by pre-policy gym attendance behavior, we find increases in
gym visits among both low- and high-frequency gym attendees. This suggests that our bunching results are
not solely driven by students who were previously close to the attendance threshold. Additionally, the fact
that we do not see any adverse attendance effects among those who met the reimbursement requirement
before the policy was implemented, suggests that the threshold does not discourage these students from
attending the gym more than 50 times by providing a reference point that is lower than what they would
have chosen in the absence of the policy.
Our results demonstrate that rebates as incentives can be successful in not only inducing healthy
behaviors in the short-term, but also in creating new habits in the long-run. Specifically, we show that
approximately half of the program effect persists after program termination. The persistence in effects that
we find is considerably larger than many of those identified in the existing literature on fitness incentive
programs. These large estimates are consistent with models of accumulation of habit stock, especially those
which suggest that this habit stock must cross a certain threshold in order to lead to sustained activity
(Becker and Murphy 1988; Carrera et al. 2017; Harris and Kessler 2019). However, it should be noted that
our study population consists of students at a higher education institution. These individuals are more
educated, and likely face tighter budget constraints, than the general population. While this represents a
large and important population, an interesting question for future research is to what extent these results
can be generalized to the regular (non-student) workplace settings.
While we are unable to study the direct effect of the reimbursement policy on student health, there
is a large literature documenting the existence of significant health benefits associated with increased

22
physical activity (e.g. Warburton, Nicol and Bredin 2006). In addition, previous studies have documented
a causal relationship between gym attendance and academic performance at the university level. For
example, Cappelen et al. (2017) perform a field experiment in which they randomly provide students
without gym memberships access to fitness facilities, and find that this program (with an average cost of
$110 per student) leads to a 5.7 visit increase in gym attendance per semester and a 0.3 standard deviation
increase in total grade points.26 The per student cost of the program we examine is significantly lower than
the cost of the Cappelen et al. (2017) experiment ($17.50), and the effect on gym attendance is quite similar
(4.6 versus 5.7 visit increase), suggesting that the rebate is a more cost-efficient method of improving gym
attendance.27 If we assume that the effect of exercise on student achievement is the same in our setting, the
rebate is also a more cost-efficient method of improving student educational outcomes. Specifically, the
per dollar effect on student total grade point is approximately 5 times larger in our setting.28 These results
are encouraging in light of the recent efforts to induce healthy behaviors through fitness rebates undertaken
by US health insurers, state governments, and higher education institutions.
26 The 5.7 visit increase comes from subtracting the control mean (1.8) from the treatment mean (7.5) on page 16 in
Cappelen et al. (2017). 27 The low per student cost in our setting is due to the fact that only graduate students who attend the gym more than
50 times during the policy years (23.3%) receive $75, while every treated student in Cappelen et al. (2017) receives
$110. 28 This is likely an upper bound since the effects in our study are exclusively coming from individuals that already
are exercising, while the participants in Cappelen et al. (2017) do not have memberships prior to the intervention.
Thus, to the extent that the effect on academic achievement in Cappelen et al. (2017) is driven by students having
more structure and routine in their lives, this will likely not transfer to our setting.

23
References
Acland, Dan, and Matthew Levy (2015). “Naiveté, Projection Bias, and Habit Formation in Gym
Attendance.” Management Science 61(1): pp. 146-160
Aronsson, Thomas, Katharina Jenderny and Gauthier Lanot (2018). “Alternative parametric bunching
estimators of the ETI” Mimeo
Baicker, Kathrine, David Cutler and Zirui Song (2010). “Workplace Wellness Programs Can
Generate Savings.” Health Affairs 29(2): pp. 1-8
Bertanha, Marinho, Andrew McCallum and Nathan Seegert (2018). “Nicer Notching, Better
Bunching” Mimeo
Blomquist, Soren, and Whitney K. Newey (2017). "The Bunching Estimator Cannot Identify the
Taxable Income Elasticity” CESifo Working Paper Series 6736
Cappelen, Alexander, Gary Charness, Mathias Ekström, Uri Gneezy and Bertil Tungodden (2017).
“Exercise improves academic performance.” IFN Working Paper No 1180
Carrera, Mariana, Heather Royer, Mark Stehr, and Justin Sydnor (2017). “The structure of health
incentives: Evidence from a field experiment” NBER Working Paper 23188
Carrera, Mariana, Heather Royer, Mark Stehr, and Justin Sydnor (2018). “Can financial incentives help
people trying to establish new habits? Experimental evidence with new gym members” Journal
of Health Economics 58: pp. 202-214
Cawley, John (2014). “The affordable care act permits greater financial rewards for weight loss: a good
idea in principle, but many practical concerns remain” Journal of Policy Analysis and
management 33(3): pp. 810-820
Charness, Gary and Uri Gneezy (2009). “Incentives to exercise” Econometrica 77(3): pp. 909-931
Chetty, Raj, John Friedman, Tore Olsen, and Luigi Pistaferri (2011). “Adjustment costs, firm responses,
and micro vs. macro labor supply elasticities: evidence from Danish tax records” Quarterly
Journal of Economics 126(2): pp. 749-804
Dekker, Vincent, Kristina Strohmaier, and Nicole Bosch (2016). ”A data-driven procedure to
determine the bunching window: an application to the Netherlands” Hohenheim Discussion
Papers 05-2016
Dee, Thomas, Will Dobbie, Brian Jacob, and Jonah Rockoff (2019). The causes and consequences of test
score manipulation: Evidence from the New York regents examinations. American Economic
Journal: Applied Economics, 11(3), pp. 382-423

24
Deslandes, Andrea, Helena Moraes, Camila Ferreira, Heloisa Veiga, Heitor Silverira, Raphael Mouta,
Fernando Pompeu, Eevandro Coutinho, and Jerson Laks (2009). “Exercise and Mental Health:
Many Reasons to Move” Neuropsychobiology 59(4): pp. 191-198
Field, Erica (2009). “Educational debt burden and career choice: Evidence from a financial aid experiment
at NYU Law School” American Economic Journal: Applied Economics 1(1): pp. 1-21
Fricke, Hans, Michael Lechner and Andreas Steinmayr (2018). “The effect of physical activity on
student performance in college: an experimental evaluation” University of St. Gallen
Discussion Paper No. 2017-07
Harris, Matthew, and Lawrence Kessler (2019). “Habit formation and activity persistence: Evidence from
gym equipment” Journal of Economic Behavior and Organization 166: pp. 688-708
Hossain, Tanjim, and John List (2012). “The behavioralist visits the factory: Increasing productivity using
simple framing manipulations” Management Science 58(12): pp. 2151-2167
Jones, Damon, David Molitor, and Julian Reif (2018). “What do workplace wellness programs do?
Evidence from the Illinois workplace wellness study” NBER Working Paper No. 24229
Kahneman, Daniel, and Amos Tversky (1979). “Prospect Theory: An Analysis of Decision Under Risk”
Econometrica 47: pp. 263-291
Kleven, Henrik. (2016). "Bunching." Annual Review of Economics (8): pp. 435-464
Lechner, Michael, and Nazmi Sari (2015). “Labour market effects of sports and exercise:
Evidence from Canadian panel data” Labour Economics 35: pp. 1-19
Levitt, Steven, John List, Susanne Neckermann, and Sally Sadoff (2016). ”The behavioralist goes to school:
Leveraging behavioral economics to improve educational performance” American Economic
Journal: Economic Policy 8(4): pp. 183-219
Marx, Benjamin (2018). "Dynamic Bunching Estimation with Panel Data," MPRA Paper 88647
NBGH (2011). Employer investments in improving employee health. Available at
https://jointhehealthjourney.com/images/uploads/channel-files/StudyEmployeeHealth
Programs.pdf
Rees-Jones, Alex (2018). “Quantifying loss-averse tax manipulation” Review of Economic Studies 85:
pp. 1251-1278
Reis, Nola (2012). “Financial incentives for weight loss and healthy behaviors” Healthcare policy 7(3):
pp. 23-28
Saez, Emmanuel (2010). "Do Taxpayers Bunch at Kink Points?" American Economic Journal:
Economic Policy 2 (3): pp. 180-212

25
Troiano, R, D. Berrigan, K. Dodd, L. Masse, T. Tilert and M. McDowell (2008). “Physical activity in
the United States measured by accelerometer” Medical Science Sport Exercise 40(1): pp. 181-
188
Warburton, D., C. Nicol and S. Bredin (2006). “Health benefits of physical activity: the evidence” The
Canadian Medical Association Journal 174(6): pp. 801-809
26
Figure 1: Distribution of Visit Count by Student Type, Policy On/Policy Off
Panel A
Panel B

27
Figure 2: Bunching Estimation
Panel A – Graduate Students, Policy On
Panel B – Graduate Students, Policy Off
20
40
60
80
100
120
Fre
quen
cy
20 30 40 50 60 70Visit Count
Observed Counterfactual
020
40
60
80
100
Fre
quen
cy
20 30 40 50 60 70Visit Count
Observed Counterfactual

28
Figure 2 (continued): Bunching Estimation
Panel C – Undergraduate Students, Policy On
Panel D – Undergraduate Students, Policy Off
Notes: Graph represents frequency of students with different levels of visit counts. Solid line-dots is actual
distribution; dash line is smoothed counterfactual distribution. Vertical line indicates the 50-visit threshold
that students need to reach in order to obtain the reimbursement. For each specification we use a fourth-
order polynomial with a range of estimation of 1 to 70 visits to calculate the counterfactual distribution.
The region of excess mass is between 50 and 60 visits. The region of missing mass is 20 to 49 visits in
Panel A and 35 to 49 in Panels B-D.
0
200
400
600
Fre
quen
cy
20 30 40 50 60 70Visit Count
Observed Counterfactual
0
100
200
300
400
Fre
quen
cy
20 30 40 50 60 70Visit Count
Observed Counterfactual
29
Figure 3: Average Gym Attendance by Year and Student Type
Panel A
Panel B
Notes: Bars represent the average number of visits for each academic year.

30
Figure 4: Effect of Reimbursement Policy by Month
Notes: Each dot presents the coefficient estimate 𝛼𝑚 from a modified version of equation (1) in which we
interact our main treatment variable with the specific month of the reimbursement period:
Estimating equation: 𝑌𝑖𝑡𝑚 = 𝛽0 + ∑ 𝛼𝑚6𝑚=1 [𝐺𝑟𝑎𝑑𝑖 ∗ 𝑃𝑜𝑙𝑖𝑐𝑦𝑂𝑛𝑡 ∗ 𝑀𝑜𝑛𝑡ℎ𝑚] +
∑ 𝛾𝑚6𝑚=1 [𝐺𝑟𝑎𝑑𝑖 ∗ 𝑀𝑜𝑛𝑡ℎ𝑚] + ∑ 𝛿𝑚
6𝑚=1 [𝑃𝑜𝑙𝑖𝑐𝑦𝑂𝑛𝑡 ∗ 𝑀𝑜𝑛𝑡ℎ𝑚] + ∑ 휁𝑚
6𝑚=1 [𝑀𝑜𝑛𝑡ℎ𝑚] + 휀𝑖𝑡𝑚.
Outcome: number of gym visits in the reimbursement month indicated on the horizontal axis.
Bars extending from the dots represent the 95% confidence intervals, based on the standard deviation of
1,000 of bootstrapped estimates.

31
Figure 5: Gym Membership Rate by Year and Student Type
Panel A
Panel B
Notes: Bars represent the membership rate for the Fall of each academic year.

32
Figure 6: Effect Persistence - Distribution of Visit Count by Student Type, Pre-
Policy/Post-Policy
Panel A
Panel B
Notes: Graph represents percent of students with different levels of visit counts. Pre Policy is Fall 2013-
Spring 2014, and Post Policy is Fall 2017-Spring 2018. Vertical line indicates the 50-visit threshold that
students need to reach in order to obtain the reimbursement.
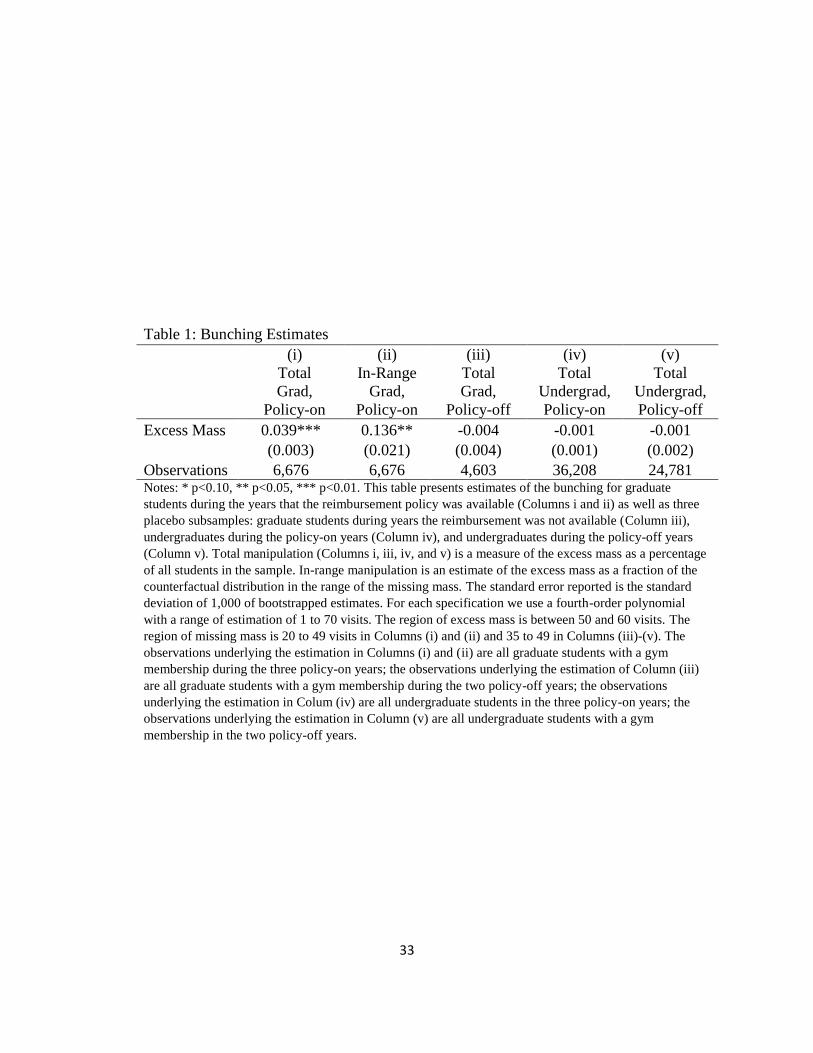
33
Table 1: Bunching Estimates
(i)
Total
Grad,
Policy-on
(ii)
In-Range
Grad,
Policy-on
(iii)
Total
Grad,
Policy-off
(iv)
Total
Undergrad,
Policy-on
(v)
Total
Undergrad,
Policy-off
Excess Mass 0.039*** 0.136** -0.004 -0.001 -0.001
(0.003) (0.021) (0.004) (0.001) (0.002)
Observations 6,676 6,676 4,603 36,208 24,781 Notes: * p<0.10, ** p<0.05, *** p<0.01. This table presents estimates of the bunching for graduate
students during the years that the reimbursement policy was available (Columns i and ii) as well as three
placebo subsamples: graduate students during years the reimbursement was not available (Column iii),
undergraduates during the policy-on years (Column iv), and undergraduates during the policy-off years
(Column v). Total manipulation (Columns i, iii, iv, and v) is a measure of the excess mass as a percentage
of all students in the sample. In-range manipulation is an estimate of the excess mass as a fraction of the
counterfactual distribution in the range of the missing mass. The standard error reported is the standard
deviation of 1,000 of bootstrapped estimates. For each specification we use a fourth-order polynomial
with a range of estimation of 1 to 70 visits. The region of excess mass is between 50 and 60 visits. The
region of missing mass is 20 to 49 visits in Columns (i) and (ii) and 35 to 49 in Columns (iii)-(v). The
observations underlying the estimation in Columns (i) and (ii) are all graduate students with a gym
membership during the three policy-on years; the observations underlying the estimation of Column (iii)
are all graduate students with a gym membership during the two policy-off years; the observations
underlying the estimation in Colum (iv) are all undergraduate students in the three policy-on years; the
observations underlying the estimation in Column (v) are all undergraduate students with a gym
membership in the two policy-off years.

34
Table 2: Effect of Reimbursement Policy on Attending the Gym 50 to 60 Times
(i)
Full Period
(ii)
Pre/On
(iii)
On/Post
Grad x Policy On 0.040*** 0.039*** 0.040***
(0.005) (0.006) (0.006)
Policy On 0.003* 0.004* 0.002
(0.002) (0.002) (0.002)
Grad 0.007** 0.008* 0.007*
(0.003) (0.005) (0.004)
Outcome Mean 0.045 0.046 0.047
Observations 75,887 60,129 60,873 Notes: * p<0.10, ** p<0.05, *** p<0.01 Standard errors in parentheses, based on the standard deviation of 1,000 of bootstrapped estimates
Each column presents results from a separate difference-in-differences regression:
𝑌𝑖𝑡 = 𝛽0 + 𝛽1[𝐺𝑟𝑎𝑑𝑖 ∗ 𝑃𝑜𝑙𝑖𝑐𝑦𝑂𝑛𝑡] + 𝛽2𝐺𝑟𝑎𝑑𝑖 + 𝛽3𝑃𝑜𝑙𝑖𝑐𝑦𝑂𝑛𝑡 + 휀𝑖𝑡.
Pre-period is Fall 2013-Spring 2014, policy-on period is Fall 2014-Spring 2017, post-period is Fall 2017-
Spring 2018. Column (i) compares policy-on period to both pre-period and post-period. Column (ii)
excludes post-period and compares policy-on period to pre-period. Column (iii) excludes pre-period and
compares policy-on period to post-period. Outcome: indicator for attending the gym 50 to 60 times in a six-
month period.
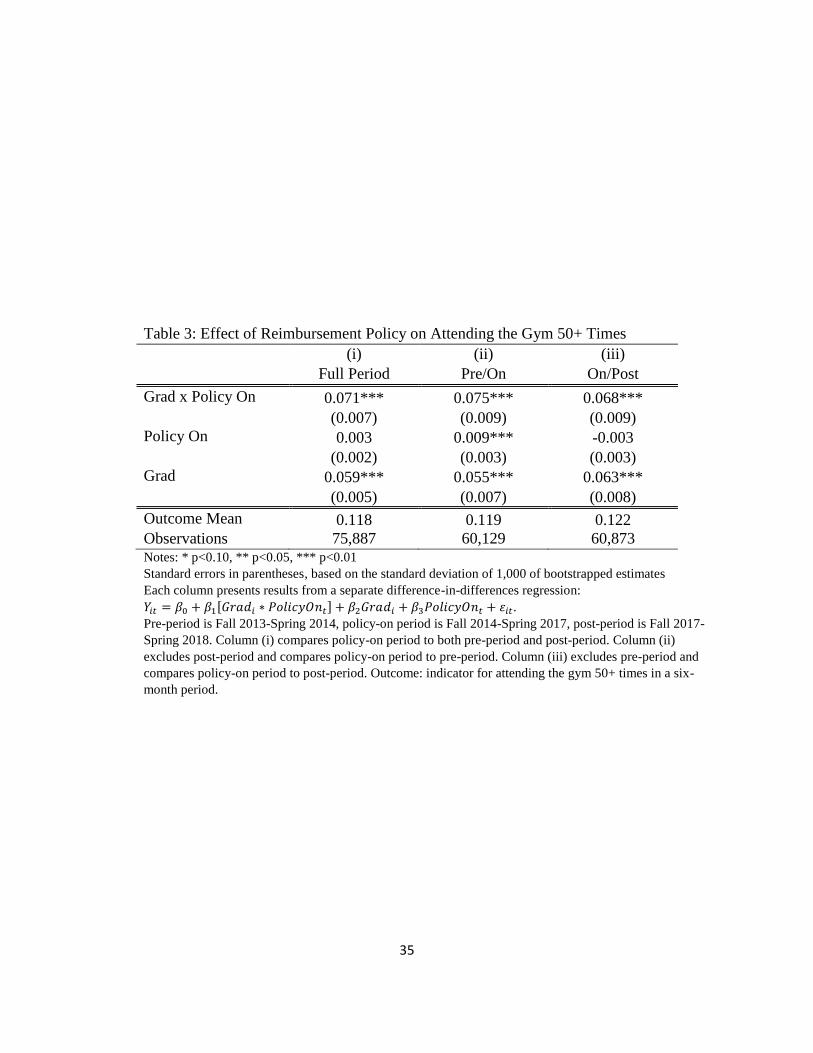
35
Table 3: Effect of Reimbursement Policy on Attending the Gym 50+ Times
(i)
Full Period
(ii)
Pre/On
(iii)
On/Post
Grad x Policy On 0.071*** 0.075*** 0.068***
(0.007) (0.009) (0.009)
Policy On 0.003 0.009*** -0.003
(0.002) (0.003) (0.003)
Grad 0.059*** 0.055*** 0.063***
(0.005) (0.007) (0.008)
Outcome Mean 0.118 0.119 0.122
Observations 75,887 60,129 60,873 Notes: * p<0.10, ** p<0.05, *** p<0.01 Standard errors in parentheses, based on the standard deviation of 1,000 of bootstrapped estimates
Each column presents results from a separate difference-in-differences regression:
𝑌𝑖𝑡 = 𝛽0 + 𝛽1[𝐺𝑟𝑎𝑑𝑖 ∗ 𝑃𝑜𝑙𝑖𝑐𝑦𝑂𝑛𝑡] + 𝛽2𝐺𝑟𝑎𝑑𝑖 + 𝛽3𝑃𝑜𝑙𝑖𝑐𝑦𝑂𝑛𝑡 + 휀𝑖𝑡.
Pre-period is Fall 2013-Spring 2014, policy-on period is Fall 2014-Spring 2017, post-period is Fall 2017-
Spring 2018. Column (i) compares policy-on period to both pre-period and post-period. Column (ii)
excludes post-period and compares policy-on period to pre-period. Column (iii) excludes pre-period and
compares policy-on period to post-period. Outcome: indicator for attending the gym 50+ times in a six-
month period.

36
Table 4: Effect of Reimbursement Policy on Overall Gym Attendance
(i)
Full Period
(ii)
Pre/On
(iii)
On/Post
Grad x Policy On 3.450*** 4.640*** 2.376***
(0.553) (0.699) (0.695)
Policy On 0.127 0.418* -0.151
(0.182) (0.219) (0.220)
Grad 5.914*** 4.724*** 6.988***
(0.423) (0.568) (0.594)
Outcome Mean 21.644 21.629 21.871
Observations 75,887 60,129 60,873 Notes: * p<0.10, ** p<0.05, *** p<0.01 Standard errors in parentheses, based on the standard deviation of 1,000 of bootstrapped estimates
Each column presents results from a separate difference-in-differences regression:
𝑌𝑖𝑡 = 𝛽0 + 𝛽1[𝐺𝑟𝑎𝑑𝑖 ∗ 𝑃𝑜𝑙𝑖𝑐𝑦𝑂𝑛𝑡] + 𝛽2𝐺𝑟𝑎𝑑𝑖 + 𝛽3𝑃𝑜𝑙𝑖𝑐𝑦𝑂𝑛𝑡 + 휀𝑖𝑡.
Pre-period is Fall 2013-Spring 2014, policy-on period is Fall 2014-Spring 2017, post-period is Fall 2017-
Spring 2018. Column (i) compares policy-on period to both pre-period and post-period. Column (ii)
excludes post-period and compares policy-on period to pre-period. Column (iii) excludes pre-period and
compares policy-on period to post-period. Outcome: number of gym visits in a six-month period.

37
Table 5: Effect of Reimbursement Policy on Gym Membership
(i)
Full Period
(ii)
Pre/On
(iii)
On/Post
Grad x Policy On 0.001 -0.006 0.007
(0.007) (0.008) (0.008)
Policy On 0.001 0.005 -0.002
(0.004) (0.005) (0.005)
Grad -0.183*** -0.177*** -0.190***
(0.005) (0.007) (0.007)
Outcome Mean 0.389 0.390 0.390
Observations 98,972 78,460 79,556 Notes: * p<0.10, ** p<0.05, *** p<0.01 Standard errors in parentheses, based on the standard deviation of 1,000 of bootstrapped estimates
Fall semester only
Each column presents results from a separate difference-in-differences regression:
𝑌𝑖𝑡 = 𝛽0 + 𝛽1[𝐺𝑟𝑎𝑑𝑖 ∗ 𝑃𝑜𝑙𝑖𝑐𝑦𝑂𝑛𝑡] + 𝛽2𝐺𝑟𝑎𝑑𝑖 + 𝛽3𝑃𝑜𝑙𝑖𝑐𝑦𝑂𝑛𝑡 + 휀𝑖𝑡.
Pre-period is Fall 2013-Spring 2014, policy-on period is Fall 2014-Spring 2017, post-period is Fall 2017-
Spring 2018. Column (i) compares policy-on period to both pre-period and post-period. Column (ii)
excludes post-period and compares policy-on period to pre-period. Column (iii) excludes pre-period and
compares policy-on period to post-period. Outcome: indicator for having a gym membership.

38
Table 6: Heterogeneity in Policy Effects by Pre-Policy Visit Count
Panel A Attended Gym 50+ Times
(i)
<10
(ii)
10-19
(iii)
20-29
(iv)
30-49
(v)
50+
Grad x Policy On 0.069*** 0.032 0.126*** 0.157*** 0.119***
(0.018) (0.021) (0.033) (0.031) (0.027)
Observations 4,192 2,858 1,904 2,404 2,660
Panel B Visit Count
(i)
<10
(ii)
10-19
(iii)
20-29
(iv)
30-49
(v)
50+
Grad x Policy On 5.749*** 2.729** 10.429*** 8.576*** -1.049
(1.406) (1.371) (2.370) (1.961) (3.467)
Observations 4,192 2,858 1,904 2,404 2,660 Notes: * p<0.10, ** p<0.05, *** p<0.01 Standard errors in parentheses, based on the standard deviation of 1,000 of bootstrapped
estimates
Fall semester only
Each cell presents the coefficient on 𝐺𝑟𝑎𝑑𝑖 from a separate regression: 𝑌𝑖𝑡 = 𝛽0 +
𝛽1[𝐺𝑟𝑎𝑑𝑖 ∗ 𝑃𝑜𝑙𝑖𝑐𝑦𝑂𝑛𝑡] + 𝛽2𝐺𝑟𝑎𝑑𝑖 + 𝛽3𝑃𝑜𝑙𝑖𝑐𝑦𝑂𝑛𝑡 + 휀𝑖𝑡.
Each column is based on pre-policy visit count. Outcome: indicator for attending the gym
50+ times (Panel A) and number of gym visits (Panel B) in a six-month period.
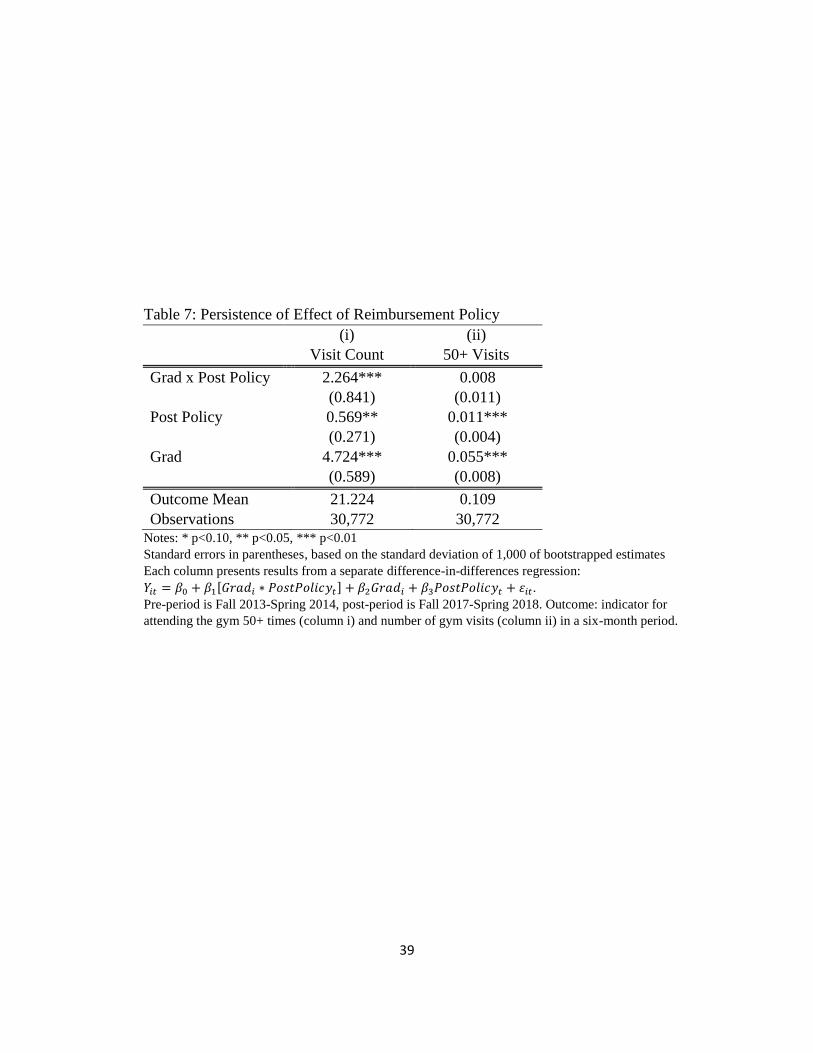
39
Table 7: Persistence of Effect of Reimbursement Policy
(i)
Visit Count
(ii)
50+ Visits
Grad x Post Policy 2.264*** 0.008
(0.841) (0.011)
Post Policy 0.569** 0.011***
(0.271) (0.004)
Grad 4.724*** 0.055***
(0.589) (0.008)
Outcome Mean 21.224 0.109
Observations 30,772 30,772 Notes: * p<0.10, ** p<0.05, *** p<0.01 Standard errors in parentheses, based on the standard deviation of 1,000 of bootstrapped estimates
Each column presents results from a separate difference-in-differences regression:
𝑌𝑖𝑡 = 𝛽0 + 𝛽1[𝐺𝑟𝑎𝑑𝑖 ∗ 𝑃𝑜𝑠𝑡𝑃𝑜𝑙𝑖𝑐𝑦𝑡] + 𝛽2𝐺𝑟𝑎𝑑𝑖 + 𝛽3𝑃𝑜𝑠𝑡𝑃𝑜𝑙𝑖𝑐𝑦𝑡 + 휀𝑖𝑡.
Pre-period is Fall 2013-Spring 2014, post-period is Fall 2017-Spring 2018. Outcome: indicator for
attending the gym 50+ times (column i) and number of gym visits (column ii) in a six-month period.
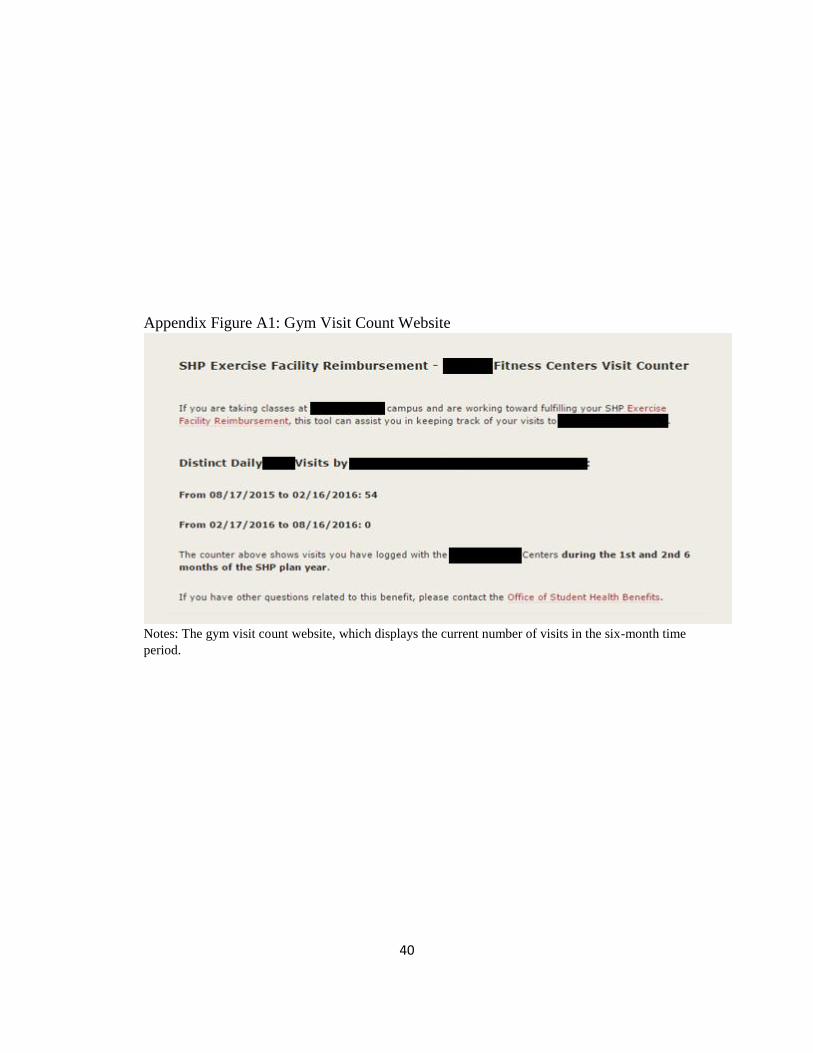
40
Appendix Figure A1: Gym Visit Count Website
Notes: The gym visit count website, which displays the current number of visits in the six-month time
period.

41
Appendix Figure A2: McCrary Density Tests
Panel A
Panel B
Notes: Graph represents percent of students with different levels of visit counts (dots) and the fitted
distribution. Any discontinuity at the cut-off (50 visits) indicates bunching. Vertical line indicates the 50-
visit threshold that students need to reach in order to obtain the reimbursement. Bootstrap standard errors in
parentheses.
0.0
2.0
4.0
6D
en
sity
0 50 100 150 200 250Visit Count
Estimated log difference in height: 1.061 (0.106)
McCrary Density Plot, Graduate Student, Policy On
0.0
2.0
4.0
6.0
8D
en
sity
0 100 200 300Visit Count
Estimated log difference in height: -0.104 (0.128)
McCrary Density Plot, Graduate Student, Policy Off
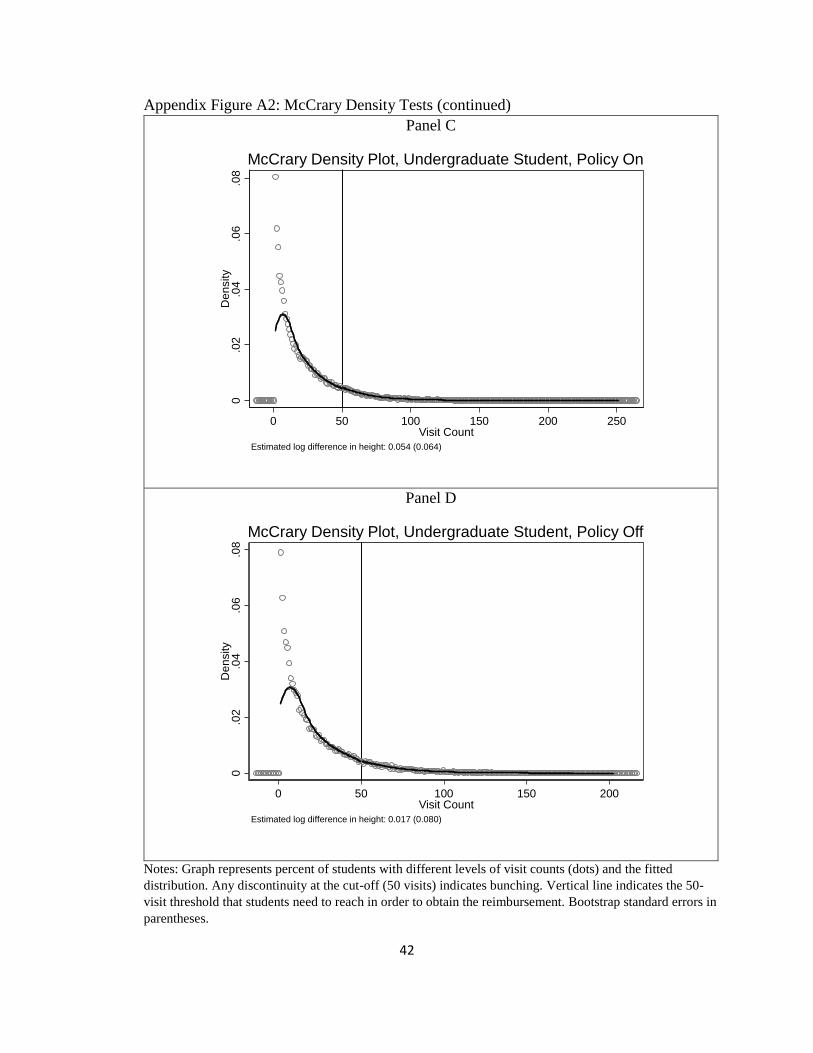
42
Appendix Figure A2: McCrary Density Tests (continued)
Panel C
Panel D
Notes: Graph represents percent of students with different levels of visit counts (dots) and the fitted
distribution. Any discontinuity at the cut-off (50 visits) indicates bunching. Vertical line indicates the 50-
visit threshold that students need to reach in order to obtain the reimbursement. Bootstrap standard errors in
parentheses.
0.0
2.0
4.0
6.0
8D
en
sity
0 50 100 150 200 250Visit Count
Estimated log difference in height: 0.054 (0.064)
McCrary Density Plot, Undergraduate Student, Policy On
0.0
2.0
4.0
6.0
8D
en
sity
0 50 100 150 200Visit Count
Estimated log difference in height: 0.017 (0.080)
McCrary Density Plot, Undergraduate Student, Policy Off

43
Appendix Table A1: Pre-Policy/Policy On Difference-in-differences with Individual FE
(i)
Visit Count
(ii)
50+ Visits
Grad x Policy On 4.007*** 0.076***
(0.982) (0.015)
Outcome Mean 24.565 0.145
Observations 34,514 34,514 Notes: * p<0.10, ** p<0.05, *** p<0.01 Standard errors in parentheses, based on the standard deviation of 1,000 of bootstrapped estimates
Each column presents results from a separate difference-in-differences regression:
𝑌𝑖𝑡 = 𝛽0 + 𝛽1[𝐺𝑟𝑎𝑑𝑖 ∗ 𝑃𝑜𝑙𝑖𝑐𝑦𝑂𝑛𝑡] + 𝛽2𝐺𝑟𝑎𝑑𝑖 + 𝛽3𝑃𝑜𝑙𝑖𝑐𝑦𝑂𝑛𝑡 + 𝑆𝑡𝑢𝑑𝑒𝑛𝑡𝑖 + 휀𝑖𝑡.
Both columns compare pre-period to policy-on period. Pre-period is Fall 2013-Spring 2014, policy-on
period is Fall 2014-Spring 2017. Column (i) outcome is number of gym visits in a six-month period.
Column (ii) outcome is indicator for attending the gym 50+ times in a six-month period.
Sample is restricted to individuals with data in at least two policy-on years.
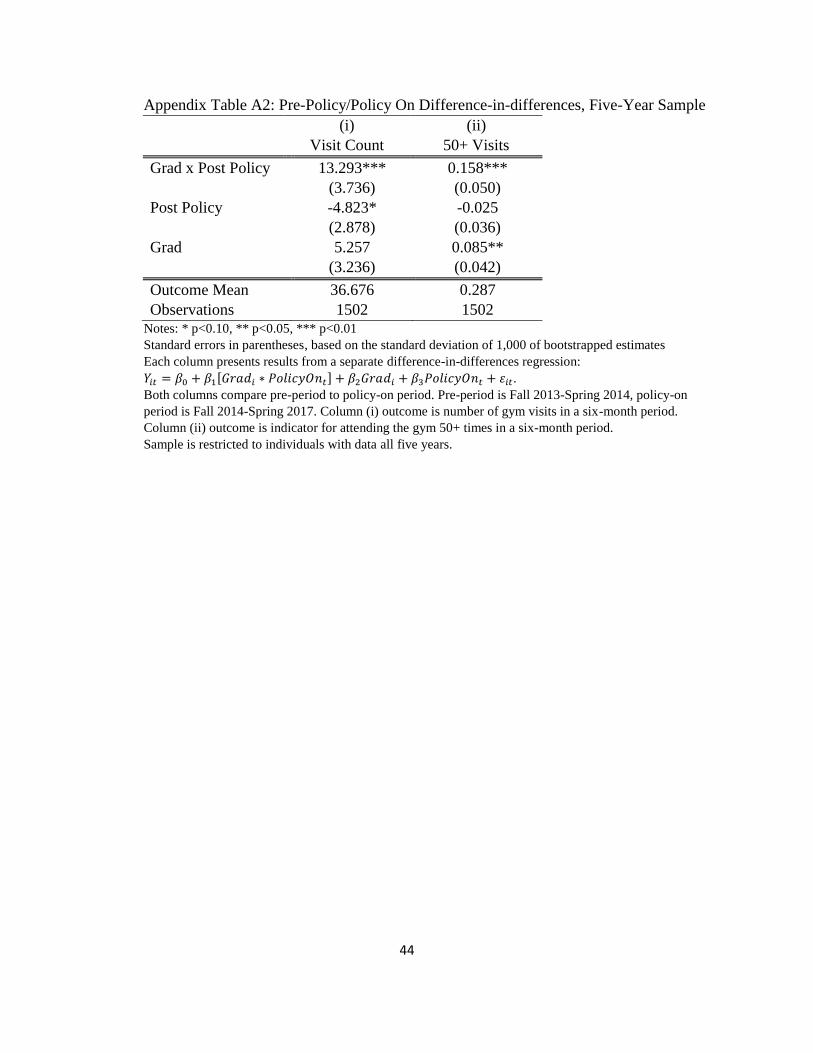
44
Appendix Table A2: Pre-Policy/Policy On Difference-in-differences, Five-Year Sample
(i)
Visit Count
(ii)
50+ Visits
Grad x Post Policy 13.293*** 0.158***
(3.736) (0.050)
Post Policy -4.823* -0.025
(2.878) (0.036)
Grad 5.257 0.085**
(3.236) (0.042)
Outcome Mean 36.676 0.287
Observations 1502 1502 Notes: * p<0.10, ** p<0.05, *** p<0.01 Standard errors in parentheses, based on the standard deviation of 1,000 of bootstrapped estimates
Each column presents results from a separate difference-in-differences regression:
𝑌𝑖𝑡 = 𝛽0 + 𝛽1[𝐺𝑟𝑎𝑑𝑖 ∗ 𝑃𝑜𝑙𝑖𝑐𝑦𝑂𝑛𝑡] + 𝛽2𝐺𝑟𝑎𝑑𝑖 + 𝛽3𝑃𝑜𝑙𝑖𝑐𝑦𝑂𝑛𝑡 + 휀𝑖𝑡.
Both columns compare pre-period to policy-on period. Pre-period is Fall 2013-Spring 2014, policy-on
period is Fall 2014-Spring 2017. Column (i) outcome is number of gym visits in a six-month period.
Column (ii) outcome is indicator for attending the gym 50+ times in a six-month period.
Sample is restricted to individuals with data all five years.