reasons for focusing on chlamydia
DESCRIPTION
Assay Results vs. Self-reported Chlamydial Infections: Does Measurement Discrepancy Vary by Level of Risk Behavior?. Bonita Iritani, 1 Denise Hallfors, 1 Carol A. Ford, 2 Carolyn Tucker Halpern, 2 William C. Miller 2 1 Pacific Institute for Research and Evaluation 2 UNC - Chapel Hill - PowerPoint PPT PresentationTRANSCRIPT

Assay Results vs. Self-reported Assay Results vs. Self-reported Chlamydial Infections: Chlamydial Infections:
Does Measurement Discrepancy Vary Does Measurement Discrepancy Vary by Level of Risk Behavior?by Level of Risk Behavior?
Bonita Iritani,Bonita Iritani,11 Denise Hallfors, Denise Hallfors,11 Carol A. Ford, Carol A. Ford,22 Carolyn Tucker Halpern,Carolyn Tucker Halpern,22 William C. Miller William C. Miller22
11Pacific Institute for Research and Evaluation Pacific Institute for Research and Evaluation 22UNC - Chapel HillUNC - Chapel Hill
Funded by NIH-NIDA, Denise Hallfors, PIFunded by NIH-NIDA, Denise Hallfors, PI

Reasons for Focusing on ChlamydiaReasons for Focusing on Chlamydia
Most common bacterial STIMost common bacterial STI
Has clear recommendations for screening Has clear recommendations for screening among femalesamong females
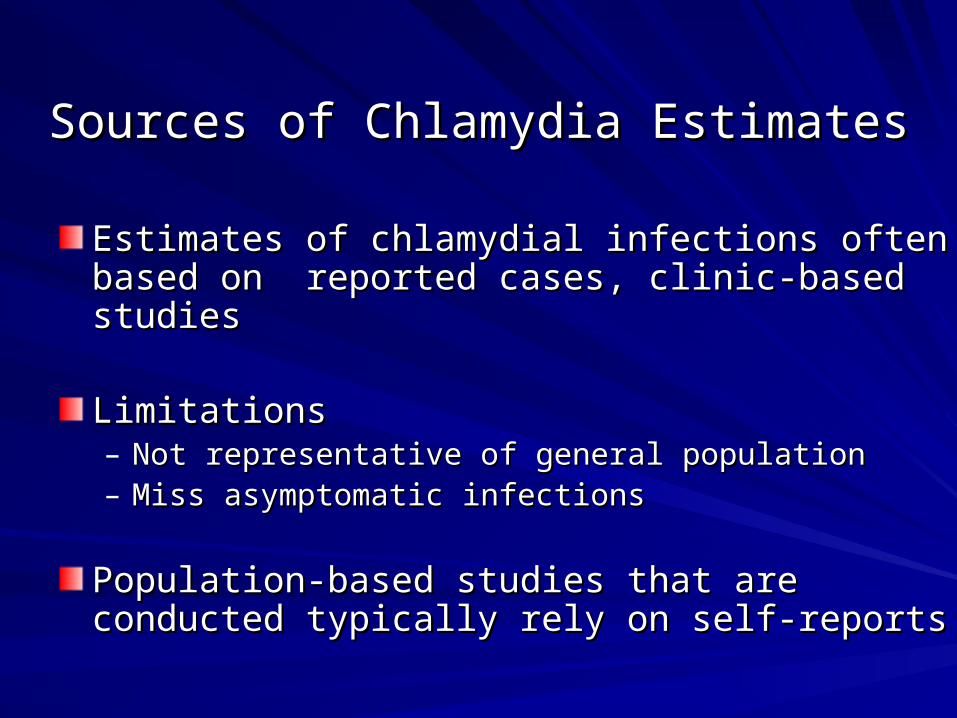
Sources of Chlamydia EstimatesSources of Chlamydia Estimates
Estimates of chlamydial infections often based on Estimates of chlamydial infections often based on reported cases, clinic-based studies reported cases, clinic-based studies
LimitationsLimitations– Not representative of general populationNot representative of general population– Miss asymptomatic infectionsMiss asymptomatic infections
Population-based studies that are conducted Population-based studies that are conducted typically rely on self-reportstypically rely on self-reports

Self-reported InfectionsSelf-reported Infections
Limitations of self-reportsLimitations of self-reports
– Miss asymptomatic infections when screening inadequateMiss asymptomatic infections when screening inadequateScreening recommended for all sexually active females Screening recommended for all sexually active females ≤ 25 years≤ 25 years
– Miss people with poor access to health careMiss people with poor access to health care
– Some respondents may not report accurately Some respondents may not report accurately (Harrington et al, 2001)(Harrington et al, 2001)
By comparing self-reports with biological test results, could look for By comparing self-reports with biological test results, could look for infections missing from self-reportsinfections missing from self-reports

Study ObjectivesStudy Objectives
Use National Longitudinal Study of Adolescent Use National Longitudinal Study of Adolescent Health (Add Health) Health (Add Health) – Nationally representative sample of young adults Nationally representative sample of young adults
To assess prevalence of prior chlamydia testingTo assess prevalence of prior chlamydia testing
To compare the prevalence of chlamydial To compare the prevalence of chlamydial infections identified by self-reports vs. assay infections identified by self-reports vs. assay results results
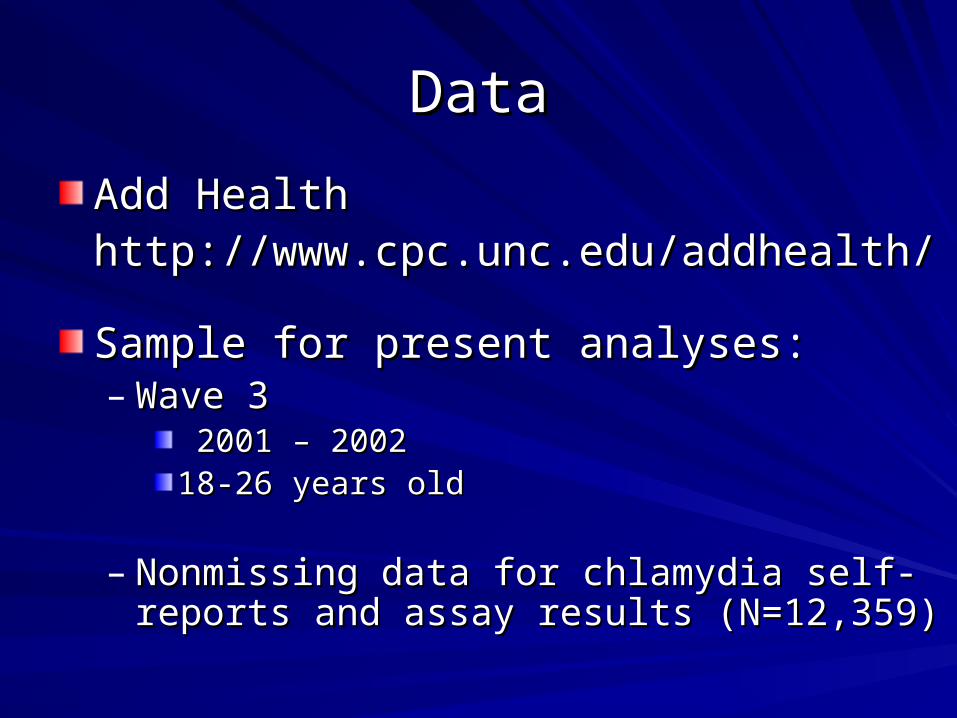
DataData
Add HealthAdd Healthhttp://www.cpc.unc.edu/addhealth/ http://www.cpc.unc.edu/addhealth/
Sample for present analyses:Sample for present analyses:– Wave 3 Wave 3
2001 – 20022001 – 200218-26 years old18-26 years old
– Nonmissing data for chlamydia self-reports and Nonmissing data for chlamydia self-reports and assay results (N=12,359)assay results (N=12,359)

Chlamydia MeasuresChlamydia Measures
Tested for Chlamydia (self-report) – past 12 monthsTested for Chlamydia (self-report) – past 12 months
Self-report Chlamydia Diagnosis– past 12 monthsSelf-report Chlamydia Diagnosis– past 12 months
Biological Test of Chlamydia Biological Test of Chlamydia – Urine samples collected at interviewUrine samples collected at interview

Ratio of Test/Self-reportRatio of Test/Self-report
Ratio = biological test prevalence/self-report Ratio = biological test prevalence/self-report prevalenceprevalence
– If all infections diagnosed and reported, people If all infections diagnosed and reported, people having an infection over 12 months > people with having an infection over 12 months > people with infection on one dayinfection on one day
– Ratio > 1 indicates infections missing in self-Ratio > 1 indicates infections missing in self-reportsreports

Measure of Risk Behavior PatternsMeasure of Risk Behavior Patterns
In previous work, created a measure of risk In previous work, created a measure of risk behavior patternsbehavior patterns
Used cluster analysisUsed cluster analysis
Grouped participants into 16 categories based Grouped participants into 16 categories based on patterns of substance use and sexual on patterns of substance use and sexual behaviorbehavior
Each person assigned to one pattern onlyEach person assigned to one pattern only

AnalysesAnalyses
Bivariate analyses by Bivariate analyses by – Sex and race-ethnicitySex and race-ethnicity– Risk behavior patternsRisk behavior patterns
Weighted percents Weighted percents
Account for the complex sampling designAccount for the complex sampling design

ResultsResults
Prevalence of Sexual ActivityPrevalence of Sexual Activity
Biological SexBiological Sex
% Had vaginal intercourse % Had vaginal intercourse
in past 12 mo.sin past 12 mo.s
FemaleFemale 82.982.9
MaleMale 78.278.2

% Prior Chlamydia Testing past 12 months% Prior Chlamydia Testing past 12 months
Entire Entire SampleSample
Had Vaginal Had Vaginal Intercourse Intercourse
Past 12 mo.sPast 12 mo.s
FemaleFemale 25.225.2 29.029.0
MaleMale 8.08.0 9.39.3
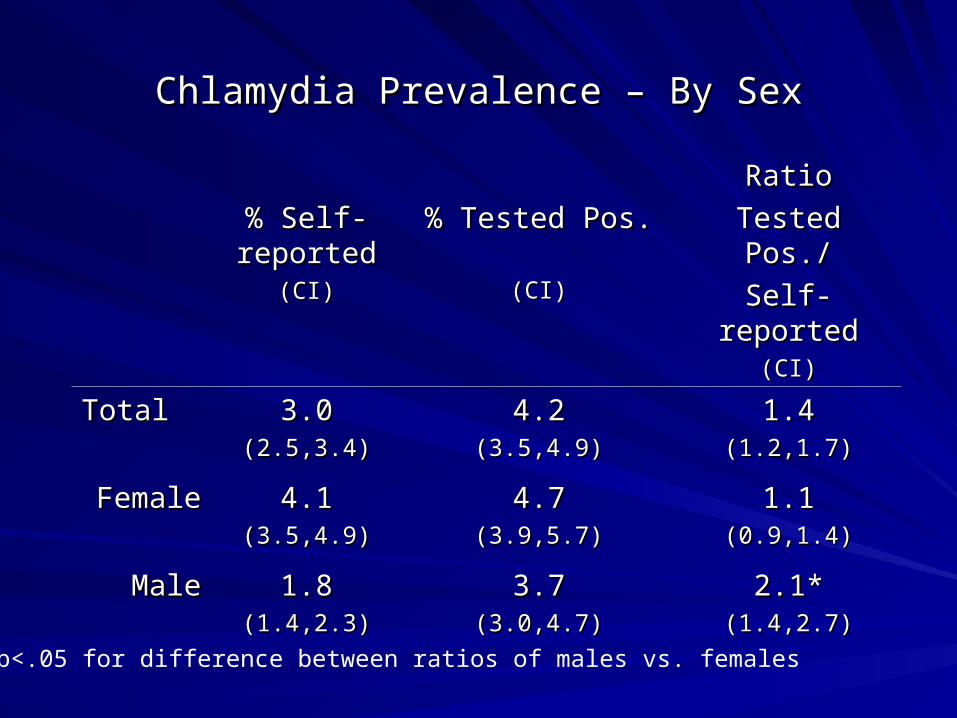
Chlamydia Prevalence – By SexChlamydia Prevalence – By Sex
% Self-% Self-reportedreported
(CI)(CI)
% Tested Pos.% Tested Pos.
(CI)(CI)
RatioRatio
Tested Pos./Tested Pos./
Self-reportedSelf-reported(CI)(CI)
TotalTotal 3.03.0(2.5,3.4)(2.5,3.4)
4.24.2(3.5,4.9)(3.5,4.9)
1.41.4(1.2,1.7)(1.2,1.7)
FemaleFemale 4.14.1(3.5,4.9)(3.5,4.9)
4.74.7(3.9,5.7)(3.9,5.7)
1.11.1(0.9,1.4)(0.9,1.4)
MaleMale 1.81.8(1.4,2.3)(1.4,2.3)
3.73.7(3.0,4.7)(3.0,4.7)
2.1*2.1*(1.4,2.7)(1.4,2.7)
*p<.05 for difference between ratios of males vs. females

Chlamydia Prevalence By Race-ethnicity Chlamydia Prevalence By Race-ethnicity Among FemalesAmong Females
% Self-% Self-reportedreported
% Tested Pos.% Tested Pos. RatioRatio
Test/SelfTest/Self
NH WhiteNH White 2.72.7(2.1,3.3)(2.1,3.3)
2.52.5(1.9,3.4)(1.9,3.4)
0.960.96(0.6,1.3)(0.6,1.3)
NH BlackNH Black 10.110.1(8.2,12.4)(8.2,12.4)
14.014.0(11.2,17.4)(11.2,17.4)
1.381.38(1.0,1.8)(1.0,1.8)
NH Asian/PINH Asian/PI 2.32.3(0.8,6.0)(0.8,6.0)
3.43.4(1.7,6.9)(1.7,6.9)
1.501.50(0.2,2.8)(0.2,2.8)
H/NH Nat AmH/NH Nat Am 3.53.5(1.3,8.8)(1.3,8.8)
7.97.9(4.2,14.6)(4.2,14.6)
2.262.26(-.0,4.5)(-.0,4.5)
H WhiteH White 4.94.9(2.7,8.6)(2.7,8.6)
3.83.8(2.5,5.8)(2.5,5.8)
0.780.78(0.3,1.3)(0.3,1.3)
H BlackH Black 4.74.7(1.5,14.1)(1.5,14.1)
10.2210.22(2.6,32.9)(2.6,32.9)
2.162.16(-1.6,6.0)(-1.6,6.0)
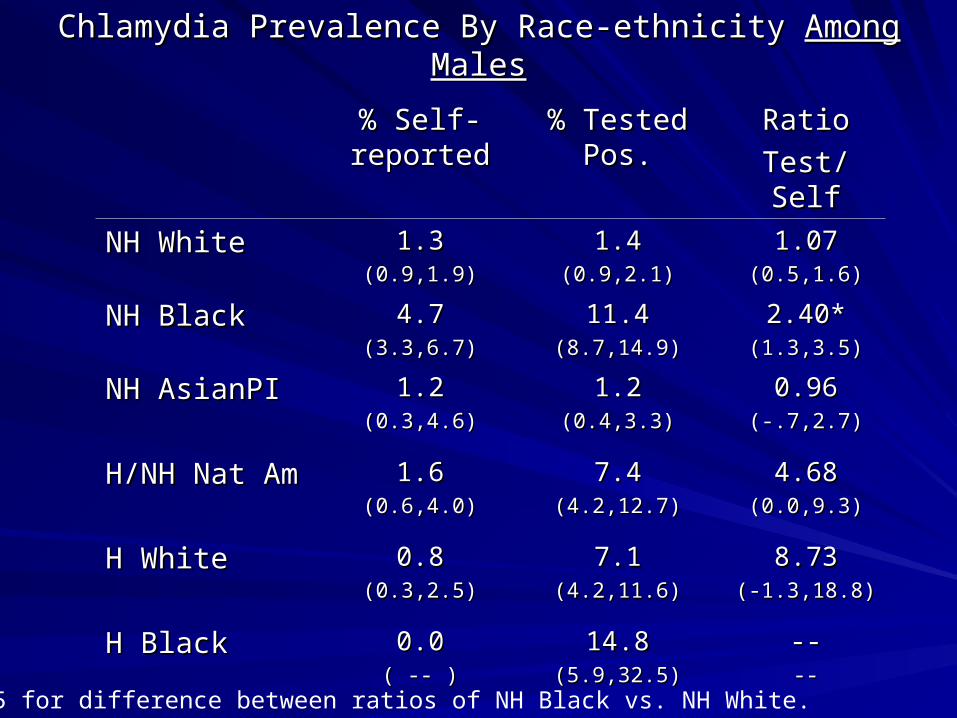
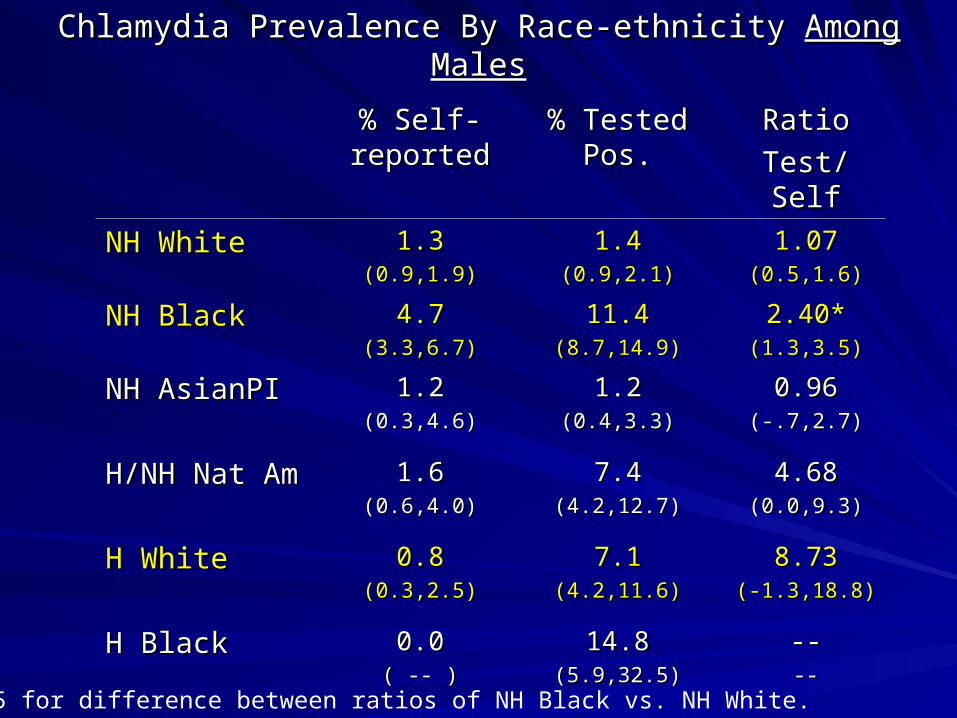
Chlamydia Prevalence By Race-ethnicity Chlamydia Prevalence By Race-ethnicity Among MalesAmong Males
% Self-% Self-reportedreported
% Tested Pos.% Tested Pos. RatioRatio
Test/SelfTest/Self
NH WhiteNH White 1.31.3(0.9,1.9)(0.9,1.9)
1.41.4(0.9,2.1)(0.9,2.1)
1.071.07(0.5,1.6)(0.5,1.6)
NH BlackNH Black 4.74.7(3.3,6.7)(3.3,6.7)
11.411.4(8.7,14.9)(8.7,14.9)
2.40*2.40*(1.3,3.5)(1.3,3.5)
NH AsianPINH AsianPI 1.21.2(0.3,4.6)(0.3,4.6)
1.21.2(0.4,3.3)(0.4,3.3)
0.960.96(-.7,2.7)(-.7,2.7)
H/NH Nat AmH/NH Nat Am 1.61.6(0.6,4.0)(0.6,4.0)
7.47.4(4.2,12.7)(4.2,12.7)
4.684.68(0.0,9.3)(0.0,9.3)
H WhiteH White 0.80.8(0.3,2.5)(0.3,2.5)
7.17.1(4.2,11.6)(4.2,11.6)
8.738.73(-1.3,18.8)(-1.3,18.8)
H BlackH Black 0.00.0( -- )( -- )
14.814.8(5.9,32.5)(5.9,32.5)
--------
*p<.05 for difference between ratios of NH Black vs. NH White.

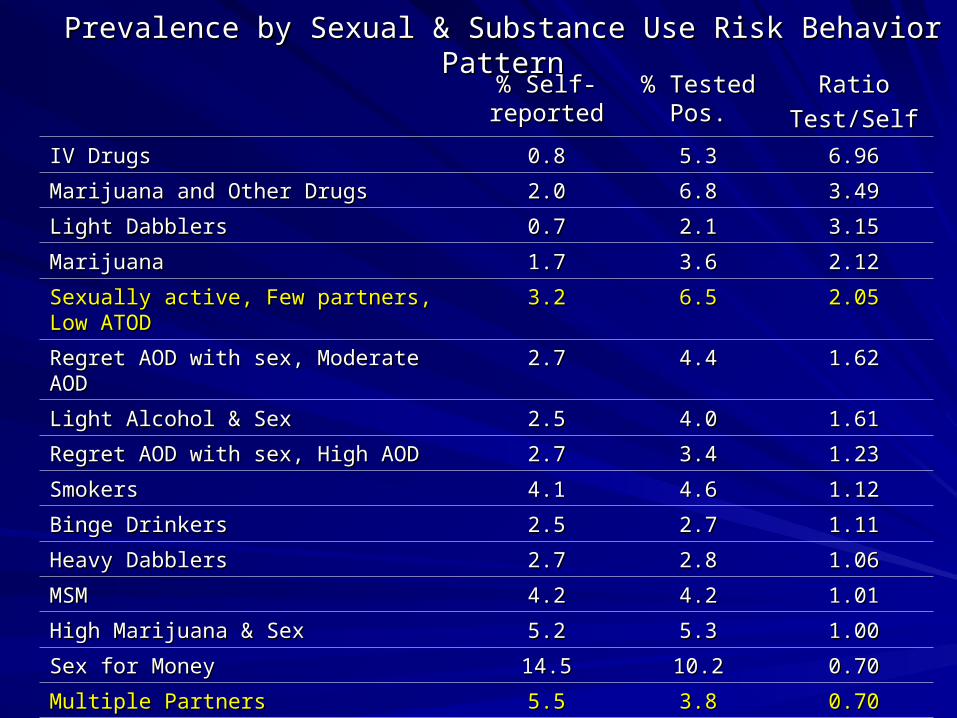
Prevalence by Sexual & Substance Use Risk Behavior PatternPrevalence by Sexual & Substance Use Risk Behavior Pattern% Self-% Self-reportedreported
% Tested % Tested Pos.Pos.
RatioRatio
Test/SelfTest/Self
IV DrugsIV Drugs 0.80.8 5.35.3 6.966.96
Marijuana and Other DrugsMarijuana and Other Drugs 2.02.0 6.86.8 3.493.49
Light DabblersLight Dabblers 0.70.7 2.12.1 3.153.15
MarijuanaMarijuana 1.71.7 3.63.6 2.122.12
Sexually active, Few partners, Low ATODSexually active, Few partners, Low ATOD 3.23.2 6.56.5 2.052.05
Regret AOD with sex, Moderate AODRegret AOD with sex, Moderate AOD 2.72.7 4.44.4 1.621.62
Light Alcohol & SexLight Alcohol & Sex 2.52.5 4.04.0 1.611.61
Regret AOD with sex, High AODRegret AOD with sex, High AOD 2.72.7 3.43.4 1.231.23
SmokersSmokers 4.14.1 4.64.6 1.121.12
Binge DrinkersBinge Drinkers 2.52.5 2.72.7 1.111.11
Heavy DabblersHeavy Dabblers 2.72.7 2.82.8 1.061.06
MSMMSM 4.24.2 4.24.2 1.011.01
High Marijuana & SexHigh Marijuana & Sex 5.25.2 5.35.3 1.001.00
Sex for MoneySex for Money 14.514.5 10.210.2 0.700.70
Multiple PartnersMultiple Partners 5.55.5 3.83.8 0.700.70
Abstainers – never had sex or used AODAbstainers – never had sex or used AOD ---- ---- ----

ConclusionsConclusions
Prevalence of chlamydia testing is lowPrevalence of chlamydia testing is low
– Screening guidelines for females not achieved Screening guidelines for females not achieved
(only 29% of sexually active young women (only 29% of sexually active young women were tested)were tested)

Infections Missing from Self-reportsInfections Missing from Self-reports
4% were infected on interview day, but only 4% were infected on interview day, but only 3% self-reported infection in entire past 12 3% self-reported infection in entire past 12 monthsmonths
Infections particularly missing among Infections particularly missing among – males compared to femalesmales compared to females– NH black males compared to white malesNH black males compared to white males– Some lower risk behavior categoriesSome lower risk behavior categories
Possible ReasonsPossible Reasons
Some respondents may not be answering Some respondents may not be answering accurately accurately
Many infections are undiagnosedMany infections are undiagnosed– Due to low levels of chlamydia screening Due to low levels of chlamydia screening
AcknowledgmentsAcknowledgmentsThis research was supported by grant R01-DA14496-4 from This research was supported by grant R01-DA14496-4 from the National Institute on Drug Abuse, Denise Hallfors, PI.the National Institute on Drug Abuse, Denise Hallfors, PI.
We thank Martha W. Waller and Jon M. Hussey for We thank Martha W. Waller and Jon M. Hussey for consultation.consultation.
This research uses data from Add Health, a program project This research uses data from Add Health, a program project designed by J. Richard Udry, Peter S. Bearman, and Kathleen designed by J. Richard Udry, Peter S. Bearman, and Kathleen Mullan Harris, and funded by a grant P01-HD31921 from the Mullan Harris, and funded by a grant P01-HD31921 from the National Institute of Child Health and Human Development, National Institute of Child Health and Human Development, with cooperative funding from 17 other agencies. Special with cooperative funding from 17 other agencies. Special acknowledgment is due Ronald R. Rindfuss and Barbara acknowledgment is due Ronald R. Rindfuss and Barbara Entwisle for assistance in the original design. Persons Entwisle for assistance in the original design. Persons interested in obtaining data files from Add Health should interested in obtaining data files from Add Health should contact Add Health, Carolina Population Center, 123 W. contact Add Health, Carolina Population Center, 123 W. Franklin Street, Chapel Hill, NC 27516-2524 Franklin Street, Chapel Hill, NC 27516-2524 ((www.cpc.unc.edu/addhealth/contract.htmlwww.cpc.unc.edu/addhealth/contract.html).).
