ready to ration - california department of water · pdf fileready to ration santa clara valley...
TRANSCRIPT

2009 Urban Drought Workshop
Ready to Ration
2009 Urban Drought Workshop
Ready to Ration
Santa Clara Valley Water District, San JoseMarch 16, 2009

Welcome & IntroductionsWelcome &
Introductions

Sharon Judkins Chief Executive Officer - SCVWD
Sharon Judkins Chief Executive Officer - SCVWD

Why are we here today?Why are we here today?

Manucher AlemiCalifornia Department of Water
ResourcesMarch 16, 2009

The Central Valley Project2009 Drought Workshop
Anna Sutton

Tracy LigonSCVWD Drought
Planning
Tracy LigonSCVWD Drought
Planning

Toby GoddardCity of Santa CruzToby GoddardCity of Santa Cruz

The Seven StepsThe Seven StepsONE Establish a Water Shortage Response Team
TWO Forecast Supply in Relation to Demand
THREE Balance Supply and Demand: Assess Mitigation Options
FOUR Establish Triggering Levels
FIVE Develop Staged Demand Reduction Program
SIX Adopt the Water Shortage Contingency Plan
SEVEN Administer and Implement the Water Shortage Contingency Plan

Establish a TeamEstablish a Team
Designate Water Shortage Response Team LeaderDesignate team member from each department or division

Compile Demand DataCompile Demand DataQuantify average demand for previous five years
• Single Family • Multifamily• Commercial• Industrial• Institutional• Landscape • (Agricultural)
Example Approach - Table 1

Demand DataDemand DataTable 1
Customer types Yr 2003 Yr 2004 Yr 2005 Yr 2006 Yr 2007 5-yr Avg
Single family 6,897 7,421 6,027 6,539 7,556 6,888Multi-family 3,099 3,165 2,520 2,742 2,982 2,902Commercial 2,475 2,665 2,376 2,511 2,849 2,575Industrial 177 190 170 179 203 184Institutional 884 952 849 897 1,017 920Landscape 552 650 494 564 668 586
Demand subtotal 14,084 15,043 12,436 13,432 15,275 14,054NRW (8%) 1,127 1,203 995 1,075 1,222 1,124
Total demand 15,211 16,246 13,431 14,506 16,496 15,178

Compile Supply DataCompile Supply DataQuantify worst-case supply for next FIVE or
more yearsLocal surfaceWholesaleGroundwaterPrivate TransfersDWR Water Bank (Table 2c)Other
Example Approach - Table 2a, 2b, 2c

Supply DataSupply DataTable 2a
SourceFull
Supply 2009 2010USBR 9,322 4,661 4,661
(% of normal) 100% 50% 50%State Water Supply 7,500 1,125 750
SWP (% of normal) 100% 15% 10%Other (define) 0 0Other (% of normal) 100%
Groundwater 2,350 2,350 2,350GW (% of normal) 100% 100% 100%
Emergency Supply 4,000 4,000 TOTAL 19,172 12,136 11,761
Average Demand 15,178
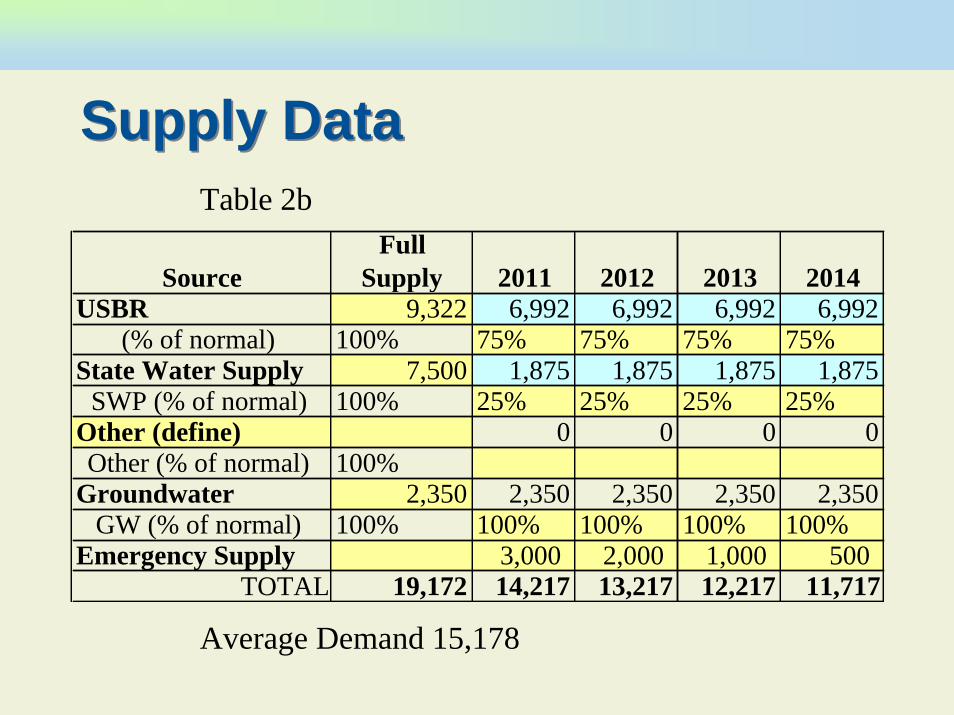
Supply DataSupply DataTable 2b
SourceFull
Supply 2011 2012 2013 2014USBR 9,322 6,992 6,992 6,992 6,992
(% of normal) 100% 75% 75% 75% 75%State Water Supply 7,500 1,875 1,875 1,875 1,875
SWP (% of normal) 100% 25% 25% 25% 25%Other (define) 0 0 0 0Other (% of normal) 100%
Groundwater 2,350 2,350 2,350 2,350 2,350GW (% of normal) 100% 100% 100% 100% 100%
Emergency Supply 3,000 2,000 1,000 500 TOTAL 19,172 14,217 13,217 12,217 11,717
Average Demand 15,178

Supply & Demand BalanceSupply & Demand BalanceTable 2c - Drought Water Bank / Critical Needs
Water Use Sectors 60 gpcd 80%Single family (49,000) 3,293Multiple family (25,200) 1,694Commercial 2,060Institutional 147Industrial 736Landscape Irrigation
Reduced allotments 4,987 2,943Non-revenue water (8%) 634
Critical Needs Total 8,564 56%Average Demand 15,178

Determine Supply & Demand BalanceDetermine Supply & Demand Balance
Quantify shortage for 2009 and project 2010
Project worst case supply for 2011 - 2014
Example Approach - Table 3a, 3b

Supply & Demand BalanceSupply & Demand Balance
Table 3a - Worst Case Supply vs. Average Demand
2009 Supply
2009 Shortage
2010 Supply
2010 Shortage
Avg. Demand 15,178 12,136 (3,042) 11,761 (3,417) 20% 23%Percent Shortage

Supply & Demand BalanceSupply & Demand Balance
Table 3b - Worst Case Supply vs. Average Demand
2011 Supply
2012 Supply
2013 Supply
2014 Supply
Avg. Demand 15,178 14,217 13,217 12,217 11,717 6% 13% 20% 23%Percent Shortage

Increase SupplyIncrease SupplyPursue supplemental supplies – Drought Water Bank, transfersIncrease groundwater capacity - schedule well drillerPlan to increase supplier efficiency (a few percent)• Meter replacement• System losses• System pressure• System flushing • Fires and Hydrants• Supplier landscaping
Example Approach - Table 4

Increase Supply / Reduce NRWIncrease Supply / Reduce NRWNew Supplies 2009 AF 2010 AF
Well(s) - 900 Water Bank - - Transfer 500 250
Total 500 1,150
NRW (Losses) Avg. AF % reduction AF savingsMeter Replacement 800 20% 160 System Losses 270 10% 27 System Pressure 3% 8 System Flushing 18 100% 18 Fires & Hydrant 6 50% 3 Supplier Landscape 30 50% 15
Total NRW 1,124 231

Decrease DemandDecrease DemandDetermine health & safety minimum supply
Determine potential savings by customer type (landscape, other regulations)
Select water allocation method by customer class & stage
Adopt restrictions, enforcement rules and penalties
Example Approach - Table 5a & 5b(assumes population of 74,200)

Average DemandAverage Demand
Full Supply 19,172 74,200Priority Residential CII Landscape NRW TOTAL % of
Average Use (2003-07) 9,789 3,679 586 1,124 15,178 TotalHealth & Safety (60 gpcd) 4,987 150 5,137 34%Com / Instit / Indust 2,693 2,693 18%Landscape 4,717 786 576 6,079 40%New Connections 85 50 10 145 1%TOTAL (AF) 9,789 3,679 586 1,124 15,178
Population

Decrease DemandDecrease DemandSTAGE I (85%) 12,902
Priority Residential CII Landscape NRW TOTALAverage Use (2003-07) 9,789 3,679 586 1,124 15,178Health & Safety (60 gpcd) 4,987 150 0 5,137Com / Instit / Indust 0 2,793 0 2,793Landscape 3,362 478 440 4,279New Connections 100 50 0 150
TOTAL (AF) 8,448 3,471 440 989 13,348% reduction 14% 6% 25% 12% 12%
STAGE II (75%) 11,384Priority Residential CII Landscape NRW TOTAL
Average Use (2003-07) 9,789 3,679 586 1,124 15,178Health & Safety (60 gpcd) 4,987 150 0 5,137Com / Instit / Indust 0 2,793 0 2,793Landscape 2,017 368 293 2,678New Connections 0 0 0 0
TOTAL (AF) 7,004 3,311 293 849 11,456% reduction 28% 10% 50% 25% 25%
Available Supply
Available Supply

Decrease DemandDecrease DemandSTAGE III (65%) 9,866
Priority Residential CII Landscape NRW TOTALAverage Use (2003-07) 9,789 3,679 586 1,124 15,178Health & Safety (50 gpcd) 4,156 150 0 4,306Com / Instit / Indust 0 2,793 0 2,793Landscape 1,681 0 205 1,886New Connections 0 0 0 0TOTAL (AF) 5,836 2,943 205 719 9,703% reduction 40% 20% 65% 36% 36%
STAGE IV (50%) 7,589Priority Residential CII Landscape NRW TOTAL
Average Use (2003-07) 9,789 3,679 586 1,124 15,178Health & Safety (40 gpcd) 3,325 120 0 3,445Com / Instit / Indust 0 2,653 0 2,653Landscape 840 0 147 987New Connections 0 0 0 0TOTAL (AF) 4,165 2,773 147 567 7,652% reduction 57% 25% 75% 50% 50%
Available Supply
Available Supply

Decrease DemandDecrease DemandTable 5b showing water allocation method by customer class & stage

Decrease DemandDecrease Demand
STAGE III (65%) 9,866Priority Residential CII Landscape NRW TOTAL
Average Use (2003-07) 9,789 3,679 586 1,124 15,178Health & Safety (50 gpcd) 4,156 120 0 4,276Com / Instit / Indust 0 2,793 0 2,793Landscape 1,681 0 205 1,886New Connections 0 0 0 0TOTAL (AF) 5,836 2,913 205 716 9,671% reduction 40% 21% 65% 36% 36%
H&S <20% H&S <20%irrig <50% irrig <100%irrig <65%
Available Supply
NO NEW CONSTRUCTION

Balance the BudgetBalance the BudgetPrepare new pricing structure and rates by stage (Prop. 218)
Decreased sales, increased costs by stage
Example Approach - Table 6

Balance the BudgetBalance the BudgetSales Normal Stage 1 Stage 2 Stage 3 Stage 4
% of Normal Supply 85% normal 75% normal 65% normal 50% normal% Rate Increase 6% rate increase12% rate increase 26% rate increase 57% rate increase
Fixed charge $7,687,889 $7,687,889 $7,687,889 $7,687,889 $7,687,889Quantity charge $11,524,068 $10,643,938 $10,129,399 $9,923,566 $9,838,528
Total Income $19,211,957 $18,331,828 $17,817,289 $17,611,455 $17,526,417
Operating Expenses Normal Stage 1 Stage 2 Stage 3 Stage 4overhead expense $525,500 $550,000 $575,000 $600,000 $600,000source of supply $3,903,000 $3,505,170 $3,099,800 $2,647,800 $2,695,750product. & purification $2,000,000 $2,556,136 $2,249,840 $1,858,240 $1,716,600trans. & distribution $2,500,000 $2,500,000 $2,500,000 $2,500,000 $2,500,000customer accounts $850,000 $900,000 $950,000 $1,000,000 $1,000,000general & admin. $3,000,000 $3,300,000 $3,600,000 $3,900,000 $3,900,000Conservation $175,000 $300,000 $900,000 $1,200,000 $1,200,000depreciation $3,600,000 $3,600,000 $3,600,000 $3,600,000 $3,600,000capital projects $1,500,000 $750,000 $0 $0 $0
Total Operating $18,053,500 $17,961,306 $17,474,640 $17,306,040 $17,212,350

ImplementImplementEstablish stage triggers based on priorities and quantifiable supply availability by source
Identify lag-time and seasonal issues related to each reduction program
Consider and monitor impact of limited-number-of -days irrigation programs
Develop customer service & appeal procedure
Involve community

Make it work for your agency & customersMake it work for your agency & customers
Establish required computer capabilities for billing, data tracking and customer support
Identify required changes to existing computer systems
Make required computer system changes and test thoroughly

Make it work for your agency & customersMake it work for your agency & customers
Prepare customer information brochures
Plumbing hardware recommendations and rebate programs
Customer assistance programs
Identify needed new full-time and part-time contract staff and required space and equipment
Work with media

Planning timeline April - May 2009Planning timeline April - May 2009
NOW Staff member begins to research and draft an updated rationing plan.
15 - Apr
GM and team review draft plan, suggest changes. The plan is modified and expanded to include implementation procedures for actions necessary during Summer 2009. Essential staff review plan and comment on how it effects their functions, ensure that it is 'workable.'
1 - MayBoard subcommittee reviews the plan, suggests changes, and sends the plan to the Board for review and action
15 - May Full Board reviews the draft plan and schedules public hearings.

Planning timeline June - July 2009Planning timeline June - July 2009
mid-JunPlan released for public review. Two public hearings -suggested changes incorporated into plan.
late-JunBoard adopts WSCP, declares (if necessary) a Water Shortage Emergency, starts voluntary or mandatory program.
1 - JulyCustomers are notified by direct mail that voluntary mandatory rationing has been adopted and how the plan will affect them

Planning timeline July ‘09 - May ‘10Planning timeline July ‘09 - May ‘10
Jul-OctWeekly Team meetings to complete future stages. Monitor community response to current plan and modify as necessary
Nov-DecTeam works with local agencies to coordinate regional response. Board sets more public hearings.
Jan-Feb 2010
Board adopts plan, computer/billing upgrades completed. Materials prepared, rate hearings scheduled.
March Hire staff, lease vehicles, purchase computer, cell phones, etc.Commence rationing.
April -May
Customers receive individual letter with their allotment, description of rationing plan and appeal procedure, general rationing brochure, and conservation information on how to reduce use.

LunchLunch

Local Agency Experience
Local Agency Experience

Wrap UpWrap UpMarsha Prillwitz - [email protected]
Larry Farwell - [email protected]
Dave Todd - [email protected]
Kevin Clancy - [email protected]