3.4 air quality - dart.org air quality this section provides an overview ... emissions from cars and...
TRANSCRIPT
Preliminary Engineering / Environmental Impact StatementNorthwest Corridor LRT Line to Irving and DFW Airport
Draft Environmental Impact Statement 3 - 44Chapter 3 Affected Environment
3.4 AIR QUALITYThis section provides an overview of the airborne pollutants of interest; air quality standards andthe regulatory setting; existing air quality and National Ambient Air Quality Standard (NAAQS)compliance; regional attainment and conformity status; and transit air quality criteria along theDART Northwest Corridor Light Rail Line to Irving/DFW.
3.4.1 Air Quality Standards and Regulatory Setting
Airborne PollutantsAmbient air quality is influenced by a number of factors, including climate, topography, windconditions, and the production of airborne pollutants by natural or artificial sources. Tailpipeemissions from cars and trucks produce almost a third of the air pollution in the United States.Vehicles are major sources of carbon monoxide (CO), oxides of nitrogen/nitrogen dioxide(NOx/NO2) and Volatile Organic Compounds (VOCs). CO is the primary component of vehicleexhaust gas and contributes about 60 percent of all CO emission in the United States. Particulatematters (PM10 and PM2.5) and sulfur dioxide (SO2) are also emitted from vehicular traffic; however,the emissions are not as significant as CO and NOx emissions. Ozone (O3), which is not directlyemitted from automobiles (or other sources) is formed in the atmosphere by chemical reactionsinvolving VOCs, NOx, and sunlight. The following is a summary of major airborne pollutants in thestudy area and their health effects:
Carbon Monoxide (CO) – Carbon monoxide is an odorless, colorless gas formed by the burning offuels containing carbon. Motor vehicles are the principal source of CO emissions in urbanareas. Maximum concentrations usually occur near intersections and other areas of trafficcongestion, and they decrease rapidly with distance from the source. It can cause dizzinessand fatigue and can impair central nervous system functions. Exposure to high levels of COcan cause immediate death.
Particulate Matter (PM2.5 & PM10) – Particulate matter enters the air from industrial operations,vehicular traffic and other sources, including fireplaces. Most of the particulate mattergenerated by motor vehicles consists of resuspended road dust. Measurements of particulatematter concentrations include TSP (total suspended particulates), PM10 (particles with adiameter less than or equal to 10 micrometers), and PM2.5 (particles with a diameter lessthan or equal to 2.5 micrometers). Particles of this size can be inhaled, irritating the humanrespiratory tract and aggravating pre-existing respiratory diseases. Certain populations, suchas children, the elderly, exercising adults, and those suffering from asthma or bronchitis, areespecially vulnerable. Very small particles of substances such as Pb, sulfates, and nitratescan cause lung damage directly, can be adsorbed into the blood stream and cause damageelsewhere in the body, and can transport adsorbed gases, such as chlorides or ammoniuminto the lungs and cause injury.
Ozone (O3) – Ozone in the lower atmosphere is a harmful air pollutant and contributes to theformation of smog. It is a secondary pollutant formed by the reaction of volatile organiccompounds and oxides of nitrogen in the presence of strong sunlight. Thus, ozone levels arereduced by minimizing emissions of those precursor pollutants. Ozone causes eye andrespiratory irritation, reduces resistance to lung infections, and may aggravate pulmonaryconditions in individuals with lung disease. Elevated O3 levels cause vegetation damage.
Volatile Organic Compounds (VOC) – Volatile organic compounds (VOC) are a key component inthe formation of ozone. These hydrocarbons are emitted or evaporate into the atmospherefrom a variety of sources, particularly the storage and combustion of fuels in motor vehicles.
Preliminary Engineering / Environmental Impact StatementNorthwest Corridor LRT Line to Irving and DFW Airport
Draft Environmental Impact Statement 3 - 45Chapter 3 Affected Environment
Oxides of Nitrogen (NOX) – is a gaseous mixture of NO and NO2 that damages or irritates thehuman respiratory system, and can exacerbate damage from respiratory disease and otherexisting forms of irritation. NO2 may reduce resistance to certain infections. It is also aprecursor of O3. NO2 is a product of high-temperature combustion, emitted generally by thesame sources as CO. High concentrations of NO2 cause the brown haze readily observed inurban areas during periods of heavy air pollution. Concentrations of NO2 are highest duringlate fall and winter.
Lead (Pb) – Lead is a particulate pollutant that is also a carcinogenic air contaminant. In the past,automobiles were the chief contributors of Pb to the atmosphere in the U.S. Currently, lead isprimarily emitted in U.S. from a relatively small number of point sources such as smelters andbattery plants.
Sulfur Dioxide (SO2) – Sulfur Dioxide is a product of the combustion of high-sulfur fuels, such asmany grades of coal and oil. SO2 is a human respiratory irritant. It combines with moisture inthe atmosphere to form sulfuric acid and damages vegetation and exterior façades ofbuildings.
Federal Clean Air ActThe Federal Clean Air Act (CAA) was enacted in 1970 and was last amended in 1990 with thepurpose of controlling air pollution and providing a framework for national, state, and local airquality control efforts. The CAA Amendments of 1990 (CAAA) requires the EnvironmentalProtection Agency (EPA) to set National Ambient Air Quality Standards (NAAQS) for widespreadpollutants considered harmful to public health and the environment. EPA has set NAAQS for sixprincipal or “criteria” pollutants; Ozone (O3), Particulate Matter (PM10), Carbon Monoxide (CO),Sulfur Dioxide (SO2), Oxides of Nitrogen (NOx), and Lead (Pb). The EPA has established primaryand secondary standards for these pollutants. The primary air quality standards are defined as“the levels of air quality necessary, with an adequate margin of safety, to protect the public health.”Secondary standards are the levels of air quality necessary to protect the public welfare from anyknown or anticipated adverse effects of a pollutant on property, material, and vegetation.
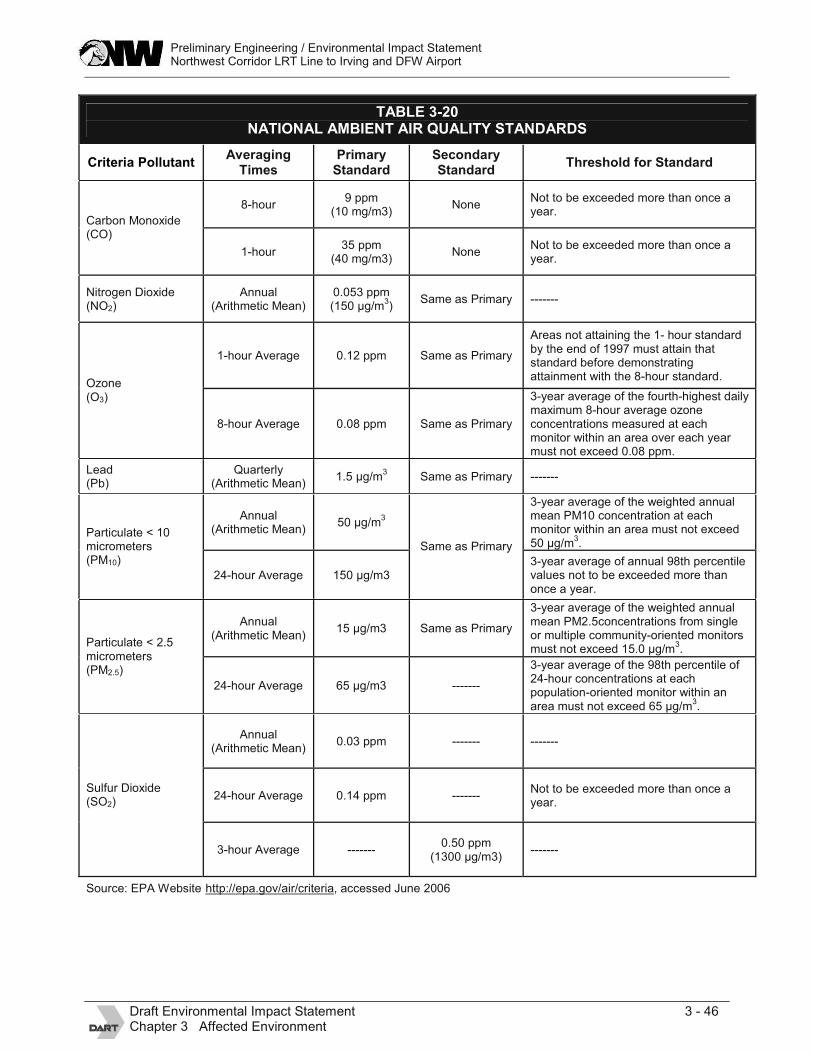
In July 1997, the EPA amended NAAQS to include an 8-hour standard for O3 and to adopt anNAAQS for PM2.5. EPA issued official designations for the PM2.5 standard on December 17, 2004and made modifications in April 2005 (EPA, 2005). Ambient air quality standards for criteriapollutants are presented in Table 3-20 lists the criteria pollutants, their relative primary andsecondary standards, and the condition required for each standard to be met (standard threshold).
Attainment StatusThe EPA designates geographic areas in a state with respect to meeting the NAAQS asattainment, nonattainment, or unclassifiable. Areas transitioning from nonattainment to attainmentare termed maintenance areas. The nonattainment areas are designated based on the degree ofviolation of the NAAQS. For O3 the designations are extreme, severe, moderate, or marginal. OnApril 15, 2004, EPA designated several counties in the North Central Texas area as nonattainmentunder the new 8-Hour NAAQS for ozone (O3) as mandated by Section 181(b)(2)(A) of the CAAA.
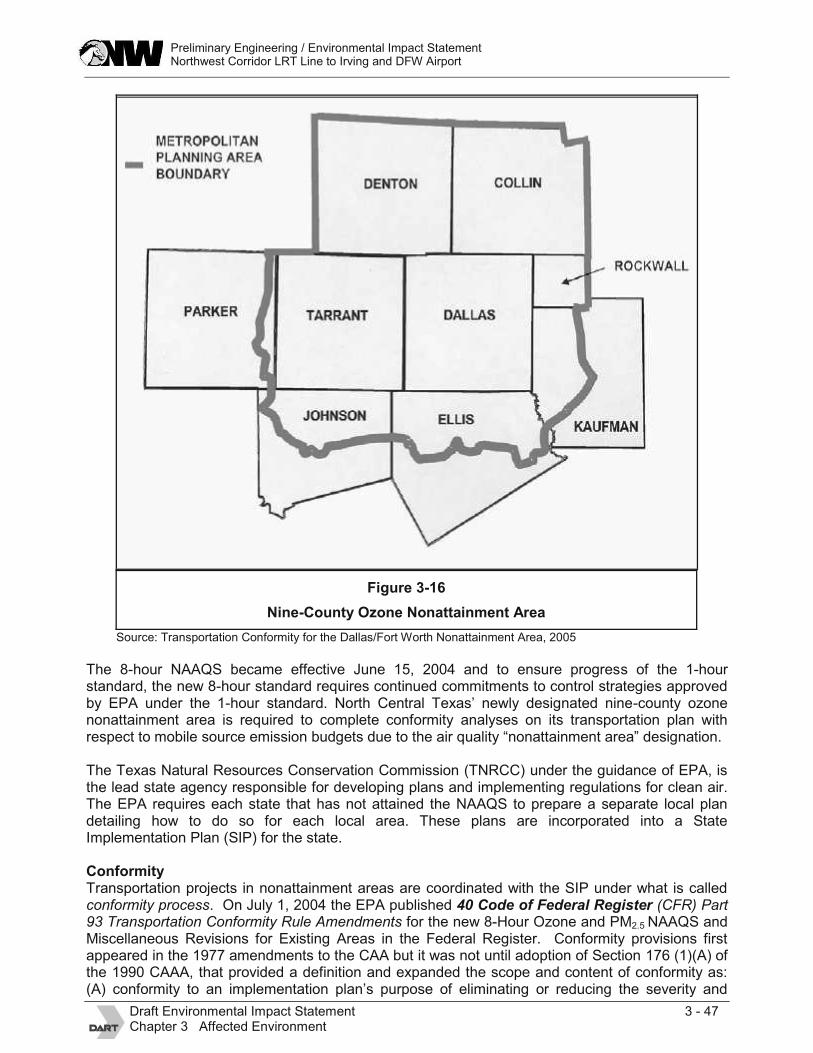
North Central Texas’ newly designated nine-county ozone nonattainment area covers all of Collin,Dallas, Denton, and Rockwall counties; and portions of Ellis, Johnson, Kaufman, and Parkercounties. Figure 3-16 shows the nine-county O3 nonattainment area. Based on the magnitude ofozone pollution in these nine counties, the nonattainment area was classified as “Moderate”.
Preliminary Engineering / Environmental Impact StatementNorthwest Corridor LRT Line to Irving and DFW Airport
Draft Environmental Impact Statement 3 - 46Chapter 3 Affected Environment
TABLE 3-20NATIONAL AMBIENT AIR QUALITY STANDARDS
Criteria Pollutant AveragingTimes
PrimaryStandard
SecondaryStandard Threshold for Standard
8-hour9 ppm
(10 mg/m3)None
Not to be exceeded more than once ayear.
Carbon Monoxide(CO)
1-hour35 ppm
(40 mg/m3)None
Not to be exceeded more than once ayear.
Nitrogen Dioxide(NO2)
Annual(Arithmetic Mean)
0.053 ppm(150 µg/m
3)
Same as Primary -------
1-hour Average 0.12 ppm Same as Primary
Areas not attaining the 1- hour standardby the end of 1997 must attain thatstandard before demonstratingattainment with the 8-hour standard.
Ozone(O3)
8-hour Average 0.08 ppm Same as Primary
3-year average of the fourth-highest dailymaximum 8-hour average ozoneconcentrations measured at eachmonitor within an area over each yearmust not exceed 0.08 ppm.
Lead(Pb)
Quarterly(Arithmetic Mean)
1.5 µg/m3
Same as Primary -------
Annual(Arithmetic Mean)
50 µg/m3
3-year average of the weighted annualmean PM10 concentration at eachmonitor within an area must not exceed50 µg/m
3.
Particulate < 10micrometers(PM10)
24-hour Average 150 µg/m3
Same as Primary
3-year average of annual 98th percentilevalues not to be exceeded more thanonce a year.
Annual(Arithmetic Mean)
15 µg/m3 Same as Primary
3-year average of the weighted annualmean PM2.5concentrations from singleor multiple community-oriented monitorsmust not exceed 15.0 µg/m
3.
Particulate < 2.5micrometers(PM2.5)
24-hour Average 65 µg/m3 -------
3-year average of the 98th percentile of24-hour concentrations at eachpopulation-oriented monitor within anarea must not exceed 65 µg/m
3.
Annual(Arithmetic Mean)
0.03 ppm ------- -------
24-hour Average 0.14 ppm -------Not to be exceeded more than once ayear.
Sulfur Dioxide(SO2)
3-hour Average -------0.50 ppm
(1300 µg/m3)-------
Source: EPA Website http://epa.gov/air/criteria, accessed June 2006
Preliminary Engineering / Environmental Impact StatementNorthwest Corridor LRT Line to Irving and DFW Airport
Draft Environmental Impact Statement 3 - 47Chapter 3 Affected Environment
Figure 3-16Nine-County Ozone Nonattainment Area
Source: Transportation Conformity for the Dallas/Fort Worth Nonattainment Area, 2005
The 8-hour NAAQS became effective June 15, 2004 and to ensure progress of the 1-hourstandard, the new 8-hour standard requires continued commitments to control strategies approvedby EPA under the 1-hour standard. North Central Texas’ newly designated nine-county ozonenonattainment area is required to complete conformity analyses on its transportation plan withrespect to mobile source emission budgets due to the air quality “nonattainment area” designation.
The Texas Natural Resources Conservation Commission (TNRCC) under the guidance of EPA, isthe lead state agency responsible for developing plans and implementing regulations for clean air.The EPA requires each state that has not attained the NAAQS to prepare a separate local plandetailing how to do so for each local area. These plans are incorporated into a StateImplementation Plan (SIP) for the state.
ConformityTransportation projects in nonattainment areas are coordinated with the SIP under what is calledconformity process. On July 1, 2004 the EPA published 40 Code of Federal Register (CFR) Part93 Transportation Conformity Rule Amendments for the new 8-Hour Ozone and PM2.5 NAAQS andMiscellaneous Revisions for Existing Areas in the Federal Register. Conformity provisions firstappeared in the 1977 amendments to the CAA but it was not until adoption of Section 176 (1)(A) ofthe 1990 CAAA, that provided a definition and expanded the scope and content of conformity as:(A) conformity to an implementation plan’s purpose of eliminating or reducing the severity and
Preliminary Engineering / Environmental Impact StatementNorthwest Corridor LRT Line to Irving and DFW Airport
Draft Environmental Impact Statement 3 - 48Chapter 3 Affected Environment
number of violations of the national ambient air quality standards and achieving expeditiousattainment of such standards; and (B) that such activities will not
(i) cause or contribute to any new violation of any standards in any area;(ii) increase the frequency or severity of any existing violation of any standard in any area; or(iii) delay timely attainment of any standard or a required interim emission reduction or other
milestones in any area.
Conformity determination’s purpose is to demonstrate that projected vehicle emissions fromregional projects and programs are within the emission budgets established in the applicable airquality plan and document that transportation control measures are implemented in a timelymanner. The determination of conformity is a two-step process in metropolitan areas.
The first step is for the regional transportation council (RTC), the metropolitan planningorganization’s (MPO) policy body, to develop and maintain 20-year Regional/MetropolitanTransportation Plans and 3-year Transportation Improvement Programs (TIP) that set outtransportation policies and programs for the region.
The second step is for the Federal Highway Administration (FHWA) and Federal TransitAdministration (FTA) to make the final transportation conformity determination at the federal level.
The Transportation Department of the North Central Texas Council of Governments (NCTCOG) isdesignated as the MPO for the Dallas/Fort Worth (DFW) area, which covers entire boundaries ofthe proposed Project Corridor.
The most recent approved/adopted transportation plan in the project area is Mobility 2025: TheMetropolitan Transportation Plan (Amended April 2005) and the 2006-2008 TransportationImprovement Program. The document was approved by RTC on April 14, 2005 and by the USDepartment of Transportation on June 16, 2005 (NCTCOG, 2005).
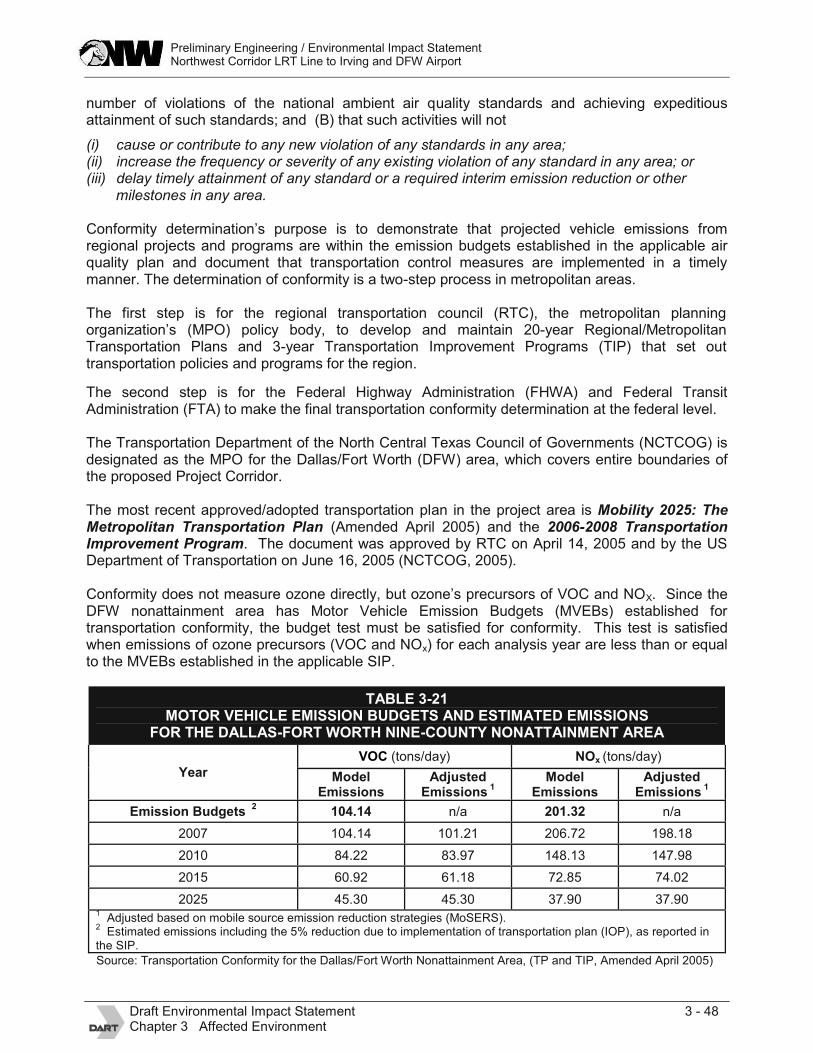
Conformity does not measure ozone directly, but ozone’s precursors of VOC and NOX. Since theDFW nonattainment area has Motor Vehicle Emission Budgets (MVEBs) established fortransportation conformity, the budget test must be satisfied for conformity. This test is satisfiedwhen emissions of ozone precursors (VOC and NOx) for each analysis year are less than or equalto the MVEBs established in the applicable SIP.
TABLE 3-21MOTOR VEHICLE EMISSION BUDGETS AND ESTIMATED EMISSIONS
FOR THE DALLAS-FORT WORTH NINE-COUNTY NONATTAINMENT AREAVOC (tons/day) NOx (tons/day)
Year ModelEmissions
AdjustedEmissions 1
ModelEmissions
AdjustedEmissions 1
Emission Budgets 2 104.14 n/a 201.32 n/a
2007 104.14 101.21 206.72 198.18
2010 84.22 83.97 148.13 147.98
2015 60.92 61.18 72.85 74.02
2025 45.30 45.30 37.90 37.901
Adjusted based on mobile source emission reduction strategies (MoSERS).2
Estimated emissions including the 5% reduction due to implementation of transportation plan (IOP), as reported inthe SIP.
Source: Transportation Conformity for the Dallas/Fort Worth Nonattainment Area, (TP and TIP, Amended April 2005)
Preliminary Engineering / Environmental Impact StatementNorthwest Corridor LRT Line to Irving and DFW Airport
Draft Environmental Impact Statement 3 - 49Chapter 3 Affected Environment
The regional emission analysis may be performed for any year within the time frame of thetransportation plan, provided they are not more than ten years apart, and include the attainmentyear (2010) and plan horizon year (2025) and any year that a MVEB has been established (2007).To meet this requirement analysis, years 2007, 2010, 2015, and 2025 were selected. Table 3-21above shows the estimated emissions for the analysis years as reported in the most recentTransportation Conformity document (NCTCOG, 2005).
3.4.2 Existing SettingLocal ClimateThe Dallas/Fort Worth metropolitan area has a continental climate with annual temperaturesranging from below 10 degrees to over 100 degrees Fahrenheit (°F). Average monthlytemperature ranges from 44 °F in January to 86 °F in July. Prevailing winds are from the south,and the level to rolling terrain of the metropolitan area allows air masses to move easily over theregion. As a result, long-term air pollution episodes resulting from stagnant air masses areuncommon. Air pollution episodes in the Dallas-Fort Worth area are usually associated with thesummer months, with high temperature and intense sunlight, which is more conductive to ozoneproduction than winter months.
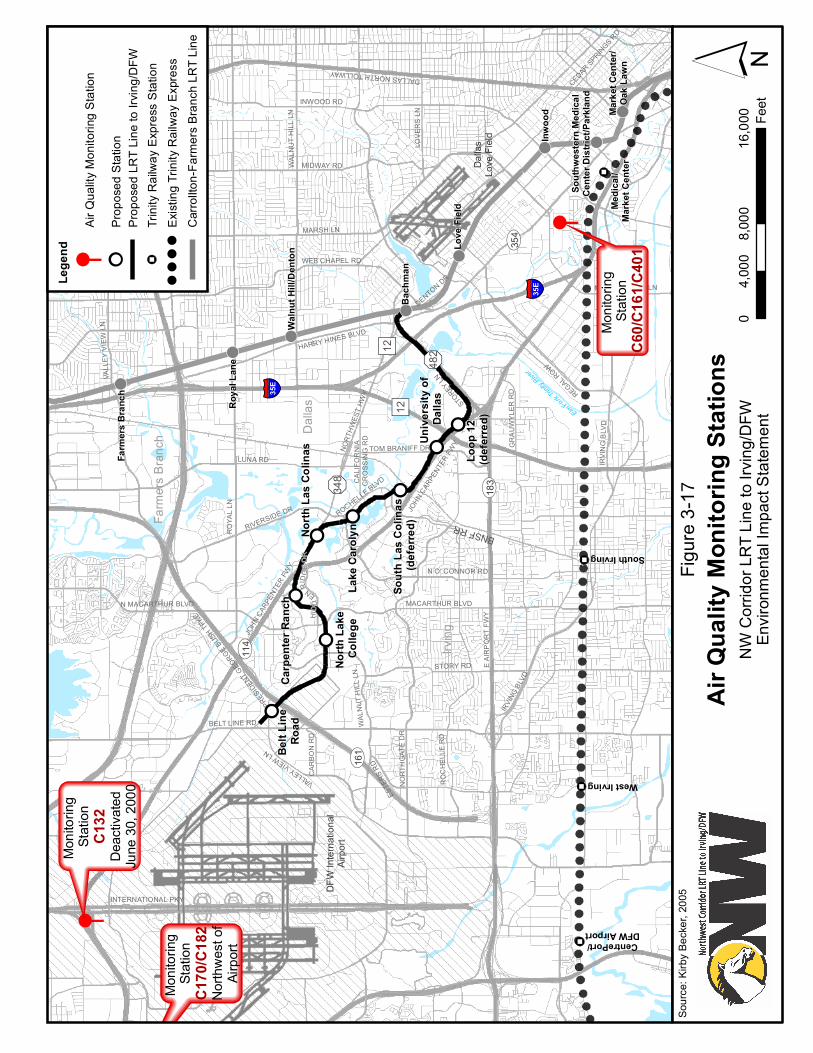
Background ConcentrationsThe proposed Project Corridor is located in the DFW area, which is designated as moderatenonattainment for 8-hour O3 levels. The “nonattainment” designation for O3 indicates thatviolations of the federal standards for O3 have been observed at air monitoring sites within theregion. The moderate nonattainment category is defined by an O3 design value between 138 and160 parts per billion (ppb) for the fourth highest monitored 1-hour average O3 concentration at thesame monitoring site over a three-year period. The Texas Commission on Environmental Quality(TCEQ) and the City of Dallas operate air-monitoring stations throughout the metropolitan area.Two are located in the vicinity of the proposed Project Corridor. The Hinton Street monitoringstation (C60/C401), located at 1415 Hinton Street, is approximately 2.7 miles southeast of theeastern end of the proposed project; and the Grapevine Fairway monitoring station (C70/C182),located at 4100 Fairway Drive is approximately 7.9 miles northwest of the Project Corridor. Themonitoring stations are shown in Figure 3-17.
In the DFW region there are only three monitoring stations that collect 1-hour and 8-hour CO data.The CO background concentrations for analysis of the DART Northwest Corridor were obtainedfrom the Hinton Street monitoring station. Other criteria pollutants, including O3, PM2.5, and NO2
are also monitored at this station. The nearest monitoring locations for PM10 are the ConventionCenter (C312) and the Boys Club (C134) Stations that are located approximately 7.5 milessoutheast and 10 miles southwest of the eastern end of the proposed project, respectively. Themost recent data available from these monitoring stations encompassed the years 2002 to 2005.
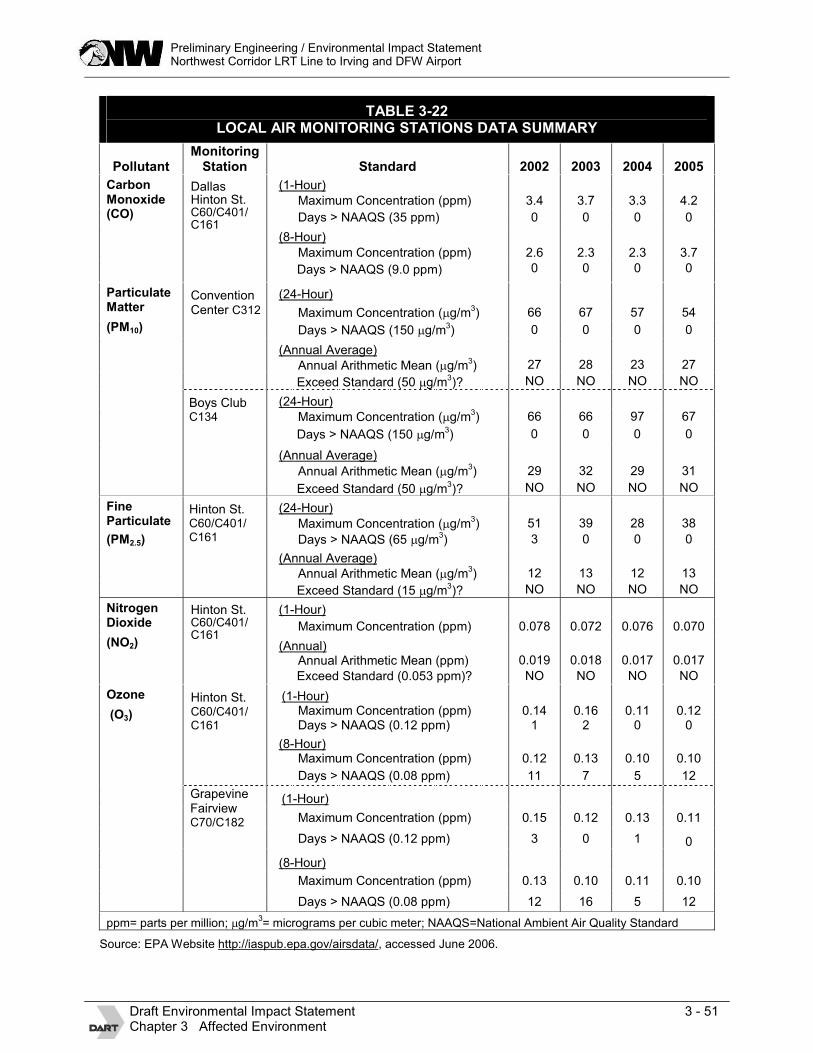
The recorded data, presented in Table 3-22, show the following pollutant trends.
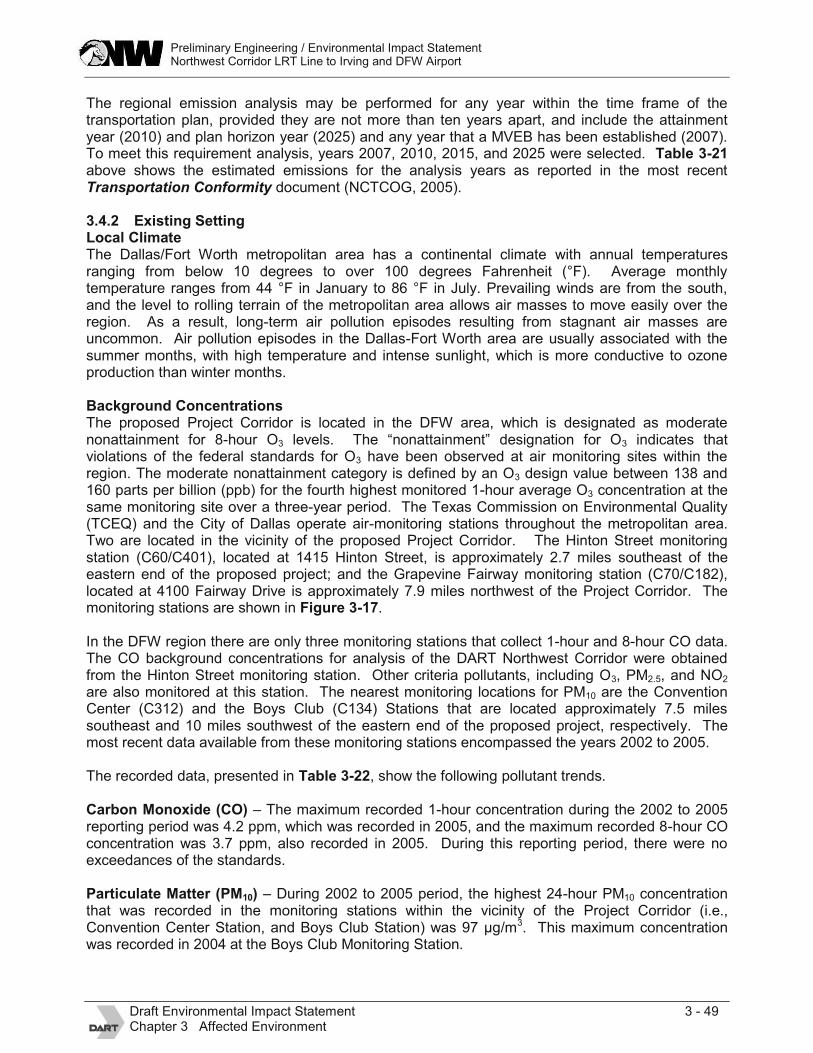
Carbon Monoxide (CO) – The maximum recorded 1-hour concentration during the 2002 to 2005reporting period was 4.2 ppm, which was recorded in 2005, and the maximum recorded 8-hour COconcentration was 3.7 ppm, also recorded in 2005. During this reporting period, there were noexceedances of the standards.
Particulate Matter (PM10) – During 2002 to 2005 period, the highest 24-hour PM10 concentrationthat was recorded in the monitoring stations within the vicinity of the Project Corridor (i.e.,Convention Center Station, and Boys Club Station) was 97 µg/m3. This maximum concentrationwas recorded in 2004 at the Boys Club Monitoring Station.
! ("
! ("! ("
! ("
!!
!!
!!!!
!!
!!
!!
!!
!!
ROYA
L LN
JOHN
CARP
ENTE
R FWY
LUNA RD
ROCH
ELLE
RD
WALN
UT H
ILL LN
ESTE
RS RD
STORY RD
HARRY HINES BLVDNO
RTHW
EST H
WY
GRAU
WYLE
R RD
RIVERSIDE DR
HIDD
EN RID
GE D
R
Farm
ers B
ranch
UV161
&-482" )12
VALLEY VIEW LN
ROCHELLE BLVD
PRESIDENT GEORGE BUSH TP
KE
REGAL ROW
IRVING
BLVD
N MACARTHUR BLVD
TOM BRANIFF DR
WEB CHAPEL RD
STOREY LN
E AIR
PORT
FWY
NORT
HGAT
E DR
CALIF
ORNI
A CR
OSSIN
G RD
BELT LINE RD
" )12
§̈ ¦35E
Irving
Dalla
s
N O' CONNOR RD
CARB
ON R
D
Dalla
sLo
ve Fi
eld
JOHN C
ARPE
NTER
FWY
DENTON DR
MACARTHUR BLVD
DFW
Intern
ation
alAir
port
Elm Fork Trinity R
iver
BNSF RR
&-348
UV183
INTERNATIONAL PKY
IRVIN
G BL
VD
MOCKINGBIRD LN
MARSH LN
MIDWAY RD
LOVE
RS LN
INWOOD RD
DALLAS NORTH TOLLWAY
CEDAR SPRINGS RD
VALL
EY VI
EW LN
UV114
UV354
§̈ ¦35E
WALN
UT H
ILL LN
^
^
!!
!!
!!
!!
!!
!!
!!
!!
Monit
oring
Sta
tion
C60/C
161/C
401
Monit
oring
Sta
tion
C132
Deac
tivate
dJu
ne 30
, 200
0
Monit
oring
Sta
tion
C170
/C18
2No
rthwe
st of
Airpo
rt
Carp
enter
Ran
ch
North
Lake
Co
llege
Lake
Car
olynNo
rth La
s Coli
nas
Belt L
ine
Road
Loop
12
(defer
red)
Sout
h Las
Coli
nas
(defer
red)
South Irving
West Irving
CentrePort/DFW Airport
Medic
al/Ma
rket
Cent
er
South
weste
rn M
edica
lCe
nter D
istric
t/Par
kland
Mark
et Ce
nter/
Oak L
awn
Inwoo
d
Love
Field
Bach
man
Walnu
t Hill/
Dento
n
Roya
l Lan
e
Farm
ers B
ranc
h
Unive
rsity
of
Dalla
s
Cabe
ll Dr
Harry
Hine
s BlvdShorecrest
Figure
3-17
NW C
orrido
r LRT
Line
to Irv
ing/D
FWEn
viron
menta
l Impa
ct Sta
temen
t´
Air Q
uality
Mon
itorin
g Stat
ions
08,0
0016
,000
4,000
Feet
Sourc
e: Kir
by Be
cker,
2005
Lege
nd
Trinit
y Rail
way E
xpres
s Stat
ionEx
isting
Trini
ty Ra
ilway
Exp
ress
! ("
!!!!
Prop
osed
LRT L
ine to
Irving
/DFW
Prop
osed
Stat
ion!!
Carro
llton-F
armers
Bran
ch LR
T Line
Air Q
uality
Mon
itorin
g Stat
ion^
Preliminary Engineering / Environmental Impact StatementNorthwest Corridor LRT Line to Irving and DFW Airport
Draft Environmental Impact Statement 3 - 51Chapter 3 Affected Environment
TABLE 3-22LOCAL AIR MONITORING STATIONS DATA SUMMARY
PollutantMonitoring
Station Standard 2002 2003 2004 2005(1-Hour)
Maximum Concentration (ppm) 3.4 3.7 3.3 4.2
Days > NAAQS (35 ppm) 0 0 0 0
(8-Hour)
Maximum Concentration (ppm) 2.6 2.3 2.3 3.7
CarbonMonoxide(CO)
DallasHinton St.C60/C401/C161
Days > NAAQS (9.0 ppm) 0 0 0 0
(24-Hour)
Maximum Concentration (�g/m3) 66 67 57 54
Days > NAAQS (150 �g/m3) 0 0 0 0
(Annual Average)Annual Arithmetic Mean (�g/m3) 27 28 23 27
ParticulateMatter(PM10)
ConventionCenter C312
Exceed Standard (50 �g/m3)? NO NO NO NO
(24-Hour)Maximum Concentration (�g/m3) 66 66 97 67
Days > NAAQS (150 �g/m3) 0 0 0 0
(Annual Average)
Annual Arithmetic Mean (�g/m3) 29 32 29 31
Boys ClubC134
Exceed Standard (50 �g/m3)? NO NO NO NO
(24-Hour)
Maximum Concentration (�g/m3) 51 39 28 38
Days > NAAQS (65 �g/m3) 3 0 0 0
(Annual Average)Annual Arithmetic Mean (�g/m3) 12 13 12 13
FineParticulate(PM2.5)
Hinton St.C60/C401/C161
Exceed Standard (15 �g/m3)? NO NO NO NO
(1-Hour)
Maximum Concentration (ppm) 0.078 0.072 0.076 0.070
(Annual)Annual Arithmetic Mean (ppm) 0.019 0.018 0.017 0.017
NitrogenDioxide(NO2)
Hinton St.C60/C401/C161
Exceed Standard (0.053 ppm)? NO NO NO NO
(1-Hour)Maximum Concentration (ppm) 0.14 0.16 0.11 0.12Days > NAAQS (0.12 ppm) 1 2 0 0
(8-Hour)Maximum Concentration (ppm) 0.12 0.13 0.10 0.10
Ozone(O3)
Hinton St.C60/C401/C161
Days > NAAQS (0.08 ppm) 11 7 5 12
(1-Hour)
Maximum Concentration (ppm) 0.15 0.12 0.13 0.11
Days > NAAQS (0.12 ppm) 3 0 1 0
(8-Hour)
Maximum Concentration (ppm) 0.13 0.10 0.11 0.10
GrapevineFairviewC70/C182
Days > NAAQS (0.08 ppm) 12 16 5 12
ppm= parts per million; �g/m3= micrograms per cubic meter; NAAQS=National Ambient Air Quality Standard
Source: EPA Website http://iaspub.epa.gov/airsdata/, accessed June 2006.
Preliminary Engineering / Environmental Impact StatementNorthwest Corridor LRT Line to Irving and DFW Airport
Draft Environmental Impact Statement 3 - 52Chapter 3 Affected Environment
During this same time period, the annual average concentration of PM10 varied between 23 and 32µg/m3, with the highest value recorded in 2003, also at the Boys Club Station. There was noexceedance from the 24-hour or annual standard during this recording period.
Fine Particulates (PM2.5) – From 2002 to 2005, the 24-hour PM2.5 maximum concentrations variedbetween 28 and 51 µg/m3 whereas, the annual average concentration values ranged between 12and 13 µg/m3. The recorded concentrations are below the national standards of 65 µg/m3 (24-hourmaximum level), and 15 µg/m3 (annual average concentration) standards. Therefore, there wereno exceedances of the national 24-hour or annual average PM2.5 standards during the reportingperiod.
Ozone (O3) – During 2002 to 2005 period, the maximum 1-hour O3 concentration that wasrecorded in the monitoring stations within the vicinity of the Project Corridor (i.e., the Grapevine-Fairway Station, and the Hinton Street Station) was 0.16 ppm, recorded in 2003 at the HintonStreet Station. During this period, the 1-hour ozone standard was exceeded between 1 and 3times annually. The maximum 8-hour O3 concentration was 0.13 ppm recorded in 2003. TheNational standard was exceeded between 5 and 16 times annually.
3.4.3 Sensitive ReceptorsSome land uses are considered more sensitive to changes in air quality than others, depending onthe population groups and the activities involved. These population groups include the following:children under 14, elderly over 65, and athletes, as well as people with cardiovascular and chronicrespiratory diseases. Locations that may contain a high concentration of these sensitivepopulation groups are called sensitive receptors and include residential areas, hospitals, elder carefacilities, rehabilitation center, elementary schools, hotels, and parks.
Several types of sensitive land uses are located within ¼-mile of the project alignment. Thesensitive receptors include residential use (single- and multi-family residences, mobile homes),hotel (e.g., Candlewood Suites Hotel, Las Colinas Studio Plus Hotel), golf course, school andchurch. Please refer to Figures 3-1 and 3-2 in the Land Use Section for the locations of differenttypes of receptors.
3.4.4 Transit Air Quality Impact CriteriaAir quality impact analysis for this project is based on the criteria as defined in the U.S. FederalTransit Administration (FTA) Environmental Process. FTA requires that mass transit projectsproposed for federal funding must meet the requirements of the Clean Air Act in addition to NEPArequirements. The Clean Air Act contains detailed transportation “conformity” requirements toensure that federally funded highway and transit projects conform to the applicable SIP. Thisanalysis is useful in addressing the mesoscale (regional) concerns of the project. The conformityrequirements apply only in nonattainment and maintenance areas.
In addition to the conformity issues, the Federal Transit Administration requires that a microscaleCO analysis be performed. This analysis is required for each reasonable alternative for theestimated time of completion and design year. Total CO concentrations (project contribution plusestimated background) at identified reasonable receptors for each alternative should be reportedand a comparison should be made between alternatives and with applicable State and nationalstandards. In case the preferred alternative would result in violations of 1 or 8-hr standards, aneffort should be made to develop reasonable mitigation measures through early coordinationbetween FTA, EPA, and appropriate State and local highway and air quality agencies.
3.5 NOISEThis section describes the methodology used to characterize the existing noise and vibrationconditions along the Irving/DFW Line of the DART Northwest Corridor, and provides background