reactive transport of sr-85 in a chernobyl sand column...
TRANSCRIPT

Journal of Contaminant Hydrology 76 (2005) 139–165
www.elsevier.com/locate/jconhyd
Reactive transport of 85Sr in a chernobyl sand
column: static and dynamic experiments
and modeling
Stephanie Szenknecta,*, Christophe Ardoisa,
Jean-Paul Gaudetb,*, Veronique Barthesc
aLaboratoire d’Etude des Transferts dans les Sols et le sous-sol, IRSN/DEI/SARG, BP n817,92262 Fontenay aux Roses Cedex, France
bLaboratoire d’etude des Transferts en Hydrologie et Environnement, CNRS/INPG/IRD/UJF-UMR 5564,
BP n853, 38041 Grenoble Cedex 9, FrancecSection d’Application des Traceurs, CEA/DRT/DTEN, 17 rue des Martyrs, 38054 Grenoble Cedex 9, France
Received 31 July 2003; received in revised form 28 July 2004; accepted 3 August 2004
Abstract
The effects of nonlinear sorption and competition with major cations present in the soil solution
on radioactive strontium transport in an eolian sand were examined. Three laboratory techniques
were used to identify and quantify the chemical and hydrodynamic processes involved in strontium
transport: batch experiments, stirred flow-through reactor experiments and saturated laboratory
columns. The major goal was to compare the results obtained under static and dynamic conditions
and to describe in a deterministic manner the predominant processes involved in radioactive
strontium transport in such systems. Experiments under dynamic conditions, namely flow-through
reactor and column experiments, were in very good agreement even though the solid/liquid ratio was
very different. The experimental data obtained from the flow-through reactor study pointed to a
nonlinear, instantaneous and reversible sorption process. Miscible displacement experiments were
conducted to demonstrate the competition between stable and radioactive strontium and to quantify
its effect on the 85Sr retardation factor. The results were modeled using the PHREEQC computer
code. A suitable cation-exchange model was used to describe the solute/soil reaction. The model
successfully described the results of the entire set of miscible displacement experiments using the
0169-7722/$ -
doi:10.1016/j.
* Corresp
E-mail add
see front matter D 2004 Elsevier B.V. All rights reserved.
jconhyd.2004.08.003
onding authors. Fax: +33 4 38 78 51 34.
resses: [email protected] (S. Szenknect)8 [email protected] (J.-P. Gaudet).
S. Szenknect et al. / Journal of Contaminant Hydrology 76 (2005) 139–165140
same set of parameter values for the reaction calculations. The column study revealed that the stable
Sr aqueous concentration was the most sensitive variable of the model, and that the initial state of the
sand/solution system had also to be controlled to explain and describe the measured retardation
factor of radioactive strontium. From these observations, propositions can be made to explain the
discrepancies observed between some data obtained from static (batches) and dynamic (reactor and
column) experiments. Desorbed antecedent species (stable Sr) are removed from the column or
reactor in the flow system but continue to compete for sorption sites in the batch system. Batch
experiments are simple and fast, and provide a very useful means of multiplying data. However,
interpretation becomes difficult when different species compete for sorption sites in the soil/solution
system. A combination of batches, flow-through reactor and column experiments, coupled with
hydrogeochemical modeling, would seem to offer a very powerful tool for identifying and
quantifying the predominant processes on a cubic decimeter scale (dm3) and for providing a range of
radioactive strontium retardation factor as a function of the geochemistry of the soil/solution system.
D 2004 Elsevier B.V. All rights reserved.
Keywords: Strontium; Porous media; Solute transport; Nonlinear sorption; Column; Stirred flow-through reactor
1. Introduction
In 1987, a site located 2.5 km south west of Chernobyl Nuclear Power Plant was
earmarked for the interim storage of surface soil and contaminated tree trunks following
the nuclear accident the year before. These materials can be found in trenches a few meters
deep. In 1999, one of these trenches (T22) was chosen for carrying out experiments to
validate basic models representing radionuclide transfer to soils and aquifers. Trench T22
and the top layer contain fuel particles that dissolve and release 90Sr. For 15 years,
strontium has been penetrating the unsaturated soil zone and the water table with the result
that 90Sr activity in the water table varies between 10 and 13000 Bq/L, while the plume
can be seen to spread over a few tens of meters downstream of trench T22 (BugaR et al.,2002; Dewiere et al., 2004).
Radionuclide mass (activity) transfer to the aquifer is controlled by the fuel particle
mass (activity) available for the dissolution process, fuel dissolution mechanisms, waste
material sorption parameters, sorption parameters and structure of the surrounding
undisturbed, unsaturated soil layer, and the water inflow rate from the surface. The activity
distribution in the waste burial site is very heterogeneous, as indicated by in situ trench
characterization data based on indirect measurements (Dewiere et al., 2004). Prediction of
contaminant transport in the subsurface is strongly influenced by the hydraulic and
chemical properties of the soil, processes such as advective and diffusive transport,
hydrodynamic dispersion, adsorption and desorption, as well as biological and chemical
transformations (Brusseau, 1994; Fesch et al., 1998; Gabriel et al., 1998; Albrecht et al.,
2003). Variability in the hydraulic and chemical properties of the soil can cause large
spatial differences in rates of contaminant transport from the surface to the groundwater.
This, together with the fact that water and radionuclides are unevenly distributed over the
Pilot Site in spatial and temporal terms, has caused contaminants (90Sr) to arrive at depths
at varying times. In many cases, chemical effects can be far more significant than
S. Szenknect et al. / Journal of Contaminant Hydrology 76 (2005) 139–165 141
hydraulic effects in explaining the differences in arrival times (Thomasson and Wierenga,
2003).
A number of solute transport models covering many of the hydraulic and chemical
processes affecting transport through the subsurface already exist (for a recent review, see
Simunek et al., 2003). Use of these models on a field scale requires knowledge of many
parameters used for describing underlying physical and chemical processes (Pang and
Close, 1999). The lack of parameter values, the recognized uncertainty relating to field-
scale mechanisms responsible for solute movement in natural soils, and the questionable
representativeness of samples (Jury and Sposito, 1985) make it very difficult to use
comprehensive models for field-scale studies. We therefore opted to use a simplified
model for solute transport through the subsurface, assuming that the convective–dispersive
transport equation, where chemical interactions are represented by a range of retardation
factors (R), can successfully be used to make field-scale predictions of 90Sr transport
through the unsaturated zone and in the aquifer. In order to gain insight into the impact of
various chemical mechanisms and processes on strontium arrival time and to define as
narrow a range of retardation factors as possible, it was decided to perform experiments on
the laboratory scale under closely controlled initial and boundary conditions and to use a
comprehensive model on this reduced scale.
This work examined the effect of nonlinear sorption and competition with major
cations present in the soil solution, on radioactive strontium transport in the eolian sand
of the Chernobyl Pilot Site (CPS). Three main laboratory techniques were used to
identify and quantify the chemical processes involved in strontium transport. Batch
experiments were performed to study the chemical equilibrium state of the soil/solution
system under static conditions. Stirred flow-through reactor experiments were conducted
to study the kinetics and reversibility of the sorption reaction of strontium at the surface
of solid particles under dynamic conditions. Lastly, the transport of strontium was
studied in the structured porous medium under saturated flow conditions in laboratory
columns. The aim of the study was also to compare the results obtained under static and
dynamic conditions, (Bajracharya et al., 1996; Fesch et al., 1998; Porro et al., 2000;
Plassard et al., 2000; Tran et al., 2002), but focusing on the initial physical and chemical
conditions in the soil/solution system.
2. Materials and methods
2.1. Study site and soil characterization
The near-surface geological column of the CPS consists of the following layers
(Dewiere et al., 2004): an artificial topsoil layer (~114.5–114 m a.s.l.), eolian sand (~114–
109.5 m a.s.l.), and alluvial sandy sediments (109.5–104 m a.s.l.). The depth to ground
water table is 2–3 m. The annual infiltration recharge to groundwater table ranging from
200 to 250 mm/year (30–40% of the yearly precipitation). The hydraulic conductivity of
eolian sands is estimated to be 3–5 m/day. For 15 years following waste disposal, 90Sr has
been leached from the T22 and has been penetrating the unsaturated zone and the eolian
sand aquifer.

S. Szenknect et al. / Journal of Contaminant Hydrology 76 (2005) 139–165142
The soil used for this study comes from Pripyat Zaton exposure, located 2 km north-
east of the CPS. The geological characterization of the Pilot Site and its geological analog,
Pripyat Zaton, demonstrated the continuity of the sedimentary suites on a regional scale
(Bugaı et al., 2000). Sand from Pripyat Zaton was not contaminated with 90Sr. Hence, it
was possible to sample sediments directly from the wall (~2-m high�10-m long) of the
exposure and to bring them back to the laboratory. Samples were collected on a grid, then
mixed to obtained an average sample of 20 kg. The typical soil bulk density (qd) is 1.7 g/
cm3 and the porosity (e) is 35%.
The soil sample was dry sieved and the b1 mm fraction used for characterization
and laboratory experiments (the N1 mm fraction represented less than 1% of the total
sample mass). Soil particle size distribution (Fig. 1) was determined using a laser
granulometer (Beckam-Coulter LS230, NF ISO 13320-1). The main components of
the soil were determined by chemical and X-ray diffraction analyses. The
mineralogical composition of the sand by percentage mass was: 95–98% quartz and
b5% feldspar. The X-ray diffraction analysis of the isolated fine fraction revealed the
presence of illite and kaolinite. The chemical composition of the sand by percentage
abundance was: 95–98% SiO2, b2% Al2O3+Fe2O3 (measured by ICP-AES after acid
digestion). The cation exchange capacity (CEC) of the soil determined using the
sodium acetate saturation method (Metson, 1956) is 1.25 meq/100 g, organic carbon
content measured by wet combustion is b0.3%, and specific surface area measured by
N2 adsorption using the BET model (Beckam-Coulter SA3100) is 1–2 m2/g. Sand
particle density was assumed to be equal to that of quartz, i.e., 2.65 g/cm3 (Bolz and
Tuve, 1976, pp. 192).
2.2. Synthetic groundwater and solutes
All column, batch and reactor tests were conducted using synthetic groundwater,
formulated to approximate the composition observed in CPS aquifer samples. Chemical
compositions of synthetic groundwater and field samples are compared in Table 1. The
concentrations of major cations chosen for synthetic water were in the range of field
concentrations. The highest concentrations were measured in the wells located down-
stream of the trench. These concentrations were not representative of the equilibrium state
Fig. 1. Cumulative size distribution by volume of studied eolian sand.

Table 1
Comparison of Chernobyl Pilot Site aquifer and synthetic groundwater compositions
Component Synthetic groundwater Pilot site aquifer
Base chemistry (mol/L) Average (mol/L) Standard deviation
(mol/L)
Min (mol/L) Max (mol/L)
Ca2+ 7.7�10�5F1�10�5 3.56�10�4 4.4�10�4 4.97�10�5 1.98�10�3
K+ 5.9�10�5F1�10�5 9.63�10�4 7.5�10�5 2.07�10�5 2.74�10�4
Na+ 5.7�10�5F1�10�5 5.21�10�5 6.6�10�5 1.41�10�5 2.21�10�4
Mg2+ 2.1�10�5F0.5�10�5 4.20�10�5 6.0�10�5 7.5�10�6 1.87�10�4
Sr2+ 0 8.4�10�6a 6.9�10�6a 4.9�10�6a 3.71�10�5a
Cl� 4.0�10�5F1�10�5
SO42� 1.1�10�4F1�10�5
Ionic strength 5.72�10�4
pH 6.4F0.2
Average concentrations and standard deviations were calculated from 180 samples analyzed by SAA.a Sr2+ results were calculated from only 19 samples, as the others were below the detectable level of
4.5�10�6 mol/L.
S. Szenknect et al. / Journal of Contaminant Hydrology 76 (2005) 139–165 143
but were disturbed by leaching of the waste contained in the trench. The composition of
the water in equilibrium with the eolian sand was determined experimentally. The
concentrations of major cations were close to those of the synthetic water. The first
conditioning stage of all column and reactor experiments was then reduced.
Synthetic groundwater was prepared by adding cations as sulfate salts to distilled,
deionized water, except for K, which was added as chloride, and Ca as carbonate. The pH
was adjusted to 6.4F0.2 by adding 0.1 N H2SO4. The theoretical concentrations were then
verified by chemical analysis with a capillary ion analyzer (Waters).
Known stable strontium concentration solutions were prepared by adding amounts of
strontium chloride salt to the previous synthetic groundwater. A wide range of
concentrations ranging from 10�3 to 10�9 mol/L was studied. For radiometric measure-
ments, spiked strontium solutions were also prepared using 85Sr as a radioactive tracer.
This isotope was chosen as a tracer because its good gamma-emission of 514 keV and
short radioactive half-life of 64.85 days lead to very low concentrations from 10�12 to
10�8 mol/L in solution.
2.3. Batch experiments
Batch tests were performed at room temperature (22F2 8C) in 16 mL polycarbonate
tubes. For all experiments, a solid/solution ratio of 1 g/mL (10 g soil/10 mL solution) was
used. The sand was added to the tubes and weighed to the nearest 0.01 g. The required
solutions were then added to each tube and brought into contact under mechanical
agitation in rototubes for 24 h. Kinetics experiments performed showed that solid/solution
equilibrium was reached within this time. Blank experiments with no solid did not reveal
any adsorption of chemical species and radioactive tracer on vials. Phase separation was
then carried out by temperature-controlled centrifugation at 22000�g for 15 min.
Supernatant was then transferred to each tube and the weight checked for subsequent
radiochemical analyses.
S. Szenknect et al. / Journal of Contaminant Hydrology 76 (2005) 139–165144
In order to obtain the strontium adsorption isotherm, the total concentration of
strontium adsorbed onto the solid and the remaining concentration in solution at
equilibrium must be calculated. These concentrations can be determined through the use of
the radioactive tracer. The concentrations were calculated as follows: the aqueous
strontium concentration was defined as the 85Sr activity remaining in the supernatant
divided by the initial activity, then multiplied by the initial total strontium concentration. It
was assumed that the loss in Sr amount was fixed to the solid and this was used to
calculate the adsorbed strontium concentration.
Strontium partitioning between the solid and liquid phase was defined and computed
from:
Sr½ �s ¼V
M
"Að85SrÞiAð85SrÞeq
� 1
#Sr½ �aq ð1Þ
where [Sr]s is the amount of total Sr sorbed by the soil (mol/kg), [Sr]aq is the total
strontium concentration in equilibrium solution (mol/L), A(85Sr)i is the initial volumetric
activity concentration in the solution (Bq/L), A(85Sr)eq is the remaining volumetric activity
concentration of the equilibrium solution (Bq/L), V is the volume of the solution (L) andM
is the mass of dry soil in suspension (kg).
2.4. Flow-through reactor experiments
Flow-through reactors were used to study mass transfer kinetics at the solid–liquid
interface (van Capellen and Qiu, 1997a,b; Martin-Garin et al., 2003). The flow rate can be
varied to see how solution residence time in the reactor affects the reaction rate and to
determine the characteristic time of solute sorption and desorption. Comparison of
characteristic times is a powerful method for isolating the predominant physical or
chemical processes involved in reactive solute transport (Sardin et al., 1991). Break-
through experiments were also performed in order to measure the sorption and desorption
isotherms of chemical species in the presence of a suspended solid (Grolimund et al.,
1995; Martin-Garin et al., 2003).
In a perfectly stirred flow-through reactor, the solution composition is homogeneous in
the reactor and equal to that measured in the outlet flow. The theoretical evolution over
time of the outlet concentration Caq (mol/L) of an inert species after a stepwise increase in
the input concentration from 0 to C0 is given by (Villermaux, 1985):
Caq tð Þ ¼ C0 1� exp � t
s
�� ihð2Þ
where s=Vr/Q (h) is the solution residence time in the reactor, Vr (mL) is the volume of
solution contained in the reactor, and Q (mL/h) is the flow rate. The theoretical evolution
over time of the outlet concentration Caq (mol/L) of an inert species after a stepwise
decrease in the input concentration from C0 to 0 is given by (Villermaux, 1985):
Caq tð Þ ¼ C0exp � t
s
��ð3Þ

S. Szenknect et al. / Journal of Contaminant Hydrology 76 (2005) 139–165 145
For a reactive species, the BTC deviates from that predicted by Eqs. (2) and (3). In the
case of Sr2+ uptake by suspended particles of sand, the amount of sorbed (respectively
desorbed) strontium is given by the difference in surface area between the inert tracer BTC
predicted by Eq. (2) (respectively Eq. (3)) and the Sr BTC (see Fig. 2). The reversibility of
the sorption reaction can be tested by calculating the strontium mass balance (the amount
of desorbed strontium divided by the amount of sorbed strontium).
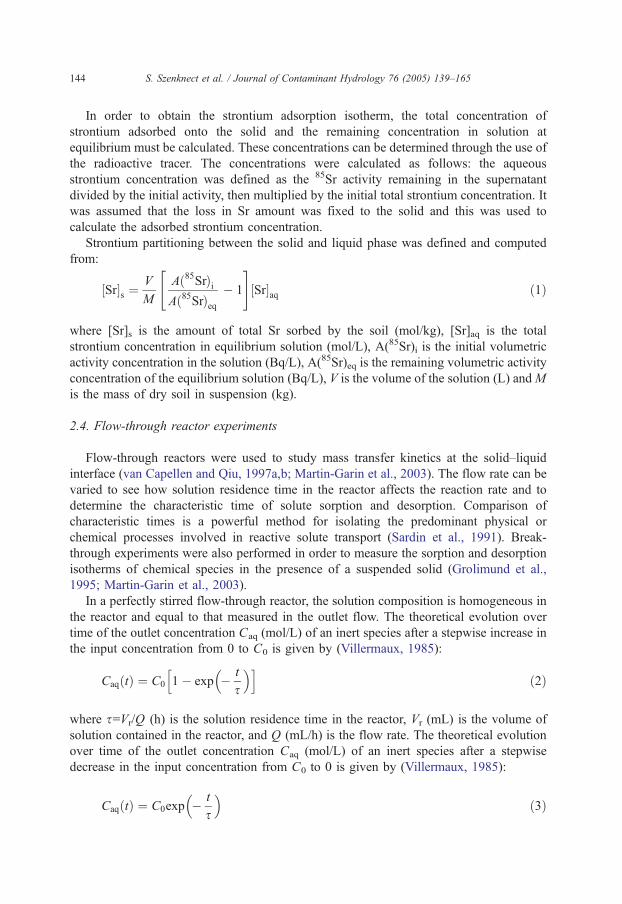
Fig. 3 represents the stirred flow-through reactor experimental setup. The flow-through
reactor had an internal volume (Vr) of 34F0.5 mL determined gravimetrically. A mass of 8
g of sand was added to the tared reactor and weighed to the nearest 0.01 g. The soil
suspension in the reactor was continuously stirred by the reactor rotation, thus avoiding the
need for a magnetic bar in the reactor. A constant flow rate was supplied by a mechanical
piston pump (Pharmacia P-500). Aqueous solution flowed into and out of the reactor
through 0.45-Am pore size hydrofoil Teflon membranes (HVLP, Millipore). The
experiments were carried out at 22F2 8C. Before each experiment, the reactor was
washed with 5% nitric acid solution, then rinsed with distilled, deionized water. The
outflow solutions were monitored on-line for pH, conductivity, and radionuclide activity.
A beta–gamma flow scintillation analyzer (Packard 500TR Series) was used for on-line
radiometric analysis of outflow solutions. The activity of prepared standards was measured
frequently so that corrections could be made for any instrument drift and radioactive
decay.
Reactor performance was improved by imposing a step change from synthetic
groundwater to tritiated synthetic groundwater (C0(3H)=370 kBq/L). The tritiated water
experiments were performed at 100 mL/h with and without sand, and Eqs. (2) and (3) were
used to describe the normalized BTC (Caq/C0(t)) of the tritiated water (inert tracer).
Strontium sorption experiments on Pripyat Zaton eolian sand were performed using
synthetic groundwater solutions in the following sequence. (Stage I) Synthetic ground-
water was pumped through the reactor until soil/Sr-free solution equilibrium was reached.
(Stage II) The input was switched to the solution containing Sr with an otherwise identical
composition to that of groundwater. Strontium initial concentrations in the feed solutions,
[Sr]0, ranged from 4.85�10�5 mol/L to �10�8 mol/L, initial activity of all the solutions
Fig. 2. Typical flow-through reactor BTCs of inert and reactive solutes, and expected results.
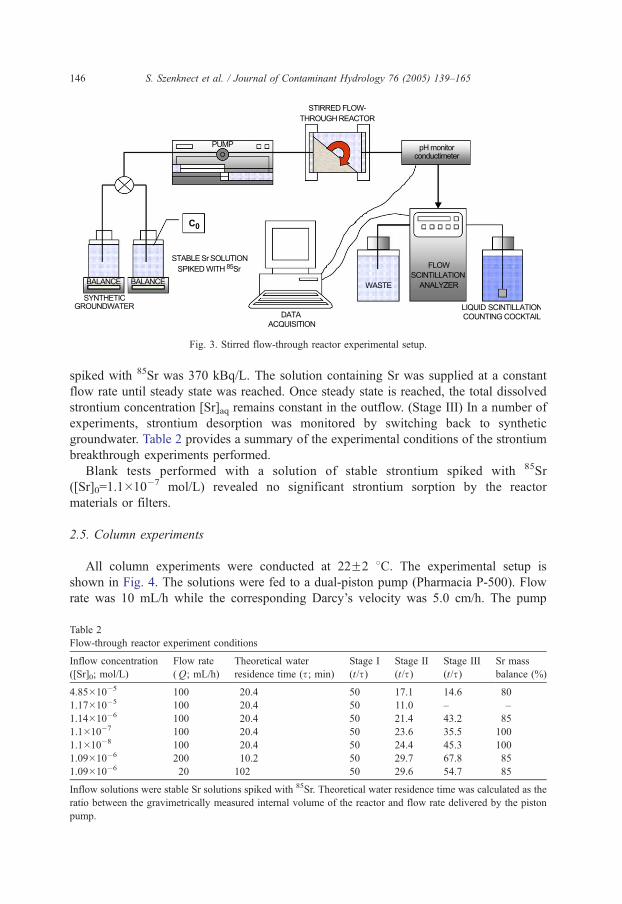
Fig. 3. Stirred flow-through reactor experimental setup.
S. Szenknect et al. / Journal of Contaminant Hydrology 76 (2005) 139–165146
spiked with 85Sr was 370 kBq/L. The solution containing Sr was supplied at a constant
flow rate until steady state was reached. Once steady state is reached, the total dissolved
strontium concentration [Sr]aq remains constant in the outflow. (Stage III) In a number of
experiments, strontium desorption was monitored by switching back to synthetic
groundwater. Table 2 provides a summary of the experimental conditions of the strontium
breakthrough experiments performed.
Blank tests performed with a solution of stable strontium spiked with 85Sr
([Sr]0=1.1�10�7 mol/L) revealed no significant strontium sorption by the reactor
materials or filters.
2.5. Column experiments
All column experiments were conducted at 22F2 8C. The experimental setup is
shown in Fig. 4. The solutions were fed to a dual-piston pump (Pharmacia P-500). Flow
rate was 10 mL/h while the corresponding Darcy’s velocity was 5.0 cm/h. The pump
Table 2
Flow-through reactor experiment conditions
Inflow concentration
([Sr]0; mol/L)
Flow rate
(Q; mL/h)
Theoretical water
residence time (s; min)
Stage I
(t/s)Stage II
(t/s)Stage III
(t/s)Sr mass
balance (%)
4.85�10�5 100 20.4 50 17.1 14.6 80
1.17�10�5 100 20.4 50 11.0 – –
1.14�10�6 100 20.4 50 21.4 43.2 85
1.1�10�7 100 20.4 50 23.6 35.5 100
1.1�10�8 100 20.4 50 24.4 45.3 100
1.09�10�6 200 10.2 50 29.7 67.8 85
1.09�10�6 20 102 50 29.6 54.7 85
Inflow solutions were stable Sr solutions spiked with 85Sr. Theoretical water residence time was calculated as the
ratio between the gravimetrically measured internal volume of the reactor and flow rate delivered by the piston
pump.
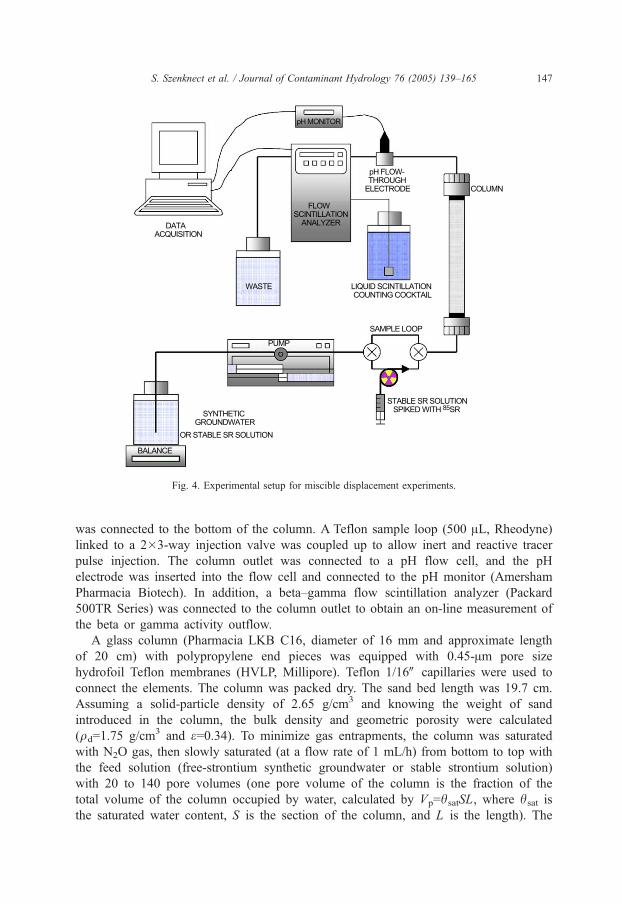
Fig. 4. Experimental setup for miscible displacement experiments.
S. Szenknect et al. / Journal of Contaminant Hydrology 76 (2005) 139–165 147
was connected to the bottom of the column. A Teflon sample loop (500 AL, Rheodyne)linked to a 2�3-way injection valve was coupled up to allow inert and reactive tracer
pulse injection. The column outlet was connected to a pH flow cell, and the pH
electrode was inserted into the flow cell and connected to the pH monitor (Amersham
Pharmacia Biotech). In addition, a beta–gamma flow scintillation analyzer (Packard
500TR Series) was connected to the column outlet to obtain an on-line measurement of
the beta or gamma activity outflow.
A glass column (Pharmacia LKB C16, diameter of 16 mm and approximate length
of 20 cm) with polypropylene end pieces was equipped with 0.45-Am pore size
hydrofoil Teflon membranes (HVLP, Millipore). Teflon 1/16W capillaries were used to
connect the elements. The column was packed dry. The sand bed length was 19.7 cm.
Assuming a solid-particle density of 2.65 g/cm3 and knowing the weight of sand
introduced in the column, the bulk density and geometric porosity were calculated
(qd=1.75 g/cm3 and e=0.34). To minimize gas entrapments, the column was saturated
with N2O gas, then slowly saturated (at a flow rate of 1 mL/h) from bottom to top with
the feed solution (free-strontium synthetic groundwater or stable strontium solution)
with 20 to 140 pore volumes (one pore volume of the column is the fraction of the
total volume of the column occupied by water, calculated by Vp=hsatSL, where hsat isthe saturated water content, S is the section of the column, and L is the length). The
S. Szenknect et al. / Journal of Contaminant Hydrology 76 (2005) 139–165148
aim of this first stage was to equilibrate the porous medium with the tracer-free
solutions. The pulse of tracer-spiked solution composed of identical major ions
composition was then injected by switching the injection valve. The pulse was then
displaced by the tracer-free solution. BTCs were determined for the nonreactive tracer
prior to the strontium experiments. Tritiated synthetic groundwater was used as an inert
tracer-spiked solution. The initial activity of tritiated synthetic groundwater was 370
kBq/L. Several inert tracer BTCs were performed during the miscible displacement
experiments to ensure that sand-packed column transport properties did not change over
time.
Breakthrough curves of the conservative tracer were analyzed using the
TableCurveR2D 4.0 (User’s manual, SPSS) computer code that uses the analytical
solution of the advection–dispersion equation for a Dirac input function (Wen and
Fan, 1975). TableCurve uses the Levenburg–Marquardt algorithm for fitting its
nonlinear equations and user-defined functions. Eq. (4) is the advection–dispersion
equation:
BCaq
Bt¼ � v
BCaq
Bzþ D
B2Caq
Bz2ð4Þ
where Caq (mol/L) is the concentration of conservative (or inert) solute in the outflow.
This made it possible to estimate parameter values of the hydrodynamic dispersion
coefficient D (m2/s, D=av+De, where De is the effective diffusion coefficient (m2/s) and ais the dispersivity (m)) and the pore water flow velocity, v (m/s). The water residence time
in the column, Ts is calculated as the ratio between the length of the column and the pore
water flow velocity (Ts=L/v).
For the reactive tracer experiments, different equilibrating solutions were prepared
by adding stable Sr as chloride salt to the synthetic groundwater. The concentration of
stable strontium in equilibrating solutions was V10�5 mol/L. 85Sr was added to the
equilibrating solution to prepare the pulse solution and 85Sr BTCs were monitored at
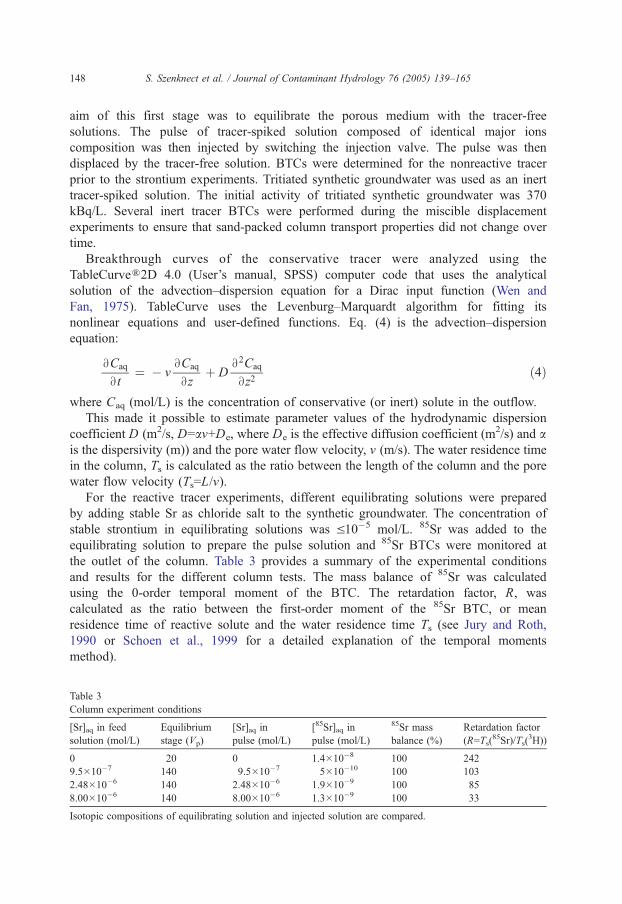
the outlet of the column. Table 3 provides a summary of the experimental conditions
and results for the different column tests. The mass balance of 85Sr was calculated
using the 0-order temporal moment of the BTC. The retardation factor, R, was
calculated as the ratio between the first-order moment of the 85Sr BTC, or mean
residence time of reactive solute and the water residence time Ts (see Jury and Roth,
1990 or Schoen et al., 1999 for a detailed explanation of the temporal moments
method).
Table 3
Column experiment conditions
[Sr]aq in feed
solution (mol/L)
Equilibrium
stage (Vp)
[Sr]aq in
pulse (mol/L)
[85Sr]aq in
pulse (mol/L)
85Sr mass
balance (%)
Retardation factor
(R=Ts(85Sr)/Ts(
3H))
0 20 0 1.4�10�8 100 242
9.5�10�7 140 9.5�10�7 5�10�10 100 103
2.48�10�6 140 2.48�10�6 1.9�10�9 100 85
8.00�10�6 140 8.00�10�6 1.3�10�9 100 33
Isotopic compositions of equilibrating solution and injected solution are compared.

S. Szenknect et al. / Journal of Contaminant Hydrology 76 (2005) 139–165 149
2.6. Data analysis and modeling
2.6.1. Interaction mechanism
Strontium in solution is assumed to be present mainly in the form of an uncomplexed
Sr2+ ion. Only in highly alkaline soils could strontianite (SrCO3) control strontium
concentration in solutions. The extent to which strontium partitions from the aqueous
phase to the solid phase is assumed to be controlled primarily by the CEC of the solid
phase and ionic strength of the soil solution (Koss and Kim, 1990; Ohnuki, 1994). It has
also been reported that most of the Sr2+ in solution is reversibly sorbed onto soil (Jackson
and Inch, 1983). These findings are consistent with the cation exchange proposed as the
mechanism generally controlling strontium adsorption (Keren and O’Connor, 1983;
Lefevre et al., 1993a,b). In media, where pH is greater than 9 and where carbonates
predominate, coprecipitation with CaCO3 and precipitation as SrCO3 may become an
increasingly significant mechanism in controlling strontium removal from solution
(Lefevre et al., 1993a,b). A negative correlation between solution pH and amount of
Sr2+ sorbed has been reported (Prout, 1958; Keren and O’Connor, 1983; Koss and Kim,
1990). This trend is probably due to protons competing with Sr2+ for exchange sites and to
the result of pH increasing the CEC. It has been reported that Ca2+ exerts a specific
depressing effect on Sr2+ adsorption. It is true that calcium is found in groundwater at
concentrations typically 2 orders of magnitude greater than stable strontium and 12 orders
of magnitude greater than radioactive strontium. Moreover, the valence state, the radius of
hydrated Ca2+, and the free energy of hydration of suggest that Ca2+ has a greater capacity
for displacing strontium from an exchange site than other more common groundwater
cations (Kinniburgh et al., 1975). Competition between Sr2+ and Ca2+ for site accessibility
is taken into account in strontium interaction modeling through the selectivity coefficient
KSr/Ca. As calcium and strontium are similar cations, KSr/Ca can be expected to be
approximately one (Bolt and Bruggenwert, 1978).
The main reactions and processes involved in the laboratory experiments were
simulated using the PHREEQC (Version 2) computer program for speciation, batch-
reaction and one-dimensional transport. The PHREEQC code has been successfully
applied in various geochemical modeling studies (Appelo et al., 1998; van Breukelen et
al., 1998; Prommer et al., 1999; Hormann and Kirchner, 2002). A full description of its
mathematical background can be found in the program manual (Parkhurst and Appelo,
1999).
PHREEQC solves the set of balance equations for the chemical reactions:
n Precipitation–dissolution of: SrCO3(s), SrSO4(s), SrCl2(s),
n Complexation/dissociation of: SrCl+, SrCl2, SrOH+, SrCO3, SrHCO3
+, SrSO4.
Ion exchange equilibria are calculated by PHREEQC using the Gaines and Thomas
convention. For a binary reaction involving two cations, Aa+ and Bb+, competing for a soil
exchanger X,
ð5Þ

S. Szenknect et al. / Journal of Contaminant Hydrology 76 (2005) 139–165150
the selectivity coefficient KA/B of Aa+ for Bb+ exchange is (according to the Gaines–
Thomas convention):
ð6Þ
where square brackets denote thermodynamic activities in solution and parentheses denote
the equivalent cation of exchangeable fraction on the exchanger. It is assumed that the
exchange complex is always fully occupied by cations.
In PHREEQC, all cation exchange reactions are related to Na+, which has been chosen
as the reference cation. For example, the reaction given by Eq. (5) is split into two half-
reactions as:
ð7Þ
ð8Þ
The selectivity coefficient KA/B is then calculated as:
KA=B ¼ KA=Na=KB=Na ð9Þ
For most of the chemical processes taken into account in the calculations, the
thermodynamic constants given in the PHREEQC database were used. The selectivity
coefficient with respect to Na+ of the major cations, K+, Mg2+, Ca2+, provided by the
PHREEQC database were derived from the compilation made by Bruggenwert and
Kamphorst (1982). The selectivity coefficient of Sr2+ with respect to Na+ was determined
on the basis of the results of this study.
The experiments in this study were modeled by adding a new species to the PHREEQC
database in order to distinguish 85Sr, the radioactive isotope of strontium. It was assumed
that 85Sr had the same chemical characteristics as stable strontium, meaning that it was
involved in the same chemical reactions defined with the same thermodynamic constants
as stable strontium. Competition between 85Sr2+ and stable Sr2+ was allowed assuming
that K85Sr/Sr=1.
2.6.2. Reactive transport model
PHREEQC is capable of modeling a one-dimensional, advection–dispersion transport
process. This process can be combined with equilibrium and kinetic chemical reactions.
Conservation of mass for a transported chemical yields the following advection–reaction–
dispersion equation:
B Sr½ �aqBt
¼ � vB Sr½ �aqBz
þ DB2 Sr½ �aqBz2
� Bq
Btð10Þ
where [Sr]aq is the total concentration of strontium in solution (mol/L), t is time (s), v is
pore water flow velocity (m/s), z is distance (m), D is the hydrodynamic dispersion
coefficient (m2/s), and q is the concentration of strontium sorbed onto the soil (mol/L)

S. Szenknect et al. / Journal of Contaminant Hydrology 76 (2005) 139–165 151
expressed in the same units as [Sr]aq in PHREEQC. In fact, q is calculated as qd/e.[Sr]swhere [Sr]s (mol/kg) is the amount of strontium sorbed per mass of soil. The term Bq/Bt is
the change in concentration in the solid phase due to the reactions mentioned in the
previous section. For a conservative solute, this term is equal to 0 (see Eq. (4)).
The boundary conditions appropriate for laboratory column and reactor experiments
with inlet tubing much smaller than inlet cross-section, are flux conditions defined at z=0 as:
Sr½ �aq 0; tð Þ ¼ Sr½ �0 þ aB Sr½ �aq 0;tð Þ
Bzð11Þ
The initial conditions depend on the experimental methodology. The initial distribution
of stable strontium sorbed onto the sand was particularly important and the bhistoryQ of thesand bed prior to the tracer injection had to be simulated accurately.
The transport parameters fitted with TableCurve to the BTC of the conservative tracer
were used in the PHREEQC input file to simulate the transport of reactive solutes. At this
stage, the only parameters fitted were the exchange capacity (in mol/L) and the selectivity
coefficient of strontium with respect to Na+. These two parameters were determined based
on the stirred flow-through reactor study, and the validity of the model was then tested in
batches under static conditions and in a structured sand column under dynamic conditions.
3. Results
3.1. Batch studies
bDirectQ batch experiments were performed for the sand/synthetic water system and the
resulting strontium sorption isotherms are shown in Fig. 5. For low stable strontium
concentrations at equilibrium ([Sr]aqb10�6 mol/L), the isotherm is linear and the
corresponding distribution coefficient (Kd) value obtained is 13.5 mL/g. For higher
strontium concentrations, strong nonlinear behavior is observed, and the sorption
coefficient decreases as the strontium concentration increases. This effect is probably
due to the well-known competition effect (Hilton et al., 1997) between Sr2+ and major
Fig. 5. Strontium sorption isotherms on the eolian sand and related fitted curves using the Langmuir model (odirect batch experiments and 5 five washing steps).
S. Szenknect et al. / Journal of Contaminant Hydrology 76 (2005) 139–165152
dissolved cations (Ca2+, Mg2+). A Langmuir model described the previous isotherms quite
well:
Sr½ �s ¼KSmax
1þ K Sr½ �aqSr½ �aq ð12Þ
where Smax is the sorption capacity of the soil (mol/kg) and K (L/mol) is the Langmuir
constant. The parameter values fitted to the bdirectQ batch experiment isotherm are
9.2�10�4 mol/kg for Smax and 1.45�104 L/mol for K.
As the stable Sr2+ concentration is one of the main factors controlling sorption of the
radioactive strontium tracer, and nonlinear behavior begins at quite low Sr2+ concen-
trations, the initial presence of strontium in the studied sand was checked by bringing the
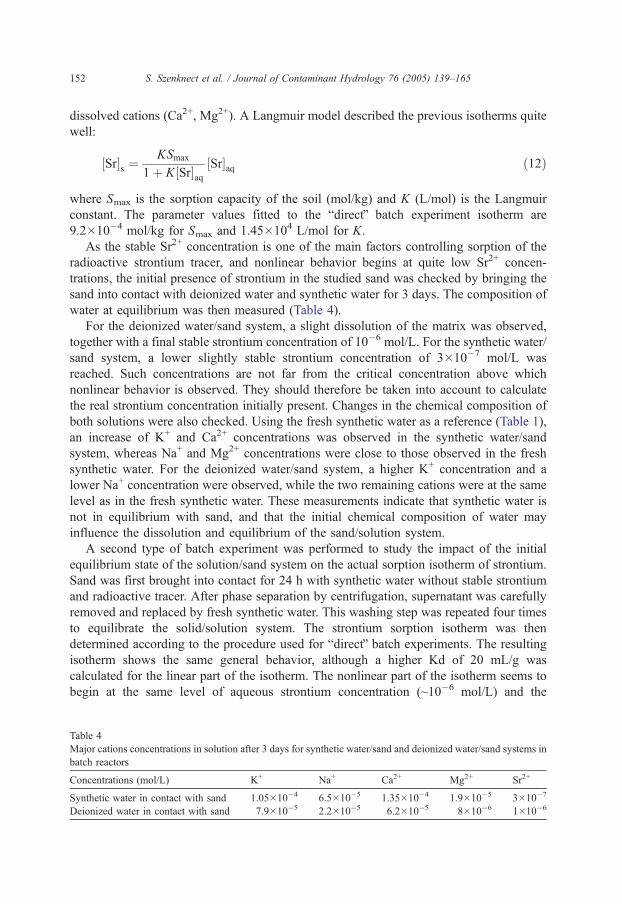
sand into contact with deionized water and synthetic water for 3 days. The composition of
water at equilibrium was then measured (Table 4).
For the deionized water/sand system, a slight dissolution of the matrix was observed,
together with a final stable strontium concentration of 10�6 mol/L. For the synthetic water/
sand system, a lower slightly stable strontium concentration of 3�10�7 mol/L was
reached. Such concentrations are not far from the critical concentration above which
nonlinear behavior is observed. They should therefore be taken into account to calculate
the real strontium concentration initially present. Changes in the chemical composition of
both solutions were also checked. Using the fresh synthetic water as a reference (Table 1),
an increase of K+ and Ca2+ concentrations was observed in the synthetic water/sand
system, whereas Na+ and Mg2+ concentrations were close to those observed in the fresh
synthetic water. For the deionized water/sand system, a higher K+ concentration and a
lower Na+ concentration were observed, while the two remaining cations were at the same
level as in the fresh synthetic water. These measurements indicate that synthetic water is
not in equilibrium with sand, and that the initial chemical composition of water may
influence the dissolution and equilibrium of the sand/solution system.
A second type of batch experiment was performed to study the impact of the initial
equilibrium state of the solution/sand system on the actual sorption isotherm of strontium.
Sand was first brought into contact for 24 h with synthetic water without stable strontium
and radioactive tracer. After phase separation by centrifugation, supernatant was carefully
removed and replaced by fresh synthetic water. This washing step was repeated four times
to equilibrate the solid/solution system. The strontium sorption isotherm was then
determined according to the procedure used for bdirectQ batch experiments. The resulting
isotherm shows the same general behavior, although a higher Kd of 20 mL/g was
calculated for the linear part of the isotherm. The nonlinear part of the isotherm seems to
begin at the same level of aqueous strontium concentration (~10�6 mol/L) and the
Table 4
Major cations concentrations in solution after 3 days for synthetic water/sand and deionized water/sand systems in
batch reactors
Concentrations (mol/L) K+ Na+ Ca2+ Mg2+ Sr2+
Synthetic water in contact with sand 1.05�10�4 6.5�10�5 1.35�10�4 1.9�10�5 3�10�7
Deionized water in contact with sand 7.9�10�5 2.2�10�5 6.2�10�5 8�10�6 1�10�6
S. Szenknect et al. / Journal of Contaminant Hydrology 76 (2005) 139–165 153
saturation level seems somewhat lower than the previous value obtained with bdirectQbatch experiments. A Langmuir model described the previous isotherm quite well with
associated parameter values of 4.3�10�4 mol/kg for Smax and 4.73�104 L/mol for K.
Chemical analyses show clearly that synthetic water is not in equilibrium with sand
during initial contact. However, Na+ and Mg2+ concentrations seem to reach steady state
after the five conditioning steps. A slight increase in K+ concentrations with conditioning
seems to occur. The same is true for Ca2+ after a slight decrease observed during the first
three washing steps. Global concentrations of competing cations (Ca2+, Mg2+) are lower
than those measured in bdirectQ batch experiments, thus leading to an increasing Kd in the
linear part of the isotherm in accordance with the cation exchange process. For the
nonlinear part of the isotherm, an increase in concentration of the two main competing
cations (Ca2+, Mg2+) are observed, this release being due to a competition effect caused by
high stable strontium concentration. This general behavior is in good agreement with the
theory of ion exchange which is assumed to control strontium sorption onto the studied
sand.
These batch experiments indicated that Kd determination might be affected in the event
of solid/solution disequilibria and the presence of significant amounts of stable strontium.
3.2. Stirred flow-through reactor studies
3.2.1. BTCs of conservative tracer
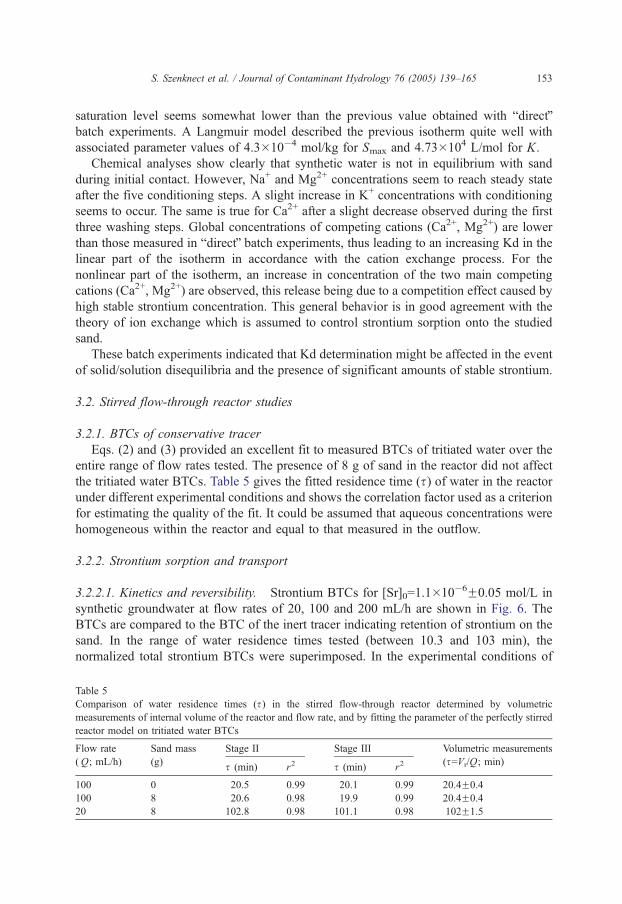
Eqs. (2) and (3) provided an excellent fit to measured BTCs of tritiated water over the
entire range of flow rates tested. The presence of 8 g of sand in the reactor did not affect
the tritiated water BTCs. Table 5 gives the fitted residence time (s) of water in the reactor
under different experimental conditions and shows the correlation factor used as a criterion
for estimating the quality of the fit. It could be assumed that aqueous concentrations were
homogeneous within the reactor and equal to that measured in the outflow.
3.2.2. Strontium sorption and transport
3.2.2.1. Kinetics and reversibility. Strontium BTCs for [Sr]0=1.1�10�6F0.05 mol/L in
synthetic groundwater at flow rates of 20, 100 and 200 mL/h are shown in Fig. 6. The
BTCs are compared to the BTC of the inert tracer indicating retention of strontium on the
sand. In the range of water residence times tested (between 10.3 and 103 min), the
normalized total strontium BTCs were superimposed. In the experimental conditions of
Table 5
Comparison of water residence times (s) in the stirred flow-through reactor determined by volumetric
measurements of internal volume of the reactor and flow rate, and by fitting the parameter of the perfectly stirred
reactor model on tritiated water BTCs
Flow rate
(Q; mL/h)
Sand mass
(g)
Stage II Stage III Volumetric measurements
(s=Vr/Q; min)s (min) r2 s (min) r2
100 0 20.5 0.99 20.1 0.99 20.4F0.4
100 8 20.6 0.98 19.9 0.99 20.4F0.4
20 8 102.8 0.98 101.1 0.98 102F1.5

Fig. 6. Flow-through reactor BTCs of Sr for different flow rates (20 (5), 100 (x) and 200 (.) mL/h) compared to
the BTC of the inert tracer (—). In this nondimensional representation (normalized strontium concentration as a
function of normalized time), the BTCs of a nonreactive tracer are superimposed whatever the flow rate. [Sr]0 was
1.1 10�6 mol/L for all three experiments. (a) Stage II. (b) Stage III.
S. Szenknect et al. / Journal of Contaminant Hydrology 76 (2005) 139–165154
interest here, flow rate had no effect on the total strontium BTC. In other words, the
characteristic time of the sorption mechanism observed under these experimental
conditions is at least one order of magnitude less than 10.3 min, the shortest residence
time tested for water in the reactor.
This upper value for characteristic fast sorption time must be borne in mind to
determine the conditions under which kinetic treatment of sorption reaction is required to
describe our column experiments. The Damkhfler number Dk (Saiers and Hornberger,
1996) can be calculated to check whether kinetics during the column experiment or natural
groundwater flow rates are important. This dimensionless number relates the advection
time scale to the kinetic adsorption time scale:
Dk ¼Ts
Tasð13Þ
where Tas is the characteristic kinetic adsorption time. Jennings and Kirchner, (1984)
reported that adsorption equilibrium could be assumed if DkN100. As the order of
magnitude of Tas is 1 min, the characteristic advection time for the displacement

S. Szenknect et al. / Journal of Contaminant Hydrology 76 (2005) 139–165 155
experiments must be approximately 100 mn for local equilibrium to be assumed. This
analysis also indicates that the equilibrium approach may suffice on the field scale.
Another important result is that the strontium concentration in the outflow was within a
few percent of the input concentration during stage II, even for the lowest flow rate and
when the solution remained in contact with the sand for a long period (103 mn). Under
these experimental conditions, there was no evidence of a bslowQ sorption mechanism
implying a continuous removal of dissolved strontium in the reactor.
The BTCs of strontium relating to the decreasing step could also be superimposed
regardless of the flow rate between 20 and 200 mL/h. The quantity of sorbed strontium
released during stage III was estimated and compared to the quantity sorbed during stage
II. Results of desorption experiments showed that strontium removed from the solution by
sorption was mostly reversibly bound to sand particles, with 80% to 100% of sorbed
strontium recovered at the end of stage III depending on the length of the desorption stage
(Table 2).
The amount of strontium released per reactor volume of synthetic water during stage III
was also independent of the flow rate under the experimental conditions of this study. In
the range of water residence times tested (10.3 to 103 mn), the desorption rate was slightly
lower than the sorption rate (the maximum desorption rate was 75F5% of the maximum
sorption rate). Fig. 7 shows the evolution of sorption and desorption rates expressed as the
amount in mol of strontium instantaneously removed from (stage II) or added to (stage III)
the aqueous solution. However, this observation is consistent with the reversible and
instantaneous cation exchange mechanism if the affinity of soil for Sr2+ is greater than for
other major cations in solution. Further modeling (see Section 3.2.3) confirms this
assumption.
3.2.2.2. Nonlinearity of sorption isotherm. Fig. 8 represents the evolution of the
normalized, total aqueous strontium concentration in the outflow as a function of the
normalized time t/s. BTCs were plotted at the same flow rate (100 mL/h), but with the
Fig. 7. Instantaneous Sr sorption rate (negative values) and desorption rate (positive values) calculated from the
results of the stirred flow-through experiments at different flow rates and [Sr]0=1.1 10�6 mol/L (see Fig. 6). Rates
are expressed as the amount of aqueous strontium removed from (sorption stage) or added to (desorption stage)
the solution for a given number of reactor volumes passing through the reactor.
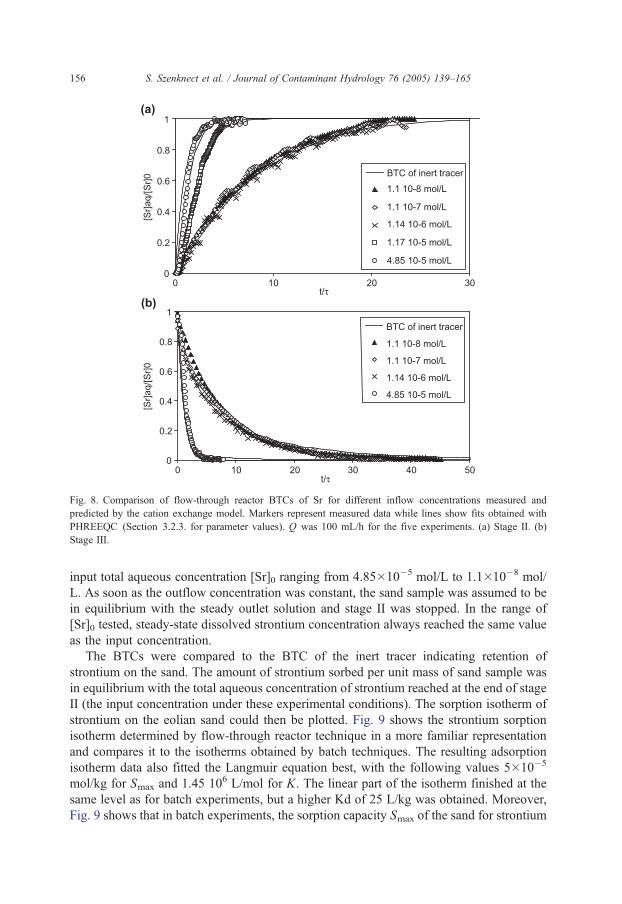
Fig. 8. Comparison of flow-through reactor BTCs of Sr for different inflow concentrations measured and
predicted by the cation exchange model. Markers represent measured data while lines show fits obtained with
PHREEQC (Section 3.2.3. for parameter values). Q was 100 mL/h for the five experiments. (a) Stage II. (b)
Stage III.
S. Szenknect et al. / Journal of Contaminant Hydrology 76 (2005) 139–165156
input total aqueous concentration [Sr]0 ranging from 4.85�10�5 mol/L to 1.1�10�8 mol/
L. As soon as the outflow concentration was constant, the sand sample was assumed to be
in equilibrium with the steady outlet solution and stage II was stopped. In the range of
[Sr]0 tested, steady-state dissolved strontium concentration always reached the same value
as the input concentration.
The BTCs were compared to the BTC of the inert tracer indicating retention of
strontium on the sand. The amount of strontium sorbed per unit mass of sand sample was
in equilibrium with the total aqueous concentration of strontium reached at the end of stage
II (the input concentration under these experimental conditions). The sorption isotherm of
strontium on the eolian sand could then be plotted. Fig. 9 shows the strontium sorption
isotherm determined by flow-through reactor technique in a more familiar representation
and compares it to the isotherms obtained by batch techniques. The resulting adsorption
isotherm data also fitted the Langmuir equation best, with the following values 5�10�5
mol/kg for Smax and 1.45 106 L/mol for K. The linear part of the isotherm finished at the
same level as for batch experiments, but a higher Kd of 25 L/kg was obtained. Moreover,
Fig. 9 shows that in batch experiments, the sorption capacity Smax of the sand for strontium
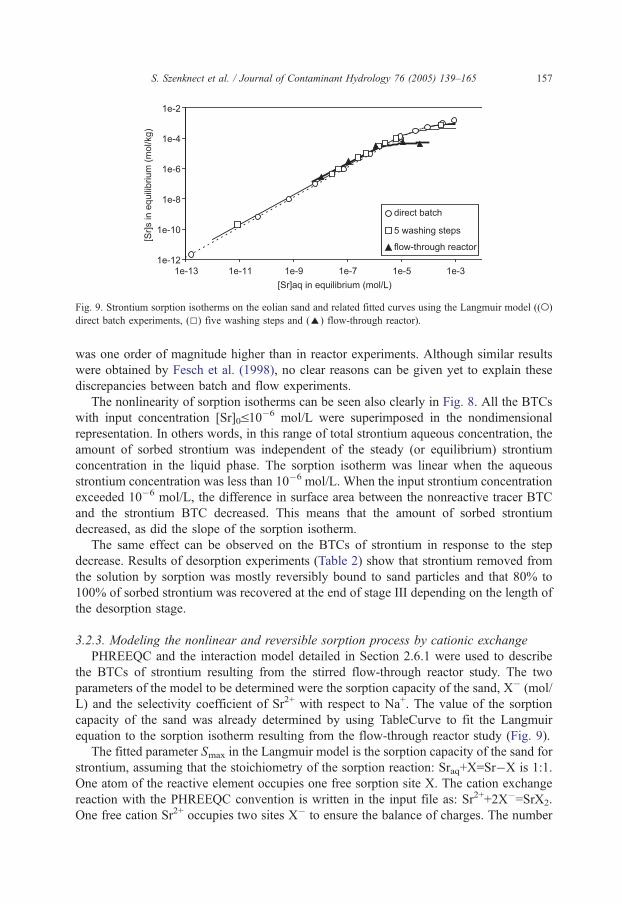
Fig. 9. Strontium sorption isotherms on the eolian sand and related fitted curves using the Langmuir model ((o)
direct batch experiments, (5) five washing steps and (E) flow-through reactor).
S. Szenknect et al. / Journal of Contaminant Hydrology 76 (2005) 139–165 157
was one order of magnitude higher than in reactor experiments. Although similar results
were obtained by Fesch et al. (1998), no clear reasons can be given yet to explain these
discrepancies between batch and flow experiments.
The nonlinearity of sorption isotherms can be seen also clearly in Fig. 8. All the BTCs
with input concentration [Sr]0V10�6 mol/L were superimposed in the nondimensional
representation. In others words, in this range of total strontium aqueous concentration, the
amount of sorbed strontium was independent of the steady (or equilibrium) strontium
concentration in the liquid phase. The sorption isotherm was linear when the aqueous
strontium concentration was less than 10�6 mol/L. When the input strontium concentration
exceeded 10�6 mol/L, the difference in surface area between the nonreactive tracer BTC
and the strontium BTC decreased. This means that the amount of sorbed strontium
decreased, as did the slope of the sorption isotherm.
The same effect can be observed on the BTCs of strontium in response to the step
decrease. Results of desorption experiments (Table 2) show that strontium removed from
the solution by sorption was mostly reversibly bound to sand particles and that 80% to
100% of sorbed strontium was recovered at the end of stage III depending on the length of
the desorption stage.
3.2.3. Modeling the nonlinear and reversible sorption process by cationic exchange
PHREEQC and the interaction model detailed in Section 2.6.1 were used to describe
the BTCs of strontium resulting from the stirred flow-through reactor study. The two
parameters of the model to be determined were the sorption capacity of the sand, X� (mol/
L) and the selectivity coefficient of Sr2+ with respect to Na+. The value of the sorption
capacity of the sand was already determined by using TableCurve to fit the Langmuir
equation to the sorption isotherm resulting from the flow-through reactor study (Fig. 9).
The fitted parameter Smax in the Langmuir model is the sorption capacity of the sand for
strontium, assuming that the stoichiometry of the sorption reaction: Sraq+X=Sr�X is 1:1.
One atom of the reactive element occupies one free sorption site X. The cation exchange
reaction with the PHREEQC convention is written in the input file as: Sr2++2X�=SrX2.
One free cation Sr2+ occupies two sites X� to ensure the balance of charges. The number
S. Szenknect et al. / Journal of Contaminant Hydrology 76 (2005) 139–165158
of exchange sites X� accessible for Sr2+ defined in the PHREEQC input file must be the
Smax parameter of the Langmuir equation multiplied by 2 (the valence of the exchangeable
cation) and converted to mol/L. As the mass of the sand sample (M) was 8 g and the
volume of the solution (Vr) was 34 mL, this leads to the value: X� ¼ 2 MVr5� 10�5 ¼
2:35� 10�5 mol=L: Fig. 8 shows the results of fitting the selectivity coefficient of Sr2+
with respect to Na+ to the Stage II results with PHREEQC. The value of the fitted
parameter was: log KSr/Na=2.6.
The same model is used to describe the results obtained during stage III (Fig. 8). The
partial irreversibility observed depends on the relative affinity of the soil surface for the
cation in the inflow solution.
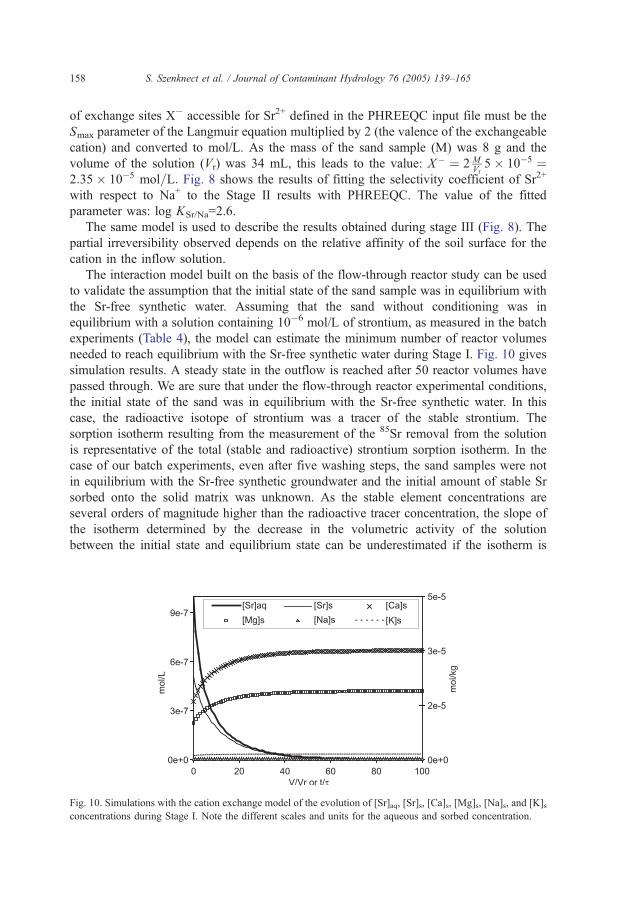
The interaction model built on the basis of the flow-through reactor study can be used
to validate the assumption that the initial state of the sand sample was in equilibrium with
the Sr-free synthetic water. Assuming that the sand without conditioning was in
equilibrium with a solution containing 10�6 mol/L of strontium, as measured in the batch
experiments (Table 4), the model can estimate the minimum number of reactor volumes
needed to reach equilibrium with the Sr-free synthetic water during Stage I. Fig. 10 gives
simulation results. A steady state in the outflow is reached after 50 reactor volumes have
passed through. We are sure that under the flow-through reactor experimental conditions,
the initial state of the sand was in equilibrium with the Sr-free synthetic water. In this
case, the radioactive isotope of strontium was a tracer of the stable strontium. The
sorption isotherm resulting from the measurement of the 85Sr removal from the solution
is representative of the total (stable and radioactive) strontium sorption isotherm. In the
case of our batch experiments, even after five washing steps, the sand samples were not
in equilibrium with the Sr-free synthetic groundwater and the initial amount of stable Sr
sorbed onto the solid matrix was unknown. As the stable element concentrations are
several orders of magnitude higher than the radioactive tracer concentration, the slope of
the isotherm determined by the decrease in the volumetric activity of the solution
between the initial state and equilibrium state can be underestimated if the isotherm is
Fig. 10. Simulations with the cation exchange model of the evolution of [Sr]aq, [Sr]s, [Ca]s, [Mg]s, [Na]s, and [K]sconcentrations during Stage I. Note the different scales and units for the aqueous and sorbed concentration.

S. Szenknect et al. / Journal of Contaminant Hydrology 76 (2005) 139–165 159
nonlinear. This phenomenon could explain the discrepancies observed between the Sr
sorption isotherms obtained using the batch technique and the flow-through reactor
technique, in particular, why the slope of the batch isotherm is smaller than that of the
reactor isotherm for trace concentrations of total Sr.
This is the typical case on the Pilot Site. Analysis of the natural groundwater
composition (Table 2) revealed that the average stable strontium concentration is
8.43�10�6 mol/L. This value is above the linearity limit of the real sorption isotherm
of strontium (10�6 mol/L). According to the results of this study, the distance covered by
the 90Sr released from the trench since 1986 (10 m) can be explained by the nonlinearity of
the Sr sorption isotherm.
3.3. Column studies
3.3.1. BTCs of inert tracer and hydrodynamic properties of the column
The hydrodynamic properties of the column packed with Pripyat eolian sand were
inferred from the BTC of the nonreactive tracer: tritiated water. Typical normalized BTCs
of tritium are included in Fig. 11. The BTCs measured at the beginning and at the end of
the series of miscible displacement experiments were equal. After more than 5 months of
operation and more than 1000 pore volumes of leaching, no change was observed in the
hydrodynamic characteristics of the sand-packed column.
The BTCs were highly symmetric in shape. The data is well described by the
one-dimensional advection–dispersion equation or AD model (Eq. (4)). The fitted
value hydrodynamic dispersion coefficient is 0.56 cm2/h. The hydraulic dispersivity of the
sand-packed column (a=400 Am) is comparable to the grain size of the column matrix
(d50=225 Am). The fitted value of pore water velocity is 14.03 cm/h, the corresponding
value of the Peclet number, Pe=vL/D was 493 and the water residence time in the column
was 1.4 h.
Fig. 11. Column BTCs of the inert tracer (tritiated water) at the start (R ; 07/2002) and end of the miscible
displacement experiments (+; 11/2002). Markers represent measured data and continuous lines show the
convolution product of the analytical solution of the advection–dispersion equation (—) in response to a Dirac
input function with the measured input function (- - -).

S. Szenknect et al. / Journal of Contaminant Hydrology 76 (2005) 139–165160
From these observations, and the good agreement between the measured and predicted
BTCs, it was concluded that uncertainty in physical transport parameters would not
seriously complicate interpretations of reactive solute transport data.
3.3.2. Sorption and transport of reactive tracer
Table 3 gives the characteristics of the 85Sr miscible displacement experiments
performed in the sand packed column. Fig. 12 shows the 85Sr breakthrough curves
measured at four different stable strontium concentrations in the equilibrating solutions:
Sr-free synthetic groundwater, synthetic groundwater with 9.5�10�7, 2.5�10�6 and
8�10�6 mol/L of stable Sr. The curves are plotted as 85Sr aqueous concentration vs.
dimensionless time, represented as the number of pore volumes that has passed through
the column. The difference in surface area under the curves is due to the difference in
initial 85Sr volumetric activity in the injected pulse. The surface area under the BTC (or
zero order moment) is related to the amount of 85Sr released from the column. For all
experiments, the restitution level of 85Sr reached 100%.
The 85Sr retardation factor (Table 3) decreases as the stable strontium concentration
in the equilibrating solution increases. This is clearly an effect of the nonlinearity of
the Sr sorption isotherm. The 85Sr BTCs were symmetrical despite the nonlinearity of
the total Sr sorption isotherm because the 85Sr aqueous concentration was several
orders of magnitude lower than the stable Sr concentration and it induced only
negligible variations in total Sr concentration. Therefore, the portion of total strontium
sorption isotherm described is very small, and the slope does not change during the
experiments.
From these observations, it was assumed that the 85Sr sorption mechanism was fully
reversible under these experimental conditions and the total Sr sorption isotherm was not
linear. As the water residence time in the column, Ts was higher than the characteristic
time of sorption resulting from flow-through reactor study (the Damkhfler number Dk
Fig. 12. Column BTCs of 85Sr at different equilibrating stable Sr concentrations (see Table 3 for the isotopic ratio
of the different solutions). Markers represent measured data and lines show PHREEQC simulations. Cation
exchange model parameters were previously determined in independent flow-through reactor experiments and
corrected only by the solid/liquid ratio, transport model parameters were fitted to the inert tracer BTC.

S. Szenknect et al. / Journal of Contaminant Hydrology 76 (2005) 139–165 161
reached 84), we assumed that there was no kinetic sorption or desorption effects. The
symmetry of the 85Sr BTCs also confirms the assumption of chemical equilibrium
(Schweich and Sardin, 1981).
As the results obtained in column experiments were consistent with the flow-through
reactor study, it was decided to test the cation exchange model and use it to explain 85Sr
retardation factor variations as a function of stable strontium concentration. It was then
necessary to add the new 85Sr species to the PHREEQC database. No parameter fitting was
performed at this step. Transport parameters were already determined with the nonreactive
tracer BTC analysis and were directly imported into the PHREEQC input file. All the
selectivity constants of major cations with respect to Na+ were conserved. The selectivity
constant of the new species 85Sr2+ with respect to Na+ was equal to that of stable Sr2+ with
respect to Na+ (log KSr/Na=2.6). The number of exchange sites accessible for Sr2+ in our
physicochemical conditions resulting from the flow-through reactor study was used:
X�=10�4 mol/kg. In order to allow for the increase in solid/liquid ratio between the flow-
through reactor and column, the number of exchange sites was calculated as 10�4 M/V,
where M is the solid mass per unit of porous medium volume and V is the water volume
per unit of porous medium volume. The resulting number of exchange sites accessible for
Sr2+ in our experimental conditions, X�, in mol per unit volume of water in the porous
media was 10�4qd/hsat=5�10�4 mol/L.
Considering that the sand without conditioning was in equilibrium with a solution
containing 10�6 mol/L of strontium, as measured in batch experiments (Table 4) and
taking into account the conditioning stage length in the PHREEQC simulations of each
column experiment (Table 3), it was then possible to describe the 85Sr BTCs. The
theoretical BTCs obtained from PHREEQC calculations for the different 85Sr miscible
displacement experiments were compared with the experimental BTCs on Fig. 12. There
was good agreement between the measured and predicted 85Sr BTCs when the length of
the equilibrating stage was included in the transport calculations. The retardation factor
and maximum aqueous concentration were well estimated.
4. Discussion and conclusions
In this work, we have examined the effects of nonlinear sorption and competition with
stable strontium on radioactive 85Sr transport in a natural sand. Using a multiple tracer
approach, different physical and chemical processes (including hydrodynamic transport,
nonlinear sorption, and competition with major cations) were identified and quantified.
Batch, reactor and miscible displacement experiments were performed covering a wide
range of experimental conditions.
Experiments under dynamic conditions, namely flow-through reactor and column
experiments, were in very good agreement. However, the solid/liquid ratio was very
different (0.24 g/mL for the reactor and 5.0 g/mL for the sand-packed column). Sand
particles in the reactor were dispersed and shaken, whereas the sand sample was packed in
the column. The experimental data resulting from the flow-through reactor study showed
evidence of a nonlinear sorption process. The results were modeled with the PHREEQC
computer code (Version 2). A cation exchange model proved suitable for describing the
S. Szenknect et al. / Journal of Contaminant Hydrology 76 (2005) 139–165162
solute/soil reaction. Two parameters were fitted: the number of exchange sites accessible
for Sr2+ and the selectivity constant of Sr2+ with respect to Na+. This model successfully
described the results of the entire set of miscible displacement experiments using the same
set of parameter values for reaction calculations. Miscible displacement experiments were
conducted to demonstrate competition between stable and radioactive strontium and its
effect on the 85Sr retardation factor. This study was performed for two reasons: the
nonlinearity of the Sr sorption isotherm for the eolian sand and the highly stable strontium
aqueous concentration levels observed in the field.
Based on these observations, explanations can be proposed for the discrepancies
found between data obtained from static (batches) and dynamic (reactor and column)
experiments. The adsorption isotherm data obtained from the batch study also fitted the
Langmuir isotherm best. In batch experiments, however, the sorption capacity of the
sand for radioactive strontium was one order of magnitude higher than in dynamic
experiments and the slope of the isotherm was lower. Neither the bsolid/solution ratio
effectQ, nor the increase in accessible reactive surface area resulting from the
disaggregation of clay clusters during shaking and/or from abrasion processes can be
put forward, for if such effects had existed, they would have led to discrepancies
between flow-through reactor and column results. Classical alternative explanations
include a loss of fine particles (with higher reactivity) during the initial conditioning of
the sand sample in the reactor (that hardly occurs in the column) or an inadequate
control of solution and exchanger composition during the equilibrium period in the batch
system (Porro et al., 2000). Desorbed antecedent species (stable Sr for example) are
removed from the column or reactor in the flow system but remain to compete for
sorption sites in the batch system. This will affect exchange equilibria in batch systems,
but not in flow systems, because the exchanger is in equilibrium with the feed solution
thanks to the conditioning stage and because the solution-phase composition is relatively
constant.
Static and dynamic experiments provide two different sets of parameters for the cation
exchange model. We have shown the influence of the conditioning of the soil on the values
of the fitted parameters, especially the number of exchange sites accessible for Sr2+. The
geochemistry of the soil/solution system has to be controlled accurately during
experiments because small variations of the concentration and nature of competitive
cations in solution has a large influence on the fitted number of exchange sites accessible
for Sr2+ due to the nature of the sand. Static and dynamic experiments provide a range of
values for the parameters of the cation exchange model. However, we can say that, in flow
systems, the number of unknown variables decreases and the fitting of the model
parameters is facilitated.
We have shown that an increase of the stable Sr concentration in water from 10�6 to
10�5 mol/L leads to divide the radioactive Sr retardation factor by 3. Knowing the spatial
and temporal variability of stable Sr concentration in groundwater at the field scale, it
seems not realistic to use a single Kd value to predict the 90Sr migration in aquifer.
Maturation of the organic matter content of the trench could lead to future perturbations of
the geochemistry of the system, especially Ca2+ concentration and pH. These two variables
have also an effect on the retardation factor of Sr and additional studies are planned to
quantify this effect in terms of range of Kd values.

S. Szenknect et al. / Journal of Contaminant Hydrology 76 (2005) 139–165 163
Acknowledgements
We gratefully acknowledge the assistance of the Tracers Applications Laboratory of
the French Atomic Agency (CEA-SAT, Grenoble) who provided technical support for
the dynamic experiments, and express particular thanks to D. Alincant and D. Rudloff.
BET and batch measurements were carried out by J.L. Roujou (IRSN-LESTS). We
express our great gratitude to L. Dewiere and D. BugaR for their helpful discussions.
Financial support was supplied jointly by Radiation Protection and Nuclear Safety
Institute (IRSN-Chernobyl Pilot Site project) and by Electricite de France (EDF-CNPE
project).
References
Albrecht, A., Schultze, U., Bello Bugallo, P., Wydler, H., Frossard, E., Flqhler, H., 2003. Behavior of surfaceapplied radionuclide and a dye tracer in structured and repacked monoliths. J. Environ. Radioact. 68, 47–64.
Appelo, C.A.J., Verweij, E., Sch7fer, H., 1998. A hydrogeochemical transport model for an oxidation experiment
with pyrite/calcite/exchangers/organic matter containing sand. Appl. Geochem. 13, 257–268.
Bajracharya, K., Tran, Y.T., Barry, D.A., 1996. Cadmium adsorption at different pore water velocities. Geoderma
73, 197–216.
Bolt, G.H., Bruggenwert, M.G.M. (Eds.), 1978. Soil Chemistry: A. Basic Elements. Elsevier, Amsterdam. 527 pp.
Bolz, R.E., Tuve, G.L., 1976. CRC Handbook of tables for Applied Engineering Science. (2nd edition)CRC
Press, Boca Raton (USA). 1166 pp.
Bruggenwert, M.G.M., Kamphorst, A., 1982. Survey of experimental information on cation exchange
in soil systems. In: Bolt, G.H. (Ed.), Soil Chemistry: B. Physico-Chemical Models. Elsevier, Amsterdam,
pp. 141–203.
Brusseau, M.L., 1994. Transport of reactive contaminants in heterogeneous porous media. Rev. Geophys. 32,
285–313.
BugaR, D.A., Guillou, Ph., Dewiere, L., Dzhepo, S.P., Gerbaux, O., Getto, D., et al., 2000. Study of radionuclide
migration in geological environment at experimental polygon pilot site in the area of the near-surface disposal
of radioactive wastes in the near-zone of chernobyl NPP. In: Shestopalov, V. (Eds.), Water Exchange and
Chernobyl Accident, Distribution of Chernobyl Radionuclides in Hydrogeology Structures, vol. 1. Ukrainian
National Academy of Sciences, Kiev, pp. 346–383. (In Russian).
BugaR, D., Dewiere, L., Kashparov, V.A., Ahamdach, N., 2002. Strontium-90 transport parameters from source
term to aquifer in the chernobyl pilot site. Radioprotection-Colloques 37-C1, 11–16.
Dewiere, L., BugaR, D., Grenier, C., Kashparov, V., Ahamdach, N., 2004. 90Sr migration to the geosphere from a
waste burial in the chernobyl exclusion zone. J. Environ. Radioact. 74, 139–150.
Fesch, C., Simon, W., Haderlein, S.B., Reichert, P., Schwarzenbach, R.P., 1998. Nonlinear sorption and
nonequilibrium solute transport in aggregated porous media: experiments, process identification and
modeling. J. Contam. Hydrol. 33, 373–407.
Gabriel, U., Gaudet, J.P., Spadini, L., Charlet, L., 1998. Reactive transport of uranyl in a goethite column: an
experimental and modelling study. Chem. Geol. 151, 107–128.
Grolimund, D., Borkovec, M., Federer, P., Sticher, H., 1995. Measurement of sorption isotherms with flow-
through reactors. Environ. Sci. Technol. 29, 2321–2371.
Hilton, J., Nolan, L., Jarvis, K.E., 1997. Concentrations of stable isotopes of cesium and strontium in freshwaters
in northern England and their effect on estimates of sorption coefficients (Kd). Geochim. Cosmochim. Acta
61 (6), 1115–1330.
Hormann, V., Kirchner, G., 2002. Prediction of the effects of soil-based countermeasures on soil solution
chemistry of soils contaminated with radiocesium using the hydrogeochemical code PHREEQC. Sci. Total
Environ. 289, 83–95.
S. Szenknect et al. / Journal of Contaminant Hydrology 76 (2005) 139–165164
Jackson, R.F., Inch, J., 1983. Hydrogeochemical processes affecting the migration of radionuclides in a fluvial
and aquifer at the chalk river nuclear laboratories. Environ. Sci. Technol. 17, 231.
Jennings, A.A., Kirchner, D.J., 1984. Instantaneous equilibrium approximation analysis. J. Hydraul. Eng., Proc.
Am. Soc. Civ. Eng. 11, 1700–1717.
Jury, W.A., Sposito, G., 1985. Field calibration and validation of solute transport models for the unsaturated zone.
Soil Sci. Soc. Am. J. 49, 1331–1341.
Jury, W.A., Roth, K., 1990. Transfer Functions and Solute Movement Through Soil: Theory and Applications.
Birkh7user, Basel, Switzerland.Keren, R., O’Connor, G.A., 1983. Strontium adsorption by noncalcareous soils–exchangeable ions and solution
composition effects. Soil Sci. 135 (5), 308–315.
Kinniburgh, D.G., Syers, J.K., Jackson, M.L., 1975. Specific adsorption of trace amount of calcium and strontium
by hydrous oxides of iron and aluminium. Proc.-Soil Sci. Soc. Am. 39, 464–470.
Koss, V., Kim, J.I., 1990. Modeling of strontium sorption and speciation in a natural sediment—groundwater
system. J. Contam. Hydrol. 6, 267–280.
Lefevre, F., Sardin, M., Schweich, D., 1993a. Migration of strontium in clayey and calcareous sandy soil:
precipitation and ion exchange. J. Contam. Hydrol. 13, 215–229.
Lefevre, F., Sardin, M., Vitorge, P., 1993b. Migration of 45Ca 90Sr in a clayey and calcareous sand: calculation of
distribution coefficients. 4th International Conference on the Chemistry and Migration Behaviour of Actinides
and Fission Products in the Geosphere, Charleston, SC USA, December 12–17 1993, pp. 711–717.
Martin-Garin, A., van Capellen, P., Charlet, L., 2003. Aqueous cadmium uptake by calcite: a stirred flow-through
reactor study. Geochim. Cosmochim. Acta 67 (15), 2763–2774.
Metson, A.J., 1956. Methods of chemical analysis for soil survey samples. N.Z. Soil Bur., 12.
Ohnuki, T., 1994. Sorption characteristics of strontium on sandy soils and their components. Radiochim. Acta 64,
237–245.
Pang, L., Close, M., 1999. Field-scale physical non-equilibrium transport in an alluvial gravel aquifer. J. Contam.
Hydrol. 38, 447–464.
Parkhurst, D.L., Appelo, C.A.J., 1999. User’s guide to PHREEQC (Version 2)—a computer program for
speciation, batch-reaction, one-dimensional transport, and inverse geochemical calculations, U.S.G.S. Water-
Resources Report 99-4259.
Plassard, F., Winiarski, T., Petit-Ramel, M., 2000. Retention and distribution of three heavy metals in a
carbonated soil: comparison between batch and unsaturated column studies. J. Contam. Hydrol. 42, 99–111.
Porro, I., Newman, M.E., Dunnivant, F.M., 2000. Comparison of batch and column methods for determining
strontium distribution coefficient for unsaturated transport in basalt. Environ. Sci. Technol. 34, 1679–1686.
Prommer, H., Davis, G.B., Barry, D.A., 1999. Geochemical changes during biodegradation of petroleum
hydrocarbons: field investigations and biogeochemical modelling. Org. Geochem. 30, 423–435.
Prout, W.E., 1958. Adsorption of radioactive wastes by Savannah river plant soil. Soil Sci. 86, 13–17.
Saiers, J.E., Hornberger, G.M., 1996. Migration of 137Cs through quartz sand: experimental results and modeling
approaches. J. Contam. Hydrol. 22, 255–270.
Sardin, M., Schweich, D., Leij, F.J., Van Genuchten, M.T., 1991. Modeling the nonequilibrium transport of
linearly interacting solutes in porous media: a review. Water Resour. Res. 27, 2287–2307.
Schoen, R., Gaudet, J.P., Bariac, T., 1999. Preferential flow and solute transport in a large lysimeter, under
controlled boundary conditions. J. Hydrol. 215, 70–81.
Schweich, D., Sardin, M., 1981. Adsorption, partition, ion exchange and chemical reaction in batch reactors or in
column—a review. J. Hydrol. 50, 1–33.
Simunek, J., Jarvis, N.J., van Genuchten, M.Th., G7rden7s, A., 2003. Review and comparison of models for
describing non-equilibrium and preferential flow and transport in the Vadose Zone. J. Hydrol. 272, 14–35.
Thomasson, M.J., Wierenga, P.J., 2003. Spatial variability of the effective retardation factor in the unsaturated
field soil. J. Hydrol. 272, 213–225.
Tran, Y.T., Barry, D.A., Bajracharya, K., 2002. Cadmium desorption in sand. Environ. Int. 28, 493–502.
van Breukelen, B.M., Appelo, C.A.J., Olsthoorn, T.N., 1998. Hydrogeochemical transport modelling of 24 years
of Rhine water infiltration in the dunes of the Amsterdam water supply. J. Hydrol. 209, 281–296.
van Capellen, P., Qiu, L., 1997a. Biogenic silica dissolution in sediments of the southern ocean: I. Solubility.
Deep-Sea Res., II 44, 1109–1128.

S. Szenknect et al. / Journal of Contaminant Hydrology 76 (2005) 139–165 165
van Capellen, P., Qiu, L., 1997b. Biogenic silica dissolution in sediments of the southern ocean: II. Kinetics.
Deep-Sea Res., II 44, 1129–1149.
Villermaux, J., 1985. Genie de la reaction chimique: conception et fonctionnement des reacteurs. Lavoisier Tec-
Doc, Paris. (In French).
Wen, C.Y., Fan, L.T., 1975. Models for Flow Systems and Chemical Reactors. Dekker M., New York.