reacción en cadena: causas y consecuencias de la guerra anti-inmingrante en estados unidos douglas...
TRANSCRIPT

Reacción en Cadena: Causas y Consecuencias de la Guerra Anti-Inmingrante en Estados Unidos
Douglas S. MasseyWoodrow Wilson School
Princeton University

Origines de la Guerra Anti-inmigrante
Epocas Importantes1. La Paz Bracera 1954-19642. El Ascenso de la Ameneza Latina 1965-19953. Tiempos de Guerra 1996-20064. Punto Muerto 2007-2011


Rise of Latino Threat NarrativeDistribution of Alarmist Covers by Period
18
37
45
0
5
10
15
20
25
30
35
40
45
50
1970s 1980s 1990s
Decade
Per
cen
tag
e


1965 1967 1969 1971 1973 1975 1977 1979 1981 1983 1985 1987 1989 1991 1993 19950
0.1
0.2
0.3
0.4
0.5
0.6
0.7
0.8
0.9
1
Correspondence Between Apprehensions and Threatening Metaphors
Apprehensions Metaphors
Year
Ratio
of V
alue
Rel
ative
to 1
986

β SEDemographic Background
Age 0.0113 ** 0.0035Age-squared 0.0000 0.0000Female -0.1818 *** 0.0215White 0.3532 *** 0.0287U.S. Born 0.0139 0.0289Currently married 0.2479 *** 0.0214No. of minors in household 0.0552 *** 0.0094
General Human CapitalEducation 0.0329 *** 0.0037
Specific Human CapitalIncome 0.0021 *** 0.0003Skilled occupationProfessional occupation -0.0422 0.0273Service occupation 0.0269 0.0250Farm occupation 0.0365 0.0676
U.S. RegionWestNortheast -0.2168 *** 0.0323Midwest -0.0218 0.0295South 0.1734 *** 0.0279
Size of CityRuralLarge urban city -0.2395 *** 0.0412Medium urban city -0.1140 *** 0.0309Small urban city -0.0078 0.0240
U.S. Economic ContextExpected earnings -0.0027 *** 0.0004
U.S. Policy ContextMexican Apprehensions 0.1680 *** 0.0315
Total number of observations*p<.10; **p<.05; ***p<.001
51,981
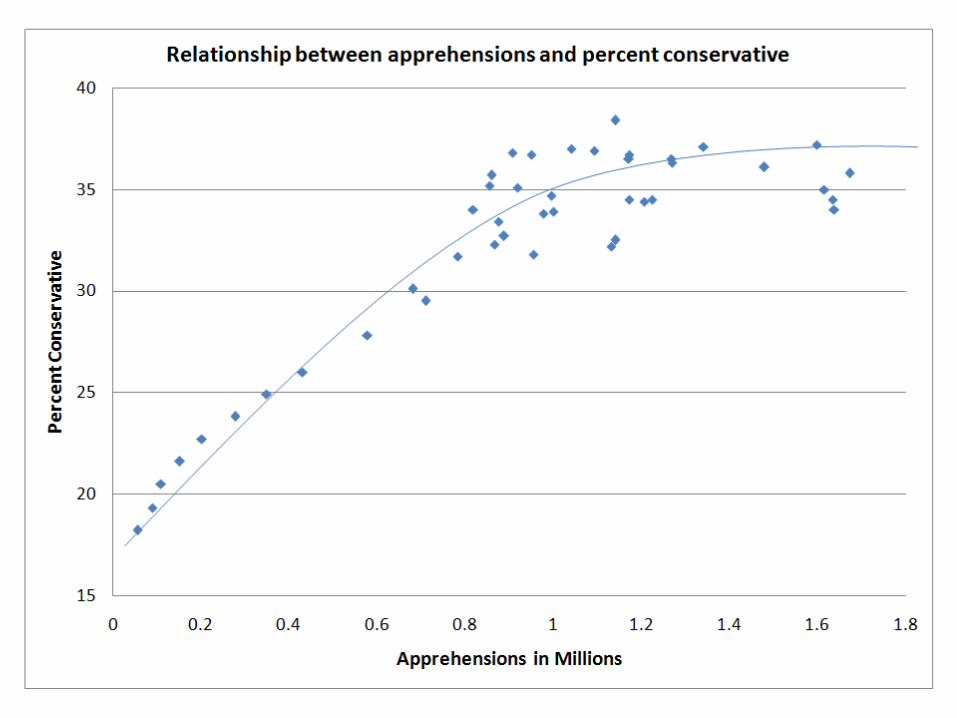
Predicting Conservatism
--
--
--

β SEDemographic Background
Age 0.0351 ** 0.0138Age-squared -0.0002 * 0.0001Female -0.1113 0.0918White 0.5176 ** 0.1597Currently married 0.2474 ** 0.1094No. of minors in household -0.0150 0.0403
General Human CapitalEducation -0.0793 *** 0.0183
Specific Human CapitalIncome (x1000) -0.0016 0.0013Skilled occupationProfessional occupation -0.1017 0.0885Service occupation 0.0235 0.0852Farm occupation -0.0526 0.3130
U.S. RegionWestNortheast 0.1012 0.1512Midwest 0.1187 0.0982South 0.2608 ** 0.1062
Size of CityRuralLarge urban city -0.3992 ** 0.1667Medium urban city -0.1258 0.0784Small urban city -0.1302 0.1056
U.S. Policy ContextIdentified Self as not conservativeIdentified S+elf as slightly conservative 0.3959 *** 0.1018Identified Self as extremely conservative0.5572 ** 0.1520
Anti-immigrant sentimentSupport fo exclusionist policies index
Total number of observations*p<.10; **p<.05; ***p<.001
5,194
--
--
---
Support Exclusionist Policy Both: 1996 & 2004
--


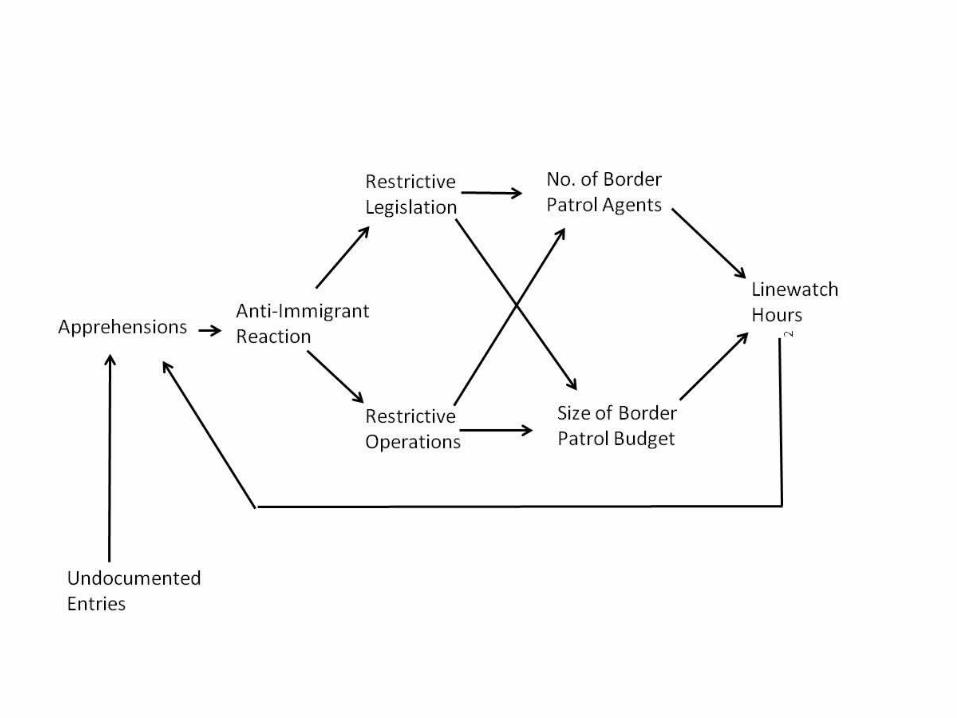
RESTRICTIVE LEGISLATION
1965 Hart-Cellar ActImposed first-ever annual cap of 120,000 visas for immigrants from western hemisphere
1976 Amendments to Immigration and Nationality Act Put western hemisphere under preference system and country quotas
1978 Amendments to Immigration and Nationality ActCombined separate hemispheric caps into single worldwide ceiling of 290,000
1980 Refugee Act Abolished refugee preference and reduced worldwide ceiling to 270,000
1986 Immigration Reform and Control ActCriminalized undocumented hiring and authorized expansion of Border Patrol
1990 Amendments to the Immigration and Nationality ActSought to cap visas going to spouse and children of resident aliens
1996 Antiterrorism and Effective Death Penalty Act Authorized expedited removal of aliens and deportation of aggravated felons
1996 Illegal Immigrant Reform and Immigrant Responsibility ActIncreased resources for border enforcement, narrowed criteria for asylum, and increased income threshold required to sponsor immigrants
1996 Personal Responsibility and Work Opportunity ActDeclared documented and undocumented migrants ineligible for certain entitlements
1997 Nicaraguan and Central American Relief ActAllowed registered asylum seekers from Central America (mostly Nicaraguans) in the USfor at least 5 years since December 1, 1995 to obtain legal status; but prohibitedlegalization and order deportation for those who lacked a valid visa or who previouslyviolated US immigration laws (mostly Hondurans, Salvadorans, and Guatemalans)
2001 USA Patriot ActCreated Department of Homeland Security, increased funding for surveillance anddeportation of foreigners; authorized deportation of aliens without due process
2004 National Intelligence Reform and Terrorism Protection Act Funded new equipment, aircraft, border patrol agents, immigration investigators, anddetention centers for border enforcement
2005 Real ID ActDramatically increased the data requirements, documentation, and verification proceduresfor state issuance of drivers licences
2006 Secure Fence ActAuthorized construction of additional fencing, vehicle barriers, checkpoints, lighting andfunding for new cameras, satellites, and unmanned drones for border enforcement
2010 Border Security ActFunded hiring 3,000 more Border Patrol agents and increased BP budget by $244 million


Tiempos de Guerra
1992 Primero Ataque en NY 1995 Bombardeo en Oklahoma
1996 Anti-Terrorism and Effective Death Penalty Act 1998 Bombardeo de USS Cole en Yemen 2000 Bombardeo de las Embajadas en Africa 2001 9-11 Ataques en NY y Washington
2001 USA PATRIOT Act


RESTRICTIVE OPERATIONS
1993 Operation Blockade (El Paso)1994 Operation Gatekeeper (San Diego)1998 Operation Rio Grande (Brownsville)1999 Operation Safeguard (Tucson)2003 Operation Endgame (Internal)2004 Operation Frontline (Internal)2004 Arizona Border Control Initiative (Arizona)2004 Operation Stonegarden (Entire Border)2005 Secure Borders Initiative (Entire Border)2005 Operation Streamline (Entire Border)2006 Operation Return to Sender (Internal)2006 Operation Jump Start (Entire Border)2007 Secure Communities Program (Internal)2007 Operation Rapid REPAT (Internal)2008 Operation Scheduled Departure (Internal)2010 Operation Copper Cactus (Arizona)


Punto Muerto
• Tasa de Salida Indocumentada a EEUU: 0• Tasa de Retorno a México: 0• Población Permanente de Indocumentados
• 11 milliones en total• 6.5 millones de Mexicanos
• Más represión del estado norteamericano• Mas exclusión del pueblo estadonidense


Average Daily Number of Immigrants in Detention
6259
20,032
31,345
0
5000
10000
15000
20000
25000
30000
35000
1992 2000 2008
Year
Nu
mb
er

Immigration-Related Legislation in State Legislatures
1404
570
300
13051405
170
8436
206259
0
200
400
600
800
1000
1200
1400
1600
2005 2006 2007 2008 2009Year
Nu
mb
er
Bills Considered
Bills Enacted


Anti-Hispanic Hate Crimes Since 9/11
480 475
522
576
595
426
400
450
500
550
600
650
2002 2003 2004 2005 2006 2007
Year
Nu
mb
er

Consequences of the War: Public Opinion2006 Pew Survey of American Adults
48
54
60
0
10
20
30
40
50
60
70
Immigrants Threaten AmericanValues
Americans Need to Be ProtectedAgainst Foreign Influence
Approve of Minutemen

1950 1955 1960 1965 1970 1975 1980 1985 1990 1995 2000 2005 20100.0000
0.0200
0.0400
0.0600
0.0800
0.1000
0.1200
Probability of Undocumented Migration to United States
First Trip Later Trip
Year
Prob
abili
ty o
f Dep
artu
re
OperationWetback
Bracero Program Cancelled& Numerical Quotas Imposed
IRCA
OperationBlockade
EconomicCrisis in US
PATRIOTAct

Model to Predict Probability of Undocumented Migration
Demographic BackgroundAgeAge-squaredMarriedNo. of minors in household
General Human CapitalLabor force experienceEducation
Specific Human CapitalMonths of prior U.S. experienceNumber of prios U.S. tripsUnskilled urban jobSkilled urban job
General Social CapitalParent a U.S. MigrantNo of U.S. migrant siblingsProp U.S. Migrants in Community
Specific Social CapitalSpouse a U.S. migrantNo. of U.S. migrant childrenNo. of U.S. born children
Physical CapitalLandHomeBusiness
U.S. Social ContextFrequency of Threatening Media ReferencesExpected earningsConsumer confidence index
U.S. Policy ContextAvailability of Legal VisasBorder enforcement factor

Effect of Enforcement on Likelihood of Undocumented Migration
First Undocumented Trip to the U.S.
Additional Undocumented Trips to the U.S.
β SE β SE
U.S. Socioeconomic Context
Frequency of Threatening Media References -0.0026 ** 0.0013 0.0024 0.0015
Expected earnings 0.0004 *** 0.0004 -0.0045 *** 0.0005
Consumer confidence index 0.0048 *** 0.0010 0.0055 *** 0.0012
U.S. Policy Context
Availability of Legal Visas -4.5095 *** 0.3315 -4.3981 *** 0.4328
Border Enforcement Factor 0.1682 *** 0.0412 0.0959 ** 0.0392
Intercept -7.1785 *** 0.2598 1.8144 *** 0.3735
Likelihood Ratio 4740.5351 *** 3889.1290 ***
Wald 3291.3784 *** 2745.6100 ***
Total number of person-years 684,128 82,735
*p<.10; **p<.05; ***p<.01

1950 1955 1960 1965 1970 1975 1980 1985 1990 1995 2000 2005 2010$0.00
$500.00
$1,000.00
$1,500.00
$2,000.00
$2,500.00
$3,000.00
Cost of Border Crossing in 2010 US Dollars
Year
Cost
in U
S Do
llars
1965 Act IRCA
BorderBlockades
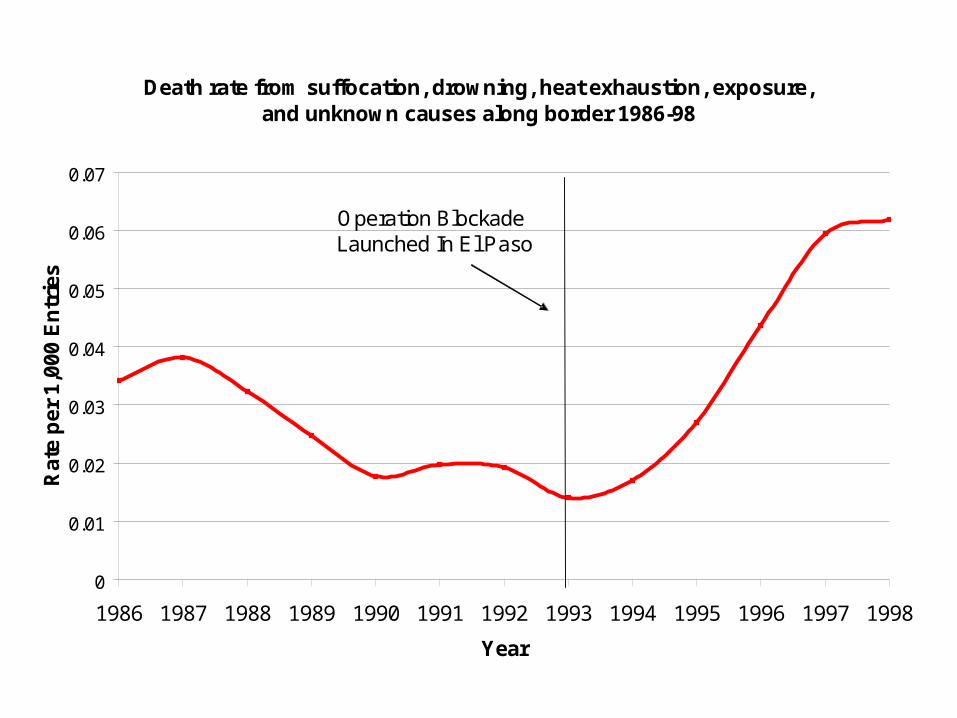
Death rate from suffocation, drowning, heat exhaustion, exposure, and unknown causes along border 1986-98
0
0.01
0.02
0.03
0.04
0.05
0.06
0.07
1986 1987 1988 1989 1990 1991 1992 1993 1994 1995 1996 1997 1998
Year
Rat
e p
er 1
,000
En
trie
s
Operation Blockade Launched In El Paso

1950 1955 1960 1965 1970 1975 1980 1985 1990 1995 2000 2005 20100
0.1
0.2
0.3
0.4
0.5
0.6
0.7
0.8
0.9
Probability of Returning to Mexico within 12 Months
First Trip Later Trip
Year
Prob
abili
ty
Bracero Program EndsWH Quotas Imposed IRCA Passes 1996 Acts
PATRIOT Act

Effect of Enforcement on Likelihood of Return Migration
First Return from U.S. Trip within 12 months
Additional Returns from U.S. Trip within 12 months
β SE β SE
U.S. Social Context
Frequency of Threatening Media References 0.0022 0.0021 0.0038 ** 0.0018
Expected earnings 0.0004 ** 0.0007 -0.0036 *** 0.0006
Consumer confidence index -0.0035 ** 0.0017 -0.0004 0.0014
U.S. Policy Context
Availability of Legal Visas -2.3915 *** 0.5821 -3.2181 *** 0.5258
Border enforcement factor -0.2093 *** 0.0727 0.3312 *** 0.0492
Intercept -8.0701 *** 0.4327 0.9421 ** 0.4549
Likelihood Ratio 8390.8329 *** 3252.6061 ***
Wald 10050.2181 *** 2670.5435 ***
Total number of person-years 679,488 66,312
*p<.10; **p<.05; ***p<.01


Back to the Future: Flows Then and Now
• 1956-1957– 57,000 Documented Migrants per Year– 441,000 Guestworkers per Year– 498,000 Total Legal Entries per Year– Apprehension Rate: 38.4 Migrants per Agent & Falling
• 2008-2009– 177,000 Documented Migrants Per Year– 331,000 Guestworkers per Year– 508,000 Total Legal Entries per Year– Apprehension Rate: 34.5 Migrants per Agent & Falling

Major Difference Between Then and Now:Resident Undocumented Population
– 1956-1957• Effectively Zero
– 2007-2008• Currently Estimated at 10.8 Million• 60% of all Undocumented Migrants Are Mexican• 55% of All Mexicans Present in US Are Undocumented
– Of 11 Million Undocumented Migrants• 3+ Million Entered as children• 500,000-1 Million Former Temporary Protected Status

Reacción en Cadena: Causas y Consecuencias de la Guerra Anti-Inmingrante en Estados Unidos
Douglas S. MasseyWoodrow Wilson School
Princeton University