rc-1534 - durability study of the us-23 aggregate test ... · astm c457 test method was used to...
TRANSCRIPT

Durability Study of the US-23 Aggregate Test Road and Recent JPCP Projects
with Premature Joint Deterioration
Final Report
Submitted to MICHIGAN DEPARTMENT OF TRANSPORTATION
Construction and Technology Division Lansing, Michigan
by
Will Hansen (Principal Investigator) Youngjae Kang (Graduate Research Assistant)
Department of Civil & Environmental Engineering
University of Michigan 2350 Hayward
Ann Arbor, MI 48109-2125
Final Report prepared for Michigan Department of Transportation December 2010

Technical Report Documentation Page 1. Report No. RC-1534
2. Government Accession No.
3. MDOT Project Manager John Staton 5. Report Date December 2010
4. Title and Subtitle Durability Study of the US-23 Aggregate Test Road and Recent JPCP Projects with Premature Joint Deterioration 6. Performing Organization Code
7. Author(s) Will Hansen, Youngjae Kang, University of Michigan
8. Performing Org. Report No. 10. Work Unit No. (TRAIS) 11. Contract No. 2006-0412
9. Performing Organization Name and Address The University of Michigan Ann Arbor, MI 48109-2125
11(a). Authorization No. 2006-0412 13. Type of Report & Period Covered Final Report 12/21/2006-03/21/2009
12. Sponsoring Agency Name and Address Michigan Department of Transportation Construction and Technology Division PO Box 30049 Lansing, MI 48909
14. Sponsoring Agency Code
15. Supplementary Notes 16. Abstract Materials related distress (MRD) characterized by “starburst” type corner spalling at the longitudinal centerline joint, and occasional transverse joint spalling have developed at a rapid rate in a number of JPCP projects constructed since 1999. The main objective for this project was to isolate the major cause(s) for suspected freeze-thaw deterioration, and to provide recommendations for improved materials specifications in order to ensure long-term freeze-thaw resistance to severe surface exposure conditions (i.e. surface contact with either water or 3% NaCl) during repeated freezing and thawing. Four younger (<10 years) field projects with this type of MRD and four older field projects without MRD were selected for laboratory freeze-thaw testing for two different exposure conditions (water and 3% NaCl) during cyclic freeze-thaw. Rapid surface deterioration developed due to deicer salt exposure within a few freeze-thaw cycles for the concrete with MRD problems. The concrete without MRD had significantly improved deicer scaling resistance. Microscopic examination of the scaled surfaces demonstrated that excessive expansion and cracking had developed within the Portland cement paste consistent with inadequate air-void system. ASTM C457 test method was used to evaluate the air-void system in the hardened concrete. The four concrete projects which had not developed freeze-thaw problems at the joints also had higher air contents (>5.5%) while the concretes with low air had severe deterioration. A substantial improvement in deicer scaling resistance was obtained for MDOT’s low-cement concrete containing slag cement (328 lbs Type I, and 162 lbs slag cement). The improvement was attributed to a better quality paste-coarse aggregate interface (i.e. without air-void clustering) and air-void system (smaller sized bubbles), and lower paste permeability (i.e. lower water uptake rate). 17. Key Words Air-void analysis; concrete pavements, deicer scaling, joint associated deterioration; field performance; freeze-thaw durability
18. Distribution Statement No restrictions. This document is available to the public through the Michigan Department of Transportation.
19. Security Classification - report Unclassified
20. Security Classification - pageUnclassified
21. No. of Pages 38
22. Price
ACKNOWLEDGEMENT The research team would like to thank the MDOT TAG members for their project
suggestions and guidance. The research team would like to thank, John Staton, project
manager during the final stages of revisions and former project manager David L. Smiley
for their support throughout this project. The authors wish to thank Andy Bennett, MDOT,
for coordinating and carrying out field testing, and assistance with editing.
DISCLAIMER The contents of this report reflect the views of the author/principal investigator who is
responsible for the facts and the accuracy of the data presented herein. The contents do not
necessarily reflect the views or policies of the Michigan Department of Transportation or
the Federal Highway Administration. This report does not constitute a standard,
specification, or regulation.
ii

Executive Summary
The purpose of this study was to provide the understanding and necessary evidence to
modify specifications practices to prevent future occurrences of premature (within 8 years)
joint deterioration which caused starburst type deterioration at joint corners, joint staining
and occasional spalling.
During the course of this project core samples were obtained from eight projects. Four had
developed MRD joint distress within 8 years, and four older projects were free of joint
related MRD. These older projects were selected in order to determine which level of
deicer scaling resistance is necessary in order to avoid field MRD as the laboratory test
procedure is more severe than field exposure (i.e. critically saturated prior to freeze-thaw
testing and exposed to a 3% NaCl solution during freeze-thaw). The potential for
improvement in materials-related specifications was evaluated using MDOT’s low cement
mix design (P-1 MOD) which contains 490 lb cementitious blend of 326 lbs Portland
Cement Type I and 164 lbs slag cement, Grade 100. Materials used for laboratory mixes
were obtained from an ongoing overlay project.
The air-void system in the hardened concrete (entrained air, entrapped air, air-void in-
filling) was conducted according to ASTM C457, “Standard Practice for Microscopical
Determination of Parameters of the Air-Void System in Hardened Concrete”.
Freeze-thaw testing followed a German standard test procedure. The specimen size was
slightly modified in order to obtain prisms from 6 inch diameter core samples. Also, the
moisture conditioning was modified to account for differences in moisture content of the
field concrete and assure a near critical saturation level for all test specimens prior to freeze-
thaw testing. A unique feature of the German test procedure is that the bottom concrete
surface is in contact with the test liquid, consisting of either water or a 3% NaCl solution.
Further, the bottom surface undergoes a controlled temperature profile during each freeze-
thaw cycle. Freeze-thaw deterioration is quantified by collecting and weighing the dried
surface-scaled material at regular freeze-thaw cycle intervals. Lab-concretes were obtained
iii
by cutting prisms from molded specimens. To assure similar water-saturation levels prior to
freeze-thaw testing, the field and lab concretes were dried at 113 °F (45 °C) for two weeks
in order to remove capillary pore water, then re-saturated for about a week at room
temperature by placing the test surface in contact with the liquid.
The major findings of this study are:
Core samples of the deteriorated joint concrete showed that MRD had developed in the top
surface region. Laboratory freeze-thaw testing on core samples from the projects with
MRD showed that surface scaling rate was pronounced in the presence of a deicer salt
solution (3% NaCl solution). Based on microscopic evaluation of the scaled material and
the concrete surface exposed to freezing and thawing it was concluded that deterioration
developed within the portland cement binder, originating in a narrow mortar zone around
the coarse aggregate. Air-void agglomeration was pronounced in this zone.
The air-void system was found to be in-adequate for a severe exposure condition which
exists at poorly draining joints when a concrete surface is exposed to deicer salt solution
during freeze-thaw.
Concretes containing slag cement had improved deicer frost resistance as slag cement
improves the paste-aggregate interface zone and distributes the air better than in concrete
without slag cement.
The major recommendations are:
The results here suggest that if the minimum recommended fresh air content is slightly over
7%, the net remaining air content after about 10 years in service, when taking into account
that infilling of air-voids over time can be expected in the joint area, is sufficient for field
resistance to deicer salt and freeze-thaw.
Ensure that the base and subsurface is sufficiently drained so that water and deicer solutions
are not permitted to accumulate at or beneath joints or other discontinuities in the concrete
pavement surface. Ensuring adequate drainage will reduce the likelihood that the
iv

surrounding concrete at joints will become critically saturated, thus, reducing the risk for
MRD and premature deicer-related freeze-thaw deterioration.
Further benefits can be achieved by using slag cement. This was demonstrated for a MDOT
P-I MOD slag cement concrete mix. Freeze-thaw results show that this concrete has
improved deicer scaling resistance compared to the control concrete without slag cement for
same air content. The improved laboratory performance is attributed to better distribution
of air void system absent of air-void agglomeration around the coarse aggregate and a
reduction in paste permeability as seen from a reduction water uptake rate during a suction
test.
v

TABLE OF CONTENTS
1. Introduction 1
2. Methodology 4
2.1 Field Projects 4
2.2 Specimen Conditioning prior to Freeze-Thaw Testing 4
2.3 Freeze-Thaw Testing 7
2.4 Examination of Specimen Surface and Scaled Particles by Digital Microscopy 8
2.5 Air Void Analysis 9
3. Results and Discussion 11
3.1 Field Observations 11
3.2 Laboratory Freeze-Thaw Test Results 14
3.3 Improved Scaling Resistance of MDOT P-1 MOD Mix Containing Slag
Cement 21
4. Conclusions and Recommendations 25
5. Implementation of Study Findings 27
6. References 29
Appendix A 30
Appendix B 38
vi

LIST OF TABLES
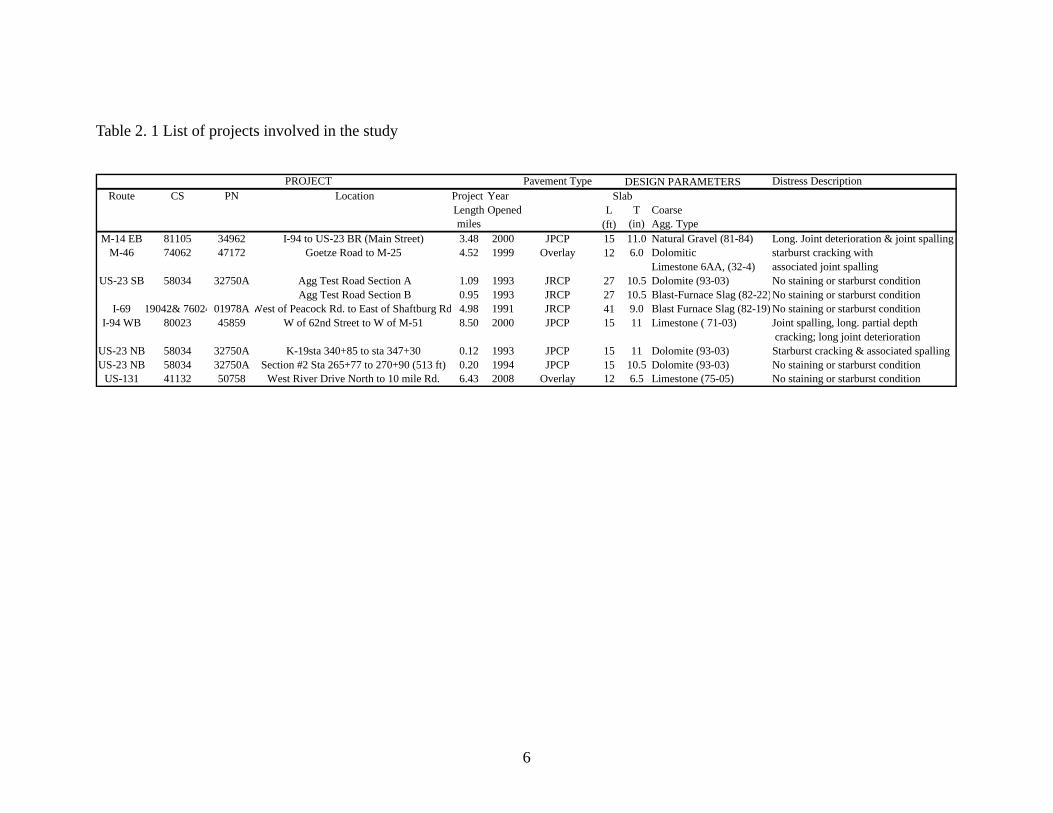
Table 2.1 List of projects involved in the study 6
Table 3.1 Summary air-void results based on point-count method 18
Table 3.2 Air-void results based on ASTM C457 19
LIST OF FIGURES
Figure 2.1 Typical saturation curve 5
Figure 2.2 Freeze-Thaw Machine 7
Figure 2.3 Close-up of specimen test (a) and actual test specimen (b) with bottom test
surface in contact with liquid, in this case in a frozen condition 8
Figure 2.4 Digital microscope setup 9
Figure 2.5 Concrete polisher 10
Figure 2.6 Sample surface after polishing (a), and the same surface after contrast
enhancement (b) 10
Figure 3.1 Joint associated distress (EB, M-14, Ann Arbor) 11
Figure 3.2 Transverse joint staining and spalling near outside shoulder (WB, I-94,
Lawrence, MI) 11
Figure 3.3 WB I-94, Lawrence, MI, showing end of section without joint distress and the
beginning of the section with distress 12
Figure 3.4 Longitudinal cracks at transverse joints initiate joint associated distress just
below the tined surface 13
Figure 3.5 Close-up of joint deteriorated concrete (WB, I-94, Lawrence, MI) 13
Figure 3.6 (a) WB, I-94, transverse joint spalling deterioration at intercept of longitudinal
crack from vibrator trails, and (b) deterioration initiation just below the tined surface from
mortar erosion 13
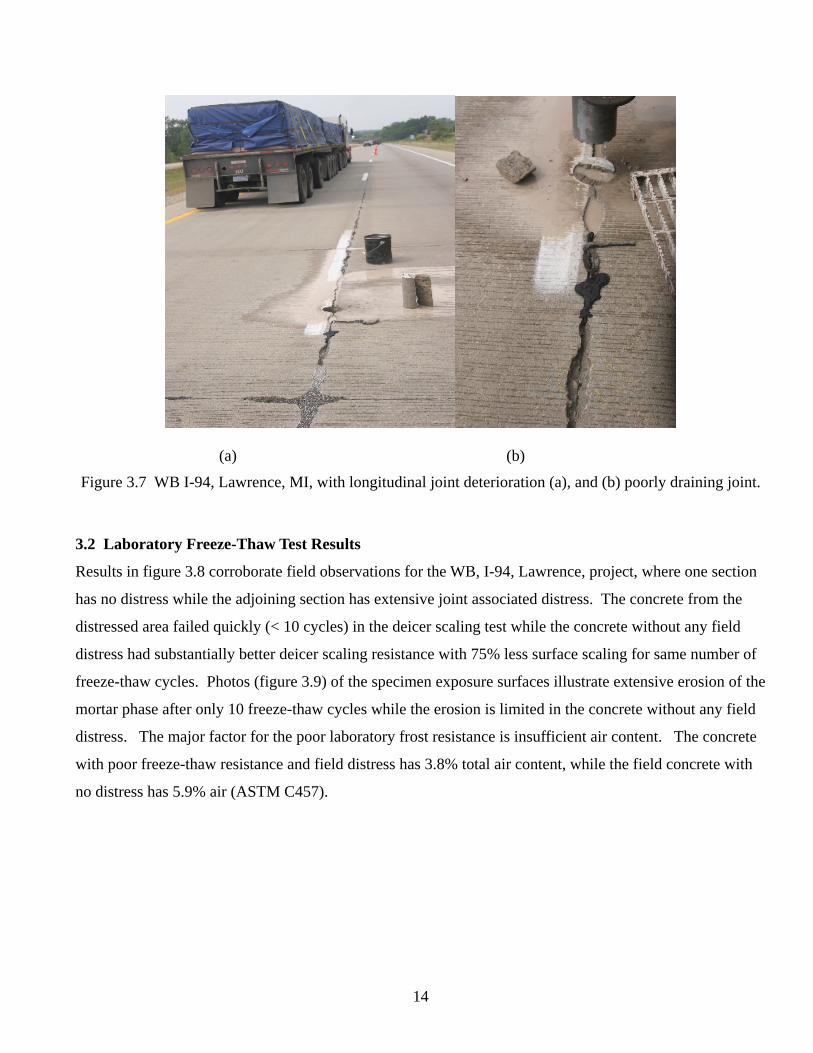
Figure 3.7 WB I-94, Lawrence, MI, with longitudinal joint deterioration (a), and (b) poorly
draining joint 14
Figure 3.8 WB, I-94 test results for two different sections 15
vii
Figure 3.9 Concrete exposure surface from WB I-94, Lawrence, without associated joint
distress (a) after 12 freeze-thaw cycles, and (b) from the distressed area after 10 freeze-thaw
cycles 15
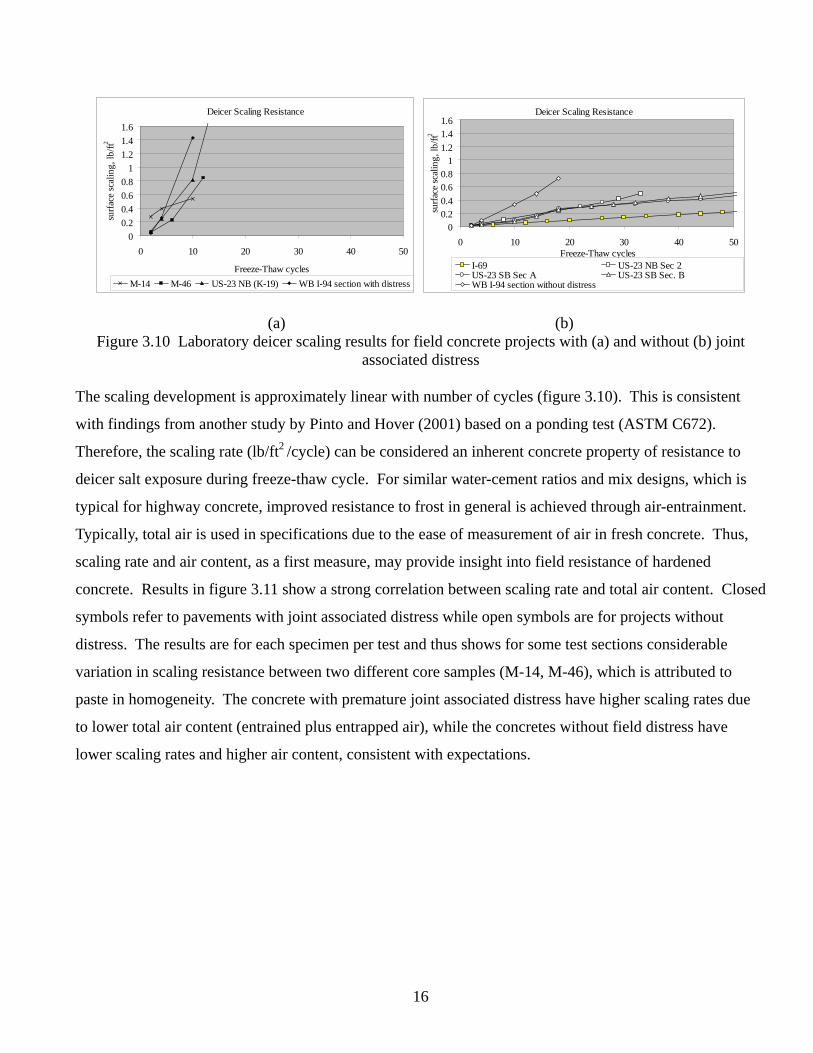
Figure 3.10 Laboratory deicer scaling results for field concrete projects with (a) and
without (b) joint associated distress 16
Figure 3.11 Deicer scaling rate for field concrete versus air content 17
Figure 3.12 Air void infilling (a) and crystallization of salt on the surface during water
sorption test for WB I-94 concrete obtained from joint area in the section with joint
associated distress 18
Figure 3.13 Deicer scaling rate versus Powers spacing factor 20
Figure 3.14 (a and b) I-94 section 2 joint concrete surface following 3 freeze-thaw cycles in
3%NaCl solution 21
Figure 3.15 Mass loss of various air content concrete in de-icing solution 22
Figure 3.16 Scaling rate for P-1 MOD lab concrete and field concrete 22
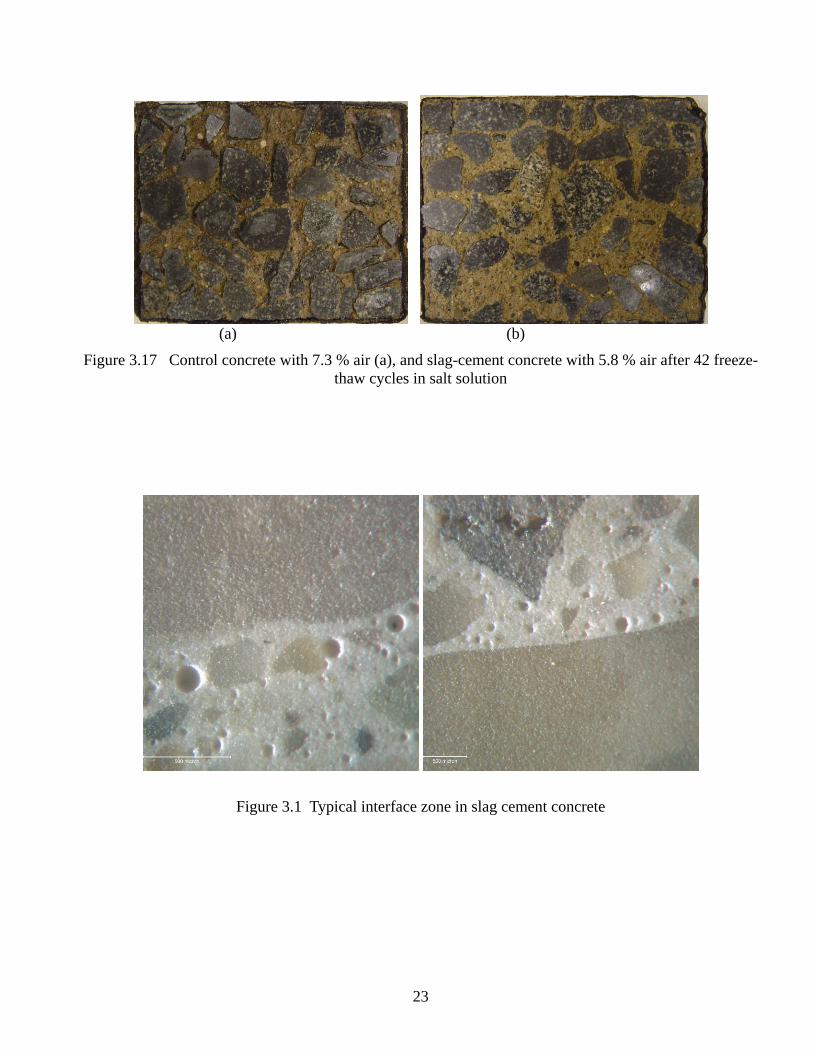
Figure 3.17 Control concrete with 7.3 % air (a), and slag-cement concrete with 5.8 % air
after 42 freeze-thaw cycles in salt solution 23
Figure 3.1 Typical interface zone in slag cement concrete 23
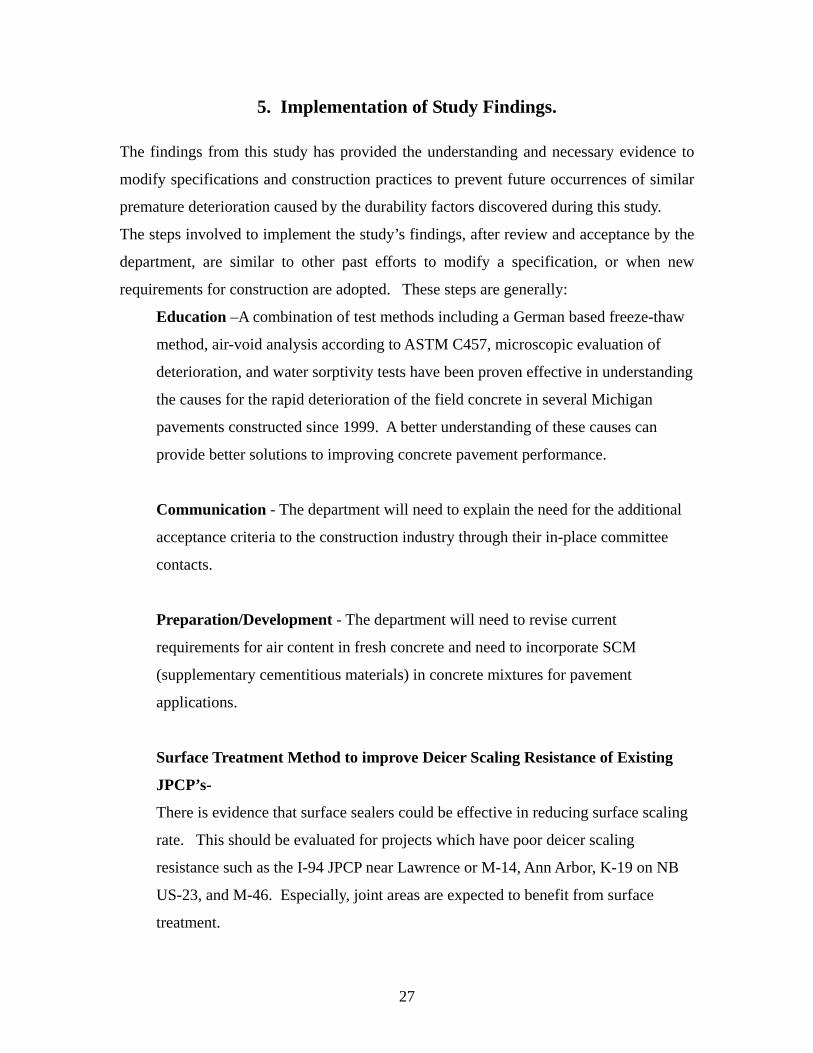
Figure 3.19 Highly porous interface zone (agglomeration of air-voids) around the coarse
aggregate in the control concrete 24
APPENDIX A
Figure A-1 Moisture uptake due to pre-saturation in water 30
Figure A-2 Moisture uptake due to pre-saturation in 3% NaCl solution 30
Figure A-3 Relative damage due to combined freeze-thaw and water exposure 31
Figure A-4 Relative damage due to combined freeze-thaw and deicer salt exposure 31
Figure A-5 Mass-loss due to freeze-thaw and water exposure 32
Figure A-6 Mass-loss due to freeze-thaw and deicer salt exposure 32
Figure A-7 Water uptake due to freeze-thaw and water exposure 33
Figure A-8 Water uptake due to freeze-thaw and deicer salt exposure 33
Figure A-9 Water uptake during pre-saturation test 34
viii

Figure A-10 Deicer salt solution uptake during pre-saturation test 34
Figure A-11 Relative damage due to combined freeze-thaw and water exposure 35
Figure A-12 Relative damage due to combined freeze-thaw and deicer salt exposure 35
Figure A-13 Mass-loss due to combined freeze-thaw and water exposure 36
Figure A-14 Mass-loss due to combined freeze-thaw and deicer salt exposure 36
Figure A-15 Net moisture uptake from combined freeze-thaw and water exposure 37
Figure A-16 Net moisture uptake from combined freeze-thaw and deicer salt Exposure 37
APPENDIX B
Figure B-1 US-131 Overlay mix design report for P-1 MOD Concrete 38
ix
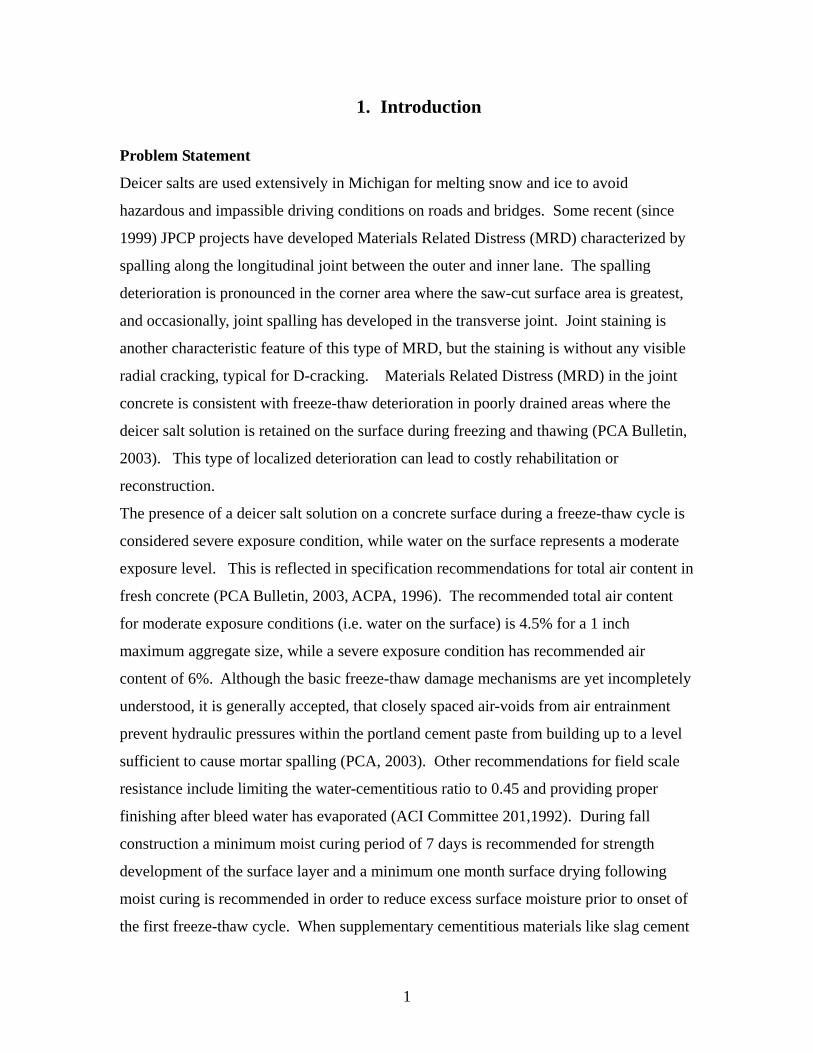
1. Introduction Problem Statement
Deicer salts are used extensively in Michigan for melting snow and ice to avoid
hazardous and impassible driving conditions on roads and bridges. Some recent (since
1999) JPCP projects have developed Materials Related Distress (MRD) characterized by
spalling along the longitudinal joint between the outer and inner lane. The spalling
deterioration is pronounced in the corner area where the saw-cut surface area is greatest,
and occasionally, joint spalling has developed in the transverse joint. Joint staining is
another characteristic feature of this type of MRD, but the staining is without any visible
radial cracking, typical for D-cracking. Materials Related Distress (MRD) in the joint
concrete is consistent with freeze-thaw deterioration in poorly drained areas where the
deicer salt solution is retained on the surface during freezing and thawing (PCA Bulletin,
2003). This type of localized deterioration can lead to costly rehabilitation or
reconstruction.
The presence of a deicer salt solution on a concrete surface during a freeze-thaw cycle is
considered severe exposure condition, while water on the surface represents a moderate
exposure level. This is reflected in specification recommendations for total air content in
fresh concrete (PCA Bulletin, 2003, ACPA, 1996). The recommended total air content
for moderate exposure conditions (i.e. water on the surface) is 4.5% for a 1 inch
maximum aggregate size, while a severe exposure condition has recommended air
content of 6%. Although the basic freeze-thaw damage mechanisms are yet incompletely
understood, it is generally accepted, that closely spaced air-voids from air entrainment
prevent hydraulic pressures within the portland cement paste from building up to a level
sufficient to cause mortar spalling (PCA, 2003). Other recommendations for field scale
resistance include limiting the water-cementitious ratio to 0.45 and providing proper
finishing after bleed water has evaporated (ACI Committee 201,1992). During fall
construction a minimum moist curing period of 7 days is recommended for strength
development of the surface layer and a minimum one month surface drying following
moist curing is recommended in order to reduce excess surface moisture prior to onset of
the first freeze-thaw cycle. When supplementary cementitious materials like slag cement
1

or flyash are incorporated into the cementitious blend, the recommended limits for
replacement levels are 50% for slag cement and 25% for flyash by mass of total
cementitious (PCA Bulletin, 2003).
Purpose and Scope
The purpose of the project is to conduct a comprehensive investigation to identify major
factors for the varied freeze-thaw performance, and determine quantitative relations, if
possible, between air-void system and freeze-thaw performance associated with deicer
scaling resistance. Also, the influence of slag-cement on freeze-thaw resistance will be
evaluated for the low cement content, MDOT P-1 MOD mix.
The project scope includes a laboratory freeze-thaw study of core samples from
distressed younger pavements (< 8 years) in the vicinity of the distressed areas and older
pavements without the joint distress in order to determine threshold values for the air-
void system (total air and spacing factor) characteristic for good longer-term (>10 years)
field performance.
The air-void system in the hardened concrete (entrained air, entrapped air, air-void in-
filling) will be determined following ASTM C457 procedures, while freeze-thaw testing
is based on a German freeze-thaw test procedure for two different surface exposure
conditions (water versus 3% NaCl solution).
The cause of surface scaling and specimen cracking is investigated by digital stereo
microscope.
Project Benefit/Implementation
The expected findings from this study will provide the understanding and necessary
evidence to modify specifications and construction practices to prevent future
occurrences of similar premature deterioration caused by the durability factors discovered
during this study.
2

Report Outline
The research methodology is presented in chapter 2. Results and major findings are
presented in chapter 3. In chapter 4 conclusions and recommendations are presented.
Chapter 5 has an implementation plan. References are in chapter 6. Appendix A contains
additional test results and Appendix B contains the P-1 MOD mix composition for the
US-131 overlay project.
3
2. Methodology 2.1 Field Projects
The field projects selected for laboratory testing are briefly summarized in table 2.1. Four
projects had developed MRD at joints within 8 years, while four older projects, including
two from the Aggregate Test Road, were without MRD. In addition, materials were
obtained from an on-going overlay project on US-131 in order to isolate specific concrete
material variables such as air content and slag cement on freeze-thaw resistance.
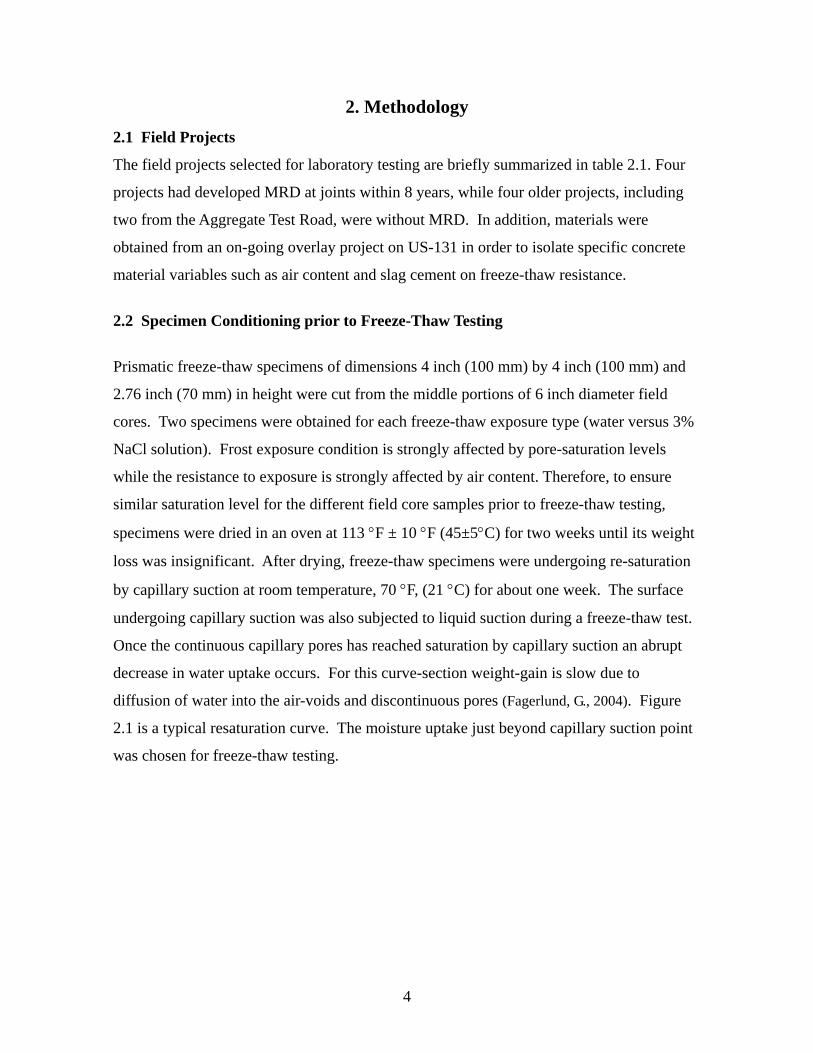
2.2 Specimen Conditioning prior to Freeze-Thaw Testing
Prismatic freeze-thaw specimens of dimensions 4 inch (100 mm) by 4 inch (100 mm) and
2.76 inch (70 mm) in height were cut from the middle portions of 6 inch diameter field
cores. Two specimens were obtained for each freeze-thaw exposure type (water versus 3%
NaCl solution). Frost exposure condition is strongly affected by pore-saturation levels
while the resistance to exposure is strongly affected by air content. Therefore, to ensure
similar saturation level for the different field core samples prior to freeze-thaw testing,
specimens were dried in an oven at 113 °F ± 10 °F (45±5°C) for two weeks until its weight
loss was insignificant. After drying, freeze-thaw specimens were undergoing re-saturation
by capillary suction at room temperature, 70 °F, (21 °C) for about one week. The surface
undergoing capillary suction was also subjected to liquid suction during a freeze-thaw test.
Once the continuous capillary pores has reached saturation by capillary suction an abrupt
decrease in water uptake occurs. For this curve-section weight-gain is slow due to
diffusion of water into the air-voids and discontinuous pores (Fagerlund, G., 2004). Figure
2.1 is a typical resaturation curve. The moisture uptake just beyond capillary suction point
was chosen for freeze-thaw testing.
4

5
Laboratory concrete specimens for the US-131 pavement were cast in teflon molds in
accordance with the German test procedure. These specimens had slightly larger contact
surface area than the field core samples (5.9 inch by 4.33 inch), but same thickness (2.76
inch). They were cured for 28 days, dried and re-saturated similar to the field specimens.
0
0.2
0 5 10 15
Square Root Time (
Wat
er A
bsor
ptio
n (lb
/ft
0.4
0.6
0.8
1
1.2
1.4
1.6
20 25
hr0.5)
2 )
Figure 2.1 Typical saturation curve
6
Table 2. 1 List of projects involved in the study
PROJECT Pavement Type DESIGN PARAMETERS Distress Description
Route CS PN Location Project Year SlabLength Opened L T Coarsemiles (ft) (in) Agg. Type
M-14 EB 81105 34962 I-94 to US-23 BR (Main Street) 3.48 2000 JPCP 15 11.0 Natural Gravel (81-84) Long. Joint deterioration & joint spallingM-46 74062 47172 Goetze Road to M-25 4.52 1999 Overlay 12 6.0 Dolomitic starburst cracking with
Limestone 6AA, (32-4) associated joint spallingUS-23 SB 58034 32750A Agg Test Road Section A 1.09 1993 JRCP 27 10.5 Dolomite (93-03) No staining or starburst condition
Agg Test Road Section B 0.95 1993 JRCP 27 10.5 Blast-Furnace Slag (82-22)No staining or starburst conditionI-69 19042& 76024 01978A West of Peacock Rd. to East of Shaftburg Rd 4.98 1991 JRCP 41 9.0 Blast Furnace Slag (82-19) No staining or starburst condition
I-94 WB 80023 45859 W of 62nd Street to W of M-51 8.50 2000 JPCP 15 11 Limestone ( 71-03) Joint spalling, long. partial depth cracking; long joint deterioration
US-23 NB 58034 32750A K-19sta 340+85 to sta 347+30 0.12 1993 JPCP 15 11 Dolomite (93-03) Starburst cracking & associated spallingUS-23 NB 58034 32750A Section #2 Sta 265+77 to 270+90 (513 ft) 0.20 1994 JPCP 15 10.5 Dolomite (93-03) No staining or starburst condition
US-131 41132 50758 West River Drive North to 10 mile Rd. 6.43 2008 Overlay 12 6.5 Limestone (75-05) No staining or starburst condition

2.3 Freeze-Thaw Testing
Laboratory tests based on the German CDF (Capillary suction, De-icing agent and
Freeze-thaw test), and CIF (Capillary suction, Internal damage and Freeze-thaw test)
procedure are described in detail in the Appendix. Additional moisture uptake associated
with freeze-thaw damage was determined.
A freeze-thaw cycle has a 12 hour duration, consisting of a linear temperature lowering
from 68 °F (20 °C) to – 4 °F (-20 °C) at a rate of 18 °F/hour (10 °C/hour), followed by a
constant temperature of – 4 oF (–20°C) for 3 hours, the a heating rate of 18 °F/hour (10
°C/hour) for 4 hours. The specimen surface in tact with the liquid is subjected to this
temperature profile. The temperature is kept at 68 °F (20 °C) for 1 hour before
commencement of the next freeze-thaw cycle. During this time measurements are made.
The freeze-thaw machine is shown in figure 2.2 with 10 stainless steel-bowls, each
containing one specimen.
Figure 2.2 Freeze-Thaw Machine (www.schleibinger.com)
7

Each specimen is sitting on spacers so that the bottom test surface is in contact with the
test liquid (either water or 3% NaCl solution) as shown in figure 2.3 a and b.
(a) (b)
Figure 2.3 Close-up of specimen test (a) and actual test specimen with bottom test surface in contact with liquid, in this case in a frozen condition (b).
To prevent liquid uptake and scaling from the lateral surfaces the specimens are sealed
using aluminum foil lined with butyl rubber (figure 2.3b) on the inside. Mass-loss from
surface scaling and internal damage are determined after 4 to 6 consecutive freeze-thaw
cycles.
At time of measurement each specimen is placed in an ultrasonic cleaning bath for
removal of the scaled material, and the material is collected and dried at 212 °F (100 °C)
for 24 hours, then allowed to cool to room temperature for one hour and weighed dry.
2.4 Examination of Specimen Surface and Scaled Particles by Digital Microscopy
In order to understand the damage mechanisms associated with freeze-thaw, the specimen
surface and the scaled material were analyzed periodically in the digital microscope,
figure 2.4.
8

Figure 2.4 Digital microscope setup.
2.5 Air Void Analysis
Determination of the air-void content was conducted according to ASTM C 457
“Standard Practice for Microscopical Determination of Parameters of the Air-Void
System in Hardened Concrete”, by methods A (linear traverse) and B (modified point-
count).
Four by four inch by about 0.75 inch (20 mm) thick specimens were cut from the middle-
portion of core samples with the measuring surface parallel to the top surface. This
sectioning was selected based on preliminary test results showing substantial variations in
air content and freeze-thaw test results between top and bottom for some test sections.
Two samples were obtained for each pavement section and polished using a concrete
polisher seen in figure 2.5.
9

Figure 2.5 Concrete polisher (www.concrete-experts.com)
Point count analysis for paste, total air and aggregate content and infilling of air was
conducted on the polished concrete samples (Figure 2.7a). Air-void chord-size
distribution was determined by an automated procedure (RapidAir 457 Air Void
Analyzer) which required contrast enhancement. Air-voids were filled with white
particles ( ) and the surface was colored with black ink (Figure 2.7b). 4BaSO
a) b)
Figure 2.6 Sample surface after polishing (a), and the same surface after contrast enhancement (b).
10

3. Results and Discussion 3.1 Field Observations Field observations show that joint associated distress is most pronounced at the joint corners and additional
joint spalling develops in the longitudinal joints (figure 3.1). Transverse joint staining was found to be
associated with this type of distress (figure 3.2). Occasional transverse joint spalling was found near the
outside shoulder away from wheel-load area. This is likely a water accumulation problem due to the
pavement cross slope (figure 3.2).
Figure 3.1 Joint associated distress (EB, M-14, Ann Arbor).
Figure 3.2 Transverse joint staining and spalling near outside shoulder (WB, I-94, Lawrence, MI).
11

A unique situation exists on WB, I-94, Lawrence, where a small part of the section at time of investigation
(August, 2008) has no joint associated distress (i.e. no spalling and joint staining) while the remaining
section has developed distress (figure 3.3). Additional transverse joint spalling was associated with
longitudinal cracks running in a straight line between transverse joints. The crack pattern was typical for
vibrator trails due to over-vibration of the concrete during paving operation. No vibrator trails were
observed in the section without distress. These crack intercepts at the transverse joints were points of spall
initiation just below the tined surface (figure 3.4 and 3.5). In figure 3.5 coring on one side of the joint spall
show that joint deterioration has developed only in the top few inches. Figure 3.6 is another example of
transverse joint deterioration outside the wheel-path, showing that concrete deterioration is due to erosion
of the mortar. Extensive longitudinal joint associated distress has developed for both the M-14 and the I-94
projects. Coring on the I-94 project demonstrated that water was trapped in the joint due to tight crack
opening (figure 3.7). Core samples were obtained from midslab and joint areas for freeze-thaw testing and
air-void analysis.
Figure 3.3 WB I-94, Lawrence, MI, showing end of section without joint distress and the beginning of the
section with distress.
12

Figure 3.4 Longitudinal cracks at transverse joints initiate joint associated distress just below the tined surface.
Figure 3.5 Close-up of joint deteriorated concrete (WB, I-94, Lawrence, MI).
(a) (b) Figure 3.6 (a) WB, I-94, transverse joint spalling deterioration at intercept of longitudinal crack from
vibrator trails, and (b) deterioration initiation just below the tined surface from mortar erosion.
13
(a) (b)
Figure 3.7 WB I-94, Lawrence, MI, with longitudinal joint deterioration (a), and (b) poorly draining joint.
3.2 Laboratory Freeze-Thaw Test Results
Results in figure 3.8 corroborate field observations for the WB, I-94, Lawrence, project, where one section
has no distress while the adjoining section has extensive joint associated distress. The concrete from the
distressed area failed quickly (< 10 cycles) in the deicer scaling test while the concrete without any field
distress had substantially better deicer scaling resistance with 75% less surface scaling for same number of
freeze-thaw cycles. Photos (figure 3.9) of the specimen exposure surfaces illustrate extensive erosion of the
mortar phase after only 10 freeze-thaw cycles while the erosion is limited in the concrete without any field
distress. The major factor for the poor laboratory frost resistance is insufficient air content. The concrete
with poor freeze-thaw resistance and field distress has 3.8% total air content, while the field concrete with
no distress has 5.9% air (ASTM C457).
14

I-94, WB,CS 80023, August 2008 Deicer Scaling Resistance
00.20.40.60.8
11.21.41.6
0 10 20 30Number of freeze-thaw cycles
Sur
face
Sca
ling,
lb/ft2
40
Section 2 with joint associated distressSection 1 without joint associated distress
3.8% Air 5.9% Air
Figure 3.8 WB, I-94 test results for two different sections.
(a) (b) Figure 3.9 Concrete exposure surface from WB I-94, Lawrence, without associated joint distress (a) after 12 freeze-thaw cycles, and (b) from the distressed area after 10 freeze-thaw cycles. Scaling resistance for the field concrete can be divided into two distinctly different groups as seen in figure
3.10. One group, consisting of the concrete pavements with distress (M-14, M-46, US-23 NB (K-19), I-94),
has rapid scaling of the mortar and extensive mortar erosion within 5 to 10 freeze-thaw cycles (figure
3.10a), while the group without distress has 5 to 10 times lower scaling. These concrete projects include
one section on WB I-94 discussed above which has no joint associated distress at time of this investigation
(August 2008). Despite the higher air-content (5.8%) this concrete has twice the scaling rate as compared to
the other projects in this group.
15
Deicer Scaling Resistance
00.20.40.60.8
11.21.41.6
0 10 20 30 40 50
Freeze-Thaw cycles
surfa
ce sc
alin
g, lb
/ft2
M-14 M-46 US-23 NB (K-19) WB I-94 section with distress
Deicer Scaling Resistance
00.20.40.60.8
11.21.41.6
0 10 20 30 40 50Freeze-Thaw cycles
surfa
ce sc
alin
g, lb
/ft2
I-69 US-23 NB Sec 2US-23 SB Sec A US-23 SB Sec. BWB I-94 section without distress
(a) (b)
Figure 3.10 Laboratory deicer scaling results for field concrete projects with (a) and without (b) joint associated distress
The scaling development is approximately linear with number of cycles (figure 3.10). This is consistent
with findings from another study by Pinto and Hover (2001) based on a ponding test (ASTM C672).
Therefore, the scaling rate (lb/ft2 /cycle) can be considered an inherent concrete property of resistance to
deicer salt exposure during freeze-thaw cycle. For similar water-cement ratios and mix designs, which is
typical for highway concrete, improved resistance to frost in general is achieved through air-entrainment.
Typically, total air is used in specifications due to the ease of measurement of air in fresh concrete. Thus,
scaling rate and air content, as a first measure, may provide insight into field resistance of hardened
concrete. Results in figure 3.11 show a strong correlation between scaling rate and total air content. Closed
symbols refer to pavements with joint associated distress while open symbols are for projects without
distress. The results are for each specimen per test and thus shows for some test sections considerable
variation in scaling resistance between two different core samples (M-14, M-46), which is attributed to
paste in homogeneity. The concrete with premature joint associated distress have higher scaling rates due
to lower total air content (entrained plus entrapped air), while the concretes without field distress have
lower scaling rates and higher air content, consistent with expectations.
16

Deicer Scaling Rate
0
0.05
0.1
0.15
0.2
3 4 5 6 7 8 9Total Air Content, %
Rat
e Su
rface
Sca
ling,
lb/ft2
/cyc
le
10
M-14 M-46US-23 NB (K-19) I-94 section with joint associated distressSB-US23 Section A SB US-23 Section BNB US-23, Section 2 I-69I-94 section without joint associated distress
Figure 3.11 Deicer scaling rate for field concrete versus air content. The results here suggest that total air exceeding about 5.8% can result in frost resistant concrete for a severe
exposure condition (i.e. salt frost attack). From Table 3.1, an average value for infilling is 18.9% of total.
This translates into a minimum recommended fresh air content of slightly over 7%, when taking into
account that infilling of air-voids over time can be expected in the joint area.
17

Table 3.1 Summary air-void results based on point-count method
PROJECT Air Void Analysis by Point-Count MethodRoute CS PN Estimated original Present total
Infilling total air content Air ContentPercent Percent Percent
M-14 EB 81105 34962 1.5 5.8 4.3M-46 74062 47172 1.2 6.3 5.1
US-23 SB Section A 58034 32750A 1.0 6.7 5.7US-23 SB Section B 58034 32750A 1.4 7.7 6.3
I-69 19042& 76024 01978A - - -I-94 WB (section without distress) 80023 45859 1.6 7.5 5.9
I-94 WB (section with joint distress) 80023 45859 1.0 4.8 3.8US-23 NB (K-19) 58034 32750A 2.0 5.8 3.8
US-23 NB (Section 2) 58034 32750A 1.0 6.8 5.8
An example of infilling is shown in Figure 3.12. The white powder seen inside the air-voids is most likely
salt since water-sorption tests on dried field-samples showed presence of salt. During water absorption test
of freeze-thaw specimens, salt crystallization in the porous interface between coarse aggregate and the paste
was common for the I-94 concrete (figure 3.12b). The I-94 section had received substantial amounts of
road-salt during winter periods.
(a) (b)
Figure 3.12 Air void infilling (a) and crystallization of salt on the surface during water sorption test for WB I-94 concrete obtained from joint area in the section with joint associated distress.
18
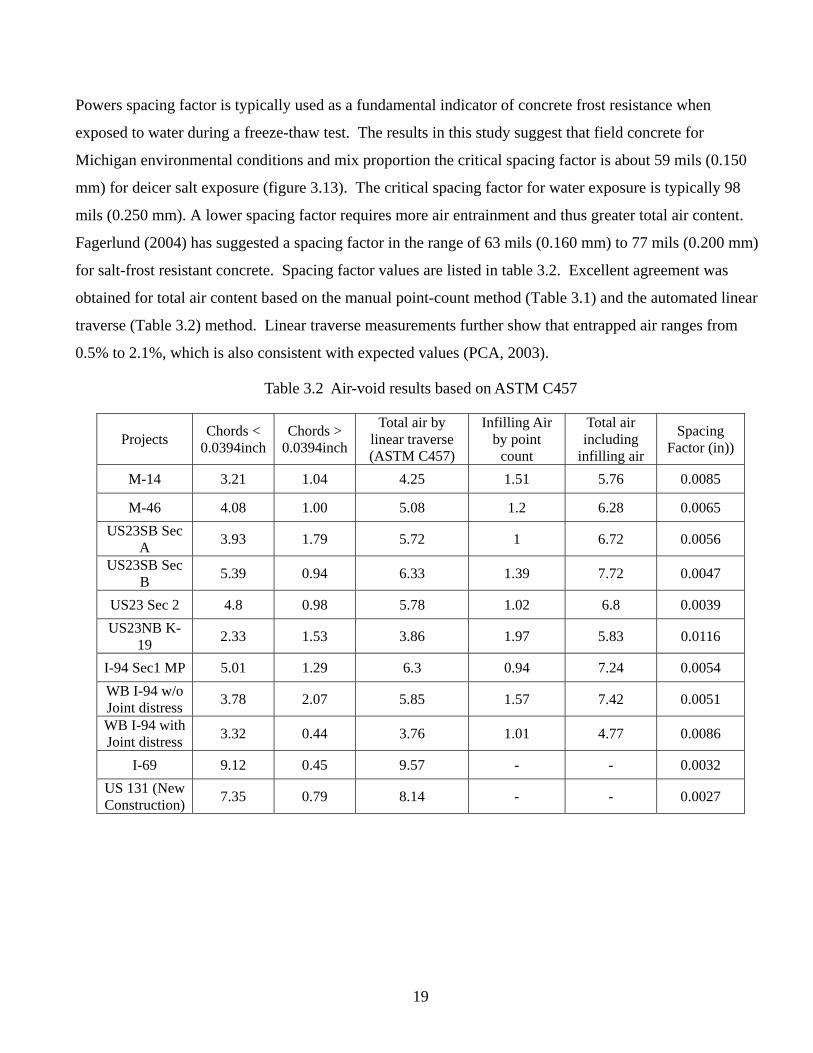
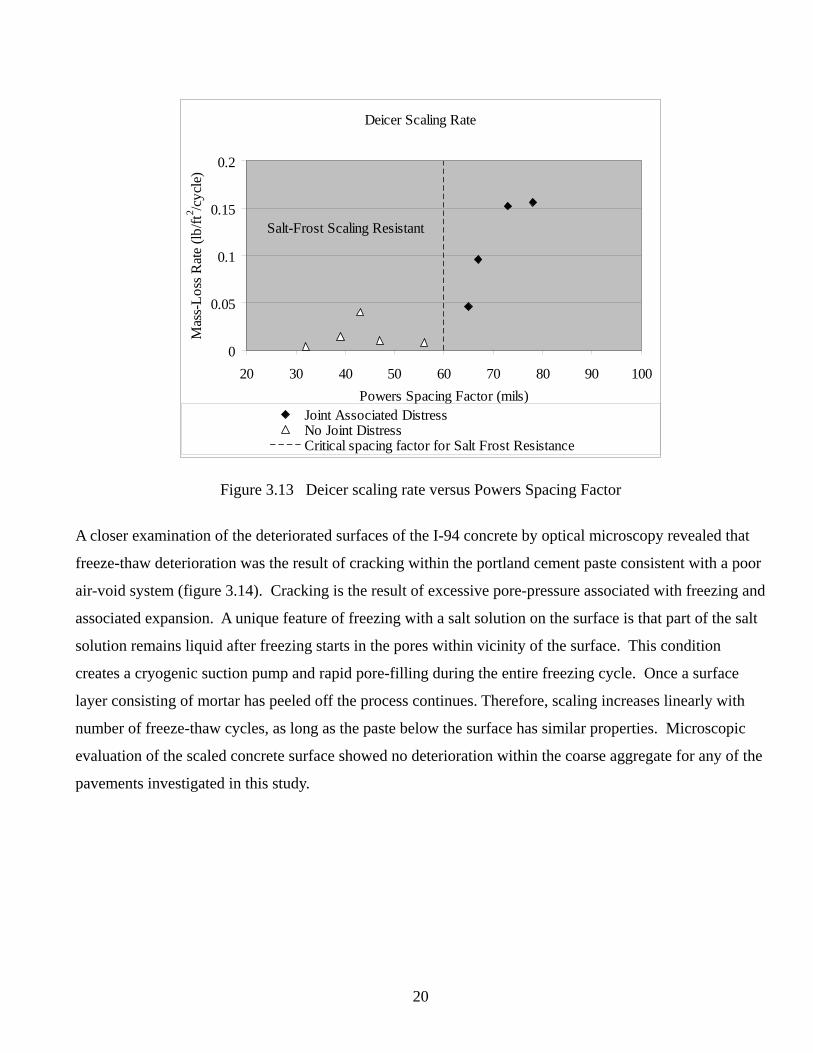
Powers spacing factor is typically used as a fundamental indicator of concrete frost resistance when
exposed to water during a freeze-thaw test. The results in this study suggest that field concrete for
Michigan environmental conditions and mix proportion the critical spacing factor is about 59 mils (0.150
mm) for deicer salt exposure (figure 3.13). The critical spacing factor for water exposure is typically 98
mils (0.250 mm). A lower spacing factor requires more air entrainment and thus greater total air content.
Fagerlund (2004) has suggested a spacing factor in the range of 63 mils (0.160 mm) to 77 mils (0.200 mm)
for salt-frost resistant concrete. Spacing factor values are listed in table 3.2. Excellent agreement was
obtained for total air content based on the manual point-count method (Table 3.1) and the automated linear
traverse (Table 3.2) method. Linear traverse measurements further show that entrapped air ranges from
0.5% to 2.1%, which is also consistent with expected values (PCA, 2003).
Table 3.2 Air-void results based on ASTM C457
Projects Chords < 0.0394inch
Chords > 0.0394inch
Total air by linear traverse (ASTM C457)
Infilling Air by point
count
Total air including
infilling air
Spacing Factor (in))
M-14 3.21 1.04 4.25 1.51 5.76 0.0085
M-46 4.08 1.00 5.08 1.2 6.28 0.0065 US23SB Sec
A 3.93 1.79 5.72 1 6.72 0.0056
US23SB Sec B 5.39 0.94 6.33 1.39 7.72 0.0047
US23 Sec 2 4.8 0.98 5.78 1.02 6.8 0.0039 US23NB K-
19 2.33 1.53 3.86 1.97 5.83 0.0116
I-94 Sec1 MP 5.01 1.29 6.3 0.94 7.24 0.0054 WB I-94 w/o Joint distress 3.78 2.07 5.85 1.57 7.42 0.0051
WB I-94 with Joint distress 3.32 0.44 3.76 1.01 4.77 0.0086
I-69 9.12 0.45 9.57 - - 0.0032 US 131 (New Construction) 7.35 0.79 8.14 - - 0.0027
19
Deicer Scaling Rate
0
0.05
0.1
0.15
0.2
20 30 40 50 60 70 80 90 100Powers Spacing Factor (mils)
Mas
s-Lo
ss R
ate
(lb/ft
2 /cyc
le)
Joint Associated DistressNo Joint DistressCritical spacing factor for Salt Frost Resistance
Salt-Frost Scaling Resistant
Figure 3.13 Deicer scaling rate versus Powers Spacing Factor
A closer examination of the deteriorated surfaces of the I-94 concrete by optical microscopy revealed that
freeze-thaw deterioration was the result of cracking within the portland cement paste consistent with a poor
air-void system (figure 3.14). Cracking is the result of excessive pore-pressure associated with freezing and
associated expansion. A unique feature of freezing with a salt solution on the surface is that part of the salt
solution remains liquid after freezing starts in the pores within vicinity of the surface. This condition
creates a cryogenic suction pump and rapid pore-filling during the entire freezing cycle. Once a surface
layer consisting of mortar has peeled off the process continues. Therefore, scaling increases linearly with
number of freeze-thaw cycles, as long as the paste below the surface has similar properties. Microscopic
evaluation of the scaled concrete surface showed no deterioration within the coarse aggregate for any of the
pavements investigated in this study.
20
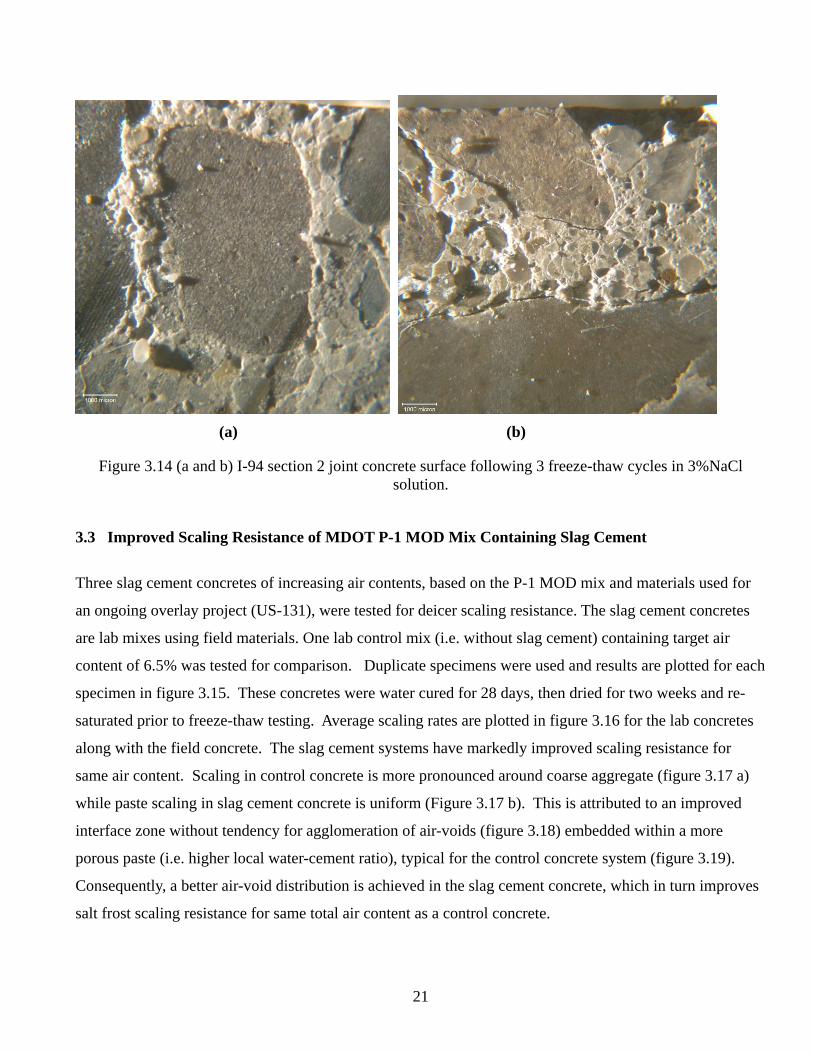
(a) (b)
Figure 3.14 (a and b) I-94 section 2 joint concrete surface following 3 freeze-thaw cycles in 3%NaCl solution.
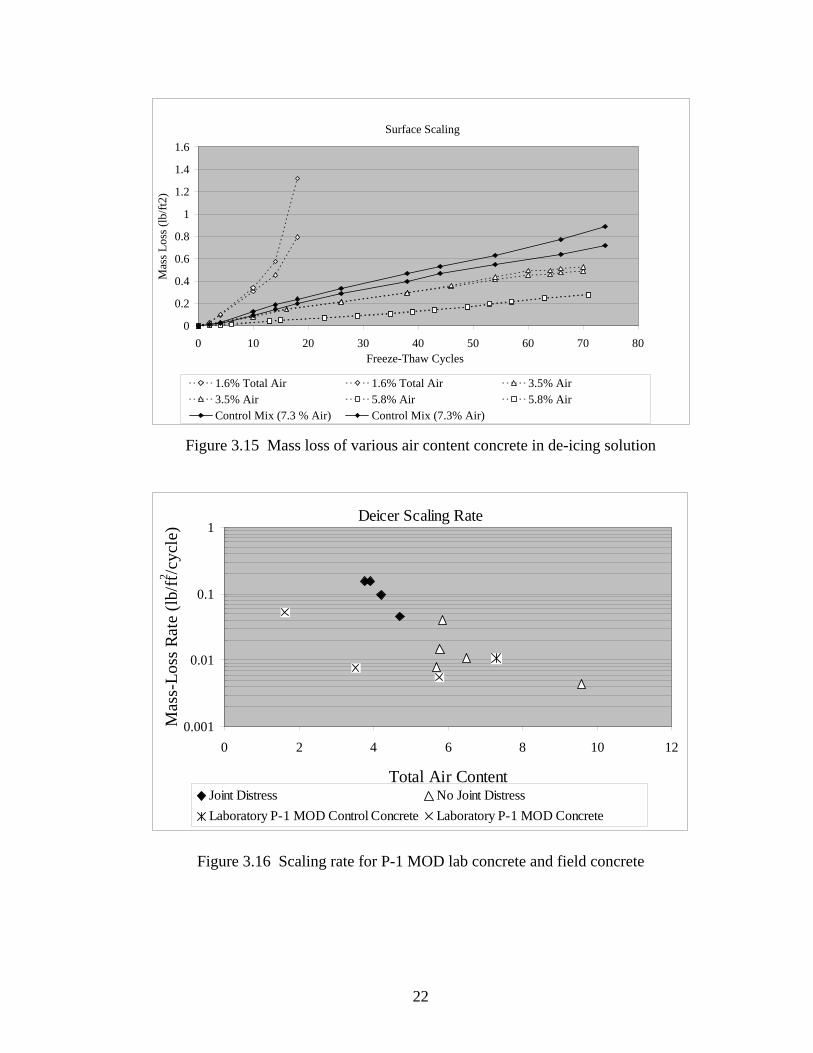
3.3 Improved Scaling Resistance of MDOT P-1 MOD Mix Containing Slag Cement
Three slag cement concretes of increasing air contents, based on the P-1 MOD mix and materials used for
an ongoing overlay project (US-131), were tested for deicer scaling resistance. The slag cement concretes
are lab mixes using field materials. One lab control mix (i.e. without slag cement) containing target air
content of 6.5% was tested for comparison. Duplicate specimens were used and results are plotted for each
specimen in figure 3.15. These concretes were water cured for 28 days, then dried for two weeks and re-
saturated prior to freeze-thaw testing. Average scaling rates are plotted in figure 3.16 for the lab concretes
along with the field concrete. The slag cement systems have markedly improved scaling resistance for
same air content. Scaling in control concrete is more pronounced around coarse aggregate (figure 3.17 a)
while paste scaling in slag cement concrete is uniform (Figure 3.17 b). This is attributed to an improved
interface zone without tendency for agglomeration of air-voids (figure 3.18) embedded within a more
porous paste (i.e. higher local water-cement ratio), typical for the control concrete system (figure 3.19).
Consequently, a better air-void distribution is achieved in the slag cement concrete, which in turn improves
salt frost scaling resistance for same total air content as a control concrete.
21
Surface Scaling
0
0.2
0.4
0.6
0.8
1
1.2
1.4
1.6
0 10 20 30 40 50 60 70 80Freeze-Thaw Cycles
Mas
s Los
s (lb
/ft2)
1.6% Total Air 1.6% Total Air 3.5% Air3.5% Air 5.8% Air 5.8% AirControl Mix (7.3 % Air) Control Mix (7.3% Air)
Figure 3.15 Mass loss of various air content concrete in de-icing solution
Deicer Scaling Rate
0.001
0.01
0.1
1
0 2 4 6 8 10
Total Air Content
Mas
s-Lo
ss R
ate
(lb/ft
2 /cyc
le)
12
Joint Distress No Joint DistressLaboratory P-1 MOD Control Concrete Laboratory P-1 MOD Concrete
Figure 3.16 Scaling rate for P-1 MOD lab concrete and field concrete
22
(a) (b)
Figure 3.17 Control concrete with 7.3 % air (a), and slag-cement concrete with 5.8 % air after 42 freeze-thaw cycles in salt solution
Figure 3.1 Typical interface zone in slag cement concrete
23
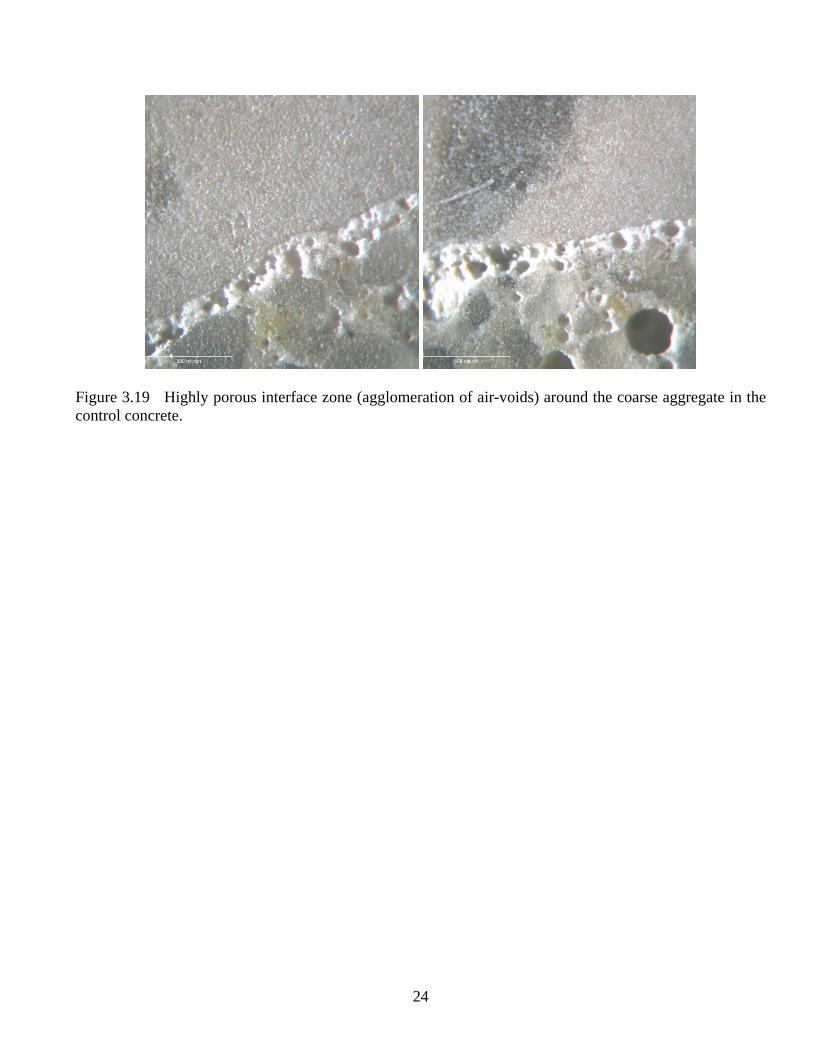
Figure 3.19 Highly porous interface zone (agglomeration of air-voids) around the coarse aggregate in the control concrete.
24

4. Conclusions and Recommendations Materials related distress (MRD) characterized by “starburst” type corner spalling at the
longitudinal centerline joint, and occasional transverse joint spalling have developed at a
rapid rate in a number of JPCP projects constructed since 1999. The main objective for
this project was to isolate the major cause(s) for suspected freeze-thaw deterioration, and
to provide recommendations for improved materials specifications in order to ensure
long-term freeze-thaw resistance to severe surface exposure conditions (i.e. surface
contact with either water or 3% NaCl) during repeated freezing and thawing. Four
younger (<10 years) field projects with this type of MRD and four older field projects
without MRD were selected for laboratory freeze-thaw testing for two different exposure
conditions (water and 3% NaCl) during cyclic freeze-thaw.
The major findings of this study are:
• Laboratory freeze-thaw test results and air-void analysis clearly demonstrated the
cause for the joint associated distress which has developed in a number of JPCP’s
since 1999. The four selected projects with this type of distress suffer from
inadequate air-entrainment, which lowers freeze-thaw resistance to deicer salt
solution.
• The air-void system was found to be in-adequate for a severe exposure condition
which exists at poorly draining joints when a concrete surface is exposed to deicer
salt solution during freeze-thaw.
• Threshold values for total air content and maximum spacing factor were
developed, which can form the basis for improved material specifications for
obtaining frost resistance in the field for Michigan environmental conditions.
• MDOT’s P-1 MOD concrete containing slag cement had improved deicer frost
resistance as slag cement improves the paste-aggregate interface zone, which
reduces water sorptivity rate and amount of water uptake as compared to a control
concrete. Air-void agglomeration around the coarse aggregate was common in
the field concrete and absent in the slag cement concrete. These factors have a
major impact on frost resistance.
25

The major recommendations are:
• Increase minimum target air content in fresh concrete to about 7%, up from the
current minimum of 5%. Supplementary cementitious materials such as slag
cement can improve paste quality and deicer scaling resistance. The results here
suggest that a reduction in the minimum air content is feasible using a P-1 MOD
slag cement concrete. However, further testing is needed.
• Ensure that the base and subsurface is sufficiently drained so that water and deicer
solutions are not permitted to accumulate at or beneath joints or other
discontinuities in the concrete pavement surface. Ensuring adequate drainage will
reduce the likelihood that the surrounding concrete at joints will become critically
saturated, thus, reducing the risk for MRD and premature deicer-related freeze-
thaw deterioration.
26
5. Implementation of Study Findings.
The findings from this study has provided the understanding and necessary evidence to
modify specifications and construction practices to prevent future occurrences of similar
premature deterioration caused by the durability factors discovered during this study.
The steps involved to implement the study’s findings, after review and acceptance by the
department, are similar to other past efforts to modify a specification, or when new
requirements for construction are adopted. These steps are generally:
Education –A combination of test methods including a German based freeze-thaw
method, air-void analysis according to ASTM C457, microscopic evaluation of
deterioration, and water sorptivity tests have been proven effective in understanding
the causes for the rapid deterioration of the field concrete in several Michigan
pavements constructed since 1999. A better understanding of these causes can
provide better solutions to improving concrete pavement performance.
Communication - The department will need to explain the need for the additional
acceptance criteria to the construction industry through their in-place committee
contacts.
Preparation/Development - The department will need to revise current
requirements for air content in fresh concrete and need to incorporate SCM
(supplementary cementitious materials) in concrete mixtures for pavement
applications.
Surface Treatment Method to improve Deicer Scaling Resistance of Existing
JPCP’s-
There is evidence that surface sealers could be effective in reducing surface scaling
rate. This should be evaluated for projects which have poor deicer scaling
resistance such as the I-94 JPCP near Lawrence or M-14, Ann Arbor, K-19 on NB
US-23, and M-46. Especially, joint areas are expected to benefit from surface
treatment.
27

Summary: Education and communication between the Department and Industry
are essential in improving service life of JPCP. The following points should be
emphasized:
• Agreement on the causes and solutions to prevent starburst F-T deterioration in
JPCP.
• How to improve existing construction practices and quality control procedures to
eliminate this problem.
• Identify new QC/QA procedures that may be needed.
28

6. References ACI Committee 201, “Guide to Durable Concrete”, American Concrete Institute,
pp.1-41 (1992).
American Concrete Pavement Association, “Scale-Resistant Concrete Pavements”,
p.1-2, IS117.02P, (1996).
ASTM C457, “Standard Practice for Microscopical Determination of Parameters of
the Air-Void System in Hardened Concrete”, American Society for Testing and
Materials (ASTM International), pp.1-14, Vol. 04-02.
ASTM C672, “Test Method for Scaling Resistance of Concrete Surfaces Exposed to
Deicing Chemicals”, American Society for Testing and Materials (ASTM
International), pp.1-3, Vol. 04.02.
Fagerlund, G., “A service life model for internal frost damage in concrete”, Division
of Building Materials, Lund Institute of Technology, Report TVBM-3119, pp.1-48,
(2004).
Pinto, C.A. and Hover, K.C., “Frost and Scaling Resistance of High-Strength
Concrete”, R&D Bulletin, RD122.01, Portland Cement Association, pp.1-69, (2001).
Portland Cement Association Bulletin EB001.14, “Design and Control of Concrete
Mixtures”, (revised 2003).
“Rapid Air457 Air Void Analyzer”, Concrete Experts International, Copenhagen,
Denmark, 2007.
RILEM TC 117-FDC, “TC 117-FDC Recommendation - CDF test - Test method for
the freeze- thaw and deicing resistance of concrete - Tests with sodium chloride
(CDF)”, Journal, Materials and Structures, Vol. 29, pp.523-528, (1996).
29

Appendix A-Test Results Nomenclature: (2) refers to average value based on two specimens 1. Water Saturation Results:
Pre Saturation (M%): Water
0
1
2
3
4
5
6
7
0 1 2 3 4 5 6 7 8
Time (Day)
M%
M-46 (2) M-14 (2) I-69 (2)
US23 SB Sec A (2) US23 SB Sec B (2) US23 NB K19 (2)
Figure A-1 Moisture uptake due to pre-saturation in water
Pre Saturation (M%): De-icer
0
1
2
3
4
5
6
7
0 1 2 3 4 5 6 7 8
Time (Day)
M%
M-46 (2) M-14 (2) I-69 (2)
US23 SB Sec A (2) US23 SB Sec B (2) US23 NB K19 (2)
Figure A-2 Moisture uptake due to pre-saturation in 3% NaCl solution
30

2. Internal Damage
Evaluation of the internal damage: Water
0
0.2
0.4
0.6
0.8
1
1.2
0 10 20 30 40 50 60 70 80 90 10
Number of F-T cycles
Ru,
n(T
he r
elat
ive
dyna
mic
mod
ulus
of
elas
ticity
0
M-46 (2) M-14 (2) I-69 (2)US23 SB Sec A (2) US23 SB Sec B (2) US23 NB K19 (2)
Figure A-3 Relative damage due to combined freeze-thaw and water exposure
Evaluation of the internal damage: De-icer
0
0.2
0.4
0.6
0.8
1
1.2
0 10 20 30 40 50 60 70 80 90 10
Number of F-T cycles
Ru,
n(T
he r
elat
ive
dyna
mic
mod
ulus
of
elas
ticity
0
M-46 (2) M-14 (2) I-69 (2)US23 SB Sec A (2) US23 SB Sec B (2) US23 NB K19 (2)
Figure A-4 Relative damage due to combined freeze-thaw and deicer salt exposure
31

3. Scaling Resistance in water and 3% NaCl solution.
Mass Loss: Water Exposure
0
0.5
1
1.5
2
2.5
3
3.5
0 10 20 30 40 50 60 70 80 90 10
Number of F-T cycles
Mas
s Los
s (lb
/ft2 )
0
M-46 (2) M-14 (2) I-69 (2)US23 SB Sec A (2) US23 SB Sec B (2) US23 NB K19 (2)
Figure A-5 Mass-loss due to freeze-thaw and water exposure
Mass Loss: De-icer Scaling
0
0.5
1
1.5
2
2.5
3
3.5
0 10 20 30 40 50 60 70 80 90 10
Number of F-T cycles
Mas
s Los
s (lb
/ft2 )
0
M-46 (2) M-14 (2) I-69 (2)US23 SB Sec A (2) US23 SB Sec B (2) US23 NB K19 (2)
Figure A-6 Mass-loss due to freeze-thaw and deicer salt exposure
32

4. Moisture Uptake During Freeze-Thaw Testing in water and 3% NaCl solution
Moisture Uptakes: Water
0
2
4
6
8
10
12
0 10 20 30 40 50 60 70 80 90 10
Number of F-T cycles
ΔWn
(M-%
)
0
M-46 (2) M-14 (2) I-69 (2)US23 SB Sec A (2) US23 SB Sec B (2) US23 NB K19 (2)
Figure A-7 Water uptake due to freeze-thaw and water exposure
Moisture Uptakes: De-icer
0
2
4
6
8
10
12
0 10 20 30 40 50 60 70 80 90 10
Number of F-T cycles
ΔWn
(M-%
)
0
M-46 (2) M-14 (2) I-69 (2)US23 SB Sec A (2) US23 SB Sec B (2) US23 NB K19 (2)
Figure A-8 Water uptake due to freeze-thaw and deicer salt exposure
33
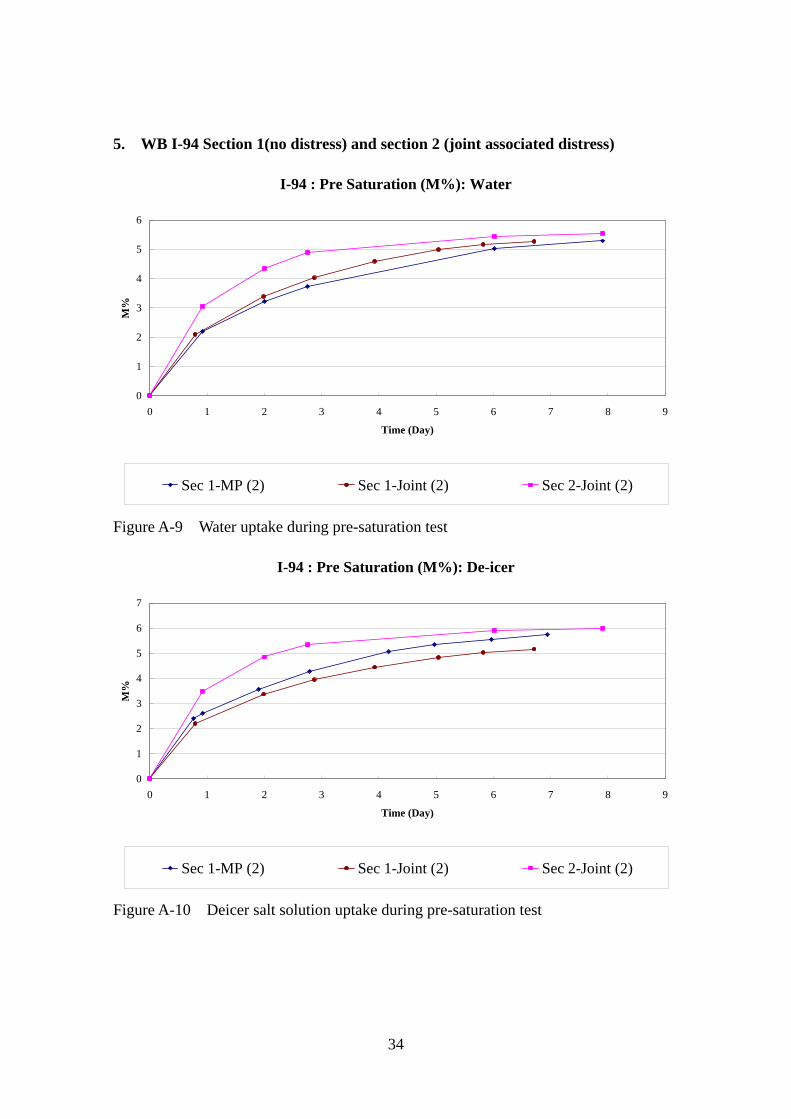
5. WB I-94 Section 1(no distress) and section 2 (joint associated distress)
I-94 : Pre Saturation (M%): Water
0
1
2
3
4
5
6
0 1 2 3 4 5 6 7 8
Time (Day)
M%
9
Sec 1-MP (2) Sec 1-Joint (2) Sec 2-Joint (2)
Figure A-9 Water uptake during pre-saturation test
I-94 : Pre Saturation (M%): De-icer
0
1
2
3
4
5
6
7
0 1 2 3 4 5 6 7 8
Time (Day)
M%
9
Sec 1-MP (2) Sec 1-Joint (2) Sec 2-Joint (2)
Figure A-10 Deicer salt solution uptake during pre-saturation test
34

I-94 : Evaluation of the internal damage: Water
0
0.2
0.4
0.6
0.8
1
1.2
0 5 10 15 20 25 30 35 40 45
Number of F-T cycles
Ru,
n(T
he r
elat
ive
dyna
mic
mod
ulus
of
elas
ticity
Sec 1-MP (2) Sec 1-Joint (2) Sec 2-Joint (2)
Figure A-11 Relative damage due to combined freeze-thaw and water exposure.
I-94 : Evaluation of the internal damage: De-icer
0
0.2
0.4
0.6
0.8
1
1.2
0 5 10 15 20 25 30 35 40 45
Number of F-T cycles
Ru,
n(T
he r
elat
ive
dyna
mic
mod
ulus
of
elas
ticity
Sec 1-MP (2) Sec 1-Joint (2) Sec 2-Joint (2)
Figure A-12 Relative damage due to combined freeze-thaw and deicer salt exposure.
35
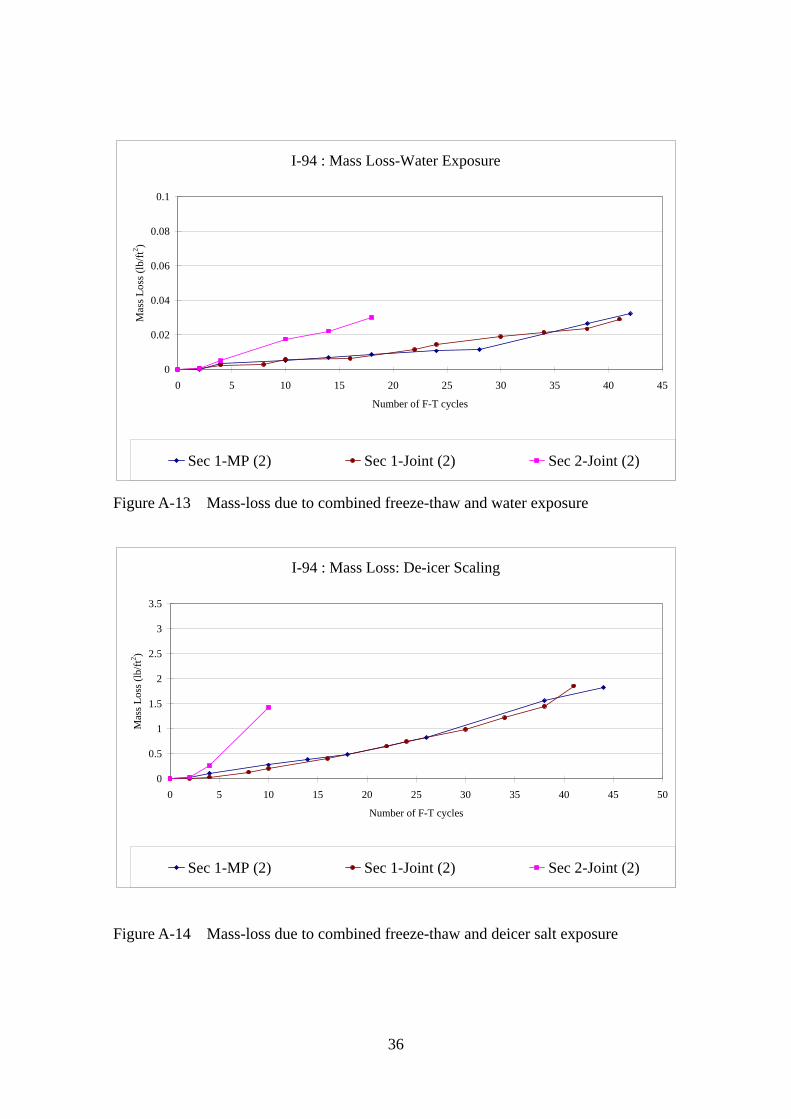
I-94 : Mass Loss-Water Exposure
0
0.02
0.04
0.06
0.08
0.1
0 5 10 15 20 25 30 35 40 45
Number of F-T cycles
Mas
s Los
s (lb
/ft2 )
Sec 1-MP (2) Sec 1-Joint (2) Sec 2-Joint (2)
Figure A-13 Mass-loss due to combined freeze-thaw and water exposure
I-94 : Mass Loss: De-icer Scaling
0
0.5
1
1.5
2
2.5
3
3.5
0 5 10 15 20 25 30 35 40 45 50
Number of F-T cycles
Mas
s Los
s (lb
/ft2 )
Sec 1-MP (2) Sec 1-Joint (2) Sec 2-Joint (2)
Figure A-14 Mass-loss due to combined freeze-thaw and deicer salt exposure
36
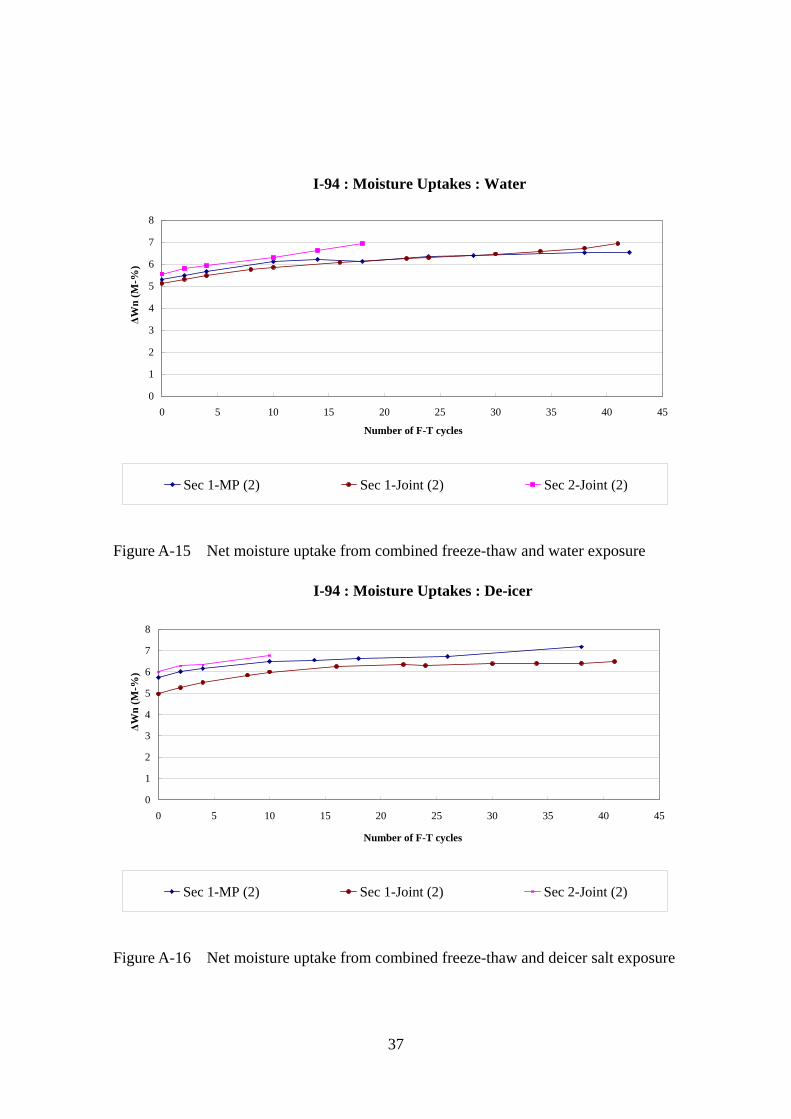
I-94 : Moisture Uptakes : Water
0
1
2
3
4
5
6
7
8
0 5 10 15 20 25 30 35 40 45
Number of F-T cycles
ΔWn
(M-%
)
Sec 1-MP (2) Sec 1-Joint (2) Sec 2-Joint (2)
Figure A-15 Net moisture uptake from combined freeze-thaw and water exposure
I-94 : Moisture Uptakes : De-icer
0
1
2
3
4
5
6
7
8
0 5 10 15 20 25 30 35 40 45
Number of F-T cycles
ΔWn
(M-%
)
Sec 1-MP (2) Sec 1-Joint (2) Sec 2-Joint (2)
Figure A-16 Net moisture uptake from combined freeze-thaw and deicer salt exposure
37
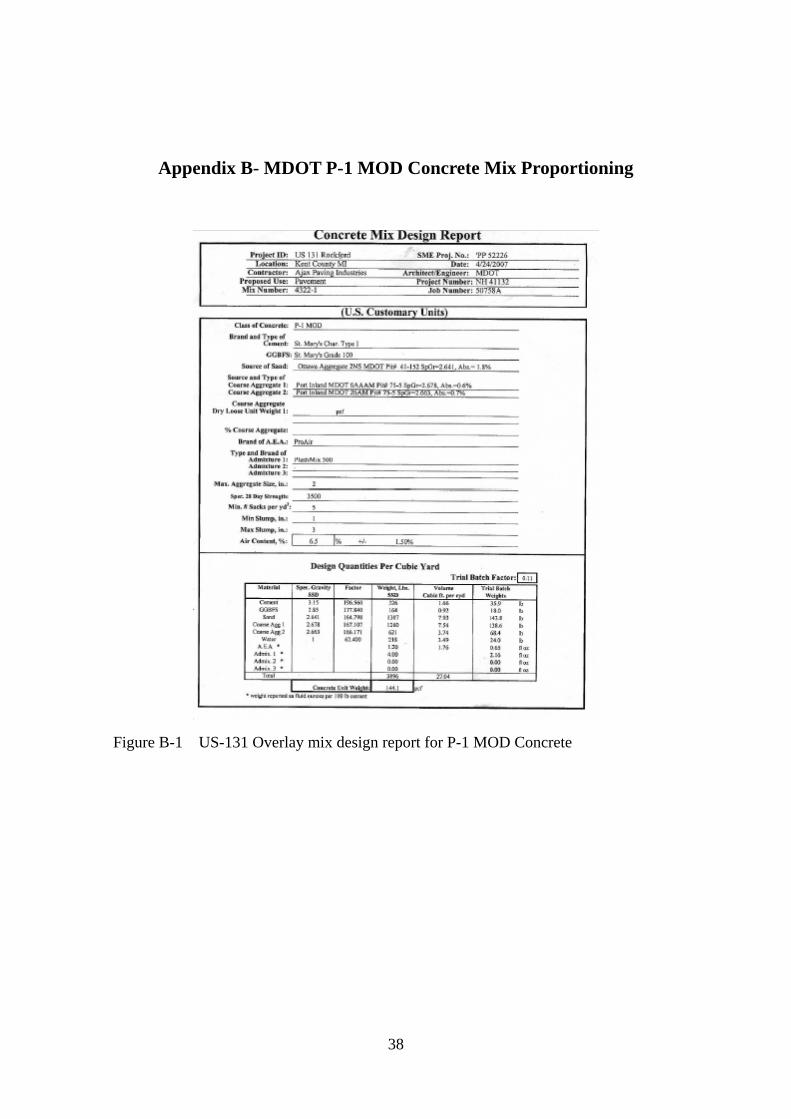
Appendix B- MDOT P-1 MOD Concrete Mix Proportioning
Figure B-1 US-131 Overlay mix design report for P-1 MOD Concrete
38