rbc group consolidated financial statements for the year...
TRANSCRIPT

RBC Group
Consolidated Financial Statements for the year ended 31 December 2010

RBC Group
Contents
Independent Auditor’s Report Consolidated Statement of Comprehensive Income 3 Consolidated Statement of Financial Position 5 Consolidated Statement of Cash Flows 7 Consolidated Statement of Changes in Equity 9 Notes to the Consolidated Financial Statements 13

RBC Group

RBBC Group

RBC Group Consolidated Statement of Comprehensive Income for the year ended 31 December 2010
The consolidated statement of comprehensive income is to be read in conjunction with the notes to, and forming part of, the consolidated financial statements set out on pages 13 to 82.
* The USD equivalent figures are provided for information purposes only and do not form part of the audited financial statements – refer to note 2(d).
3
2010
2009 Continuing operations
2009 Discontinued
operations 2009 Note Mln RUR Mln RUR Mln RUR Mln RUR
Revenue 8 3,479 3,043 8 3,051 Cost of sales 9 (2,324) (2,293) (3) (2,296) Gross profit 1,155 750 5 755 Other income 10 22 93 - 93 Selling expenses 11 (761) (758) - (758) Administrative expenses 12 (541) (500) (22) (522) Other expenses 13 (79) (38) - (38) Loss on disposal of discontinued operations 6 - (17) - (17) Impairment loss 18 - (516) - (516) Results from operating activities (204) (986) (17) (1,003) Financial income 14 73 17 18 35 Financial expenses 14 (1,670) (573) - (573) Share of profit of associates and joint ventures (net of income tax) 19 38 (755) - (755) Loss before income tax (1,763) (2,297) 1 (2,296) Income tax (expense)/benefit 15 (41) 406 (29) 377 Loss for the year (1,804) (1,891) (28) (1,919) Other comprehensive (loss)/ income Foreign currency translation differences for foreign operations (8) 5 - 5 Acquisition of subsidiaries - 3 - 3 Disposal of subsidiaries, net of income tax - (3) - (3) Other comprehensive (loss)/ income for the year, net of income tax (8) 5 - 5 Total comprehensive loss for the year (1,812) (1,886) (28) (1,914) (Loss)/income attributable to:Shareholders of the Company (1,823) (1,896) (30) (1,926) Non-controlling interest 19 5 2 7 Loss for the year (1,804) (1,891) (28) (1,919) Total comprehensive (loss)/income attributable to: Shareholders of the Company (1,831) (1,891) (30) (1,921) Non-controlling interest 19 5 2 7 Total comprehensive loss for the year (1,812) (1,886) (28) (1,914) Loss per share Basic loss per share, RUR 27 (13) (14) - (14) Diluted loss per share, RUR 27 (13) (14) - (14)
These consolidated financial statements were approved by management on 24 June 2011 and were signed on its behalf by:
Chief Executive Officer Deputy General Director of Finance German Kaplun Evgeny Shishkov

RBC Group Consolidated Statement of Comprehensive Income for the year ended 31 December 2010
The consolidated statement of comprehensive income is to be read in conjunction with the notes to, and forming part of, the consolidated financial statements set out on pages 13 to 82.
* The USD equivalent figures are provided for information purposes only and do not form part of the audited financial statements – refer to note 2(d).
4
2010
2009 Continuing operations
2009 Discontinued
operations 2009 Note Mln USD* Mln USD* Mln USD* Mln USD*
Revenue 8 114 100 - 100 Cost of sales 9 (76) (75) - (75) Gross profit 38 25 - 25 Other income 10 1 3 - 3 Selling expenses 11 (25) (25) - (25) Administrative expenses 12 (18) (16) (1) (17) Other expenses 13 (3) (1) - (1) Loss on disposal of discontinued operation 6 - (1) - (1) Impairment loss 18 - (17) - (17) Results from operating activities (7) (32) (1) (33) Financial income 14 2 1 1 2 Financial expenses 14 (55) (19) - (19) Share of profit of associates and joint ventures (net of income tax) 19 1 (25) - (25) Loss before income tax (59) (75) - (75) Income tax (expense)/benefit 15 (1) 13 (1) 12 Loss for the year (60) (62) (1) (63) Other comprehensive (loss)/ income Foreign currency translation differences for foreign operations - - - - Acquisition of subsidiaries - - - - Disposal of subsidiaries, net of income tax - - - - Other comprehensive (loss)/ income for the year, net of income tax - - - - Total comprehensive loss for the year (60) (62) (1) (63) (Loss)/income attributable to: Shareholders of the Company (61) (63) (1) (64) Non-controlling interest 1 1 - 1 Loss for the year (60) (62) (1) (63) Total comprehensive (loss)/income attributable to: Shareholders of the Company (61) (63) (1) (64) Non-controlling interest 1 1 - 1 Total comprehensive loss for the year (60) (62) (1) (63) Loss per share Basic loss per share, RUR 27 - - - - Diluted loss per share, RUR 27 - - - -

RBC Group Consolidated Statement of Financial Position for the year ended 31 December 2010
The consolidated statement of financial position is to be read in conjunction with the notes to, and forming part of, the consolidated financial statements set out on pages 13 to 82.
* The USD equivalent figures are provided for information purposes only and do not form part of the audited financial statements – refer to note 2(d).
5
31 December
2010
31 December
2009
31 December
2010
31 December
2009 Note Mln RUR Mln RUR Mln USD* Mln USD* ASSETS Non-current assets Property, plant and equipment 16 163 241 5 8 Intangible assets 17 1,072 1,168 35 39 Investments in associates and joint ventures 19 303 129 10 4 Deferred tax assets 22 227 227 7 7 Other non-current assets 21 127 104 4 3 Other investments 20 8 13 - - Total non-current assets 1,900 1,882 61 61 Current assets Inventories 23 24 29 1 1 Other investments 20 32 22 1 1 Income tax receivable 16 28 1 1 Trade and other receivables 24 819 748 27 25 Cash and cash equivalents 25 1,174 243 39 8 Total current assets 2,065 1,070 69 36 Total assets 3,965 2,952 130 97

RBC Group Consolidated Statement of Financial Position for the year ended 31 December 2010
The consolidated statement of financial position is to be read in conjunction with the notes to, and forming part of, the consolidated financial statements set out on pages 13 to 82.
* The USD equivalent figures are provided for information purposes only and do not form part of the audited financial statements – refer to note 2(d).
6
31 December
2010
31 December
2009
31 December
2010
31 December
2009 Note Mln RUR Mln RUR Mln USD* Mln USD*
EQUITY AND LIABILITIES Equity Share capital 26 - - - - Share premium 26 8,995 6,644 295 218 Treasury shares 26 (631) (774) (21) (25) Translation reserve (9) (1) - - Accumulated losses (13,417) (11,331) (440) (372) Total equity attributable to shareholders of the Company
(5,062) (5,462) (166) (179)
Non-controlling interest 47 28 2 1 Total equity (5,015) (5,434) (164) (178) Non-current liabilities Loans and borrowings 28 6,528 - 214 - Derivative financial liability 28 1,083 - 36 - Deferred tax liabilities 22 39 30 1 1 Total non-current liabilities 7,650 30 251 1 Current liabilities Loans and borrowings 28 126 6,066 4 199 Provisions 29 89 78 3 3 Trade and other payables 30 1,107 2,207 36 72 Income tax payable 8 5 - - Total current liabilities 1,330 8,356 43 274 Total liabilities 8,980 8,386 294 275 Total equity and liabilities 3,965 2,952 130 97

RBC Group Consolidated Statement of Cash Flows for the year ended 31 December 2010
The consolidated statement of cash flows is to be read in conjunction with the notes to, and forming part of, the consolidated financial statements set out on pages 13 to 82.
* The USD equivalent figures are provided for information purposes only and do not form part of the audited financial statements – refer to note 2(d).
7
2010 2009 2010 2009 Mln RUR Mln RUR Mln USD* Mln USD*
OPERATING ACTIVITIES Loss for the year (1,804) (1,919) (60) (63) Adjustments for: - Depreciation and amortization 289 283 10 9 Impairment and write-off of assets - 516 - 17 Unrealized foreign exchange gain (12) 25 - 1 Gain on disposal of property, plant and equipment and intangible assets (1) (83) - (3) Loss on disposal of discontinued operations - 17 - 1 Gain on disposal of investments (13) - - - Share in profit/loss of associates and joint ventures (38) 755 (1) 24 Share option program compensation expense - 13 - 1 Impairment loss on accounts receivable 10 50 - 2 Increase in provisions, other than on income tax 11 - - - Loss from restructuring 1,065 - 35 - Interest expense 444 405 15 13 Interest income (57) (11) (2) - Other non-cash adjustments (169) 3 (5) - Income tax expense/(income) 41 (377) 1 (12) Operating loss before changes in working capital and provisions (234) (323) (7) (10) Decrease in inventories 5 8 - - Decrease in trade and other receivables (261) (105) (8) (3) Increase/(decrease) in trade and other payables 87 (283) 3 (9) Cash flows used in operations before income taxes and interest paid (403) (703) (12) (22) Income taxes paid (21) (30) (1) (1) Interest paid (154) - (5) - Cash flows used in operating activities (578) (733) (18) (23)
INVESTING ACTIVITIES Proceeds from disposal of property, plant and equipment - 43 - 1 Proceeds from disposal of intangible assets - 72 - 2 Proceeds from disposal of investments - 25 - 1 Proceeds from disposal of other assets - (3) - - Proceeds from disposal of shares - 13 - 1 Loans granted - (3) - - Repayment of loans granted - 3 - - Interest received 42 8 1 - Acquisition of property, plant and equipment (24) (32) (1) (1) Acquisition of intangible assets (25) (38) (1) (1) Acquisition of other assets - (3) - - Acquisition of minority interest in subsidiaries (6) - - - Acquisition of subsidiaries, net of cash acquired - 4 - - Disposal of subsidiaries, net of cash disposed - (159) - (5) Cash flows used in investing activities (13) (70) (1) (2)

RBC Group Consolidated Statement of Cash Flows for the year ended 31 December 2010
The consolidated statement of cash flows is to be read in conjunction with the notes to, and forming part of, the consolidated financial statements set out on pages 13 to 82.
* The USD equivalent figures are provided for information purposes only and do not form part of the audited financial statements – refer to note 2(d).
8
2010 2009 2010 2009 Mln RUR Mln RUR Mln USD* Mln USD*
FINANCING ACTIVITIES Proceeds from issue of additional capital 2,346 - 77 - Proceeds from borrowings 5 74 - 2 Repayment of borrowings (837) (69) (27) (2) Proceeds from sale of treasury shares 8 44 - 1 Cash flows from financing activities 1,522 49 50 1
- Net increase in cash and cash equivalents 931 (754) 31 (24)
Cash and cash equivalents at beginning of the period (owned by OJSC RBC Bank) - 644 - 21 Cash and cash equivalents at beginning of the period 243 353 8 11 Cash and cash equivalents at end of the period 1,174 243 39 8

RBC Group Consolidated Statement of Changes in Equity for the year ended 31 December 2010
The consolidated statement of changes in equity is to be read in conjunction with the notes to, and forming part of, the consolidated financial statements set out on pages 13 to 82.
* The USD equivalent figures are provided for information purposes only and do not form part of the audited financial statements – refer to note 2(d).
9
Mln RUR Attributable to shareholders of the Company
Share capital
Share premium
Treasury shares
Translation reserve
Available-for-sale investments
revaluation reserve
Accumulated loss Total
Non-controlling
interest Total equity
- - Balance at 1 January 2010 - 6,644 (774) (1) - (11,331) (5,462) 28 (5,434) (Loss)/profit for the year - - - - - (1,823) (1,823) 19 (1,804)
- 6,644 (774) (1) - (13,154) (7,285) 47 (7,238) Other comprehensive lossForeign currency translation differences for foreign operations
- - - (8) - - (8) - (8)
Total other comprehensive loss - - - (8) - - (8) - (8) Total comprehensive income/(loss) for the year
- - - (8) - (1,823) (1,831) 19 (1,812)
Transactions with owners recorded directly in equity
Acquisition of non-controlling interest
- - - - - (128) (128) - (128)
Additional contribution from shareholders
- 2,351 - - - - 2,351 - 2,351
Own shares sold - - 169 - - (135) 34 - 34 Own shares acquired - - (26) - - - (26) - (26) Total transactions with owners - 2,351 143 - - (263) 2,231 - 2,231 Balance at 31 December 2010 - 8,995 (631) (9) - (13,417) (5,062) 47 (5,015)

RBC Group Consolidated Statement of Changes in Equity for the year ended 31 December 2010
The consolidated statement of changes in equity is to be read in conjunction with the notes to, and forming part of, the consolidated financial statements set out on pages 13 to 82.
* The USD equivalent figures are provided for information purposes only and do not form part of the audited financial statements – refer to note 2(d).
10
Mln RUR Attributable to shareholders of the Company
Share capital
Share premium
Treasury shares
Translation reserve
Available-for-sale investments
revaluation reserve
Accumulated loss Total
Non-controlling
interest Total equity
- - Balance at 1 January 2009 - 6,644 (1,019) (6) (4) (9,215) (3,600) 22 (3,578) (Loss)/profit for the year - - - - - (1,926) (1,926) 7 (1,919)
- 6,644 (1,019) (6) (4) (11,141) (5,526) 29 (5,497) Other comprehensive income/(loss) Foreign currency translation differences for foreign operations
- - - 5 - - 5 - 5
Acquisitions of subsidiaries - - - - - - - 3 3 Disposal of subsidiaries, net of tax - - - - 4 (2) 2 (5) (3) Total other comprehensive income/(loss)
- - - 5 4 (2) 7 (2) 5
Total comprehensive income/(loss) for the year
- - - 5 4 (1,928) (1,919) 5 (1,914)
Transactions with owners recorded directly in equity
Options granted - - - - - 13 13 - 13 Own shares sold - - 245 - - (201) 44 - 44 Other contributions by and distributions to owners
- - - - - - 1 1
Total transactions with owners - - 245 - - (188) 57 1 58 Balance at 31 December 2009 - 6,644 (774) (1) - (11,331) (5,462) 28 (5,434)

RBC Group Consolidated Statement of Changes in Equity for the year ended 31 December 2010
The consolidated statement of changes in equity is to be read in conjunction with the notes to, and forming part of, the consolidated financial statements set out on pages 13 to 82.
* The USD equivalent figures are provided for information purposes only and do not form part of the audited financial statements – refer to note 2(d).
11
Mln USD* Attributable to shareholders of the Company
Share capital
Share premium
Treasury shares
Translation reserve
Available-for-sale investments
revaluation reserve
Accumulated loss Total
Non-controlling
interest Total equity
- - Balance at 1 January 2010 - 218 (25) - - (372) (179) 1 (178) (Loss)/profit for the year - - - - - (60) (60) 1 (59)
- 218 (25) - - (432) (239) 2 (237) Other comprehensive lossForeign currency translation differences for foreign operations
- - - - - - - - -
Total other comprehensive loss - - - - - - - - - Total comprehensive income/(loss) for the year
- - - - - (60) (60) 1 (59)
Transactions with owners recorded directly in equity
Acquisitions of non-controlling interest
- - - - - (4) (4) - (4)
Additional contribution from shareholders
- 77 - - - - 77 - 77
Own shares sold - - 5 - - (4) 1 - 1 Own shares acquired - - (1) - - - (1) - (1) Total transactions with owners - 77 4 - - (8) 73 - 73 Balance at 31 December 2010 - 295 (21) - - (440) (166) 2 (164)

RBC Group Consolidated Statement of Changes in Equity for the year ended 31 December 2010
The consolidated statement of changes in equity is to be read in conjunction with the notes to, and forming part of, the consolidated financial statements set out on pages 13 to 82.
* The USD equivalent figures are provided for information purposes only and do not form part of the audited financial statements – refer to note 2(d).
12
Mln USD* Attributable to shareholders of the Company
Share capital
Share premium
Treasury shares
Translation reserve
Available-for-sale investments
revaluation reserve
Accumulated loss Total
Non-controlling
interest Total equity
- - Balance at 1 January 2009 - 218 (33) - - (302) (117) 1 (116) (Loss)/profit for the year - - - - - (63) (63) - (63)
- 218 (33) - - (365) (180) 1 (179) Other comprehensive income/(loss) Foreign currency translation differences for foreign operations
- - - - - - - - -
Acquisitions of subsidiaries - - - - - - - - - Disposal of subsidiaries, net of tax - - - - - - - - - Total other comprehensive income/(loss)
- - - - - - - - -
Total comprehensive income/ (loss) for the year
- - - - - (63) (63) - (63)
Transactions with owners recorded directly in equity
Options granted - - - - - - - - - Own shares sold - - 8 - - (7) 1 - 1 Other contributions by and distributions to owners
- - - - - - - -
Total transactions with owners - - 8 - - (7) 1 - 1 Balance at 31 December 2009 - 218 (25) - - (372) (179) 1 (178)

RBC Group Notes to the Consolidated Financial Statements for the year ended 31 December 2010
* The USD equivalent figures are provided for information purposes only and do not form part of the audited financial statements – refer to note 2(d).
13
1 Background
(a) Organization and operations
OJSC RBC (the “Company”) and its subsidiaries (together referred to as the “Group”) comprise Russian open joint stock companies, closed joint stock companies and limited liability companies as defined in the Civil Code of the Russian Federation, and companies located abroad. OJSC RBC Information Systems, which was the parent company of the Group at 31 December 2009, and its subsidiaries as at 31 December 2010 were controlled by the Company based on the terms of the shareholders’ agreements.
OJSC RBC Information Systems was established as an open joint stock company in 2000. During 2010 the shares of OJSC RBC Information Systems were traded in the Russian Federation on the Moscow Stock Exchange and Russian Trading System and in the United States of America through a Level-1 ADR program (Note 37).
The Company’s registered office is located at: 117393, Russian Federation, Moscow, Profsoyuznaya Street, 78.
The Group’s principal activities are advertising, provision of information services, operation of a business TV channel, print publications and internet hosting services. These services and products are sold in the Russian Federation and abroad.
As at 31 December 2010 Mr. Mikhail D. Prokhorov was the ultimate beneficiary of the Company.
(b) Restructuring
In 2010 the Group began a process of changing its structure, which included establishing a new parent company, OJSC RBC. OJSC RBC was established in May 2005 as closed joint stock company and in August 2010 was reorganized into open joint stock company. The shares of the Company are listed in the Russian Federation on the Moscow Stock Exchange and Russian Trading System.
On 7 June 2010, ONEXIM Group had acquired a 51.1% stake in the Company through an additional share issue for 80 million US Dollars. The remaining 48.9% in the Company are being swapped for 100% of shares in OJSC RBC Information Systems as part of the restructuring process during 2011 (Note 37).
(c) Business environment
The Russian Federation, where the majority of the Group’s transactions are conducted, has been experiencing political and economic change that has affected, and may continue to affect, the activities of enterprises operating in this environment. Consequently, operations in the Russian Federation involve risks that typically do not exist in other markets. In addition, the recent contraction in the capital and credit markets has further increased the level of economic uncertainty in the environment. These consolidated financial statements reflect management’s assessment of the impact of the Russian and business environment on the operations and the financial position of the Group. The future business environment may differ from management’s assessment.

RBC Group Notes to the Consolidated Financial Statements for the year ended 31 December 2010
* The USD equivalent figures are provided for information purposes only and do not form part of the audited financial statements – refer to note 2(d).
14
2 Basis of preparation
(a) Statement of compliance
These consolidated financial statements have been prepared in accordance with International Financial Reporting Standards (“IFRS”).
(b) Basis of measurement
The consolidated financial statements are prepared on the historical cost basis except for the derivative financial instruments, financial investments at fair value through profit and loss and financial investments classified as available-for-sale that are presented at their fair value.
(c) Functional and presentation currency
The national currency of the Russian Federation is the Russian Rouble (“RUR”), which is the Group’s functional currency and the currency in which these consolidated financial statements are presented. All financial information presented in RUR has been rounded to the nearest million.
(d) Convenience translation
In addition to presenting the consolidated financial statements in RUR, supplementary information in the US Dollars (“USD”) has been presented for the convenience of users of the financial statements.
All amounts in the consolidated financial statements, including comparatives, are translated from RUR to USD at the closing exchange rate at 31 December 2010 of RUR 30.4769 to USD 1.
(e) Use of judgments, estimates and assumptions
Management has made a number of judgments, estimates and assumptions relating to the reporting of assets and liabilities and the disclosure of contingent assets and liabilities to prepare these consolidated financial statements in conformity with IFRS. Actual results may differ from those estimates.
Estimates and underlying assumptions are reviewed on an ongoing basis. Revisions to accounting estimates are recognized in the period in which the estimates are revised and in any future periods affected.
In particular, information about significant areas of estimation uncertainty and critical judgments in applying accounting policies that have the most significant effect on the amounts recognized in the consolidated financial statements is included in the following notes:
• Note 7 – Acquisition and disposals of subsidiaries and non-controlling interest;
• Note 8 – Revenue;
• Note 18 – Impairment;
• Note 22 – Deferred tax assets and liabilities;
• Note 24 – Trade and other receivables;
• Note 29 – Provisions;
• Note 33 – Contingencies.

RBC Group Notes to the Consolidated Financial Statements for the year ended 31 December 2010
* The USD equivalent figures are provided for information purposes only and do not form part of the audited financial statements – refer to note 2(d).
15
3 Significant accounting policies The significant accounting policies applied in the preparation of the consolidated financial statements are described in Notes 3(a) to 3(p). These accounting policies have been consistently applied.
(a) Basis of consolidation
(i) Subsidiaries
The consolidated financial statements incorporate the financial statements of the Company and entities controlled by the Company (its subsidiaries). Control exists when the Group has the power to govern the financial and operating policies of an entity so as to obtain benefits from its activities. In assessing control, potential voting rights that currently are exercisable are taken into account. The financial statements of subsidiaries are included in the consolidated financial statements from the date that control commences until the date that control ceases. The accounting policies of subsidiaries have been changed when necessary to align them with the policies adopted by the Group. Losses applicable to the non-controlling interests in a subsidiary are allocated to the non-controlling interests even if doing so causes the non-controlling interests to have a deficit balance.
(ii) Associates and jointly controlled entities
Associates are those entities in which the Group has significant influence, but not control, over the financial and operating policies. Joint ventures are those entities over whose activities the Group has joint control, established by contractual agreement and requiring unanimous consent for strategical financial and operating decisions.
Associates and jointly controlled entities are accounted for using the equity method. The consolidated financial statements include the Group’s share of the income and expenses of the associates and joint ventures, after adjustments to align the accounting policies with those of the Group, from the date that significant influence or joint control commences until the date that significant influence or joint control ceases.
When the Group’s share of losses exceeds its interest in an associate or joint venture, the carrying amount of that interest (including any long-term investments) is reduced to nil and the recognition of further losses is discontinued, except for the extent that the Group has an obligation or has made payments on behalf of the investee.
(iii) Transactions eliminated on consolidation
All intra-group balances and transactions, and any unrealized profits and losses arising from intra-group transactions are eliminated. Unrealized profits arising from transactions with the associates and joint ventures are eliminated against the investment to the extent of the Group’s interest in the investee. Unrealized losses are eliminated in the same way as unrealized profits, but only to the extent that there is no evidence of impairment.
(b) Foreign currency
(i) Foreign currency transactions
Transactions in foreign currencies are translated to the respective functional currencies of Group entities at exchange rates at the dates of the transactions. Monetary assets and liabilities denominated in foreign currencies at the reporting date are translated to the functional currency at the exchange rate at that date. Non-monetary assets and liabilities denominated in foreign currencies that are measured at fair value are

RBC Group Notes to the Consolidated Financial Statements for the year ended 31 December 2010
* The USD equivalent figures are provided for information purposes only and do not form part of the audited financial statements – refer to note 2(d).
16
translated to the functional currency at the exchange rate at the date that the fair value was determined. Foreign currency differences arising in translation are recognized in profit or loss, except for differences arising on the translation of available-for-sale equity instruments that are recognized in other comprehensive income.
(ii) Foreign operations
The assets and liabilities of foreign operations, including goodwill and fair value adjustments arising on acquisition, are translated to RUR at the exchange rate at the reporting date. The income and expenses of foreign operations are translated to RUR at exchange rates at the dates of the transactions.
Foreign currency differences resulting from translation of foreign operations are recognized directly in other comprehensive income. Since the Group transition to IFRS such differences have been recognized in the foreign currency translation reserve. When a foreign operation is disposed of, in part or in full, the relevant amount in the translation reserve is transferred to profit or loss as part of the profit or loss on disposal.
Foreign exchange gains and losses arising from a monetary item receivable from or payable to a foreign operation, the settlement of which is neither planned nor likely in the foreseeable future, are considered to form part of a net investment in a foreign operation and are recognized in the other comprehensive income, and are presented within equity in the foreign currency translation reserve.
(c) Financial instruments
Non-derivative financial instruments
Non-derivative financial instruments comprise investments in equity and debt securities, trade and other receivables, cash and cash equivalents, loans and borrowings, and trade and other payables.
Non-derivative financial instruments are recognized initially at fair value plus, for instruments not at fair value through profit or loss, any directly attributable transaction costs. Subsequent to initial recognition non-derivative financial instruments are measured as described below.
Cash and cash equivalents comprise cash balances and call deposits. Bank overdrafts that are repayable on demand and form an integral part of the Group’s cash management are included as a component of cash and cash equivalents for the purpose of the statement of cash flows.
Accounting for finance income and expenses is discussed in Note 3(m).
Held-to-maturity investments
If the Group has the positive intent and ability to hold debt securities to maturity, then they are classified as held-to-maturity. Held-to-maturity investments are measured at amortized cost using the effective interest method, less any accumulated impairment losses.
Available-for-sale financial assets
The Group’s investments in equity securities and certain debt securities are classified as available-for-sale financial assets. Subsequent to initial recognition, they are measured at fair value and changes therein, other than impairment losses (Note 3(h)(i)), and foreign exchange gains and losses on available-for-sale monetary items (Note 3(b)(i)), are recognized in other comprehensive income and presented within equity in the fair value reserve. When an investment is derecognized, the cumulative gain or loss in other comprehensive statement is transferred to profit or loss.
Financial assets at fair value through profit or loss
An instrument is classified as at fair value through profit or loss if it is held for trading or is designated as such upon initial recognition. Financial instruments are designated at fair value through profit or loss if

RBC Group Notes to the Consolidated Financial Statements for the year ended 31 December 2010
* The USD equivalent figures are provided for information purposes only and do not form part of the audited financial statements – refer to note 2(d).
17
the Group manages such investments and makes purchase and sale decisions based on their fair value in accordance with the Group’s documented risk management or investment strategy. Upon initial recognition attributable transaction costs are recognized in profit or loss as incurred. Financial instruments at fair value through profit or loss are measured at fair value, and changes therein are recognized in profit or loss.
Derivative instruments
Derivative financial instruments: options and warrants are measured at fair value. Changes are recognized in profit and loss.
Other
Other non-derivative financial instruments are measured at amortized cost using the effective interest method, less any impairment losses.
(d) Share capital
Ordinary shares
Ordinary shares are classified as equity. Incremental costs directly attributable to issue of ordinary shares and share options are recognized as a deduction from equity, net of any tax effects.
Repurchase of share capital
When share capital recognized as equity is repurchased, the amount of the consideration paid, which includes directly attributable costs, net of any tax effects, is recognized as a deduction from equity. Repurchased shares are classified as treasury shares and are presented as a deduction from total equity. When treasury shares are sold or reissued subsequently, the amount received is recognized as an increase in equity, and the resulting surplus or deficit on the transaction is transferred to/from retained earnings.
Dividends
Dividends are recognized as a liability in the period in which they are declared.
(e) Property, plant and equipment
(i) Recognition and measurement
Items of property, plant and equipment are measured at cost less accumulated depreciation and impairment losses.
Cost includes expenditure that is directly attributable to the acquisition of the asset. The cost of self-constructed assets includes the cost of materials and direct labor, any other costs directly attributable to bringing the asset to a working condition for its intended use, and the costs of dismantling and removing the items and restoring the site on which they are located. Purchased software that is integral to the functionality of the related equipment is capitalized as part of that equipment. Borrowing costs related to the acquisition or construction of qualifying assets are recognized in the cost of such assets.
When parts of an item of property, plant and equipment have different useful lives, they are accounted for as separate items (major components) of property, plant and equipment.
Gains and losses on disposal of an item of property, plant and equipment are recognized net in “other income” or “other expense” in profit or loss.

RBC Group Notes to the Consolidated Financial Statements for the year ended 31 December 2010
* The USD equivalent figures are provided for information purposes only and do not form part of the audited financial statements – refer to note 2(d).
18
(ii) Subsequent costs
The cost of replacing a part of an item of property, plant and equipment is recognized in the carrying amount of the item if it is probable that the future economic benefits embodied within the part will flow to the Group and its cost can be measured reliably. The carrying amount of the replaced part is derecognized. The costs of the day-to-day servicing of property, plant and equipment are recognized in profit or loss as incurred.
(iii) Depreciation
Depreciation is recognized in profit or loss on a straight-line basis over the estimated useful lives of each part of an item of property, plant and equipment. Leased assets are depreciated over the shorter of the lease term and their useful lives unless it is reasonably certain that the Group will obtain ownership by the end of the lease term, in which case the leased assets are depreciated over their useful life. Land is not depreciated.
The estimated useful lives for the current and comparative periods are the follows:
• TV equipment from 2 to 10 years
• Computer equipment from 2 to 5 years
• Office equipment from 3 to 7 years
• Other assets from 3 to 10 years.
Depreciation methods, useful lives and residual values are reviewed at each reporting date and adjusted if appropriate. Estimates in respect of certain items of plant and equipment were revised in 2010 (Note 16).
(f) Intangible assets
(i) Goodwill
Goodwill (negative goodwill) arises on the acquisition of subsidiaries, associates and joint ventures.
For acquisitions on or after 1 January 2009, the Group measures goodwill at the acquisition date as:
• the fair value of the consideration transferred; plus
the recognized amount of any non-controlling interests in the acquiree; plus, if the business combination is achieved in stages, the fair value of the existing equity interest in the acquiree; less
• the net recognized amount (generally fair value) of the identifiable assets acquired and liabilities assumed.
When the excess is negative, a bargain purchase gain is recognized immediately in profit or loss.
The consideration transferred does not include amounts related to the settlement of pre-existing relationships. Such amounts are generally recognized in profit or loss.
Costs related to the acquisition, other than those associated with the issue of debt or equity securities, that the Group incurs in connection with a business combination, are expensed as incurred.
Any contingent consideration payable is recognized at fair value at the acquisition date. If the contingent consideration is classified as equity, it is not premeasured and settlement is accounted for within equity. Otherwise, subsequent changes to the fair value of the contingent consideration are recognized in profit or loss.
Acquisitions before 1 January 2009

RBC Group Notes to the Consolidated Financial Statements for the year ended 31 December 2010
* The USD equivalent figures are provided for information purposes only and do not form part of the audited financial statements – refer to note 2(d).
19
For acquisitions before 1 January 2009, goodwill represents the excess of the cost of the acquisition over the Group’s interest in the net fair value of the identifiable assets, liabilities and contingent liabilities of the acquiree. When the excess is negative (negative goodwill), it is recognized immediately in profit or loss.
Acquisitions of non-controlling interest
Acquisitions of non-controlling interests are accounted for as transactions with equity holders in their capacity as equity holders and therefore no goodwill is recognized as a result of such transactions.
Subsequent measurement
Goodwill is measured at cost less accumulated impairment losses. In respect of the associates and joint ventures, the carrying amount of goodwill is included in the carrying amount of the investment, and an impairment loss on such an investment is not allocated to any asset, including goodwill, that forms part of the carrying amount of the associates and joint ventures.
(ii) Web-sites
Costs relating to the development of web-sites are capitalized if the site is functional in nature (i.e. it is designed to generate revenue from sales).
Expenditure to maintain and improve design, content and appearance of a web-site is expensed as incurred.
(iii) Software
Acquired software is stated at historical cost less accumulated amortization and any accumulated impairment losses. Costs relating to the development of software are capitalized if the Group expects to sell the software at a price above cost or use it in its operations.
(iv) Capitalized development costs
Expenditure on research activities, undertaken with the prospect of gaining new scientific or technical knowledge and understanding, is recognized in profit or loss when incurred.
Development activities involve a plan or design for the production of new or substantially improved products and processes. Development expenditure is capitalized only if development costs can be measured reliably, the product or process is technically and commercially feasible, future economic benefits are probable, and the Group intends to and has sufficient resources to complete development and to use or sell the asset.
The capitalized expenditure includes the cost of materials, direct labor and overhead costs that are directly attributable to preparing the asset for its intended use. Borrowing costs related to the development of qualifying assets are recognized as a part of cost of qualifying assets.
Capitalized development expenditure is measured at cost less accumulated amortization and accumulated impairment losses.
(v) Trademarks
Trademarks acquired by the Group and representing registered rights are stated at cost less accumulated amortization and impairment losses.
(vi) Brands
Brands acquired by the Group in connection with the acquisition of internet resources, are stated at cost less accumulated amortization and impairment losses. Expenditure on internally generated goodwill and brands is recognized in profit or loss as an expense as incurred.

RBC Group Notes to the Consolidated Financial Statements for the year ended 31 December 2010
* The USD equivalent figures are provided for information purposes only and do not form part of the audited financial statements – refer to note 2(d).
20
(vii) Other intangible assets
Other intangible assets include licenses, customer lists, and content of websites. Other intangible assets that are acquired by the Group, which have finite useful lives, are measured at cost less accumulated amortization and accumulated impairment losses.
(viii) Subsequent expenditure
Subsequent expenditure is capitalized only when it increases the future economic benefits embodied in the specific asset to which it relates. All other expenditure, including expenditure on internally generated goodwill and brands, is recognized in profit or loss as incurred.
(ix) Amortization
Amortization is recognized in profit or loss on a straight-line basis over the estimated useful lives of intangible assets, other than goodwill, from the date that they are available for use. The estimated useful lives for the current and comparative periods are as follows:
Trademarks 5 to 20 years
Software 1-3 years
Web-sites 1-3 years
Brands 12 to 15 years
Customer lists 1 to 10 years
Cable network connection 15 years
Other (licenses, content) 1-3 years
Amortization methods and useful lives are reviewed at each reporting date and adjusted if appropriate. Estimated useful lives were revised in 2010 for the groups: software, web-sites, other (licenses, content).
(g) Inventories
Inventories are measured at the lower of cost and net realizable value. Net realizable value is the estimated selling price in the ordinary course of business, less the estimated costs of completion and selling expenses.
(h) Impairment
(i) Financial assets
A financial asset not carried at fair value through profit or loss is assessed at each reporting date to determine whether there is any objective evidence that it is impaired. A financial asset is considered to be impaired if objective evidence indicates that one or more events have had a negative effect on the estimated future cash flows of that asset.
An impairment loss in respect of a financial asset measured at amortized cost is calculated as the difference between its carrying amount, and the present value of the estimated future cash flows discounted at the original effective interest rate. An impairment loss in respect of an available-for-sale financial asset is calculated by reference to its fair value.
Individually significant financial assets are tested for impairment on an individual basis. The remaining financial assets are assessed collectively in groups that share similar credit risk characteristics.
All impairment losses are recognized in profit or loss. Any cumulative loss in respect of an available-for-sale financial asset recognized previously in other comprehensive income is transferred to profit or loss.

RBC Group Notes to the Consolidated Financial Statements for the year ended 31 December 2010
* The USD equivalent figures are provided for information purposes only and do not form part of the audited financial statements – refer to note 2(d).
21
An impairment loss is reversed if the reversal can be related objectively to an event occurring after the impairment loss was recognized. For financial assets measured at amortized cost and available-for-sale financial assets that are debt securities, the reversal is recognized in profit or loss. For available-for-sale financial assets that are equity securities, the reversal is recognized directly in other comprehensive income.
(ii) Non-financial assets
The carrying amounts of the Group’s non-financial assets, other than inventories and deferred tax assets, are reviewed at each reporting date to determine whether there is any indication of impairment. If any such indication exists, then the asset’s recoverable amount is estimated. For goodwill and intangible assets that have indefinite lives or that are not yet available for use, recoverable amount is estimated at each reporting date.
The recoverable amount of an asset or cash-generating unit is the greater of its value in use and its fair value less costs to sell. In assessing value in use, the estimated future cash flows are discounted to their present value using a pre-tax discount rate that reflects current market assessments of the time value of money and the risks specific to the asset. For the purpose of impairment testing, assets are grouped together into the smallest group of assets that generates cash inflows from continuing use that are largely independent of the cash inflows of other assets or groups of assets (the “cash-generating unit”). The goodwill acquired in a business acquisition, for the purpose of impairment testing, is allocated to cash-generating units that are expected to benefit from the synergies of the combination.
An impairment loss is recognized if the carrying amount of an asset or its cash-generating unit exceeds its recoverable amount. Impairment losses are recognized in profit or loss. Impairment losses recognized in respect of cash-generating units are allocated first to reduce the carrying amount of any goodwill allocated to the units and then to reduce the carrying amount of the other assets in the unit (group of units) on a pro rata basis.
An impairment loss in respect of goodwill is not reversed. In respect of other assets, impairment losses recognized in prior periods are assessed at each reporting date for any indications that the loss has decreased or no longer exists. An impairment loss is reversed if there has been a change in the estimates used to determine the recoverable amount. An impairment loss is reversed only to the extent that the asset’s carrying amount does not exceed the carrying amount that would have been determined, net of depreciation or amortization, if no impairment loss had been recognized.
(i) Employee benefits
(i) Short-term benefits
Short-term employee benefit obligations are measured on an undiscounted basis and are expensed as the related service is provided.
A liability is recognized for the amount expected to be paid under short-term cash bonus or profit-sharing plans if the Group has a present legal or constructive obligation to pay this amount as a result of past service provided by the employee and the obligation can be estimated reliably.
(ii) Share-based payment transactions
At the grant date fair value of share options granted to employees is recognized as personnel costs, with a corresponding increase in equity, over the period that the employees become unconditionally entitled to the options. The amount recognized as an expense is adjusted to reflect the actual number of share options for which the related service requirements and non-market vesting conditions are met.

RBC Group Notes to the Consolidated Financial Statements for the year ended 31 December 2010
* The USD equivalent figures are provided for information purposes only and do not form part of the audited financial statements – refer to note 2(d).
22
(j) Provisions
(i) Tax provisions
The Group provides for tax risks including late-payment interest and penalties, when it is probable that an outflow of economic benefits will be required according to the effective laws and regulations. Such provisions are maintained, and updated if necessary, for the period over which the respective tax positions remain subject to review by the tax authorities.
(ii) Other provisions
A provision is recognized if, as a result of a past event, the Group has a present legal or constructive obligation that can be estimated reliably, and it is probable that an outflow of economic benefits will be required to settle the obligation. Provisions are determined by discounting the expected future cash flows at a pre-tax rate that reflects current market assessments of the time value of money and the risks specific to the liability.
(k) Revenue
Revenue from the sale of goods and rendering of services is measured at the fair value of the consideration received or receivable, net of returns and allowances, trade discounts and volume rebates. Revenue is recognized when the significant risks and rewards of ownership have been transferred to the buyer, recovery of the consideration is probable, the associated costs and possible return of goods can be estimated reliably, there is no continuing management involvement with the goods, and the amount of revenue can be measured reliably.
Transfer of risks and rewards vary depending on the individual terms of the contract of sale. For sales of printing products, transfer usually occurs when the goods are shipped to buyers.
When the Group acts in the capacity of an agent rather than as the principal in a transaction, the revenue recognized is the net amount of commission made by the Group.
(l) Other expenses
Lease payments
Payments made under operating leases are recognized in profit or loss on a straight-line basis over the term of the lease. Lease incentives received are recognized as an integral part of the total lease expense, over the term of the lease.
Minimum lease payments made under finance leases are apportioned between the finance expense and the reduction of the outstanding liability. The finance expense is allocated to each period during the lease term so as to produce a constant periodic rate of interest on the remaining balance of the liability.
Contingent lease payments are accounted for by revising the minimum lease payments over the remaining term of the lease when the contingency no longer exists and the lease adjustment is known.
(m) Finance income and expenses
Finance income comprises interest income on funds invested, changes in the fair value of financial assets at fair value through profit or loss, and foreign currency gains. Interest income is recognized as it accrues in profit or loss, using the effective interest method. Dividend income is recognized in profit or loss on the date that the Group’s right to receive payment is established.
Finance expenses comprise interest expense on borrowings, unwinding of the discount on provisions, dividends on preference shares classified as liabilities, foreign currency losses, changes in the fair value

RBC Group Notes to the Consolidated Financial Statements for the year ended 31 December 2010
* The USD equivalent figures are provided for information purposes only and do not form part of the audited financial statements – refer to note 2(d).
23
of financial assets at fair value through profit or loss and impairment losses recognized on financial assets. All borrowing costs are recognized in profit or loss using the effective interest method.
Foreign currency gains and losses are reported on a net basis.
(n) Income tax expense
Income tax expense comprises current and deferred tax. Current tax and deferred tax are recognized in profit or loss except to the extent that it relates to a business combination, or items recognized directly in equity or in other comprehensive income.
Current tax is the expected tax payable or receivable on the taxable income or loss for the year, using tax rates enacted or substantively enacted at the reporting date, and any adjustment to tax payable in respect of previous years. Current tax payable also includes any tax liability arising from the declaration of dividends.
Deferred tax is recognized in respect of temporary differences between the carrying amounts of assets and liabilities for financial reporting purposes and the amounts used for taxation purposes. Deferred tax is not recognized for:
• temporary differences on the initial recognition of assets or liabilities in a transaction that is not a business combination and that affects neither accounting nor taxable profit or loss;
• temporary differences related to investments in subsidiaries and jointly controlled entities to the extent that it is probable that they will not reverse in the foreseeable future; and
• taxable temporary differences arising on the initial recognition of goodwill.
Deferred tax is measured at the tax rates that are expected to be applied to the temporary differences when they reverse, based on the laws that have been enacted or substantively enacted by the reporting date.
Deferred tax assets and liabilities are offset if there is a legally enforceable right to offset current tax assets and liabilities, and they relate to income taxes levied by the same tax authority on the same taxable entity, or on different tax entities, but they intend to settle current tax liabilities and assets on a net basis or their tax assets and liabilities will be realized simultaneously.
In accordance with the tax legislation of the Russian Federation, tax losses and current tax assets of a company in the Group may not be set off against taxable profits and current tax liabilities of other Group companies. In addition, the tax base is determined separately for each of the Group’s main activities and, therefore, tax losses and taxable profits related to different activities cannot be offset.
A deferred tax asset is recognized for unused tax losses, tax credits and deductible temporary differences, to the extent that it is probable that future taxable profits will be available against which they can be utilized. Deferred tax assets are reviewed at each reporting date and are reduced to the extent that it is no longer probable that the related tax benefit will be realized.
(o) Earnings/(losses) per share
The Group presents basic and diluted earnings per share (“EPS”) data for its ordinary shares. Basic EPS is calculated by dividing the profit or loss attributable to ordinary shareholders of the Company by the weighted average number of ordinary shares outstanding during the period. Diluted EPS is determined by adjusting the profit or loss attributable to ordinary shareholders and the weighted average number of ordinary shares outstanding for the effects of all dilutive potential ordinary shares.

RBC Group Notes to the Consolidated Financial Statements for the year ended 31 December 2010
* The USD equivalent figures are provided for information purposes only and do not form part of the audited financial statements – refer to note 2(d).
24
(p) New Standards and Interpretations not yet adopted
A number of new Standards, amendments to Standards and Interpretations are not yet effective as at 31 December 2010, and have not been applied in preparing these consolidated financial statements. The Group plans to adopt these pronouncements when they become effective.
• Amendment to IAS 32 Financial Instruments: Presentation – Classification of Rights Issues clarifies that rights, options or warrants to acquire a fixed number of an entity’s own equity instruments for a fixed amount are classified as equity instruments even if the fixed amount is determined in foreign currency. A fixed amount can be determined in any currency provided that entity offers these instruments pro rata to all of the existing owners of the same class of its own non-derivative equity instruments. The amendment is applicable for annual periods beginning on or after 1 February 2010. The amendment is expected to have no impact on the Group’s consolidated financial statements.
• Revised IAS 24 Related Party Disclosures (2010) introduces an exemption from the basic disclosure requirements in relation to related party disclosures and outstanding balances, including commitments, for government-related entities. Additionally, the standard has been revised to simplify some of the presentation guidance that was previously non-reciprocal. The revised standard is to be applied retrospectively for annual periods beginning on or after 1 January 2011. The Group has not yet determined the potential effect of the amendment.
• Amended IFRS 7 Disclosures – Transfers of Financial Assets introduces additional disclosure requirements for transfers of financial assets in situations where assets are not derecognized in their entirety or where the assets are derecognized in their entirety but a continuing involvement in the transferred assets is retained. The new disclosure requirements are designated to enable the users of financial statements to better understand the nature of the risks and rewards associated with these assets. The amendment is effective for annual periods beginning on or after 1 July 2011. The amendment is expected to have no impact on the Group’s consolidated financial statements
• IFRS 9 Financial Instruments will be effective for annual periods beginning on or after 1 January 2013. The new standard is to be issued in phases and is intended ultimately to replace International Financial Reporting Standard IAS 39 Financial Instruments: Recognition and Measurement. The first phase of IFRS 9 was issued in November 2009 and relates to the classification and measurement of financial assets. The second phase regarding classification and measurement of financial liabilities was published in October 2010. The remaining parts of the standard are expected to be issued during the first half of 2011. The Group recognizes that the new standard introduces many changes to the accounting for financial instruments and is likely to have a significant impact on Group’s consolidated financial statements. The impact of these changes will be analyzed during the course of the project as further phases of the standard are issued. The Group does not intend to adopt this standard early.
• Various Improvements to IFRSs have been dealt with on a standard-by-standard basis. All amendments, which result in accounting changes for presentation, recognition or measurement purpose, will come into effect not earlier than 1 January 2011. The Group has not yet analyzed the likely impact of the improvements on its financial position or performance.

RBC Group Notes to the Consolidated Financial Statements for the year ended 31 December 2010
* The USD equivalent figures are provided for information purposes only and do not form part of the audited financial statements – refer to note 2(d).
25
4 Determination of fair values A number of the Group’s accounting policies and disclosures require the determination of fair value, for both financial and non-financial assets and liabilities. Fair values have been determined for measurement and/or disclosure purposes based on the following methods. When applicable, further information about the assumptions made in determining fair values is disclosed in the notes specific to that asset or liability.
(a) Intangible assets
The fair values of certain intangible assets acquired in business combinations were estimated as follows:
(i) Trademarks and brands
The fair value of trademarks and brands acquired in a business combination is based on the discounted estimated royalty payments that have been avoided as a result of the trademark or the brand being owned (the “relief-from-royalty” method).
(ii) Software and websites
The fair values of software and websites acquired in a business combination were determined through the cost approach, based on the actual expenditure the Group would have incurred to recreate such software and websites.
(iii) Other intangible assets
The fair values of customer lists acquired in business combinations were valued using the multi-period excess earnings approach.
The fair values of licenses were determined using the cost approach, except for the fair value of the license of CJSC TRK MKS acquired in a business combination in 2008 that was valued using the market approach.
(b) Inventories
The fair value of inventories acquired in a business combination is determined based on its estimated selling price in the ordinary course of business less the estimated costs of completion and sale, and a reasonable profit margin based on the effort required to complete and sell the inventories.
(c) Investments in equity and debt securities
The fair value of financial assets at fair value through profit or loss, available-for-sale investments and held-to-maturity investments is determined by reference to their quoted weighted average price at the reporting date. The fair value of held-to-maturity investments is determined for disclosure purposes only.
(d) Trade and other receivables
The fair value of trade and other receivables is estimated as the present value of future cash flows, discounted at the market rate of interest at the reporting date.
(e) Non-derivative financial liabilities
Fair value, which is determined for disclosure purposes, is calculated based on the present value of future principal and interest cash flows, discounted at the market rate of interest at the reporting date. In respect of the liability component of convertible notes, the market rate of interest is determined by reference to similar liabilities that do not have a conversion option.

RBC Group Notes to the Consolidated Financial Statements for the year ended 31 December 2010
* The USD equivalent figures are provided for information purposes only and do not form part of the audited financial statements – refer to note 2(d).
26
(f) Share-based payment transactions
The fair value of employee share options is measured using the Black-Scholes formula. Measurement inputs include share price at the measurement date, exercise price of the instrument, expected volatility (based on weighted average historical volatility adjusted for changes expected due to publicly available information), weighted average expected life of the instruments (based on historical experience and general option holder behavior), expected dividends, and the risk-free interest rate (based on government bonds). Service and non-market performance conditions attached to the transactions are not taken into account in determining the fair value.
(g) Derivatives
The fair value of options and warrants is based on their quoted market price, if available. If a quoted market price is not available, then fair value is estimated by application of option valuation models.

RBC Group Notes to the Consolidated Financial Statements for the year ended 31 December 2010
* The USD equivalent figures are provided for information purposes only and do not form part of the audited financial statements – refer to note 2(d).
27
5 Segment reporting
(a) Business segments
The Group has the following reportable segments, based on the fact how the Board of Directors and Management Committee of the Company (chief operating decision maker) provide an assessment of the operating results of the Group: Business Internet Segment. Provision of internet advertising and information services for business audience. Consumer Internet Segment. Provision of entertainment internet services and resources, internet advertising, hosting services. TV segment. Operation of a TV channel, provision of TV advertising. Printing segment. Provision of advertising in magazines and newspapers, and sale of magazines and newspapers. Salon segment. Printing and distribution of various magazines about design and interior. Bank segment. Provision of banking services. OJSC RBC Bank, the only legal entity comprising the banking segment, was disposed in 2009 (Note 6).

RBC Group Notes to the Consolidated Financial Statements for the year ended 31 December 2010
* The USD equivalent figures are provided for information purposes only and do not form part of the audited financial statements – refer to note 2(d).
28
Year ended 31 December 2010, Mln RUR Revenue Expenses Payroll
expenses Cost of
sales Administrative
expenses
Other operating expenses
Other operating
income
Selling expenses Profit/(loss)
Business internet 1,408 (1,039) (463) (146) (58) (1) - (371) 369 Consumer internet 689 (732) (302) (263) (60) (19) - (88) (43) TV 489 (674) (369) (163) (65) (5) - (72) (185) Printing 324 (381) (196) (77) (23) (2) - (83) (57) Salon 569 (476) (147) (113) (44) (4) - (168) 93 Restructuring expenses - (91) - - (90) (1) - - (91) EBITDA (management accounts) 3,479 (3,393) (1,477) (762) (340) (32) - (782) 86
Adjustments Restructuring expenses - 91 - - 90 1 - - 91 Unused vacations - (9) - (9) - - - - (9) Write-off of goods (print segment) - (66) - (66) - - - - (66) Audit expenses - 12 - - 12 - - - 12 Gain from disposal of investments - 13 - - - - 13 - 13 Prior periods income amount - (15) - - - - (15) - (15) Expenses reclassifications - (27) (3) 53 (74) (48) 24 21 (27) Other revenue differences - - - - - - - - - Reclass to research expenses - - (49) 49 - - - - - Total adjustments - (1) (52) 27 28 (47) 22 21 (1)
EBITDA (IFRS accounts) 3,479 (3,394) (1,529) (735) (312) (79) 22 (761) 85
Depreciation & amortization - (289) - (232) (57) - - - (289) SUBTOTAL 3,479 (3,683) (1,529) (967) (369) (79) 22 (761) (204)
Financial income 73 Financial expenses (1,670) Share in income of associated companies 38 Taxation (41) Non-controlling interest (19) Net loss attributable to shareholders of the company (1,823)

RBC Group Notes to the Consolidated Financial Statements for the year ended 31 December 2010
* The USD equivalent figures are provided for information purposes only and do not form part of the audited financial statements – refer to note 2(d).
29
Year ended 31 December 2009, Mln RUR
Revenue Expenses Payroll expenses
Cost of sales
Administrative expenses
Other operating expenses
Other operating
income
Selling expenses Profit/(loss)
Business internet 1,238 (987) (570) (46) (45) (2) - (324) 251 Consumer internet 627 (732) (272) (256) (93) (15) - (96) (105) TV 430 (719) (345) (156) (103) (19) - (96) (289) Printing 249 (400) (201) (83) (35) (1) - (80) (151) Salon 593 (514) (125) (166) (42) (19) - (162) 79 Banking 8 (19) - (3) (16) - - (11) EBITDA (management accounts) 3,145 (3,371) (1 ,513) (710) (334) (56) - (758) (226)
Adjustments Unused vacations - - 19 (19) - - - - - Impairment of intangible assets - (516) - - - (516) - - (516) Revenue from sale of TV equipment (34) 34 - - - - 34 - - Sale of IA (72) 72 - - - - 72 - - Expenses reclassifications - (2) 13 26 (29) 18 (30) - (2) Others 12 12 (6) 18 - - - - 24 Total adjustments (94) (400) 26 25 (29) (498) 76 - (494)
EBITDA (IFRS accounts) 3,051 (3,771) (1,487) (685) (363) (554) 76 (758) (720)
Depreciation & amortisation - (283) - (241) (42) - - - (283) SUBTOTAL 3,051 (4,054) (1,487) (926) (405) (554) 76 (758) (1,003)
Financial income 35 Financial expenses (573) Share in loss of associated companies (755) Taxation 377 Non-controlling interest (7) Net loss attributable to shareholders of the company (1,926)

RBC Group Notes to the Consolidated Financial Statements for the year ended 31 December 2010
* The USD equivalent figures are provided for information purposes only and do not form part of the audited financial statements – refer to note 2(d).
30
Year ended 31 December 2010, Mln USD* Revenue Expenses Payroll
expenses Cost of
sales Administrative
expenses
Other operating expenses
Other operating
income
Selling expenses Profit/(loss)
Business internet 45 (34) (16) (4) (2) - - (12) 11 Consumer internet 23 (25) (10) (9) (2) (1) - (3) (2) TV 16 (21) (12) (5) (2) - - (2) (5) Printing 11 (13) (6) (3) (1) - - (3) (2) Salon 19 (16) (5) (4) (1) - - (6) 3 Restructuring expenses - (3) - - (3) - - - (3) EBITDA (management accounts) 114 (112) (49) (25) (11) (1) - (26) 2
Adjustments Restructuring expenses - 3 - - 3 - - - 3 Unused vacations - - - - - - - - - Write-off of goods (print segment) - (2) - (2) - - - - (2) Audit expenses - - - - - - - - - Gain from disposal of investments - - - - - - - - - Prior periods income amount - - - - - - - - - Expenses reclassifications - - - 2 (2) (2) 1 1 - Other revenue differences - - - - - - - - - Reclass to research expenses - - (2) 2 - - - - - Total adjustments - 1 (2) 2 1 (2) 1 1 1
EBITDA (IFRS accounts) 114 (111) (51) (23) (10) (3) 1 (25) 3
Depreciation & amortization - (10) - (8) (2) - - - (10) SUBTOTAL 114 (121) (51) (31) (12) (3) 1 (25) (7)
Financial income 2 Financial expenses (55) Share in loss of associated companies 1 Taxation (1) Non-controlling interest (1) Net loss attributable to shareholders of the company (61)
RBC Group Notes to the Consolidated Financial Statements for the year ended 31 December 2010
* The USD equivalent figures are provided for information purposes only and do not form part of the audited financial statements – refer to note 2(d).
31
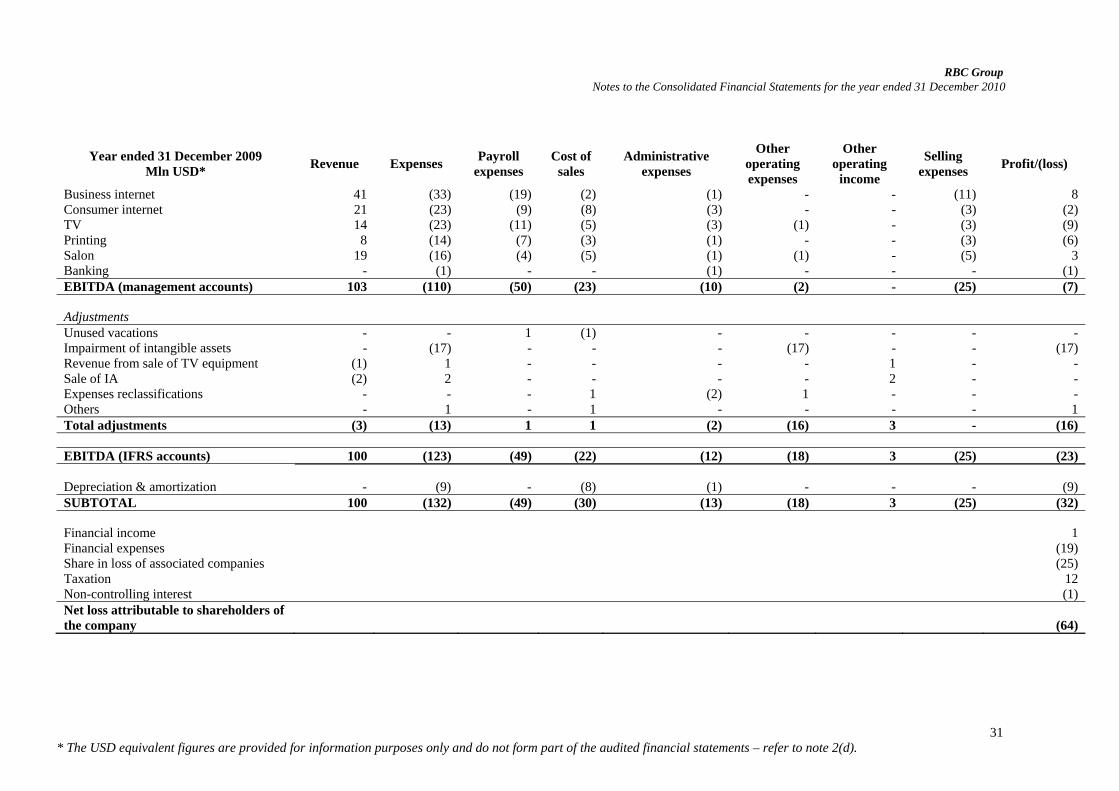
Year ended 31 December 2009 Mln USD* Revenue Expenses Payroll
expenses Cost of
sales Administrative
expenses
Other operating expenses
Other operating
income
Selling expenses Profit/(loss)
Business internet 41 (33) (19) (2) (1) - - (11) 8 Consumer internet 21 (23) (9) (8) (3) - - (3) (2) TV 14 (23) (11) (5) (3) (1) - (3) (9) Printing 8 (14) (7) (3) (1) - - (3) (6) Salon 19 (16) (4) (5) (1) (1) - (5) 3 Banking - (1) - - (1) - - - (1) EBITDA (management accounts) 103 (110) (50) (23) (10) (2) - (25) (7)
Adjustments Unused vacations - - 1 (1) - - - - - Impairment of intangible assets - (17) - - - (17) - - (17) Revenue from sale of TV equipment (1) 1 - - - - 1 - - Sale of IA (2) 2 - - - - 2 - - Expenses reclassifications - - - 1 (2) 1 - - - Others - 1 - 1 - - - - 1 Total adjustments (3) (13) 1 1 (2) (16) 3 - (16)
EBITDA (IFRS accounts) 100 (123) (49) (22) (12) (18) 3 (25) (23)
Depreciation & amortization - (9) - (8) (1) - - - (9) SUBTOTAL 100 (132) (49) (30) (13) (18) 3 (25) (32)
Financial income 1 Financial expenses (19) Share in loss of associated companies (25) Taxation 12 Non-controlling interest (1) Net loss attributable to shareholders of the company (64)

RBC Group Notes to the Consolidated Financial Statements for the year ended 31 December 2010
* The USD equivalent figures are provided for information purposes only and do not form part of the audited financial statements – refer to note 2(d).
32
6 Discontinued operations in 2009 In April 2009 the Group disposed of OJSC RBC Bank, the only legal entity comprising Banking segment. The Group sold 98% interest in OJSC RBC Bank, which represented all of its interest in the subsidiary, for RUR 300 million/ USD* 10 million. The loss from discontinued operations comprised RUR 45 million/ USD* 1 million, including the loss on disposal of RUR 17 million/ USD* 0.6 million.
4 months ended 28 April 2009
4 months ended 28 April 2009
Mln RUR Mln USD* Results of discontinued operations Revenue 8 - Cost of sales (3) - Gross profit 5 - Administrative expenses (22) (1) Results from operating activities (17) (1) Financial income 18 1 Profit before income tax 1 - Income tax expense (29) (1) Loss for the year (28) (1) Cash flows used in discontinued operations Net cash used in operating activities 136 4 Net cash flows used in discontinued operations 136 4
Effect of disposal on financial position of the Group
Carrying amount
at date of disposal Carrying amount at date of disposal
Mln RUR Mln USD* Non-current assets Property, plant and equipment 4 - Current assets Financial instruments at fair value through profit or loss 34 1 Cash and cash equivalents 459 15 Other assets 5 - Assets held for sale 50 2 Trade and other receivables 84 3 Non-current liabilities Deferred tax (7) - Current liabilities Trade and other payables (307) (10) Net identifiable assets, liabilities and contingent liabilities 322 11 Consideration received, satisfied in cash 300 10 Cash disposed of 459 15 Net cash outflow 159 5

RBC Group Notes to the Consolidated Financial Statements for the year ended 31 December 2010
* The USD equivalent figures are provided for information purposes only and do not form part of the audited financial statements – refer to note 2(d).
33
7 Acquisition and disposals of subsidiaries and non-controlling interest During 2010 the following entities were disposed with corresponding financial result: • Salon entities (CJSC Salon Office, CJSC Salon Press, CJSC Eidos Logistics, Ad Point Ltd., ASMC Ltd.) – gain of RUR 5 million /USD 0.2 million; • CJSC Nashi Dengi Volga – gain of RUR 7 million/USD 0.2 million.
Acquisition of LLC “RBC Money” in 2009
In March 2009 the Group completed acquisition of 74% of the shares in LLC “RBC Money” for RUR 90 million/ USD* 3 million. This acquisition was made consistent with the Group’s strategy, aiming for integration of electronic cash online payments business in the Consumer Internet business segment. LLC “RBC Money” provided services of electronic cash online payments.
A part of the purchase consideration in the amount of RUR 50 million/ USD* 2 million was settled in 2008 in the form of advertising services on RBC media resources provided by the Group to LLC “RBC Money”. The Group forgave a loan to the former owner of LLC “RBC Money” for an amount of RUR 40 million/ USD* 1 million as the remained part of consideration.
The impact of acquiring the subsidiary was to increase revenue for the year by RUR 9 million/USD* 0.3 million and to increase loss for the year by RUR 1 million/USD* 0.05 million.
The Group has determined fair value of identifiable tangible and intangible assets of the acquiree as at the acquisition date. The following assets have been identified:
Fair value Fair value Estimated remaining Mln RUR Mln USD* useful life, years Client base 7 - 6 Trademark 2 - 5
The acquisition of LLC “RBC Money” had the following effect on the Group’s assets and liabilities at the date of acquisition:
Recognized fair
values acquisition Recognized fair
values acquisition Mln RUR Mln USD* Non-current assets Property, plant and equipment 1 - Intangible assets 9 - Deferred tax asset 6 - Current assets Trade and other receivables 7 - Cash and cash equivalents 4 - Non-current liabilities Deferred tax liabilities (2) - Current liabilities Loans and borrowings (1) - Trade and other payables (37) (1) Net identifiable assets, liabilities and contingent liabilities (13) (1) Group's share in net identifiable assets, liabilities and contingent liabilities (10) - Goodwill on acquisition 100 3 Total consideration 90 3 Advertising services 50 2 Forgiven loan 40 1 Cash acquired 4 - Net cash inflow 4 -

RBC Group Notes to the Consolidated Financial Statements for the year ended 31 December 2010
* The USD equivalent figures are provided for information purposes only and do not form part of the audited financial statements – refer to note 2(d).
34
The gross contractual amounts receivable at the acquisition date was RUR 42 million/ USD* 1 million. The amount of RUR 35 million/ USD* 1 million was derecognized at the acquisition date, because the contractual cash flows are not expected to be collected.
Since the acquired subsidiary did not prepare IFRS financial statements before acquisition, it was impracticable to determine the effect of the acquisitions on consolidated revenue and profit for the year ended 31 December 2009, had the acquisition occurred on 1 January 2009.
Business combination for acquisition of LLC “RBC Money” was accounted under revised edition of IFRS 3 Business Combinations. Non-controlling interest was measured at the non-controlling interest’s proportionate share of the acquiree’s identifiable net assets in the amount of RUR 3 million/ USD* 0.1 million at the acquisition date. The goodwill in the amount of RUR 100 million/ USD* 3 million arose on the acquisition because the Group expects to benefit from synergy of LLC “RBC Money” integration into activities of its Consumer internet segment.
Disposal of control in LLC Fidel Solutions
In 2009 the Group disposed of its residual interest of 41% in LLC Fidel Solutions to its former owner for no consideration. There was no impact from the disposition on the loss for the year.
In August 2008 the Group disposed of 10% interest in LLC Fidel Solutions for no consideration to the former owners of the subsidiary. As a result, the Group’s ownership in LLC Fidel Solutions reduced from 51% to 41%. At the date of loss of control assets of LLC Fidel Solutions were RUR 24 million/ USD* 0.8 million and liabilities were RUR 36 million/ USD* 1.2 million.
A liability for additional 10% non-controlling interest in LLC Fidel Solutions in the amount of RUR 25 million/USD* 1 million recognized by the Group as at 31 December 2007, was derecognized at 31 December 2008 as the seller’s put option had not been exercised and expired. The excess of the value of derecognized liability over the carrying value of non-acquired non-controlling interest in the amount of RUR 24 million/ USD*1 million has been credited to equity.
Subsequent to the disposal of the control in LLC Fidel, the Group wrote off a loan issued to Fidel upon its acquisition in 2007 in the amount of RUR 29 million/USD* 1 million. In 2008 the Group recognized profit of RUR 12 million/ USD* 0.4 million from investments in LLC Fidel Solutions. Gain from disposal of the subsidiary in 2008 amounted to RUR 8 million/ USD* 0.3 million.
Acquisition of remaining 8% in Valento Commerce Limited
Share in investments to Valento Commerce (8%) was acquired from minority shareholders for advertising services providing in amount of RUR 176 million/USD* 6 million and cash paid of RUR 6 million/USD 0.2 million.
8 Revenue

RBC Group Notes to the Consolidated Financial Statements for the year ended 31 December 2010
* The USD equivalent figures are provided for information purposes only and do not form part of the audited financial statements – refer to note 2(d).
35
2010 2009 2010 2009 Mln RUR Mln RUR MlnUSD* Mln USD*
Revenue from sale of internet advertising services and hosting services
2,134 1,844 70 60
Revenue from sale of advertising services in printing segment and from sales on prints
862 810 28 27 Revenue from sale of TV advertising services
483 389 16 13
Revenue from banking services - 8 - - 3,479 3,051 114 100
In 2009 part of the revenue amounted RUR 43 million/USD 1 million from internet advertising services and hosting services was included in the revenue from of advertising services in printing segment. In 2010 the corresponding figure was included in the revenue from internet advertising services and hosting services. For comparability purpose 2009 figures were reclassified from the revenue from advertising services in printing segment to the revenue from internet advertising services and hosting services. The banking segment was disposed in April 2009 (Note 6).
9 Cost of sales
2010 2009 2010 2009 Mln RUR Mln RUR MlnUSD* Mln USD*
Payroll costs, including social charges 1,357 1,370 45 45 Depreciation and amortization 232 241 8 8 Rent expenses 108 137 4 4 Telecom expenses 151 150 5 5 Printing services 23 70 1 2 Content expenses 71 67 2 2 Domain names expenses 74 45 2 1 Conference costs 78 44 3 1 Other expenses 230 172 6 7
2,324 2,296 76 75 In 2009 part of telecom expenses amounted RUR 27 million/USD 1 million was included in other expenses. In 2010 the corresponding figure was included in telecom expenses. For comparability purpose 2009 figures were reclassified from other expenses to telecom expenses.
10 Other income
2010 2009 2010 2009 Mln RUR Mln RUR Mln USD* Mln USD*

RBC Group Notes to the Consolidated Financial Statements for the year ended 31 December 2010
* The USD equivalent figures are provided for information purposes only and do not form part of the audited financial statements – refer to note 2(d).
36
Gain on disposal of investments 13 - 1 - Other operating income 8 6 - - Non-repayable aid 1 4 - - Gain on disposal of intangible assets - 65 - 2 Gain on disposal of property, plant and equipment - 18 - 1
22 93 1 3
11 Selling expenses
Selling expenses are mainly represented by advertising expenses.
12 Administrative expenses
2010 2009 2010 2009 Mln RUR Mln RUR Mln USD* Mln USD*
Payroll costs, including social charges 172 117 6 4 Rent 96 104 3 3 Other administrative expenses 49 40 2 1 Material expenses 46 31 2 1 Depreciation, amortization 57 42 2 1 Communication 32 32 1 1 Consulting and legal expenses 29 76 1 2 Housing 25 20 1 1 Taxes other than profit tax 11 17 - 1 Business trips and transportation costs 11 7 - - Insurance 9 8 - - IT expenses 2 13 - 1 Information services 2 2 - - Employee compensation under share option program
- 13 - 1
541 522 18 17
13 Other expenses
2010 2009 2010 2009 Mln RUR Mln RUR Mln USD* Mln USD*
Other operating expenses 75 30 3 1 Penalties 3 3 - - Loss on disposal of inventories 1 5 - -

RBC Group Notes to the Consolidated Financial Statements for the year ended 31 December 2010
* The USD equivalent figures are provided for information purposes only and do not form part of the audited financial statements – refer to note 2(d).
37
79 38 3 1
14 Financial income and expenses
2010 2009 2010 2009 Mln RUR Mln RUR Mln USD* Mln USD*
Financial income Interest income 57 11 1 1 Other financial income 16 24 1 1
73 35 2 2
Financial expenses Loss on restructuring (659) - (22) - Interest expense (444) (405) (15) (13) Fines and penalties on overdue debts (405) - (13) - Foreign exchange loss, net (142) (103) (5) (3) Impairment loss on trade and other receivables (10) (50) - (2) Irredeemable loans and investments write-off (6) - - - Other financial expenses (4) (15) - (1)
(1,670) (573) (55) (19)
15 Income tax expense
2010 2009 2010 2009 Mln RUR Mln RUR Mln USD* Mln USD*
Current tax (expenses)/benefit (32) 45 (1) 1 Deferred tax (expenses)/benefit (9) 332 - 11
(41) 377 (1) 12
The applicable income tax rate for the Company and Russian subsidiaries is 20% (2009: 20%). Foreign subsidiaries pay income tax in accordance with the legislative requirements of their tax jurisdictions. For the entities located in Ukraine, the applicable tax rate is the corporate income tax rate of 25% (2009: 25%). For the entities located in Cyprus, the applicable tax rate is the corporate income tax rate of 10% (2009: 10%). An entity located in Netherland Antilles had tax loss in 2010 and 2009 (tax rate is variable from 2.4% to 30%). The income earned by entities incorporated in the British Virgin Islands is not currently subject to income tax.
Reconciliation of effective tax rate:
2010 2010 2009 2009 Mln RUR % Mln RUR %

RBC Group Notes to the Consolidated Financial Statements for the year ended 31 December 2010
* The USD equivalent figures are provided for information purposes only and do not form part of the audited financial statements – refer to note 2(d).
38
Loss before income tax (1,763) 100% (2,296) 100% Income tax at applicable tax rate 353 -20% 459 -20% Effect of income taxed at (lower)/higher rates 24 -1% (74) 3% Non-deductible expenses (1,602) 91% (1,350) 59% Non-taxable income 1,212 -69% 1,636 -71% Recognition of deferred tax for temporary differences from prior years (7) 0% 251 -11% Current year losses for which no deferred tax asset was recognized (19) 1% (612) 27% Under/over provided in prior years (2) 0% 67 -3%
(41) -2% 377 -16%
2010 2010 2009 2009 Mln USD* % Mln USD* %
Loss before income tax (60) 100% (75) 100% Income tax at applicable tax rate 12 -20% 15 -20% Effect of income taxed at (lower)/higher rates 1 -1% (2) 3% Non-deductible expenses (53) 91% (45) 59% Non-taxable income 40 -69% 54 -71% Recognition of deferred tax for temporary differences from prior years - 0% 8 -11% Current year losses for which no deferred tax asset was recognized (1) 1% (20) 27% Under/over provided in prior years - 0% 2 -3%
(1) -2% 12 -16%

RBC Group Notes to the Consolidated Financial Statements for the year ended 31 December 2010
* The USD equivalent figures are provided for information purposes only and do not form part of the audited financial statements – refer to note 2(d).
39
16 Property, plant and equipment
Cost, Mln RUR TV
equipment Computer equipment
Office equipment
Other assets
Construction-in-progress Prepayments Total
Balance at 1 January 2010 463 175 144 48 9 5 844 Additions - 32 - - - - 32 Transfer (261) 31 54 181 (1) (4) - Disposals (4) (34) (19) (10) (2) - (69) Balance at 31 December 2010 198 204 179 219 6 1 807
Accumulated depreciation, Mln RUR
Balance at 1 January 2010 (407) (87) (88) (21) - - (603) Transfer 225 (47) (42) (134) (2) - - Depreciation charge (6) (49) (38) (17) - - (110) Disposals 4 34 17 14 - - 69 Balance at 31 December 2010 (184) (149) (151) (158) (2) - (644)
Net book value At 1 January 2010 56 88 56 27 9 5 241 At 31 December 2010 14 55 28 61 4 1 163

RBC Group Notes to the Consolidated Financial Statements for the year ended 31 December 2010
* The USD equivalent figures are provided for information purposes only and do not form part of the audited financial statements – refer to note 2(d).
40
Cost, Mln RUR TV
equipment Computer equipment
Office equipment
Other assets
Construction-in-progress Prepayments Total
Balance at 1 January 2009 491 314 158 42 15 5 1,025 Acquisitions through business combinations - 1 - - - - 1 Additions 6 15 2 8 1 - 32 Transfer 7 - - - (7) - - Disposed with discontinued operation - (74) (7) (1) - - (82) Disposals (41) (81) (9) (1) - - (132) Balance at 31 December 2009 463 175 144 48 9 5 844
Accumulated depreciation, Mln RUR Balance at 1 January 2009 (408) (189) (60) (19) - - (676) Depreciation charge (22) (46) (40) (2) - - (110) Disposed with discontinued operation - 71 5 - - - 76 Disposals 23 77 7 - - - 107 Balance at 31 December 2009 (407) (87) (88) (21) - - (603)
Net book value At 1 January 2009 83 125 98 23 15 5 349 At 31 December 2009 56 88 56 27 9 5 241

RBC Group Notes to the Consolidated Financial Statements for the year ended 31 December 2010
* The USD equivalent figures are provided for information purposes only and do not form part of the audited financial statements – refer to note 2(d).
41
Cost, Mln USD* TV
equipment Computer equipment
Office equipment
Other assets
Construction-in-progress Prepayments Total
Balance at 1 January 2010 15 6 5 2 - - 28 Additions - 1 - - - - 1 Transfer (9) 1 2 6 - - - Disposals - (1) (1) - - - (2) Balance at 31 December 2010 6 7 6 8 - - 27
Accumulated depreciation, Mln USD* Balance at 1 January 2010 (13) (3) (3) (1) - - (20) Transfer 7 (2) (1) (4) - - - Depreciation charge - (2) (1) (1) - - (4) Disposals - 1 1 - - - 2 Balance at 31 December 2010 (6) (6) (4) (6) - - (22)
Net book value At 1 January 2010 2 3 2 1 - - 8 At 31 December 2010 - 1 2 2 - - 5

RBC Group Notes to the Consolidated Financial Statements for the year ended 31 December 2010
* The USD equivalent figures are provided for information purposes only and do not form part of the audited financial statements – refer to note 2(d).
42
Cost, Mln USD* TV
equipment Computer equipment
Office equipment
Other assets
Construction-in-progress Prepayments Total
Balance at 1 January 2009 16 10 5 1 - - 32 Acquisitions through business combinations - - - - - - - Additions - - - 1 - - 1 Disposed with discontinued operation - (2) - - - - (2) Disposals (1) (2) - - - - (3) Transfer - - - - - - - Balance at 31 December 2009 15 6 5 2 - - 28
Accumulated depreciation, Mln USD* Balance at 1 January 2009 (13) (6) (2) (1) - - (22) Depreciation charge (1) (2) (1) - - - (4) Disposed with discontinued operation - 2 - - - - 2 Disposals 1 3 - - - - 4 Balance at 31 December 2009 (13) (3) (3) (1) - - (20)
Net book value At 1 January 2009 3 4 3 - - - 10 At 31 December 2009 2 3 2 1 - - 8

RBC Group Notes to the Consolidated Financial Statements for the year ended 31 December 2010
* The USD equivalent figures are provided for information purposes only and do not form part of the audited financial statements – refer to note 2(d).
43
17 Intangible assets
Mln RUR Trade marks Software
Web-sites Brands Prepayments
Cable network
connection Goodwill Customer
list Other Total Cost At 1 January 2010 482 447 544 515 - 657 1,690 198 230 4,763 Transfer 6 (67) (17) 19 56 9 - (6) - Additions 3 54 26 - - - - - - 83 Disposals - - - - - - - - - - At 31 December 2010 491 434 553 534 - 713 1,699 198 224 4,846
Amortization At 1 January 2010 (286) (401) (474) (502) - (104) (1,486) (141) (201) (3,595) Transfer (8) 65 3 - (58) - - (2) - Amortization charge (34) (50) (34) (3) - (45) - (11) (2) (179) Disposals - - - - - - - - - - At 31 December 2010 (328) (386) (505) (505) - (207) (1,486) (152) (205) (3,774)
Net book value At 1 January 2010 196 46 70 13 - 553 204 57 29 1,168 At 31 December 2010 163 48 48 29 - 506 213 46 19 1,072

RBC Group Notes to the Consolidated Financial Statements for the year ended 31 December 2010
* The USD equivalent figures are provided for information purposes only and do not form part of the audited financial statements – refer to note 2(d).
44
Mln RUR Trade marks Software
Web-sites Brands Prepayments
Cable network
connection Goodwill Customer
list Other Total Cost At 1 January 2009 480 349 510 525 51 647 1,784 197 249 4,792 Additions - 59 34 - - - - - 1 94 Additions through business combinations 2 - - - - - 100 7 - 109 Disposals - - - (10) - - - - - (10) Disposed through disposals of subsidiaries - (2) - - - - (194) (6) (20) (222) Transfers - 41 - - (51) 10 - - - - At 31 December 2009 482 447 544 515 - 657 1,690 198 230 4,763
Amortization At 1 January 2009 (149) (315) (445) (503) - (57) (1,340) (101) (221) (3,131) Additions (31) (47) (29) (2) - (47) - (16) (1) (173) Additions through business combinations - - - 3 - - - - - 3 Disposals - 2 - - - - 193 6 21 222 Disposed through disposals of subsidiaries (106) (41) - - - - (339) (30) - (516) At 31 December 2009 (286) (401) (474) (502) - (104) (1,486) (141) (201) (3,595)
Net book value At 1 January 2009 331 34 65 22 51 590 444 96 28 1,661 At 31 December 2009 196 46 70 13 - 553 204 57 29 1,168

RBC Group Notes to the Consolidated Financial Statements for the year ended 31 December 2010
* The USD equivalent figures are provided for information purposes only and do not form part of the audited financial statements – refer to note 2(d).
45
Mln USD* Trade marks Software
Web-sites Brands Prepayments
Cable network
connection Goodwill Customer
list Other Total Cost At 1 January 2010 16 15 18 17 - 22 55 6 8 157 Transfer - (2) (1) 1 - 2 - - - - Additions - 2 - - - - - - - 2 Disposals - - - - - - - - - - At 31 December 2010 16 15 17 18 - 24 55 6 8 159
Amortization At 1 January 2010 (9) (13) (16) (16) - (3) (49) (5) (7) (118) Transfer - 2 - - - (2) - - - - Amortization charge (1) (2) (1) - - (2) - - - (6) Disposals - - - - - - - - - - At 31 December 2010 (10) (13) (17) (16) - (7) (49) (5) (7) (124)
Net book value At 1 January 2010 7 2 2 1 - 19 6 1 1 39 At 31 December 2010 6 2 - 2 - 17 6 1 1 35

RBC Group Notes to the Consolidated Financial Statements for the year ended 31 December 2010
* The USD equivalent figures are provided for information purposes only and do not form part of the audited financial statements – refer to note 2(d).
46
Mln USD* Trade marks Software
Web-sites Brands Prepayments
Cable network
connection Goodwill Customer
list Other Total Cost At 1 January 2009 16 11 17 17 2 21 59 6 8 157 Additions - 2 1 - - 1 - - 1 5 Additions through business combinations - - - - - - 3 - - 3 Disposals - - - - - - - - - - Disposed through disposals of subsidiaries - - - - - - (7) - (1) (8) Transfers - 2 - - (2) - - - - - At 31 December 2009 16 15 18 17 - 22 55 6 8 157
Amortization At 1 January 2009 (5) (10) (15) (16) - (2) (44) (3) (7) (102) Additions (1) (2) (1) - - (1) - (1) - (6) Additions through business combinations - - - - - - - - - - Disposals - - - - - - 6 - - 6 Disposed through disposals of subsidiaries (3) (1) - - - - (11) (1) - (16) Transfers - - - - - - - - - - At 31 December 2009 (9) (13) (16) (16) - (3) (49) (5) (7) (118)
Net book value At 1 January 2009 11 1 2 1 2 19 15 3 1 55 At 31 December 2009 7 2 2 1 - 19 6 1 1 39

RBC Group Notes to the Consolidated Financial Statements for the year ended 31 December 2010
* The USD equivalent figures are provided for information purposes only and do not form part of the audited financial statements – refer to note 2(d).
47
(a) Amortization charge
The amortization charge for the year is included in “Cost of sales” and “Administrative expenses”.
(b) Non-cash acquisition of intangible assets
In 2009 the Group acquired license with a carrying value of RUR 55 million/ USD* 2 million from a related party in exchange for advertising services.
(c) Impairment testing and write off
All intangible assets were tested for impairment as at 31 December 2010 within those cash generating units where they belonged and no assets (2009: RUR 39 million/ USD* 1 million) were individually impaired.
(d) Reclassifications of intangible assets between the groups in 2010
The management of the Group decided to change the format of the presentation of intangible assets types included in the consolidated financial statement compared to the year ended 31 December 2009. The reason of this change is to provide the users of the consolidated financial statements with a more detailed understanding of the intangible assets of the Group.
18 Impairment For the purposes of impairment testing the following cash generating units (“CGUs”) were identified: Consumer internet, Salon, Business internet, Hosting, TRK MKS, Atwood, Limandora, CJSC Yuzhny Region – Telekommunikacii, BidLive and iGlobe.
For the purposes of impairment testing, the goodwill has been allocated to two cash generating units, namely Consumer internet, Hosting. These cash generating units included respective Group entities whose acquisition resulted in recognition of the goodwill. These units represent the lowest level within the Group at which the goodwill is monitored for internal management purposes.
For the purpose of impairment testing all other non-financial assets of the Group were allocated to cash generating units set out below. The values assigned to the key assumptions represent management’s assessment of future trends in the business and are based on both external sources and internal sources.
For the purposes of impairment testing the recoverable amount of each business was assumed to be equal to its value in use (discounted cash flow).
(i) Consumer internet business
This cash generating unit comprises consumer internet, which attracts advertising revenue from third parties. Also in 2009 the RBC Money business was included in Consumer Internet business CGU due to its activities being tightly interrelated with the CGU operations.
The following key assumptions were used in determining the recoverable amount of the non-financial assets attributable to the cash generating unit for Consumer Internet projects:
• Cash flows were projected based on actual operating results for 2010 and the five-year business plan for 2011-2015. Net cash flows in the post-forecast period were determined assuming a 3.5% growth per year;
• Annual revenue from internet advertising was projected to increase in the following years by 41% in 2011, by 29% in 2012, by 25% in 2013, by 22% in 2014 and by 20% in 2015;

RBC Group Notes to the Consolidated Financial Statements for the year ended 31 December 2010
* The USD equivalent figures are provided for information purposes only and do not form part of the audited financial statements – refer to note 2(d).
48
• Annual expenses were projected to increase by 12% in 2011 as compared to 2010, and to increase by 10% in 2012, by 10% in 2013, by 10% in 2014 and by 9% in 2015;
A nominal after-tax discount rate of 18% was applied in determining the recoverable amount of the cash-generating unit. The discount rate used was based on an industry average weighted average cost of capital. As a result of the above test the recoverable amount of the cash-generating unit exceeded its carrying amount.
The above estimates are particularly sensitive in the following areas:
• An increase of one percentage point in the discount rate used would result in no impairment.
• A 10% decrease in annual sales would result in no impairment. For the CGU recoverable amount to be equal to its carrying amount the following changes in the amounts of the values assigned to the key assumptions must take place:
• An increase of discount rate used in Consumer Internet business fair value estimation by 3%; or
• A 30% decrease in annual sales of Consumer Internet business.
(ii) Salon business
This cash generating unit includes subsidiaries of EDI S Press Holding, involved in publishing and distribution of magazines “Idei Vashego Doma”, “Interier-Magazin”, “Salon-Interier” and others, in Russia and Ukraine.
The following key assumptions were used in determining the recoverable amount of the non-financial assets attributable to the cash generating unit:
• Cash flows were projected to be based on actual operating results for 2010 and the five-year business plan for 2011-2015. Net cash flows in the post-forecast period were determined assuming a 3.5% growth per year.
• Annual print advertising sales were projected to change as 3% growth in 2011, 7% growth in 2012 and 8% growth in 2013-2015;
• Annual internet advertising sales were projected to change as 83% growth in 2011, 30% growth in 2012, 15% growth in 2013, 15% growth in 2014 and 2015);
• Annual sales of prints have been projected to grow as 2% in 2011, 10% in 2012, 5% in 2013-2015;
• Annual expenses were projected to grow by 14% in 2011, by 3% in 2012, by 7% in 2013-2015;
• A nominal after-tax discount rate of 16% was applied in determining the recoverable amount of the cash-generating unit. The discount rate used was based on an industry average weighted average cost of capital.
As a result of the above test the recoverable amount of the cash-generating unit exceeded its carrying amount.
The above estimates are particularly sensitive in the following areas:
• An increase of one percentage point in the discount rate used would result in no impairment.
• A 10% decrease in annual sales would result in no impairment. For the CGU recoverable amount to be equal to its carrying amount the following changes in the amounts of the values assigned to the key assumptions must take place:
• An increase of discount rate by 32%; or

RBC Group Notes to the Consolidated Financial Statements for the year ended 31 December 2010
* The USD equivalent figures are provided for information purposes only and do not form part of the audited financial statements – refer to note 2(d).
49
• A 12% decrease in annual sales.
(iii) Business Internet
This cash generating unit includes subsidiaries involved in business internet activities.
The following key assumptions were used in determining the recoverable amount of the non-financial assets attributable to the cash generating unit:
• Cash flows were projected to be based on actual operating results for 2010 and on the five-year business plan for 2011-2015. Net cash flows in the post-forecast period were determined assuming a 3.5% growth per year.
• Annual internet advertising sales were projected to change as 65% growth in 2011, 42% growth in 2012-2015);
• Annual expenses were projected to increase by 37% in 2011, by 41% in 2012, by 25% in 2013, by 32% in 2014 and by 29% in 2015;
• A nominal after-tax discount rate of 18% was applied in determining the recoverable amount of the cash-generating unit. The discount rate used was based on an industry average weighted average cost of capital.
As a result of the above test the recoverable amount of the cash-generating unit exceeded its carrying amount.
The above estimates are not sensitive in the following areas:
• An increase of one percentage point in the discount rate used would result in no impairment;
• A reduction in the annual sales by 10% would result in no impairment. For the CGU recoverable amount to be equal to its carrying amount the following changes in the amounts of the values assigned to the key assumptions must take place:
• An increase of discount rate by 11%; or
• A 27% decrease in annual sales.
(iv) Business Print
This cash generating unit includes subsidiaries involved in publication and distribution of the newspaper “RBC daily” and magazine “RBC” in Russia.
The following key assumptions were used in determining the recoverable amount of the non-financial assets attributable to the cash generating unit:
• Cash flows were projected to be based on actual operating results for 2010 and on the five-year business plan for 2011-2015. Net cash flows in the post-forecast period were determined assuming a 3.5% growth per year.
• Annual sales of advertising in prints were projected to change as 26% growth in 2011-2015);
• Annual expenses were projected to increase by 37% in 2011, by 41% in 2012, by 25% in 2013, by 32% in 2014 and by 29% in 2015;
• A nominal after-tax discount rate of 18% was applied in determining the recoverable amount of the cash-generating unit. The discount rate used was based on an industry average weighted average cost of capital.

RBC Group Notes to the Consolidated Financial Statements for the year ended 31 December 2010
* The USD equivalent figures are provided for information purposes only and do not form part of the audited financial statements – refer to note 2(d).
50
As a result of the above test the recoverable amount of the cash-generating unit exceeded its carrying amount.
The above estimates are not sensitive in the following areas:
• An increase of one percentage point in the discount rate used would result in no impairment;
• A reduction in the annual sales by 10% would result in no impairment. For the CGU recoverable amount to be equal to its carrying amount the following changes in the amounts of the values assigned to the key assumptions must take place:
• An increase of discount rate by 11%; or
• A 27% decrease in annual sales.
(v) Business TV
This cash generating unit includes subsidiaries involved in operating RBC-TV channel in Russia and abroad.
The following key assumptions were used in determining the recoverable amount of the non-financial assets attributable to the cash generating unit:
• Cash flows were projected to be based on actual operating results for 2010 and on the five-year business plan for 2011-2015. Net cash flows in the post-forecast period were determined assuming a 3.5% growth per year.
• Annual TV advertising sales were projected to change as 35% growth in 2011, 20% growth in 2012, 24% growth in 2013-2015);
• Annual expenses were projected to increase by 37% in 2011, by 41% in 2012, by 25% in 2013, by 32% in 2014 and by 29% in 2015;
• A nominal after-tax discount rate of 18% was applied in determining the recoverable amount of the cash-generating unit. The discount rate used was based on an industry average weighted average cost of capital.
As a result of the above test the recoverable amount of the cash-generating unit exceeded its carrying amount.
The above estimates are not sensitive in the following areas:
• An increase of one percentage point in the discount rate used would result in no impairment;
• A reduction in the annual sales by 10% would result in no impairment. For the CGU recoverable amount to be equal to its carrying amount the following changes in the amounts of the values assigned to the key assumptions must take place:
• An increase of discount rate by 11%; or
• A 27% decrease in annual sales.
(vi) Hosting business
This cash generating unit includes subsidiaries involved in provision of web hosting services in Russia.
The following key assumptions were used in determining the recoverable amount of the non-financial assets attributable to the cash generating unit:

RBC Group Notes to the Consolidated Financial Statements for the year ended 31 December 2010
* The USD equivalent figures are provided for information purposes only and do not form part of the audited financial statements – refer to note 2(d).
51
• Cash flows were projected to be based on actual operating results for 2010 and on the five-year business plan for 2011-2015. Net cash flows in the post-forecast period were determined assuming a 3.5% growth per year.
• Revenue was projected to grow by 19% in 2011, by 34% in 2012, by 3% in 2013, by 5% in 2014 and by 7% in 2015;
• Annual expenses were projected to increase by 15% in 2011, by 21% in 2012, by 3% in 2013, by 5% in 2014 and by 7% in 2015;
• A nominal after-tax discount rate of 18% was applied in determining the recoverable amount of the cash-generating unit. The discount rate used was based on an industry average weighted average cost of capital.
• As a result of the above test the recoverable amount of the cash-generating unit exceeded its carrying amount.
The above estimates are particularly sensitive in the following areas:
• An increase of one percentage point in the discount rate used would result in no impairment;
• A reduction in the annual sales by 10% would result in no impairment. For the CGU recoverable amount to be equal to its carrying amount the following changes in the amounts of the values assigned to the key assumptions must take place:
• An increase of discount rate by 79%; or
• A 40% decrease in annual sales.
(vii) TRK MKS
This cash generating unit includes CJSC TRK Molodaya Kultura Sibiri, which provides RBC-TV broadcasting services in the Novosibirsk region.
The following key assumptions were used in determining the recoverable amount of the non-financial assets attributable to the cash generating unit:
• Cash flows were projected to be based on actual operating results for 2010 and on the five-year business plan for 2011-2015. Net cash flows in the post-forecast period were determined assuming a 3.5% growth per year.
• Annual TV advertising sales were projected to change in line with the Russian TV advertising market (27% growth in 2011, no change in 2012-2013, 20% growth in 2014-2015);
• Annual EBITDA was projected to grow 42% in 2011, 11% in 2012, 10% in 2013, 31% in 2014 and 30% in 2015;
• A nominal after-tax discount rate of 15% was applied in determining the recoverable amount of the cash-generating unit. The discount rate used was based on an industry average weighted average cost of capital.
As a result of the above test the recoverable amount of the cash-generating unit exceeded its carrying amount.
The above estimates are not sensitive in the following areas:
• An increase of one percentage point in the discount rate used would result in impairment of million 0.3 RUR;
• A reduction in the annual sales by 10% would result in impairment of RUR 1 million.

RBC Group Notes to the Consolidated Financial Statements for the year ended 31 December 2010
* The USD equivalent figures are provided for information purposes only and do not form part of the audited financial statements – refer to note 2(d).
52
For the CGU recoverable amount to be equal to its carrying amount the following changes in the amounts of the values assigned to the key assumptions must take place:
• An increase of discount rate by 1%; or
• A 7% decrease in annual sales.
(viii) Atwood Lake Ltd
The Group performed an impairment testing of the investment in its associate, Atwood Lake Ltd., at 31 December 2010. The following key assumptions for impairment testing were used for Atwood operations:
• Cash flows were projected to be based on actual operating results for 2010 and on the five-year business plan for 2011-2015. Net cash flows in the post-forecast period were determined assuming a 3.5% growth per year.
• Annual advertising sale were projected to grow in 2012 by 41%, by 40% in 2013, by 28% in 2014, and to grow by 22% in 2015;
• Annual expenses were projected to increase by 42% in 2012, by 17% in 2013, by 36% in 2014, by 26% in 2015;
• A nominal after-tax discount rate of 18% was applied in determining the recoverable amount of the cash-generating unit. The discount rate used was based on an industry average weighted average cost of capital.
As a result of the above test the recoverable amount of the cash-generating unit exceeded its carrying amount.
The above estimates are not sensitive in the following areas:
• An increase of one percentage point in the discount rate used would result in no impairment;
• A reduction in the annual sales by 10% would result in impairment of RUR 81 million/ USD 3 million.
For the CGU recoverable amount to be equal to its carrying amount the following changes in the amounts of the values assigned to the key assumptions must take place:
• A decrease of discount rate used in Atwood business fair value estimation by 79%; or
• A 2% decrease in annual sales of Atwood business.
(ix) Limandora
The Group performed an impairment testing of the investment in its associate, Limandora Ltd, at 31 December 2010. The following key assumptions for impairment testing were used:
• Cash flows were projected to be based on actual operating results for 2010 and on the five-year business plan for 2011-2015. Net cash flows in the post-forecast period were determined assuming a 3.5% growth per year.
• Annual advertising sales were projected to grow by 110% in 2011, by 46% in 2012, by 43% in 2013, by 21% in 2014 and by 9% in 2015;
• Annual costs were projected to increase by 41% in 2011, by 6% in 2012, decrease by 2% in 2013, increase by 5% in 2014 and by 4% in 2015;

RBC Group Notes to the Consolidated Financial Statements for the year ended 31 December 2010
* The USD equivalent figures are provided for information purposes only and do not form part of the audited financial statements – refer to note 2(d).
53
• A nominal after-tax discount rate of 18% was applied in determining the recoverable amount of the cash-generating unit. The discount rate used was based on an industry average weighted average cost of capital.
As a result of the above test the recoverable amount of the cash-generating unit exceeded its carrying amount.
The above estimates are not sensitive in the following areas:
• An increase of one percentage point in the discount rate used would result in no impairment;
• A reduction in the annual sales by 10% would result in no impairment. For the CGU recoverable amount to be equal to its carrying amount the following changes in the amounts of the values assigned to the key assumptions must take place:
• An increase of discount rate by 25%; or
• A 39% decrease in annual sales.
(x) CJSC Yuzhny Region – Telekommunikacii
The Group performed an impairment testing of the investment in its associate, CJSC Yuzhny Region-Telekommunikacii, at 31 December 2010. The following key assumptions for impairment testing were used:
• Cash flows were projected to be based on actual operating results for 2010 and on the five-year business plan for 2011-2015. Net cash flows in the post-forecast period were determined assuming a 3.5% growth per year.
• Annual TV advertising revenue were projected to change as 65% growth in 2011, 26% growth in 2012, 23% growth in 2013, 21% growth in 2014 and 19% in 2015;
• The ratio of annual EBITDA to revenue was projected to be 17% in 2011-2012, 18% in 2013, 19% in 2014 and 20% in 2015;
• A nominal after-tax discount rate of 15% was applied in determining the recoverable amount of the cash-generating unit. The discount rate used was based on an industry average weighted average cost of capital.
As a result of the above test the recoverable amount of the cash-generating unit exceeded its carrying amount.
The above estimates are not sensitive in the following areas:
• An increase of one percentage point in the discount rate used would result in no impairment;
• A reduction in the annual sales by 10% would result in no impairment. For the CGU recoverable amount to be equal to its carrying amount the following changes in the amounts of the values assigned to the key assumptions must take place:
• An increase of discount rate by 3%; or
• A 24% decrease in annual sales.

RBC Group Notes to the Consolidated Financial Statements for the year ended 31 December 2010
* The USD equivalent figures are provided for information purposes only and do not form part of the audited financial statements – refer to note 2(d).
54
(xi) BidLive
The Group performed an impairment testing of the investment in its joint venture, BidLive, at 31 December 2010. The following key assumptions for impairment testing were used:
• Cash flows were projected to be based on actual operating results for 2010 and on the five-year business plan for 2011-2015. Net cash flows in the post-forecast period were determined assuming a 3.5% growth per year.
• Annual revenue was projected to grow tremendously in 2011-2012 as connected to rapidly growing business and to proceed with growth of 12% in 2013, 7% in 2014 and 5% in 2015;
• Annual costs were projected to grow tremendously in 2011-2012 as connected to rapidly growing business and to proceed with growth of 10% in 2013, 4% in 2014 and 2% in 2015;
• A nominal after-tax discount rate of 18% was applied in determining the recoverable amount of the cash-generating unit. The discount rate used was based on an industry average weighted average cost of capital.
As a result of the above test the recoverable amount of the cash-generating unit exceeded its carrying amount.
The above estimates are not sensitive in the following areas:
• An increase of one percentage point in the discount rate used would result in no impairment;
• A reduction in the annual sales by 10% would result in no impairment. For the CGU recoverable amount to be equal to its carrying amount the following changes in the amounts of the values assigned to the key assumptions must take place:
• An increase of discount rate by 28%.
(xii) iGlobe
The Group performed an impairment testing of the investment in its associate, iGlobe, at 31 December 2010. The following key assumptions for impairment testing were used:
• Cash flows were projected to be based on actual operating results for 2010 and on the five-year business plan for 2011-2015. Net cash flows in the post-forecast period were determined assuming a 3.5% growth per year.
• Annual revenue was projected to grow tremendously in 2011-2012 as connected to rapidly growing business and to proceed with its growth as 152% in 2013, 148% in 2014 and 59% in 2015;
• Annual cost was projected to grow tremendously in 2011-2012 as connected to rapidly growing business and to proceed with its growth as 132% in 2013, 138% in 2014 and 57% in 2015;
• A nominal after-tax discount rate of 18% was applied in determining the recoverable amount of the cash-generating unit. The discount rate used was based on an industry average weighted average cost of capital.
As a result of the above test the recoverable amount of the cash-generating unit exceeded its carrying amount.
The above estimates are not sensitive in the following areas:
• An increase of one percentage point in the discount rate used would result in no impairment;

RBC Group Notes to the Consolidated Financial Statements for the year ended 31 December 2010
* The USD equivalent figures are provided for information purposes only and do not form part of the audited financial statements – refer to note 2(d).
55
• A reduction in the annual sales by 10% would result in no impairment. For the CGU recoverable amount to be equal to its carrying amount the following changes in the amounts of the values assigned to the key assumptions must take place:
• An increase of discount rate by 65%; or
• A 45% decrease in annual sales.
There was no recognized impairment loss by the Group in 2010. The recognized impairment loss as at 31 December 2009 is summarized in tables below:
Impairment loss allocation as at 31 December 2009, Mln RUR
Cash generating unit Goodwill Intangible
assets Investments Total Consumer Internet business 109 - - 109 Salon business - 138 - 138 Hosting business 230 - - 230 Atwood Lake Ltd. - - 728 728 Individually impaired intangible assets - 39 - 39 339 177 728 1,244 Impairment loss allocation as at 31 December 2009, Mln USD*
Cash generating unit Goodwill Intangible
assets Investments Total Consumer Internet business 4 - - 4 Salon business - 5 - 5 Hosting business 8 - - 8 Atwood Lake Ltd. - - 24 24 Individually impaired intangible assets - 1 - 1 12 6 24 42

RBC Group Notes to the Consolidated Financial Statements for the year ended 31 December 2010
* The USD equivalent figures are provided for information purposes only and do not form part of the audited financial statements – refer to note 2(d).
56
19 Investments in associates and joint ventures As at 31 December 2010 the Group had the following investments in the associates and joint ventures:
Carrying value at 31 December 2009
Acquisition 2010
Recognized income/(loss)
Carrying value at 31 December 2010
Mln RUR Mln RUR Mln RUR Mln RUR Atwood Lake Ltd. 75 - 38 113 Limandora Ltd. 29 - (2) 27 CJSC Yuzhny Region-Telecommunikacii 25 - 2 27 IGlobe - 76 - 76 BidLive - 60 - 60
129 136 38 303
Carrying value at 31 December 2009
Acquisition 2010
Recognized income/(loss)
Carrying value at 31 December 2010
Mln USD* Mln USD* Mln USD* Mln USD* Atwood Lake Ltd. 3 - 2 5 Limandora Ltd. - - - - CJSC Yuzhny Region-Telecommunikacii 1 - - 1 IGlobe - 2 - 2 BidLive - 2 - 2
4 4 2 10
As at 31 December 2009 the Group had the following investments in the associates and joint ventures:
Carrying value before
impairment loss Recognized
income/(loss) Impairment
loss Carrying value at 31 December 2009
Mln RUR Mln RUR Mln RUR Mln RUR Atwood Lake Ltd. 809 (6) (728) 75 Limandora Ltd. 48 (19) - 29 CJSC Yuzhny Region-Telecommunikacii 27 (2) - 25
884 (27) (728) 129
Carrying value before
impairment loss Recognized
income/(loss) Impairment
loss Carrying value at 31 December 2009
Mln USD* Mln USD* Mln USD* Mln USD* Atwood Lake Ltd. 27 - (24) 3 Limandora Ltd. 1 (1) - - CJSC Yuzhny Region-Telecommunikacii 1 - - 1
29 (1) (24) 4

RBC Group Notes to the Consolidated Financial Statements for the year ended 31 December 2010
* The USD equivalent figures are provided for information purposes only and do not form part of the audited financial statements – refer to note 2(d).
57
The following is summarized financial information, in aggregate, in respect of the associates and joint ventures:
31 December
2010 31 December
2009 31 December
2010 31 December
2009 Mln RUR Mln RUR Mln USD* Mln USD*
Total assets 700 551 23 18 Total liabilities (285) (276) (9) (9) Revenue 404 192 13 6 Profit/(loss) for the year 91 (50) 3 (2)
(a) Atwood Lake Ltd
In 2010 the Group recognized profit of RUR 38 million/ USD* 2 million (2009: loss of RUR 6 million) from investments in Atwood Lake Ltd.
In 2008 the Group acquired 40% of the shares in Atwood Lake Ltd. Atwood Lake Ltd owns brand and software for internet resource 4shared.com.
The impairment of the investment in Atwood Lake Ltd. of RUR 728 million/USD* 24 million was recognized at 31 December 2009.
(b) Limandora Ltd
In 2010 the Group got loss of RUR 2 million/ USD* 0.07 million (2009: loss of RUR 19 million/ USD* 1 million) from investments in Limandora Ltd.
In 2008 the Group acquired 51% of the shares in Limandora Ltd. According to the investment agreement, the Group and the second owner have equal voting rights in the annual general meeting of shareholders so the Group does not have control over Limandora Ltd. but has significant influence.. Therefore, the investment in Limandora Ltd. is accounted by equity method.
Limandora Ltd. owns internet resource - a new consumer web-site for children.
(c) CJSC Yuzhny Region – Telekommunikacii
In 2010 the Group recognized profit of RUR 2 million/ USD* 0.05 million (2009: loss of RUR 2 million) from investments in CJSC Yuzhny Region – Telekommunikacii. The Group acquired 50% of CJSC Yuzhny Region – Telekommunikacii in 2007.
(d) Braddy S.A.
In 2010 the Group launched acquisition of 25% Braddy S.A. for RUR 76 million/USD* 2 million.
In 2010 the Group paid for shares RUR 1 million in cash and RUR 48 million rendered advertising services. In the I quarter 2011 the Group additionally rendered advertising services in amount RUR 27 million.

RBC Group Notes to the Consolidated Financial Statements for the year ended 31 December 2010
* The USD equivalent figures are provided for information purposes only and do not form part of the audited financial statements – refer to note 2(d).
58
In 2010 the Group recognized zero profit from investments in Braddy S.A. because its annual result was immaterial.
Braddy S.A. owns internet resource iglobe.ru - a web-site for travellers who booked tickets and hotels on-line.
(e) LLC BidLive Russia
In 2010 the Group launched acquisition of 45% LLC BidLive Russia for RUR 60 million/USD* 2 million.
In 2010 the Group recognized zero profit from investments in LLC BidLive Russia because its annual result was immaterial.
LLC BidLive Russia owns internet resource intermediate to sale the property
20 Other investments
31 December 2010
31 December 2009
31 December 2010
31 December 2009
Mln RUR Mln RUR Mln USD* Mln USD* Non-current Loans granted to employees 4 6 - - Loans granted to third parties - 5 - - Loans granted to related parties - 1 - - Other investments 4 1 - -
8 13 - -
Current Investments designated at fair value through profit and loss 10 10 1 1 Promissory notes held to maturity 9 8 - - Other investments 8 2 - - Loans granted to third parties 5 - - - Loans granted to related parties - 2 - -
32 22 1 1
21 Other non-current assets Other assets represent contracts for the acquisition of property in the amount of RUR 127 million/ USD 4 million (2009: RUR 104 million/USD 3 million) for the construction of apartments in residential buildings in Moscow and Moscow region and are stated at cost less accumulated impairment if any. These assets were obtained as payment for the rendered advertising services and will be sold by the Group.

RBC Group Notes to the Consolidated Financial Statements for the year ended 31 December 2010
* The USD equivalent figures are provided for information purposes only and do not form part of the audited financial statements – refer to note 2(d).
59
22 Deferred tax assets and liabilities
(a) Recognized deferred tax assets and liabilities
Deferred tax assets and liabilities are attributable to the following:
Assets Liabilities Net Movement
Mln RUR 31 December
2010 31 December
2009 31 December
2010 31 December
2009 31 December
2010 31 December
2009 2 010 Property, plant and equipment 6 13 (11) (22) (5) (9) 4 Intangible assets 7 24 (124) (144) (117) (120) 3 Investments 44 1 (28) - 16 1 15 Inventory 22 12 - (3) 22 9 13 Trade and other receivables 78 40 (4) (3) 74 37 37 Prepaid expenses 18 6 (7) (3) 11 3 8 Loans and Borrowings - - (7) - (7) - (7) Trade and other payables 8 6 (31) (5) (23) 1 (24) Tax loss carry forwards 218 275 (1) - 217 275 (58) Tax assets/(liabilities) 401 377 (213) (180) 188 197 (9)
Assets Liabilities Net Movement
Mln USD* 31 December
2010 31 December
2009 31 December
2010 31 December
2009 31 December
2010 31 December
2009 2 010 Property, plant and equipment - - - (1) - (1) 1 Intangible assets - 1 (4) (5) (4) (4) - Investments 1 - (1) - - - - Inventory 1 - - - 1 - 1 Trade and other receivables 3 1 - - 3 1 2 Prepaid expenses 1 - - - 1 - 1 Loans and Borrowings - - - - - - - Trade and other payables - - (1) - (1) - (1) Tax loss carry forwards 7 9 - - 7 9 (2) Tax assets/(liabilities) 13 11 (6) (6) 7 5 2

RBC Group Notes to the Consolidated Financial Statements for the year ended 31 December 2010
* The USD equivalent figures are provided for information purposes only and do not form part of the audited financial statements – refer to note 2(d).
60
Unrecognized deferred tax assets
Deferred tax assets have not been recognized in respect of the following items: 31 December
2010 31 December
2009 31 December
2010 31 December
2009 Mln RUR Mln RUR Mln USD* Mln USD*
Trade and other receivables 91 215 3 7 Derivative financial liability (1,083) - (36) - Tax loss carry-forwards 3,465 3,325 114 109
The deferred tax assets from the tax losses in amount of RUR 3,465 million/ USD* 114 million have not been recognized as they relate to tax losses carried forward of the entities which are expected to be disposed of in 2011. It is not probable that future taxable profit will be available against which benefit from such assets can be utilized and that the temporary difference will reverse in the foreseeable future.
A deferred tax assets for temporary difference of RUR 1,083 million / USD* 36 million relating to derivative financial liability has not been recognized due to it is not probable that derivatives would be exercised and PV of RBC shares for the year 2015 and 2018 is difficult for estimation.
2009: deferred tax asset from the tax losses in amount of RUR 3,325 million/ USD* 109 million relating to investments in subsidiaries has not been recognized as the Group is able to control the timing of reversal of the difference, and reversal is not expected in the foreseeable future.
(b) Movement in temporary differences during the year
Mln RUR 31 December
2009 Recognized in income in 2010
31 December 2010
Property, plant and equipment (9) 4 (5) Intangible assets (120) 3 (117) Investments 1 15 16 Inventory 9 13 22 Trade and other receivables 37 37 74 Prepaid expenses 3 8 11 Loans and Borrowings - (7) (7) Trade and other payables 1 (24) (23) Tax loss carry forwards 275 (58) 217
197 (9) 188

RBC Group Notes to the Consolidated Financial Statements for the year ended 31 December 2010
* The USD equivalent figures are provided for information purposes only and do not form part of the audited financial statements – refer to note 2(d).
61
Mln USD* 31 December
2009 Recognized in income in 2010
31 December 2010
Property, plant and equipment (1) 1 - Intangible assets (4) - (4) Investments - - - Inventory - 1 1 Trade and other receivables 1 2 3 Prepaid expenses - 1 1 Loans and Borrowings - - - Trade and other payables - (1) (1) Tax loss carry forwards 9 (2) 7
5 2 7
23 Inventories
31 December 2010
31 December 2009
31 December 2010
31 December 2009
Mln RUR Mln RUR Mln USD* Mln USD* Finished goods 2 5 - - Raw materials and consumables 12 17 1 1 Goods for resale 7 4 - - Work in progress 3 3 - -
24 29 1 1 Write-off of inventories during the year 74 30 2 1
24 Trade and other receivables
31 December 2010
31 December 2009
31 December 2010
31 December 2009
Mln RUR Mln RUR Mln USD* Mln USD* Trade accounts receivable 881 919 29 30 VAT receivable 50 55 2 2 Other receivables 51 114 2 4 Other prepayments 85 38 3 1 Deferred expenses 13 21 - 1
1,080 1 147 36 38 Allowance for doubtful receivables (261) (399) (9) (13) Total accounts receivable 819 748 27 25
Allowance for doubtful receivables includes RUR 231 million/USD* 8 million (2009: RUR 390 million / USD* 13 million) of allowance for doubtful trade accounts receivable.
The Group’s exposure to credit and currency risks and impairment losses related to trade and other receivables are disclosed in Note 31.

RBC Group Notes to the Consolidated Financial Statements for the year ended 31 December 2010
* The USD equivalent figures are provided for information purposes only and do not form part of the audited financial statements – refer to note 2(d).
62
25 Cash and cash equivalents
31 December 2010
31 December 2009
31 December 2010
31 December 2009
Mln RUR Mln RUR Mln USD* Mln USD* Bank balances and petty cash 306 242 10 8 Bank deposits 868 1 29 - Total cash and cash equivalents 1,174 243 39 8
As at 31 December 2010 the Group had USD-denominated term deposit in Hellenic Bank in amount of RUR 1 million / USD* 0.04 million and RUR-denominated term deposit in the bank “International finance club” in amount of RUR 865 million / USD* 28 million, which has a maturity date 20 January 2011 and consists of two parts: RUR 365 million / USD* 12 million nominal interest rate 7.25% and RUR 500 million / USD* 16 million nominal interest rate 8.25%.
The Group’s exposure to interest rate risk and a sensitivity analysis for financial assets and liabilities are disclosed in Note 31.
26 Equity
(a) Share capital and share premium
Number of shares unless otherwise stated Ordinary shares Ordinary shares 2010 2009 Authorized shares 140,000,000 140,000,000 Par value RUR 0.001 RUR 0.001 On issue at beginning of year 140,000,000 140,000,000 Issued for cash - - On issue at end of year, fully paid 140,000,000 140,000,000
The holders of ordinary shares are entitled to receive dividends as declared from time to time and are entitled to one vote per share at meetings of the Company.
(b) Treasury shares
At the reporting date the Group held 3,789,573 (2009: 3,943,435) of its own shares.
(c) Dividends
In accordance with Russian legislation the Company's distributable reserves are limited to the balance of accumulated retained earnings as recorded in the Company's statutory financial statements prepared in accordance with Russian Accounting Principles. As at 31 December 2010, the Company had cumulative retained loss and, therefore, no dividends could be distributed.

RBC Group Notes to the Consolidated Financial Statements for the year ended 31 December 2010
* The USD equivalent figures are provided for information purposes only and do not form part of the audited financial statements – refer to note 2(d).
63
(d) ADR
RBC Informational Systems established a Level-1 ADR program for its common stock on 24 March 2005 through Bank of New York. One ADR represents four ordinary shares. As of 31 December 2010 2,931.644 (2009: 2,934.776) of the shares were reserved for ADR in depositary by Bank of New York.
27 Loss per share The calculation of basic loss per share as at 31 December 2010 was based on the loss for the year and the weighted average number of ordinary shares outstanding during the year of 136,352 thousand (2009: 134,973 thousand), calculated as follows:
In thousands of shares 2010 2009 Issued shares at 1 January 140,000 140,000 Own shares held at 1 January (3,943) (4,944) Effect of shares issued in April (170) - Effect of shares issued in September (104) - Effect of shares acquired in November 569 - Effect of shares issued in December - (83) Weighted average number of shares for the period ended 31 December 136,352 134,973 In thousands of shares 2010 2009 Weighted average number of shares 136,352 134,973 Weighted average number of shares at 31 December 136,352 134,973
There were no potentially dilutive ordinary shares at 31 December 2010 and 2009.
2010 2009 Mln RUR Mln RUR
Loss for the period (1,804) (1,919) Weighted average number of shares at 31 December 136,352 134,973 Basic loss per share, RUR (13) (14) Diluted loss per share, RUR (13) (14)
2010 2009 Mln USD* Mln USD*
Loss for the period (60) (63) Weighted average number of shares at 31 December 136,352 134,973 Basic loss per share, USD - - Diluted loss per share, USD - -

RBC Group Notes to the Consolidated Financial Statements for the year ended 31 December 2010
* The USD equivalent figures are provided for information purposes only and do not form part of the audited financial statements – refer to note 2(d).
64
28 Loans and borrowings As at 31 December 2009 the Group was in default of its loans and borrowings. As at 31 December 2010 the Group’s management reached the agreements with all of the creditors and the outstanding debt was exchanged into RUR 6,337 million / USD* 208 million of the loan participation notes, RUR 191 million / USD* 6 million of the bonds and RUR 1,083 million / USD* 36 million of the derivative financial liabilities. As a result of the debt restructuring, the Group recognized a loss in the amount of RUR 659 million / USD* 22 million and fines and penalties on overdue debts in the amount of RUR 405 million / USD* 13 million (Note 14).
As at 31 December 2010 and 31 December 2009 the loans and borrowings of the Group were as follows:
31 December 2010
31 December 2009
31 December 2010
31 December 2009
Mln RUR Mln RUR Mln USD* Mln USD* Non-current liabilities Loan participation notes 6,337 - 208 - Unsecured bond issues 191 - 6 -
6,528 - 214 -
Current liabilities Unsecured bond issues 113 3,281 4 108 Credit linked notes at 9.5% - 1,470 - 48 Credit linked notes at 11.25% - 1,154 - 38 Unsecured bank loans - 156 - 5 Other loans 13 5 - -
126 6,066 4 199
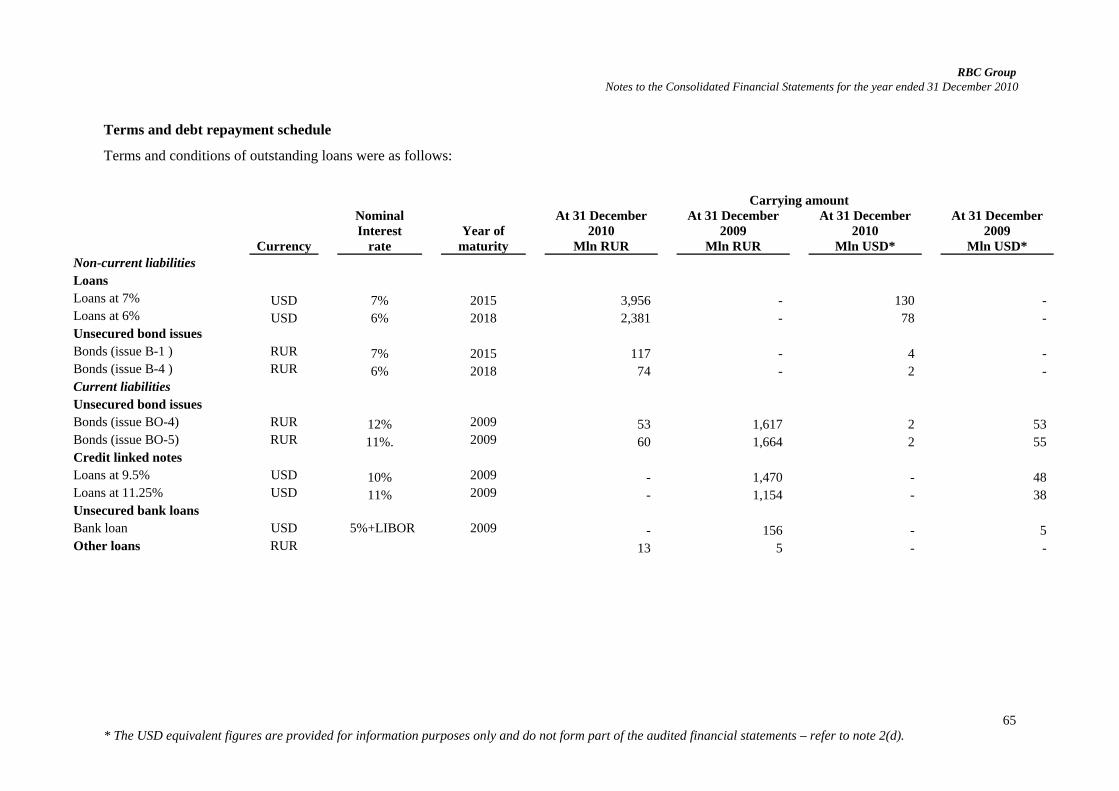
RBC Group Notes to the Consolidated Financial Statements for the year ended 31 December 2010
* The USD equivalent figures are provided for information purposes only and do not form part of the audited financial statements – refer to note 2(d).
65
Terms and debt repayment schedule
Terms and conditions of outstanding loans were as follows:
Carrying amount
Currency
Nominal Interest
rate
Year of
maturity
At 31 December 2010
At 31 December 2009
At 31 December 2010
At 31 December 2009
Mln RUR Mln RUR Mln USD* Mln USD* Non-current liabilities Loans Loans at 7% USD 7% 2015 3,956 - 130 - Loans at 6% USD 6% 2018 2,381 - 78 - Unsecured bond issues Bonds (issue B-1 ) RUR 7% 2015 117 - 4 - Bonds (issue B-4 ) RUR 6% 2018 74 - 2 - Current liabilities Unsecured bond issues Bonds (issue BO-4) RUR 12% 2009 53 1,617 2 53 Bonds (issue BO-5) RUR 11%. 2009 60 1,664 2 55 Credit linked notes Loans at 9.5% USD 10% 2009 - 1,470 - 48 Loans at 11.25% USD 11% 2009 - 1,154 - 38 Unsecured bank loans Bank loan USD 5%+LIBOR 2009 - 156 - 5 Other loans RUR 13 5 - -

RBC Group Notes to the Consolidated Financial Statements for the year ended 31 December 2010
* The USD equivalent figures are provided for information purposes only and do not form part of the audited financial statements – refer to note 2(d).
66
Derivative financial liabilities
As part of the debt restructuring process the Group agreed to grant to its creditors the options vesting in 2015 and in 2018. As at 31 December 2010 21,099,564 options vesting in 2015 and 18,464,487 options vesting in 2018 were granted to the creditors. The Group is obliged to pay to creditors the difference between average price of a share of OJSC RBC for the last 120 days preceding the execution date and the fixed price of 1.96 USD. The fair value of the options at 31 December 2010 amounted to RUR 1,083 million / USD* 36 million. The fair value of the options was determined by an independent appraiser Renaissance Capital, using the Black-Scholes valuation model.
29 Provisions As at 31 December 2010 the following provisions were made:
31 December 2010
31 December 2009
31 December 2010
31 December 2009
Mln RUR Mln RUR Mln USD* Mln USD* Income tax 41 39 1 1 Unused vacation provision 22 14 1 1 VAT 13 13 1 1 Late-payment interests and penalties related to VAT 11 10 - - Legal case provision 2 2 - -
89 78 3 3
30 Trade and other payables
31 December 2010
31 December 2009
31 December 2010
31 December 2009
Mln RUR Mln RUR Mln USD* Mln USD* Trade accounts payables 396 456 13 15 Other payables and accrued expenses
228 1,445 7 47
Advances received 335 222 11 7 Other taxes payable 148 80 5 3 Deferred income - 4 - -
1,107 2,207 36 72
As at 31 December 2009 a provision was made in the amount of RUR 1,267 million / USD*41 million for liabilities to OJSC Alfa-Bank and classified in the statement of financial position as other payables. As at 31 December 2010 the provision was settled through its exchanging for the loan participation notes and the derivative financial instruments (Note 28).
RBC Group Notes to the Consolidated Financial Statements for the year ended 31 December 2010
* The USD equivalent figures are provided for information purposes only and do not form part of the audited financial statements – refer to note 2(d).
67
The Group’s exposure to currency and liquidity risk related to trade and other payables is disclosed in Note 31.
31 Financial risk management
(a) Overview
The Group has exposure to the following risks from its use of financial instruments:
• credit risk
• liquidity risk
• market risk.
This note presents information about the Group’s exposure to each of the above risks, the Group’s objectives, policies and processes for measuring and managing risk, and the Group’s management of capital. Further quantitative disclosures are included throughout these consolidated financial statements.
The Board of Directors has overall responsibility for the establishment and oversight of the Group’s risk management framework.
The Group’s risk management policies are established to identify and analyze the risks faced by the Group, to set appropriate risk limits and controls, and to monitor risks and adherence to the limits. Risk management policies and systems are reviewed regularly to reflect changes in market conditions and the Group’s activities. The Group, through its training and management standards and procedures, aims to develop a disciplined and constructive control environment in which all employees understand their roles and obligations.
(b) Credit risk
Credit risk is the risk of financial loss to the Group if a customer or counterparty to a financial instrument fails to meet its contractual obligations, and arises principally from the Group’s receivables from customers.
(i) Trade and other receivables
The Group’s exposure to credit risk is influenced mainly by the individual characteristics of each customer. The demographics of the Group’s customer base, including the default risk of the industry and country, in which customers operate, has less of an influence on credit risk. There are no customers from which the Group derives more than 10% of its revenue.
The Group has established a credit policy under which each new customer is analyzed individually for creditworthiness before the Group’s standard payment and delivery terms and conditions are offered. The Group’s review includes a review of customers’ financial statements and background of customers’ managements. Customers that fail to meet the Group’s benchmark creditworthiness may transact with the Group only on a prepayment basis.
The Group establishes an allowance for impairment that represents its estimate of incurred losses in respect of trade and other receivables and investments. This allowance relates to individually significant exposures. Group does not have a collective loss component of impairment established for groups of similar assets in respect of losses that have been incurred but not yet identified.
The Group does not require collateral in respect of trade receivables.

RBC Group Notes to the Consolidated Financial Statements for the year ended 31 December 2010
* The USD equivalent figures are provided for information purposes only and do not form part of the audited financial statements – refer to note 2(d).
68
(ii) Investments
The Group does not actively invest in securities.
(iii) Guarantees
The Group’s policy is to provide financial guarantees only to wholly-owned subsidiaries.
Exposure to credit risk
The carrying amount of financial assets represents the maximum credit exposure. The maximum exposure to credit risk at the reporting date was:
Carrying amount Carrying amount 31 December
2010 31 December
2009 31 December
2010 31 December
2009 Mln RUR Mln RUR Mln USD* Mln USD*
Current financial assets Financial assets as fair value through profit and loss 10 10 - - Held-to-maturity investments 9 - - - Loans granted - - - - Trade receivables 650 529 21 17 Cash and cash equivalents 1,174 243 39 8
Non-current financial assets Loans granted 9 13 - 1 Total financial assets 1,852 795 60 26
The maximum exposure to credit risk for trade receivables at the reporting date by geographic region was:
Carrying amount Carrying amount 31 December
2010 31 December
2009 31 December
2010 31 December
2009 Mln RUR Mln RUR Mln USD* Mln USD*
Russia 600 452 20 15 Europe 42 66 1 2 Other 8 11 - -
650 529 21 17

RBC Group Notes to the Consolidated Financial Statements for the year ended 31 December 2010
* The USD equivalent figures are provided for information purposes only and do not form part of the audited financial statements – refer to note 2(d).
69
Impairment losses
The ageing of trade receivables at the reporting date was:
Gross Impairment Gross Impairment 31 December
2010 31 December
2010 31 December
2009 31 December
2009 Mln RUR Mln RUR Mln RUR Mln RUR
Not past due 453 (1) 347 (10) Past due 1-180 139 (17) 165 (59) Past due 181-365 71 (25) 106 (75) More than 1 year 218 (188) 301 (246)
881 (231) 919 (390)
Gross Impairment Gross Impairment 31 December
2010 31 December
2010 31 December
2009 31 December
2009 Mln USD* Mln USD* Mln USD* Mln USD*
Not past due 15 - 11 - Past due 1-180 5 (1) 5 (2) Past due 181-365 2 (1) 4 (2) More than 1 year 7 (6) 10 (9)
29 (8)
30 (13)
The movement in the allowance for impairment in respect of trade receivables during the year was as follows:
31 December 2010
31 December 2009
31 December 2010
31 December 2009
Mln RUR Mln RUR Mln USD* Mln USD* Balance at 1 January (390) (571) (13) (19) Allowance for impairment loss utilized 159 231 5 8 Impairment loss recognized - (50) - (2) Balance at 31 December (231) (390) (8) (13)
The allowance in respect of trade receivables is used to record impairment losses unless the Group is satisfied that no recovery of the amount owing is possible; at that point the amount is considered irrecoverable and is written off against the financial asset directly.
(c) Liquidity risk
Liquidity risk is the risk that the Group will not be able to meet its financial obligations as they fall due. As at 31 December 2009 the Group had substantial borrowings payable within twelve months as (Note 28); additionally, the Group was in breach of covenants or had defaulted in making loan repayments to all of its loan creditors.
For the long-term perspective the Group analyzes five-year forecasts covering financial, operating and investing activities.

RBC Group Notes to the Consolidated Financial Statements for the year ended 31 December 2010
* The USD equivalent figures are provided for information purposes only and do not form part of the audited financial statements – refer to note 2(d).
70
The following are the contractual maturities of financial liabilities, including estimated interest payments and excluding the impact of netting agreements:
2010 Average Interest rate
Mln RUR Contractual Effective 0-6
mths 6-12 mths 1-2 yrs
2-3 yrs
3-4 yrs 4-5 yrs
Over 5 yrs Total
Payables - - (772) - - - - - - (772) Loans and borrowings 9-13% 9-13% (126) - - - - (4,073) (2,455) (6,654)
Total non-derivative financial liabilities (898) - - - - (4,073) (2,455) (7,426)
2010 Average Interest rate
Mln USD* Contractual Effective 0-6
mths 6-12 mths 1-2 yrs
2-3 yrs
3-4 yrs 4-5 yrs
Over 5 yrs Total
Payables - - (25) - - - - - - (25) Loans and borrowings 9-13% 9-13% (4) - - - - (134) (80) (218)
Total non-derivative financial liabilities (29) - - - - (134) (80) (243)

RBC Group Notes to the Consolidated Financial Statements for the year ended 31 December 2010
* The USD equivalent figures are provided for information purposes only and do not form part of the audited financial statements – refer to note 2(d).
71
2009 Average Interest rate
Mln RUR Contractual Effective 0-6
mths 6-12 mths 1-2 yrs
2-3 yrs
3-4 yrs 4-5 yrs
Over 5 yrs Total
Payables - - (1,981) - - - - - - (1,981) Loans and borrowings 9-13% 9-13% (6,066) - - - - - - (6,066)
Total non-derivative financial liabilities (8,047) - - - - - - (8,047)
2009 Average Interest rate
Mln USD* Contractual Effective 0-6
mths 6-12 mths 1-2 yrs
2-3 yrs
3-4 yrs 4-5 yrs
Over 5 yrs Total
Payables - - (65) - - - - - - (65) Loans and borrowings 9-13% 9-13% (199) - - - - - - (199)
Total non-derivative financial liabilities (264) - - - - - - (264)

RBC Group Notes to the Consolidated Financial Statements for the year ended 31 December 2010
* The USD equivalent figures are provided for information purposes only and do not form part of the audited financial statements – refer to note 2(d).
72
(d) Market risk
Market risk is the risk that changes in market prices, such as foreign exchange rates, interest rates and equity prices will affect the Group’s income or the value of its holdings of financial instruments. The objective of market risk management is to manage and control market risk exposures within acceptable parameters, while optimizing the return. The Group does not buy or sell derivatives.
(i) Currency risk
The Group is exposed to currency risk on sales, purchases and borrowings that are denominated in a currency other than the respective functional currencies of Group entities, primarily the Russian Rouble (RUR).
Interest on borrowings is denominated in currencies that match the cash flows generated by the underlying operations of the Group, primarily USD and RUR. This provides an economic hedge and no derivatives are entered into.
In respect of other monetary assets and liabilities denominated in foreign currencies, the Group ensures that its net exposure is kept to an acceptable level by buying or selling foreign currencies at spot rates when necessary to address short-term imbalances.
Exposure to currency risk
The Group’s exposure to foreign currency risk was as follows based on notional amounts:
USD-denominated EUR-denominated Mln RUR 2010 2010 Financial assets Trade and other receivables 41 23 Cash and cash equivalents 17 24 Total financial assets 58 47
Financial liabilities Trade and other payables (164) (7) Loans and borrowings (6,337) - Total financial liabilities (6,501) (7)
(6,443) 40
USD-denominated EUR-denominated Mln USD* 2010 2010 Financial assets Trade and other receivables 1 1 Cash and cash equivalents 1 1 Total financial assets 2 2
Financial liabilities Trade and other payables (5) - Loans and borrowings (208) - Total financial liabilities (213) -
(211) 2

RBC Group Notes to the Consolidated Financial Statements for the year ended 31 December 2010
* The USD equivalent figures are provided for information purposes only and do not form part of the audited financial statements – refer to note 2(d).
73
USD-denominated EUR-denominated Mln RUR 2009 2009 Financial assets Trade and other receivables 97 50 Cash and cash equivalents 26 13 Total financial assets 123 63
Financial liabilities Trade and other payables (50) (8) Loans and borrowings (2,780) - Total financial liabilities (2,830) (8)
(2,707) 55
USD-denominated EUR-denominated Mln USD* 2009 2009 Financial assets Trade and other receivables 3 2 Cash and cash equivalents 1 - Total financial assets 4 2
Financial liabilities Trade and other payables (2) - Loans and borrowings (92) - Total financial liabilities (94) -
(90) 2
The following significant exchange rates applied during the year:
Mln RUR Average rate Reporting date spot rate
2010 2009 2010 2009
USD 30.3765 31.7214 30.4769 30.2442
(ii) Interest rate risk
Generally, the Group adopts a policy of fixed rates borrowings. The Group had a loan of RUR 156 million/ USD* 5 million with a floating interest rate of LIBOR+5%, which constituted 3% of the total outstanding loans and borrowings of the Group as at 31 December 2009.
Changes in interest rates impact primarily loans and borrowings by changing either their fair value (fixed rate debt) or their future cash flows (variable rate debt). Management does not have a formal policy of determining how much of the Group’s exposure should be to fixed or variable rates. However, at the time of raising new loans or borrowings management uses its judgment to decide

RBC Group Notes to the Consolidated Financial Statements for the year ended 31 December 2010
* The USD equivalent figures are provided for information purposes only and do not form part of the audited financial statements – refer to note 2(d).
74
whether it believes that a fixed or variable rate would be more favorable to the Group over the expected period until maturity.
At the reporting date the interest rate profile of the Group`s interest-bearing financial instruments was:
Carrying amount
Carrying amount
Carrying amount
Carrying amount
2010 2009 2010 2009 Mln RUR Mln RUR Mln USD* Mln USD*
Fixed rate instruments Financial liabilities (6,654) (5,910) (218) (194)
(6,654) (5,910) (218) (194)
Variable rate instruments Financial liabilities - (156) - (5)
- (156) - (5)

RBC Group Notes to the Consolidated Financial Statements for the year ended 31 December 2010
* The USD equivalent figures are provided for information purposes only and do not form part of the audited financial statements – refer to note 2(d).
75
(e) Sensitivity analysis
2010 Interest rate risk sensitivity Currency risk sensitivity Other price risk sensitivity Mln RUR + 200 - 200 +10% -10% +10% -10%
basis points basis points Carrying amount Profit/(loss) Profit/(loss) Profit/(loss) Profit/(loss) Profit/(loss) Profit/(loss)
Current financial assets Investments held for trading 10 - - - - 1 (1) Trade and other receivables 819 - - 6 (6) - - Cash and cash equivalents 1,174 - - 4 (4) - - Impact on financial assets before tax - - 10 (10) 1 (1) Income tax (20%) (2) 2 - - Impact on financial assets after tax - - 8 (8) 1 (1)
Current financial liabilities Payables 772 - - 17 (17) - - Loans and borrowings 126 3 (3) 1 (1) - - Impact on financial liabilities before tax 3 (3) 18 (18) - - Income tax (20%) (1) 1 (4) 4 - - Impact on financial liabilities after tax 2 (2) 14 (14) - - Total increase/ (decrease) 2 (2) 23 (23) 1 (1)

RBC Group Notes to the Consolidated Financial Statements for the year ended 31 December 2010
* The USD equivalent figures are provided for information purposes only and do not form part of the audited financial statements – refer to note 2(d).
76
2010 Interest rate risk sensitivity Currency risk sensitivity Other price risk sensitivity Mln USD* + 200 - 200 +10% -10% +10% -10%
basis points basis points Carrying amount Profit/(loss) Profit/(loss) Profit/(loss) Profit/(loss) Profit/(loss) Profit/(loss)
Current financial assets Investments held for trading - - - - - - - Trade and other receivables 27 - - - - - - Cash and cash equivalents 39 - - - - - - Impact on financial assets before tax - - - - - - Income tax (20%) - - - - - - Impact on financial assets after tax - - - - - -
Current financial liabilities Payables 25 - - 1 (1) - - Loans and borrowings 4 - - - - - - Impact on financial liabilities before tax - - 1 (1) - - Income tax (20%) - - - - - - Impact on financial liabilities after tax - - - - - - Total increase/ (decrease) - - 1 (1) - -

RBC Group Notes to the Consolidated Financial Statements for the year ended 31 December 2010
* The USD equivalent figures are provided for information purposes only and do not form part of the audited financial statements – refer to note 2(d).
77
(f) Fair values
Management believes that the fair value of the Group’s financial assets and liabilities as at 31 December 2010 and 31 December 2009 approximated their carrying amounts. The methods used to determine fair values are disclosed in Note 4.
(g) Capital management
The Board of Directors monitors the return on equity, which the Group defines as profit after tax divided by shareholders equity.
2010 2009 2010 2009 Mln RUR Mln RUR Mln USD* Mln USD*
Loss after tax (1,804) (1,919) (60) (63)
Ordinary shareholders funds (5,062) (5,462) (166) (179) Share capital - - - - Share premium 8,995 6,644 295 218 Treasury shares (631) (774) (21) (25) Foreign currency translation reserves (9) (1) - - Available-for-sale investments revaluation reserve
- - - -
Accumulated losses (13,417) (11,331) (440) (372)
ROE N/A N/A N/A N/A
The financial crisis of 2008 had significant impact on the 2010 and 2009 results. ROE calculation is not applicable due to negative amounts in numerator and denominator.

RBC Group Notes to the Consolidated Financial Statements for the year ended 31 December 2010
* The USD equivalent figures are provided for information purposes only and do not form part of the audited financial statements – refer to note 2(d).
78
32 Commitments
(a) Capital commitments In July 2009 the Group committed to acquire the remaining 26% non-controlling interest in LLC “RBC Money” for RUR 15 million/ USD* 0.5 million, subject to the condition of finalization of restructuring process. At the date of approval of these consolidated financial statements, the Group is in process of acquiring the 26% interest. Management expects to complete the acquisition at the second half of 2011.
(b) Operating leases
The Group leases a number of offices and facilities under operating leases. Non-cancellable operating lease rentals are due as follows:
2010 2009 2010 2009 Mln RUR Mln RUR Mln USD* Mln USD*
Less than one year 99 80 3 3 Between one and five years 189 120 6 4 More than five years 348 364 11 12
636 564 20 19
During the current year RUR 266 million / USD* 9 million (2009: RUR 241 million / USD* 8 million) were recognized in profit or loss in respect of operating leases.
33 Contingencies
(a) Insurance
The insurance industry in the Russian Federation is in a developing state and many forms of insurance protection common in other parts of the world are not yet generally available. The Group does not have full coverage for its facilities, business interruption, or third party liability in respect of property or environmental damage arising from accidents on Group property or relating to Group operations. Until the Group obtains adequate insurance coverage, there is a risk that the loss or destruction of certain assets could have a material adverse effect on the Group’s operations and financial position.
(b) Litigation
The Group is involved in various claims and legal proceedings arising in the normal course of business. Management does not believe that the ultimate resolution of such matters will give a material adverse impact on the Group’s operating results or financial position.

RBC Group Notes to the Consolidated Financial Statements for the year ended 31 December 2010
* The USD equivalent figures are provided for information purposes only and do not form part of the audited financial statements – refer to note 2(d).
79
(c) Taxation contingencies
The taxation system in the Russian Federation is relatively new and is characterized by frequent changes in legislation, official pronouncements and court decisions, which are often unclear, contradictory and subject to varying interpretation by different tax authorities. Taxes are subject to review and investigation by a number of authorities, which have the authority to impose severe fines, penalties and interest charges. A tax year remains open for review by the tax authorities during the three subsequent calendar years; however, under certain circumstances a tax year may remain open longer. Recent events within the Russian Federation suggest that the tax authorities are taking a more assertive position in their interpretation and enforcement of tax legislation.
These circumstances may create tax risks in the Russian Federation that are substantially more significant than in other countries. Management believes that it has provided adequately for tax liabilities based on its interpretations of applicable Russian tax legislation, official pronouncements and court decisions. However, the interpretations of the relevant authorities could differ and the effect on these consolidated financial statements, if the authorities were successful in enforcing their interpretations, could be significant.
Management has not provided any amounts in these consolidated financial statements, except for the provisions in Note 29.
34 Related party disclosures For the purposes of these consolidated financial statements, parties are considered to be related if one party has the ability to control the other party, is under common control or can exercise significant influence over the other party in making financial or operational decisions. In considering each possible related party relationship, attention is directed to the substance of the relationship, not merely the legal form. Key management personnel and close family members are also related parties.
(a) Control relationships
The Group has a controlling relationship with all its subsidiaries.The list of the significant subsidiaries is presented in Note 35.
(b) Transactions with key management personnel and close family members
Compensation to key management personnel
Compensation of key management personnel consists of remuneration paid to directors, general directors and executive directors for the services in full- or part-time positions. Compensation is made up of annual remuneration and a performance bonus depending on operating results.
Total key management compensation represented by short-term employee benefits and included in administrative expenses in the consolidated statement of comprehensive income was RUR 97 million/ USD* 3 million) and RUR 129 million/ USD* 4 million the years ended 31 December 2010 and 2009, respectively.

RBC Group Notes to the Consolidated Financial Statements for the year ended 31 December 2010
* The USD equivalent figures are provided for information purposes only and do not form part of the audited financial statements – refer to note 2(d).
80
(c) Transactions with the associates and joint ventures
The Group’s transactions with the associates and joint ventures are disclosed below.
Mln RUR Outstanding balance
Transaction value
Outstanding balance
Transaction value
31 December
2010 2010 31 December
2009 2009 Loans received - - - (2) Other services received - - (34) Advertising services provided - 5 (3) 59 Other services provided (1) 23 - 1 Share of profit of associates and joint ventures (net of income tax) - - - (691)
Mln USD* Outstanding balance
Transaction value
Outstanding balance
Transaction value
31 December
2010 2010 31 December
2009 2009 Loans received - - - - Other services received - - - (1) Advertising services provided - - - 2 Other services provided - 1 - - Share of profit of associates and joint ventures (net of income tax) - - - (25)
(d) Transactions with other related parties
The Group’s transactions with other related parties are disclosed below.
Mln RUR Outstanding balance
Transaction value
Outstanding balance
Transaction value
31 December 2010 2010
31 December 2009 2009
Other services received - (86) (1) (27) Loans received (2) - - Advertising services provided - 136 1 115 Cash in bank and on-hand - 102 - Loans issued 4 - 2 5 Other expenses - - - Other services provided - 1 3 14 Bank deposits 865 102 - Other expenses - - (1) (10)
Mln USD* Outstanding balance
Transaction value
Outstanding balance
Transaction value

RBC Group Notes to the Consolidated Financial Statements for the year ended 31 December 2010
* The USD equivalent figures are provided for information purposes only and do not form part of the audited financial statements – refer to note 2(d).
81
31 December 2010 2010
31 December 2009 2009
Other services received - (3) - (1) Loans received - - - Advertising services provided - 4 - 4 Cash in bank and on-hand - 3 - - Loans issued - - - - Other expenses - - - - Other services provided - - - Bank deposits 28 3 - - Other expenses - - - -
35 Significant subsidiaries
Ownership/voting
Country of incorporation 31 December
2010 31 December
2009 RBC Media, LLC Russia 100% 100% RBC Money, LLC Russia 74% 74% RBC TV, CJSC Russia 100% 100% RBC Reklama, LLC Russia 100% 100% RBC Holding, CJSC Amida, CJSC
Russia Russia
100% 100%
100% 100%
RosBusinessConsulting, CJSC Russia 100% 100% RBC Investments Cyprus Ltd. Cyprus 100% 100% Mohiville Corporation Netherland Antilles 100% 100% AD Net Ltd. Cyprus 100% 100% Ad Line, LLC Russia 100% 100% Loveplanet, LLC Russia 75% 75% EDI S Press Holding Ltd. Cyprus 80% 80% MassMediaGroup Ltd. Ukraine 100% 100% Global Media Solutions Russia 100% 100% RBC-TV Novosibirsk, CJSC Russia 100% 100% IPK Media Production, LLC Russia 100% 100% SMTP Press, LLC Russia 100% 100% BusinessPress, LLC Russia 100% 100% Eidos Marketing British Virgin Islands 80% 80% ID Salon Press, CJSC Russia 80% 80% Konkord, LLC Russia 100% 100% CentroHost, CJSC Russia 100% 100% Garant-Park-Telecom, LLC Russia 86% 86% Hosting-Centr, LLC Russia 100% 100% MediaMir, LLC Russia 100% 100% Valento Commerce British Virgin Islands 100% 100%

RBC Group Notes to the Consolidated Financial Statements for the year ended 31 December 2010
* The USD equivalent figures are provided for information purposes only and do not form part of the audited financial statements – refer to note 2(d).
82
36 EBITDA The Board of Directors monitors the performance of the Group by EBITDA, which is determined as result from operating activities adjusted to exclude depreciation and amortization expenses and impairment losses. For 2009, results from operating activities of the Group for the purposes of EBITDA calculation exclude the results of operating activities of discontinued operations in the amount of RUR 17 million / USD* 0.6 million and the loss on disposal of discontinued operations in the amount RUR 17 million / USD* 0.6 million.
2010 2009 2010 2009 Mln RUR Mln RUR Mln USD* Mln USD*
Results from operating activities (205) (969) (7) (32) Adjustments for: Amortization 180 173 6 6 Depreciation 110 110 4 4 Impairment of intangible and other assets - 516 - 17 EBITDA 85 (170) 3 (5)
37 Events subsequent to the reporting date
(a) Renaming of the Company, exchange of shares, delisting
In February 2011 the Company was renamed from OJSC “RBC-TV Moscow” to OJSC “RBC”. In January 2011 exchange of shares of the OJSC RBC Information Systems to the shares of the Company has started. At the date of approval of these consolidated financial statements, 90% of the shares of the OJSC RBC Information Systems were exchanged. In June 2011 the OJSC RBC Informational Systems shares were delisted from Moscow Stock Exchange but the exchange of remaining part will continue in the second half of 2011.
(b) Acquisition of RU-CENTER
In March 2011 the Group announced a plan on acquisition of JSC “RSIC” (RU-CENTER), the domain name registrar and hosting provider. RU-CENTER will become part of consumer internet segment. Acquisition of RU-CENTER is expected to take place in the second half of 2011. Structure of the deal has not been finalized yet.
(c) Option program for management
In April 2011 the Group approved a share option program for the selected key management personnel of the Group. The terms of the program have not yet been sufficiently defined. The process is expected to be finalized in the second half 2011.