raymond james 35th annual institutional investors conference
TRANSCRIPT

WCI Communities Raymond James 35th Annual Institutional Investors Conference
March 4, 2014

1
Disclosure Statement
This presentation contains forward-looking statements. All statements that are not statements of historical fact, including
statements about the Company’s beliefs and expectations, are forward-looking statements within the meaning of the federal
securities laws, and should be evaluated as such. Forward-looking statements include information concerning the Company’s
future goals, expected growth, market conditions and outlook, expected liquidity and possible or assumed future results of
operations, including descriptions of its business plan and strategies. These forward-looking statements may be identified by
the use of such forward-looking terminology, including the terms “believe,” “estimate,” “project,” “anticipate,” “expect,” “seek,”
“predict,” “contemplate,” “continue,” “possible,” “intend,” “may,” “might,” “will,” “could,” “would,” “should,” “forecast,” or “assume”
or, in each case, their negative, or other variations or comparable terminology.
For more information concerning factors that could cause actual results to differ materially from those contained in the forward-
looking statements please refer to the “Risk Factors” section in our most recent report on Form 10-K filed with the Securities
and Exchange Commission on February 27, 2014 and subsequent filings by the Company. The Company bases these
forward-looking statements or projections on its current expectations, plans and assumptions that it has made in light of its
experience in the industry, as well as its perceptions of historical trends, current conditions, expected future developments and
other factors it believes are appropriate under the circumstances and at such time. As you read and consider this presentation,
you should understand that these statements are not guarantees of performance or results. The forward-looking statements
and projections are subject to and involve risks, uncertainties and assumptions and you should not place undue reliance on
these forward-looking statements or projections. Although the Company believes that these forward-looking statements and
projections are based on reasonable assumptions at the time they are made, you should be aware that many factors could
affect the Company’s actual financial results or results of operations and could cause actual results to differ materially from
those expressed in the forward-looking statements and projections. The Company undertakes no obligation to update or revise
any forward-looking statements, whether as a result of new information, future events or otherwise. If the Company does
update one or more forward-looking statements, there should be no inference that it will make additional updates with respect
to those or other forward-looking statements.
In addition to the financial measures prepared in accordance with U.S. generally accepted accounting principles (“GAAP”), this
presentation contains the non-GAAP financial measures Adjusted EBITDA and Adjusted gross margin from homes
delivered. The reasons for the use of these measures, a reconciliation of these measures to the most directly comparable
GAAP measures and other information relating to these measures are included below in the appendix to this presentation.

2
Company Presenters
Keith E. Bass President, Chief Executive Officer and Director
Over 25 years of real estate and homebuilding experience
Former President of Pinnacle Land Advisers, Senior Vice President at The Ryland Group and its President of the South Region and Florida President at Taylor Woodrow
Bachelor’s Degree in Business Administration from North Carolina Wesleyan College
Licensed general contractor and real estate broker in Florida
Russell Devendorf Senior Vice President and Chief Financial Officer
CFO since 2008
Former Vice President – Finance at Meritage Homes Corporation and Vice President, Treasurer and Secretary at TOUSA, Inc.
B.S. and Master of Accounting with tax concentration from Florida State University
Certified Public Accountant and Certified Treasury Professional

3
WCI Communities at a Glance
Lifestyle community developer and
luxury homebuilder throughout Florida
Expertise and reputation for developing
amenity rich master-planned
communities
– Creates value by enhancing the
lifestyle component of our communities
– Increases marketability, sales volume
and value of homes delivered
Legacy that spans more than 60 years
Approximately 8,500 home sites owned
or controlled as of December 31, 2013
– Majority located within mature, well-
amenitized communities
Target move-up, second home and
active adult customers
Strategic realty business
Geographic Footprint
Total Home Sites Owned & Controlled as of 12/31/2013
Home Sites Inventory
Central FL29.3%
Southwest FL46.6%
Southeast FL8.7%
Northeast FL0.7%
Northwest FL14.7%

4
Key Differentiators
Pure play opportunity to capitalize on the
Florida housing market
Luxury coastal homebuilder with sizeable
and attractive land positions
Attractive land cost basis due in large
part to fresh start accounting in 2009
High proportion of cash buyers
– 48% of 4Q13 deliveries / 44% in 2013
High ASP relative to peers
– $433k full year 2013 deliveries
– Diverse buyer mix and pricing range
Low cancellation rate – 4.7% in 2013
Strong balance sheet - $213 million cash
Real Estate Services & Amenities
businesses are value add
Home Deliveries by Price Range
Buyer Profile with Low Reliance on Financing
Loan to Value Percentage – 4Q13 Deliveries
31
.5%
27
.6%
24
.5%
26
.3%
44
.0%
37
.3%
38
.4%
25
.6%
24
.5%
35
.1%
37
.1%
48
.1%
0%
10%
20%
30%
40%
50%
60%
2012 Deliveries 2013 Deliveries 4Q13 Deliveries 12/31/13 Backlog
$150k - $300k $301-$450k $451k+
Cash47.7%
LTV 1% - 64%15.2%
LTV 65% - 80%31.8%
LTV >81%5.3%

5
Expertise in Lifestyle Creation
Fort Myers, FL
Total Planned Homes: 2,400
Remaining Home Sites: 1,146
Price Range: $160K – $480K
Size Range: 1,200 – 2,700 sq. ft.
Amenities: Plaza del Sol Town Center, a 40,000 sq.
ft. town center, outdoor and indoor pools, restaurant,
fitness center, 99 seat movie theater, spa facilities,
fishing pier and pickleball courts
Bonita Springs, FL
Total Planned Homes: 1,400
Remaining Home Sites: 518
Price Range: $435K – $810K
Size Range: 2,100 – 2,961 sq. ft.
Amenities: Award-winning clubs, panoramic views of
Gulf of Mexico, 34-acre island beach club, 18-hole
championship golf course, 28,000 sq. ft. clubhouse,
tennis, spa & fitness facilities
Note: Price range represents minimum base price to maximum home price including lot premiums and upgrades on units in backlog as of 12/31/13
Remaining home sites are approximate based on current community plan and amenities listed may or may not be owned and/or operated by WCI.
Parkland, FL (Ft. Lauderdale)
Total Planned Homes: 3,000
Remaining Home Sites: 226
Price Range: $490K – $875K
Size Range: 2,677 – 4,250 sq. ft.
Amenities: 18-hole championship golf course,
approximately 32,000 sq. ft. clubhouse, fitness, resort
style pools and spa, clay tennis and basketball courts,
indoor racquetball and meeting facilities
2nd Home Active Adult Primary

6
Land Portfolio Positioned for Growth
Existing home site supply
supports near and medium-term
operations and allows us to focus
on longer-term acquisition,
entitlement and development
projects
Majority located within mature,
well-amenitized, developed
communities with established
demand for homes
Book value of majority of home
sites reset to then-current fair
market value in 2009, at or near
the U.S. housing market cyclical
low
Home Site Position by Region (as of 12/31/13)
Inventory by Development Status
Raw 27.4%
Partially Developed
38.9%
Finished 15.6%
High Rise 18.2%
2,327
3,307
1,324
1,549
Total homes sites owned or controlled as of 12/31/13
Owned Controlled High Rise Total
Southwest 2,694 676 591 3,961
Central 2,336 - 160 2,496
Northwest 456 - 798 1,254
Southeast 740 - - 740
Northeast 56 - - 56
Total 6,282 676 1,549 8,507

7
Complimentary Amenities & Real Estate Services Businesses
Create value by enhancing the lifestyle component
of our communities
Increases marketability, sales volume and value of
homes delivered
Our expertise in developing and operating various
amenities provides a distinct land acquisition
advantage
Strong barrier to entry because of significant
upfront capital investment
2013 Amenities revenue of $23.2 million; a 10.5%
increase over 2012
We design our amenities with a clear exit strategy
– During 2012, we sold two amenity facilities for a
total of $11.4 million and resulting in a profit of
$2.6 million
3rd largest brokerage in Florida
42 offices and ~1,500 licensed independent real
estate agents as of 12/31/13
Source of real time market information for
Homebuilding operations
2013 Brokerage ASP increased 8.9% over 2012
Title services business facilitates with the closing of
real estate
76% title capture rate of WCI new homebuyers for
2013 deliveries
Amenities Real Estate Services
$-
$50
$100
$150
$200
$250
$300
$350
$400
$450
$500
-
2,000
4,000
6,000
8,000
10,000
12,000
2001
2002
2003
2004
2005
2006
2007
2008
2009
2010
2011
2012
2013
Closed Transactions ASP ($K)
8
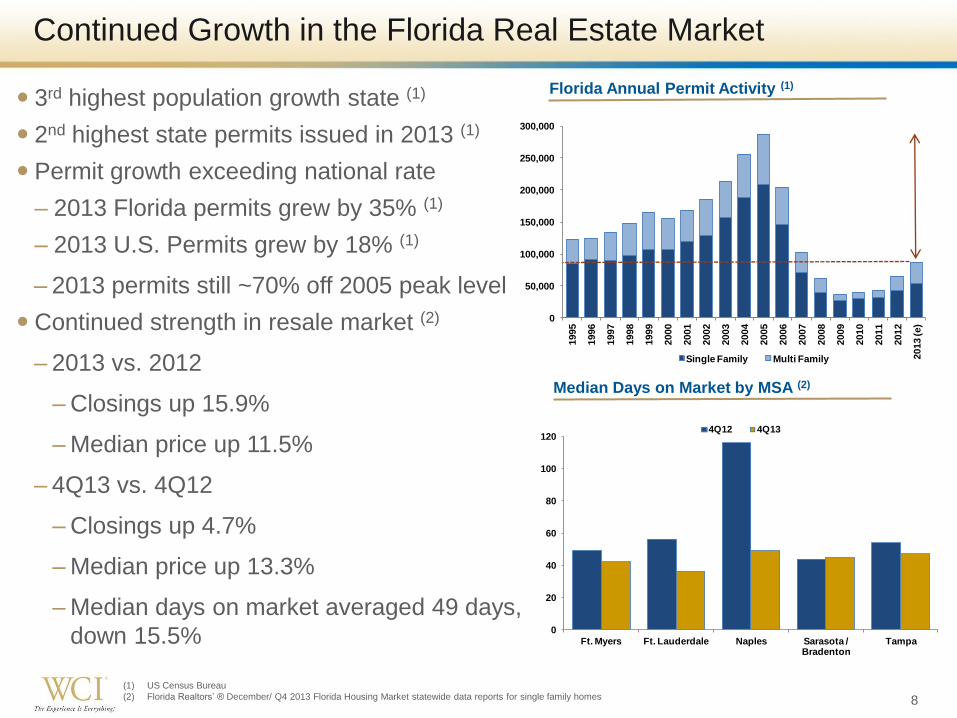
(1) US Census Bureau
(2) Florida Realtors’ ® December/ Q4 2013 Florida Housing Market statewide data reports for single family homes
Continued Growth in the Florida Real Estate Market
3rd highest population growth state (1)
2nd highest state permits issued in 2013 (1)
Permit growth exceeding national rate
– 2013 Florida permits grew by 35% (1)
– 2013 U.S. Permits grew by 18% (1)
– 2013 permits still ~70% off 2005 peak level
Continued strength in resale market (2)
– 2013 vs. 2012
– Closings up 15.9%
– Median price up 11.5%
– 4Q13 vs. 4Q12
– Closings up 4.7%
– Median price up 13.3%
– Median days on market averaged 49 days,
down 15.5%
Florida Annual Permit Activity (1)
Median Days on Market by MSA (2)
0
50,000
100,000
150,000
200,000
250,000
300,000
1995
1996
1997
1998
1999
2000
2001
2002
2003
2004
2005
2006
2007
2008
2009
2010
2011
2012
2013 (e)
Single Family Multi Family
0
20
40
60
80
100
120
Ft. Myers Ft. Lauderdale Naples Sarasota / Bradenton
Tampa
4Q12 4Q13

9
2013 Highlights
Revenues from homes delivered up 53.0% to $213.5 million
– Deliveries up 40.1% to 493 homes
– Adjusted gross margin from homes delivered of 32.0%
New orders up 17.2% to 531 homes
– Contract value of new orders up 31.9% to $243.2 million
– Average selling price per new order up 12.5% to $458,000
Real Estate Services gross margin up 123.9% to $3.1 million
Net income of $127.0 million
– $125.6 million income tax benefit related to the reversal of deferred tax
asset valuation allowances
Adjusted EBITDA up 116.0% to $37.5 million
Closed on 1,900 future home sites across 10 neighborhoods
Increased ending active selling neighborhood count by 25%
Ending cash balance of $213.4 million, up 163.1%
Successfully accessed debt and equity capital markets

10
Annual Trending ($ in thousands)
$300
$325
$350
$375
$400
$425
$450
$475
$500
-
100
200
300
400
500
600
2011 2012 2013
New Orders
New Orders New Order ASP
$300
$325
$350
$375
$400
$425
$450
$475
$500
-
100
200
300
400
500
600
2011 2012 2013
Deliveries
Deliveries Deliveries ASP
$300
$325
$350
$375
$400
$425
$450
$475
$500
-
50
100
150
200
250
300
350
2011 2012 2013
Backlog
Backlog Backlog ASP
0.0%
10.0%
20.0%
30.0%
40.0%
50.0%
60.0%
$-
$10,000
$20,000
$30,000
$40,000
$50,000
2011 2012 2013
Selling, General & Adminstrative
SGA SGA %
Note: SG&A % measured as a percentage of Homebuilding revenues

11
Quarterly Trending ($ in thousands)
New Orders
Continued quarter over quarter
increases
Same Store Traffic
– Active Adult up 39% from 4Q12
– Second Home up 82% from 4Q12
Same Store Orders
– Active Adult up 52% from 4Q12
– Second Home up 140% from 4Q12
Deliveries
57% of 2012 deliveries were stacked in
Q4
Strategically implemented evenflow
production scheduling to reduce
concentration of deliveries
– 31% of 2013 deliveries occurred in Q4
19
50
81
202
79
122
141151
Q1 Q2 Q3 Q4
Deliveries 2012 2013
114
128
105 106
140147
128
116
Q1 Q2 Q3 Q4
New Orders 2012 2013

12
5.1%
3.1%
4Q12 4Q13
Incentives % of Base Price
$423
$516
4Q12 4Q13
New Orders ASP
$44,869
$59,849
4Q12 4Q13
Contract Value of New Orders
Fourth Quarter 2013 Summary($ in thousands)
255
293
4Q12 4Q13
Backlog Units
6,862
8,507
4Q12 4Q13
Owned & Controlled Homesites
$447
$491
4Q12 4Q13
Backlog ASP
+33% +22%
+15%
+10% +24% - 200 bps

13
33.2%32.0%
2012 2013
Adjusted GM % (1)
HB $146.9
HB $214.0
RES$73.1
RES$80.1 AM
$21.0
AM $23.2
$241.0
$317.3
2012 2013
Revenues ($ in millions)
21.4%
16.0%
0.5%
2.4%
21.9%
18.5%
2012 2013
SG&A % (2)
Stock Based Comp
Improving SG&A Leverage Driving Adjusted EBITDA Expansion
Total Revenues 31.7% higher than
2012
– Homebuilding revenue up 45.7%
Continued gross margin strength
– Product delivery mix is a key
factor
– Broader range of neighborhoods
delivering homes
Rapidly improving SG&A leverage
– 2013 SG&A includes $4.5M of
additional non-cash stock based
compensation than 2012
– Improved by 540 basis points from
2012 excluding non-cash stock
based compensation
(1) Represents Adjusted gross margin from homes delivered
(2) Measured as a percentage of homebuilding; 2013 does not foot due to rounding
(3) Measured as a percentage of total revenues
7.2%
11.8%
2012 2013
Adjusted EBITDA % (3)

14
Selected Full Year Operating Results
$ in thousands, except per share amounts 2013 2012 Variance %
Homebuilding revenues $214,016 $146,926 45.7%
Real estate services revenues 80,096 73,070 9.6%
Amenities revenues 23,237 21,012 10.6%
Total revenues $317,349 $241,008 31.7%
Total gross margin $65,324 $44,293 47.5%
Adjusted gross margin % from homes delivered 32.0% 33.2% -120 bps
Adjusted EBITDA $37,494 $17,362 116.0%
Adjusted EBITDA margin 11.8% 7.2% +460 bps
Net income (loss) attributable to common shareholders $126,968 $50,823 149.8%
Earnings per share - diluted $5.86 $3.50 67.4%
Preferred stock dividends (19,680) - -
Preferred stock dividends per diluted share ($0.91) - -
Expenses related to early repayment of debt (5,105) (16,984) 69.9%
Expenses related to early repayment of debt per diluted share ($0.24) ($1.17) 79.5%
Income tax benefit 125,709 52,233 140.7%
Income tax benefit per diluted share $5.80 $3.60 61.1%
Weighted average shares outstanding - diluted 21,680 14,515 49.4%
SG&A % of homebuilding revenues 18.5% 21.9% -340 bps
Non-cash stock-based compensation included in SG&A 2.4% 0.5% +190 bps
Homes delivered 493 352 40.1%
Average selling price per home delivered $433 $396 9.3%

15
$ in thousands, except per share amounts
Three Months Ended
December 31,
2013 2012
Variance
%
Homebuilding revenues $68,962 $81,946 -15.8%
Real estate services revenues 19,181 17,533 9.4%
Amenities revenues 6,617 5,771 14.7%
Total revenues $94,760 $105,250 -10.0%
Total gross margin $19,461 $24,406 -20.3%
Net income (loss) attributable to common shareholders $135,198 $17,918 654.5%
Earnings per share - diluted $5.16 $0.99 421.2%
Weighted average shares outstanding - diluted 26,206 18,040 45.3%
Adjusted EBITDA $11,770 $15,349 -23.3%
Adjusted EBITDA margin 12.4% 14.6% -220 bps
SG&A % of homebuilding revenues 15.3% 13.5% +180 bps
Non-cash stock-based compensation included in SG&A 1.3% 0.2% +110 bps
Homes delivered 151 202 -25.2%
Average selling price per home delivered $457 $400 14.1%
New orders 116 106 9.4%
Average selling price per new order $516 $423 22.0%
Backlog units 293 255 14.9%
Average selling price per backlog unit $491 $447 9.8%
Selected Fourth Quarter Operating Results

16
Strong Balance Sheet with Ample Liquidity
July 2013 – Raised $90.3 million in net
proceeds from initial public offering
August 2013 – Raised $195.5 million in net
proceeds from issuance of Senior Notes due
2021
– Paid off existing $125.0 million senior
secured term notes
– Early repayment of debt charges of
approximately $5.1 million
August 2013 - Entered into a $75.0 million, four
year senior unsecured revolving credit facility
December 2013 – Reversed $125.6 million of
deferred tax asset valuation allowance
(1) Available liquidity includes the $75 million of borrowing capacity under the revolving credit
facility and $8 million of borrowing capacity available under the revolving credit facility with
Stonegate Bank
(2) Net Debt represents total debt less cash & cash equivalents
$ in thousands
December 31,
2013
December 31,
2012
Cash & Equivalents $213,352 $81,094
Real Estate Inventory 280,293 183,168
Sr. Secured Term Notes Due 2017 - 125,000
Sr. Notes Due 2021 200,000 -
Total Equity 409,864 168,605
Total Capitalization 609,864 293,605
Available Liquidity (1) 296,352 81,094
Debt to Capitalization 32.8% 42.6%
Net Debt to Capital (2) NM 20.7%
(Cash + Inventory) / Debt 2.47 2.11

17
Key Takeaways
Florida real estate market remains strong
Continued growth
– Neighborhood counts
– Orders & deliveries
– Revenues & Adjusted EBITDA
Leverage the scalable operating platform
Actively pursuing land acquisition opportunities
Conservative balance sheet provides ample liquidity
and flexibility for future growth
Executing the strategy
– Focus on move-up, second home and active adult
buyers
– Maintain production disciplines
– Differentiate via extensive amenity offerings

Appendix

19
Reconciliation of Non-GAAP Financial Measures Adjusted Gross Margin from Homes Delivered
Reconciliation of Non-GAAP Financial Measures
In addition to the results reported in accordance with U.S. generally accepted accounting principles (“GAAP”), we have provided information in this presentation
relating to Adjusted gross margin from homes delivered, EBITDA, and Adjusted EBITDA (as defined below).
Adjusted Gross Margin from Homes Delivered
We calculate adjusted gross margin from homes delivered by subtracting the gross margin from land and home sites from Homebuilding gross margin to arrive
at gross margin from homes delivered. Adjusted gross margin from homes delivered is calculated by adding asset impairments, if any, and capitalized interest
in cost of sales to gross margin from homes delivered. Management uses adjusted gross margin from homes delivered to evaluate operating performance in
our Homebuilding segment and in making strategic decisions regarding sales price, construction and development pace, product mix and other operating
decisions. We believe adjusted gross margin from homes delivered is relevant and useful to investors and other interested parties for evaluating our
comparative operating performance from period to period and among companies within the homebuilding industry as it is reflective of overall profitability during
any given reporting period. This measure is considered a non-GAAP financial measure and should be considered in addition to, rather than as a substitute for,
the comparable GAAP financial measures when evaluating our operating performance. Although other companies in the homebuilding industry report similar
information, the methods used by such companies may differ from our methodology and, therefore, may not be comparable. We urge investors and other
interested parties to understand the methods used by other companies in the homebuilding industry to calculate gross margins and any adjustments to such
amounts before comparing our measures to those of such other companies.
The table below reconciles adjusted gross margin from homes delivered to the most directly comparable GAAP financial measure, Homebuilding gross margin,
for the years presented herein.

20
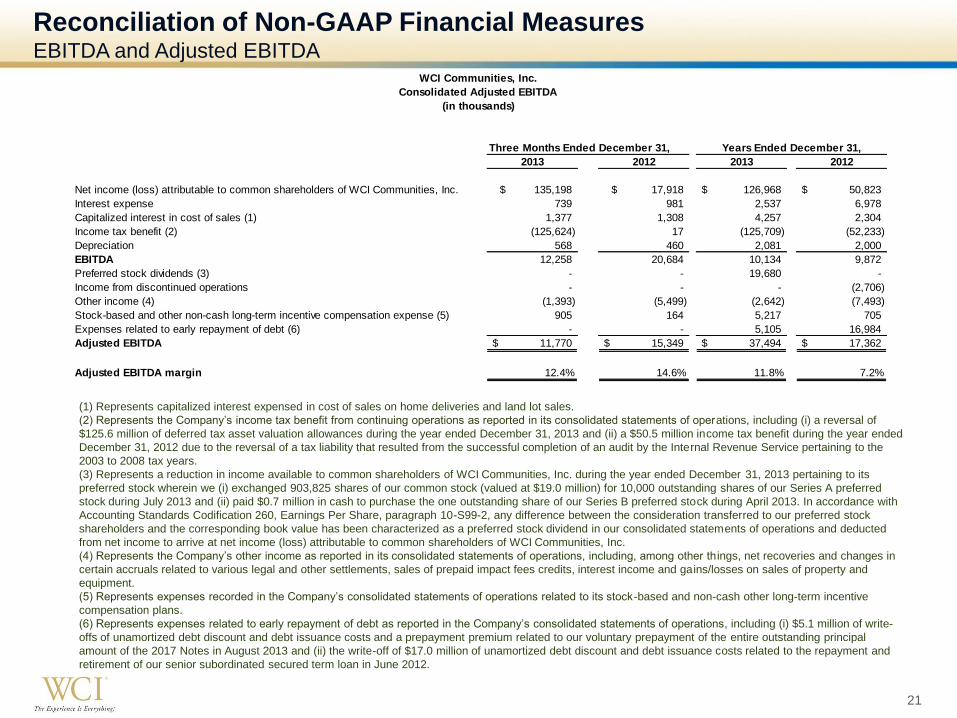
Reconciliation of Non-GAAP Financial Measures EBITDA and Adjusted EBITDA
Adjusted EBITDA measures performance by adjusting net income (loss) attributable to common shareholders of WCI Communities, Inc. to exclude
interest expense, capitalized interest in cost of sales, income taxes, depreciation (‘‘EBITDA’’), preferred stock dividends, income from discontinued
operations, other income, stock-based and other non-cash long-term incentive compensation expense, and expenses related to early repayment of
debt. We believe that the presentation of Adjusted EBITDA provides useful information to investors and other interested parties regarding our results
of operations because it assists those parties and us when analyzing and benchmarking the performance and value of our business. We also believe
that Adjusted EBITDA is useful as a measure of comparative operating performance from period to period and among companies in the homebuilding
industry as it is reflective of changes in pricing decisions, cost controls and other factors that affect operating performance, and it removes the effect
of our capital structure (such as preferred stock dividends and interest expense), asset base (primarily depreciation), items outside of our control
(primarily income taxes) and the volatility related to the timing and extent of non-operating activities (such as discontinued operations and asset
impairments). Accordingly, we believe that this measure is useful for comparing general operating performance from period to period. Other
companies may define Adjusted EBITDA differently and, as a result, our measure of Adjusted EBITDA may not be directly comparable to Adjusted
EBITDA of other companies. Although we use Adjusted EBITDA as a financial measure to assess the performance of our business, the use of
Adjusted EBITDA is limited because it does not include certain material costs, such as interest and income taxes, necessary to operate our business.
Adjusted EBITDA and EBITDA should be considered in addition to, and not as substitutes for, net income (loss) attributable to common shareholders
of WCI Communities, Inc. in accordance with GAAP as a measure of performance. Our presentation of EBITDA and Adjusted EBITDA should not be
construed as an indication that our future results will be unaffected by unusual or nonrecurring items. Our EBITDA-based measures have limitations
as analytical tools and you should not consider them in isolation or as substitutes for analyses of our results as reported under GAAP. Some such
limitations are:
they do not reflect the impact of earnings or charges resulting from matters that we consider not to be indicative of our ongoing operations;
they are not adjusted for all non-cash income or expense items that are reflected in our consolidated statements of cash flows;
they do not reflect the interest expense necessary to service our debt; and
other companies in our industry may calculate these measures differently than we do, thereby limiting their usefulness as comparative measures.
Because of these limitations, our EBITDA-based measures are not intended to be alternatives to net income (loss), indicators of our operating
performance, alternatives to any other measure of performance in conformity with GAAP or alternatives to cash flow provided by operating activities
as measures of liquidity. You should therefore not place undue reliance on our EBITDA-based measures or ratios calculated using those measures.
Our GAAP-based measures can be found in our audited consolidated financial statements in Item 8 of Part II of this Annual Report on Form 10-K.
The table below reconciles EBITDA and Adjusted EBITDA to the most directly comparable GAAP financial measure, net income (loss) attributable to
common shareholders of WCI Communities, Inc., for the years presented herein.
21
Reconciliation of Non-GAAP Financial Measures EBITDA and Adjusted EBITDA
(1) Represents capitalized interest expensed in cost of sales on home deliveries and land lot sales.
(2) Represents the Company’s income tax benefit from continuing operations as reported in its consolidated statements of operations, including (i) a reversal of
$125.6 million of deferred tax asset valuation allowances during the year ended December 31, 2013 and (ii) a $50.5 million income tax benefit during the year ended
December 31, 2012 due to the reversal of a tax liability that resulted from the successful completion of an audit by the Internal Revenue Service pertaining to the
2003 to 2008 tax years.
(3) Represents a reduction in income available to common shareholders of WCI Communities, Inc. during the year ended December 31, 2013 pertaining to its
preferred stock wherein we (i) exchanged 903,825 shares of our common stock (valued at $19.0 million) for 10,000 outstanding shares of our Series A preferred
stock during July 2013 and (ii) paid $0.7 million in cash to purchase the one outstanding share of our Series B preferred stock during April 2013. In accordance with
Accounting Standards Codification 260, Earnings Per Share, paragraph 10-S99-2, any difference between the consideration transferred to our preferred stock
shareholders and the corresponding book value has been characterized as a preferred stock dividend in our consolidated statements of operations and deducted
from net income to arrive at net income (loss) attributable to common shareholders of WCI Communities, Inc.
(4) Represents the Company’s other income as reported in its consolidated statements of operations, including, among other th ings, net recoveries and changes in
certain accruals related to various legal and other settlements, sales of prepaid impact fees credits, interest income and gains/losses on sales of property and
equipment.
(5) Represents expenses recorded in the Company’s consolidated statements of operations related to its stock-based and non-cash other long-term incentive
compensation plans.
(6) Represents expenses related to early repayment of debt as reported in the Company’s consolidated statements of operations, including (i) $5.1 million of write-
offs of unamortized debt discount and debt issuance costs and a prepayment premium related to our voluntary prepayment of the entire outstanding principal
amount of the 2017 Notes in August 2013 and (ii) the write-off of $17.0 million of unamortized debt discount and debt issuance costs related to the repayment and
retirement of our senior subordinated secured term loan in June 2012.
2013 2012 2013
Net income (loss) attributable to common shareholders of WCI Communities, Inc. 135,198$ 17,918$ 126,968$ 50,823$
Interest expense 739 981 2,537 6,978
Capitalized interest in cost of sales (1) 1,377 1,308 4,257 2,304
Income tax benefit (2) (125,624) 17 (125,709) (52,233)
Depreciation 568 460 2,081 2,000
EBITDA 12,258 20,684 10,134 9,872
Preferred stock dividends (3) - - 19,680 -
Income from discontinued operations - - - (2,706)
Other income (4) (1,393) (5,499) (2,642) (7,493)
Stock-based and other non-cash long-term incentive compensation expense (5) 905 164 5,217 705
Expenses related to early repayment of debt (6) - - 5,105 16,984
Adjusted EBITDA 11,770$ 15,349$ 37,494$ 17,362$
Adjusted EBITDA margin 12.4% 14.6% 11.8% 7.2%
WCI Communities, Inc.
Consolidated Adjusted EBITDA
(in thousands)
Three Months Ended December 31,
2012
Years Ended December 31,

WCI Communities Contacts
Russ Devendorf, Senior Vice President & CFO
(239) 498-8220, [email protected]
Scott Bowles, Vice President - Finance
(239) 390-3727, [email protected]