hyatt hotels corporation raymond james 34 annual...
TRANSCRIPT
Hyatt hotels corporation
Raymond James 34th annual
institutional investors conference
March 2013

Forward looking statements
Forward-Looking Statements in this presentation, which are not historical facts, are forward-looking statements within the meaning of the Private Securities
Litigation Reform Act of 1995. These statements include statements about our plans, strategies, occupancy and ADR trends, market share, the number of
properties we expect to open in the future, our expected adjusted SG&A expense, maintenance and enhancement to existing properties capital expenditures,
investments in new properties capital expenditures, depreciation and amortization expense and interest expense estimates, financial performance, prospects or
future events and involve known and unknown risks that are difficult to predict. As a result, our actual results, performance or achievements may differ
materially from those expressed or implied by these forward-looking statements. In some cases, you can identify forward-looking statements by the use of words
such as “may,” “could,” “expect,” “intend,” “plan,” “seek,” “anticipate,” “believe,” “estimate,” “predict,” “potential,” “continue,” “likely,” “will,” “would”
and variations of these terms and similar expressions, or the negative of these terms or similar expressions. Such forward-looking statements are necessarily
based upon estimates and assumptions that, while considered reasonable by us and our management, are inherently uncertain. Factors that may cause actual
results to differ materially from current expectations include, among others, general economic uncertainty in key global markets; the rate and pace of economic
recovery following economic downturns; levels of spending in business and leisure segments as well as consumer confidence; declines in occupancy and average
daily rate; limited visibility with respect to short and medium-term group bookings; the impact of hotel renovations; our ability to successfully execute and
implement our organizational realignment and the costs associated with such organizational realignment; our ability to successfully execute and implement our
common stock repurchase program; loss of key personnel, including as a result of our organizational realignment; hostilities, including future terrorist attacks, or
fear of hostilities that affect travel; travel-related accidents; changes in the tastes and preferences of our customers; relationships with associates and labor unions
and changes in labor law; the financial condition of, and our relationships with, third-party property owners, franchisees and hospitality venture partners; if our
third-party owners, franchisees or development partners are unable to access the capital necessary to fund current operations or implement our plans for growth;
risk associated with potential acquisitions and dispositions and the introduction of new brand concepts; changes in the competitive environment in our industry
and the markets where we operate; outcomes of legal proceedings; changes in federal, state, local or foreign tax law; foreign exchange rate fluctuations or
currency restructurings; general volatility of the capital markets; our ability to access the capital markets; and other risks discussed in the Company's filings with
the U.S. Securities and Exchange Commission, including our Annual Report on Form 10-K, which filings are available from the SEC. We caution you not to
place undue reliance on any forward-looking statements, which are made as of the date of this presentation. We undertake no obligation to update publicly any
of these forward-looking statements to reflect actual results, new information or future events, changes in assumptions or changes in other factors affecting
forward-looking statements, except to the extent required by applicable laws. If we update one or more forward-looking statements, no inference should be drawn
that we will make additional updates with respect to those or other forward-looking statements
2

MISSION
To provide authentic hospitality by making a difference
in the lives of the people we touch every day, including our associates, guests and owners
GOAL
To become the most preferred brand in each customer segment that
we serve for our associates, guests and owners
VALUES
We aim to foster a common purpose and culture
within the Hyatt family through shared core values of mutual respect, intellectual
honesty and integrity, humility, fun, creativity and innovation
MISSION / GOAL / VALUES
3

HYATT AT A GLANCE
Global hospitality company with 50+ year history and a long-term strategic focus
500 properties across 7 premier lodging brands and one residential brand
46 countries with presence in many key gateway cities
Owner, manager, franchisor
Diverse earnings streams with strong balance sheet and liquidity position
95,000+ associates and experienced management team
4
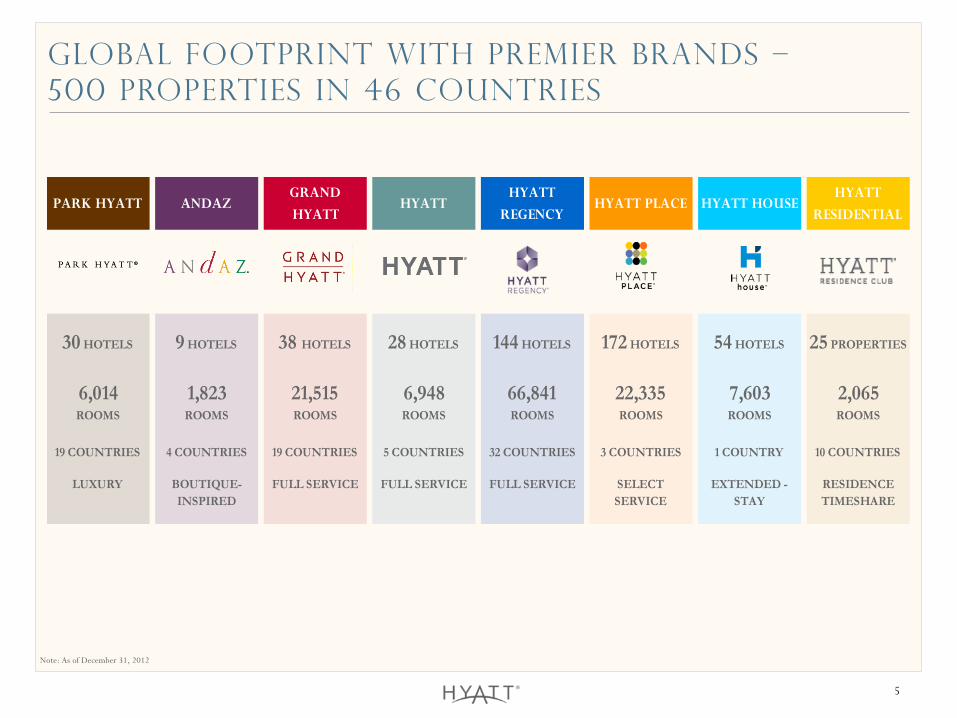
GLOBAL FOOTPRINT WITH PREMIER BRANDS –
500 PROPERTIES IN 46 COUNTRIES
Note: As of December 31, 2012
5
PARK HYATT ANDAZGRAND
HYATTHYATT
HYATT
REGENCYHYATT PLACE HYATT HOUSE
HYATT
RESIDENTIAL
30 HOTELS 9 HOTELS 38 HOTELS 28 HOTELS 144 HOTELS 172 HOTELS 54 HOTELS 25 PROPERTIES
6,014 ROOMS
1,823 ROOMS
21,515 ROOMS
6,948 ROOMS
66,841 ROOMS
22,335 ROOMS
7,603 ROOMS
2,065 ROOMS
19 COUNTRIES 4 COUNTRIES 19 COUNTRIES 5 COUNTRIES 32 COUNTRIES 3 COUNTRIES 1 COUNTRY 10 COUNTRIES
LUXURY BOUTIQUE-
INSPIRED
FULL SERVICE FULL SERVICE FULL SERVICE SELECT
SERVICE
EXTENDED -
STAY
RESIDENCE
TIMESHARE

STRATEGY DRIVES BRAND PREFERENCE AND SHAREHOLDER VALUE
Delivering on the above is designed to create shareholder value
and brand preference over the long-term
• Increase share of hotel stays
• Enhance operational efficiency
• Enhance customer satisfaction
• Renovate / re-invest in owned hotels
• Emphasize associate engagement
Focus on Improvement in the
Performance of Existing Hotels
• Increase presence
− existing markets
− emerging market expansion
• Increase focus on franchising, primarily in the
United States
• Utilize our capital and asset base for targeted
growth
• Pursue strategic acquisitions and alliances
Expanding Our Presence
in Attractive Markets
6
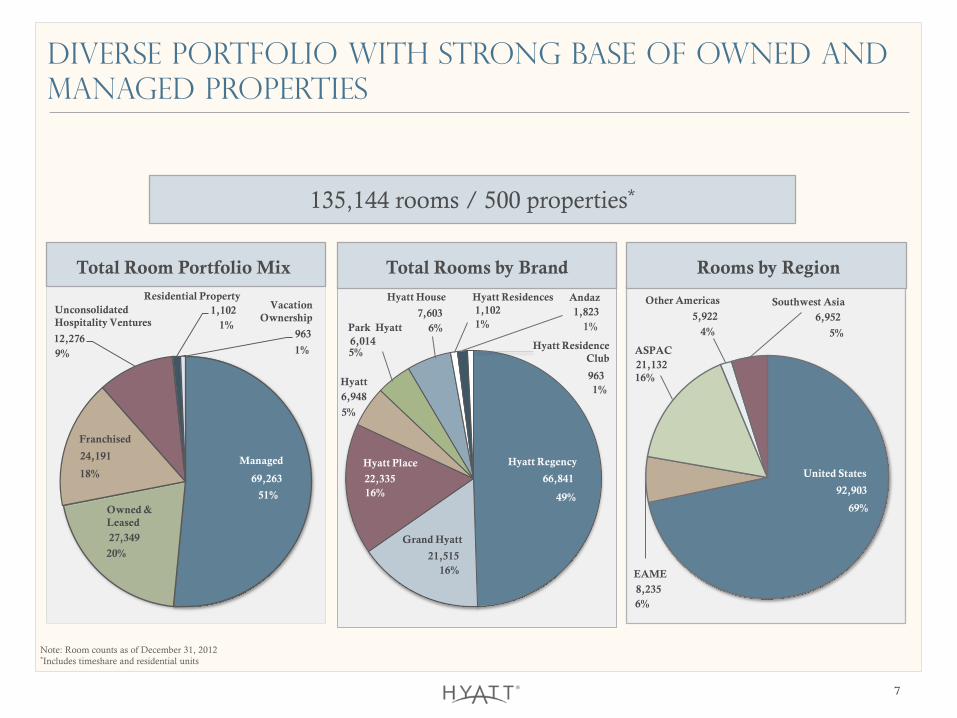
66,841
21,515
22,335
6,948
6,014
7,603 1,102 1,823
963
Hyatt Residence
Club
Diverse portfolio with strong base of owned and
managed properties
Hyatt Regency
Grand Hyatt
Park Hyatt
Hyatt Residences Andaz Hyatt House
Hyatt Place
Total Rooms by Brand
Note: Room counts as of December 31, 2012 *Includes timeshare and residential units
Other Americas
69,263
27,349
24,191
12,276
1,102
963
Total Room Portfolio Mix
Owned &
Leased
Managed
Franchised
Unconsolidated
Hospitality Ventures
Residential Property Vacation
Ownership
9%
1%
1%
18%
20%
51% 49%
16%
6%
16%
1%
5%
5%
Hyatt
1%
92,903
8,235
21,132
5,922 6,952
Rooms by Region
United States
ASPAC
EAME
Southwest Asia
69%
16%
6%
4% 5% 1%
135,144 rooms / 500 properties*
7
Other Americas

Americas
Subtotal: 368
Other Americas
Subtotal: 8 EAME/SW Asia Subtotal: 54
Asia Pacific
Subtotal: 53
Offices Managed and Franchised Global Headquarters Owned, Leased and Unconsolidated Hospitality Ventures
Presence in key global markets
8
Note: As of December 31, 2012
Note: Excludes residence and timeshare

operating leverage from Significant owned and
managed portfolio
1 Represents approximate segment mix based on 2012 YE Adjusted EBITDA as of December 31, 2012. Corporate and other EBITDA of ($107) million not included in percent breakdown. 2 For our definition of Adjusted EBITDA and a reconciliation of consolidated Adjusted EBITDA to EBITDA and a reconciliation of EBITDA to its most directly comparable GAAP measure, net income (loss) attributable
to Hyatt Hotels Corporation, see Part II, Item 7 “Management’s Discussion and Analysis of Financial Condition and Results of Operations – Results of Operations” of our Annual Report on Form 10-K for the period
ended December 31, 2012 or the information posted on the Investor Relations website, which can be accessed at http://www.hyatt.com, then by selecting the Investor Relations link located at the bottom of the page,
then selecting the Financial Information link.
Adjusted EBITDA 1,2
9
~50%
~30%
~5%
~5% ~10%
Owned & Leased
Americas Management & Franchising
ASPAC Management & Franchising
EAME / SW Asia Management
Unconsolidated Hospitality Ventures

~40%
~40%
~20%
Park Hyatt, Andaz,Grand Hyatt
Hyatt Regency, Hyatt
Hyatt Place, HyattHouse
owned and leased market and Brand mix
1 Represents 2012 owned and leased Adjusted EBITDA of $369 million.
Note: U.S. markets defined by Smith Travel Research.
Top owned and leased markets by
Adjusted EBITDA 1
Owned and Leased Adjusted
EBITDA Brand Mix 1
11%
5% 5% 5% 5% 4% 4% 4%
0%
4%
8%
12%
10

Owned and leased Margin continues to improve
1 Owned and leased operating margin is defined as the margin on owned and leased hotel results calculated as the difference between owned and leased hotels revenue and owned and leased hotels expense as reflected on
our consolidated statements of income (loss) divided by owned and leased hotel revenue. 2 For our definition of Adjusted EBITDA and a reconciliation of consolidated Adjusted EBITDA to EBITDA and a reconciliation of EBITDA to its most directly comparable GAAP measure, net income (loss) attributable
to Hyatt Hotels Corporation, see Part II, Item 7 “Management’s Discussion and Analysis of Financial Condition and Results of Operations – Results of Operations” of our Annual Report on Form 10-K for the period
ended December 31, 2012 or the information posted on the Investor Relations website, which can be accessed at http://www.hyatt.com, then by selecting the Investor Relations link located at the bottom of the page,
then selecting the Financial Information link.
Adjusted EBITDA 2
Owned and Leased Operating Margin 1
11
23%
25% 26%
18%
20%
22% 23%
2006 2007 2008 2009 2010 2011 2012
628 708 687
406 476
538 606
2006 2007 2008 2009 2010 2011 2012

Grand Hyatt San Francisco
660 Rooms
San Francisco, CA
Owned / Venture Hotels in Key Gateway Cities
allow hyatt to benefit from global travel trends
Park Hyatt Chicago
198 Rooms
Chicago, IL
Grand Hyatt São Paulo
466 Rooms
São Paulo, Brazil
Grand Hyatt New York
1,301 Rooms
New York, NY
Hyatt Regency Mexico City
756 Rooms
Mexico City, Mexico
Park Hyatt Washington
216 Rooms
Washington, D.C.
Grand Hyatt Mumbai
547 Rooms
Mumbai, India
Grand Hyatt Seoul
601 Rooms
Seoul, Korea
Park Hyatt Paris – Vendôme
158 Rooms
Paris, France
Park Hyatt Zurich
142 Rooms
Zurich, Switzerland
12

Recent innovative transactions – maintaining
and Expanding presence
• Hyatt Regency Birmingham
• Acquired for ~$43M with plans to invest ~$10M in renovations
• Expect >$5M of Adj. EBITDA in 2013
• Hotel has operated as a Hyatt-branded hotel since opening in 1990
• Long-term management agreements for four hotels in
France
• Conversion of four existing full service hotels in Paris, Nice and
Cannes in Q2 2013
• Expect to earn ~€10-€15M in total management fees over the first
twelve months of management
• Performance guarantee for first seven years of management
agreements
13
• Hyatt Residence Club, Maui, Hawaii • Develop and operate a 131-unit Hyatt Residence Club in Maui, Hawaii on Ka’anapali Beach
• Hyatt to invest ~$40M in joint venture with Host Hotels and Resorts
Hyatt Regency
Birmingham

Additional progress on Recycling capital
• Innovative transactions with Summit Hotel Properties
– Sale of 11 select service hotels (1,469 rooms)
• Aggregate sales price of ~$123M
• ~11.5x trailing 12-month EBITDA multiple; ~7.3% trailing 12-month cap rate
• Continue to manage under long-term agreements
– Acquisition of select service hotel in Minneapolis
• Renovate and re-brand to Hyatt Place Minneapolis Downtown following ~$20M renovation
• Expect to sell to Summit in summer 2013 and manage under long-term agreement
• Potential sale of six owned full service U.S. hotels
• Approximately $25M of Adj. EBITDA in 2012
• Expect to maintain long-term agreements if sold
14

Recent and Near-Term Hotel Openings
Provide Entry Into New Markets
Hyatt Regency Chongqing
321 Rooms
Opened 3Q 2012
Chongqing, China Kuala Lumpur, Malaysia
Grand Hyatt Kuala Lumpur
412 Rooms
Opened 3Q 2012
Andaz Maui at Wailea
297 Rooms
Expected Opening 2013
Maui, USA
New York, USA
Hyatt Union Square
186 Rooms
Expected Opening 2013
Hyatt Place Vitacura
160 Rooms
Expected Opening 2013
Vitacura, Chile
Andaz Amsterdam
122 Rooms
Opened 4Q 2012
Amsterdam, Netherlands
Busan, South Korea
Park Hyatt Busan
269 Rooms
Opened 1Q 2013
15
Hyatt Regency Gurgaon
451 Rooms
Expected Opening 2013
Gurgaon, India

16
Executed contract base of approximately 200 hotels and 45,000 rooms 1
• Almost half are international full service hotels
• Grown executed contract base ~67% from 120 hotels (27,000 rooms) to 200 hotels (45,000
rooms)
• Executed contract base represents ~35% of existing rooms
• Expect to open over 30 hotels total in 2013
High-value Executed contract Base
1As of December 31, 2012
27,000
45,000
-
10,000
20,000
30,000
40,000
50,000
Q4 2009 Q4 2012
Executed Contract Base (Rooms)

Note: Approximate mix as of December 31, 2012
17
Executed contract base mix
31%
33%
36%
Rooms by Region
Americas
ASPAC
EAME / SW Asia
25%
42%
33%
Rooms by Brand
Park Hyatt, Andaz,Grand Hyatt
Hyatt Regency, Hyatt
Hyatt Place, HyattHouse
7%
75%
18%
Rooms by Ownership / Contract Type
Owned, Leased and UnconsolidatedHospitality Ventures
Managed
Franchised
Corporate finance highlights
• One of the highest credit ratings among lodging peers
• Approximately $1B of cash, equivalents and short-term investments
• Undrawn borrowing capacity of $1.4B under revolving credit facility
• Approximately $63M remaining under the Company’s $200M share repurchase
authorization 1
Note: Balance sheet information as of December 31, 2012
18
1 As of February 8, 2013

Investment Highlights
Diverse earnings streams and growth opportunities
World class brands and long-term strategic focus on brand preference
Global hospitality platform with high quality hotels located in desirable markets
Disciplined financial approach with strong balance sheet and significant liquidity
position
Operating leverage is significant
Deep culture and experienced management team
19
