rates of return on investments in common stocks author(s): l
TRANSCRIPT

Rates of Return on Investments in Common StocksAuthor(s): L. Fisher and J. H. LorieSource: The Journal of Business, Vol. 37, No. 1 (Jan., 1964), pp. 1-21Published by: The University of Chicago PressStable URL: http://www.jstor.org/stable/2351197Accessed: 16/12/2009 18:15
Your use of the JSTOR archive indicates your acceptance of JSTOR's Terms and Conditions of Use, available athttp://www.jstor.org/page/info/about/policies/terms.jsp. JSTOR's Terms and Conditions of Use provides, in part, that unlessyou have obtained prior permission, you may not download an entire issue of a journal or multiple copies of articles, and youmay use content in the JSTOR archive only for your personal, non-commercial use.
Please contact the publisher regarding any further use of this work. Publisher contact information may be obtained athttp://www.jstor.org/action/showPublisher?publisherCode=ucpress.
Each copy of any part of a JSTOR transmission must contain the same copyright notice that appears on the screen or printedpage of such transmission.
JSTOR is a not-for-profit service that helps scholars, researchers, and students discover, use, and build upon a wide range ofcontent in a trusted digital archive. We use information technology and tools to increase productivity and facilitate new formsof scholarship. For more information about JSTOR, please contact [email protected].
The University of Chicago Press is collaborating with JSTOR to digitize, preserve and extend access to TheJournal of Business.
http://www.jstor.org
THE JOURNAL OF BUSINESS
The Graduate School of Business of the University of Chicago
.- - 11m-1
VOL. XXXVII JANUARY 1964 No. 1
RATES OF RETURN ON INVESTMENTS IN COMMON STOCKS*
L. FISHERt AND J. H. LORIE4
THIS article presents data on rates of return on investments in common stocks. It answers the question of
how much gain or loss an individual in- vestor might have realized if he had bought all New York Stock Exchange common stocks-at five different dates and held them for varying lengths of time during the thirty-five years from 1926 through 1960, a total of twenty-two time periods. This work is the first to emerge from the Center for Research in Securi- ty Prices (sponsored by Merrill Lynch, Pierce, Fenner & Smith Inc.). For that reason we shall describe the facilities and plans of the Center before presenting the results and methods of its first research.
THE CENTER FOR RESEARCH
IN SECURITY PRICES
PURPOSE
The sole purpose of the Center for Re- search in Security Prices is to conduct research and to disseminate the results throughout the academic and financial communities. This is what Merrill Lynch, Pierce, Fenner & Smith Inc. had in mind when they provided the funds to estab- lish the Center, and this is what the Graduate School of Business had in mind when it sought support.
Despite the enormous quantities of available data on security prices and re- lated things, the amount of scientific re- search based on these data is inadequate for many purposes. As a result, a number of controversies and unresolved issues about security prices have continued. For example, there is controversy about whether successive changes in the prices of common stocks are statistically inde- pendent or are serially correlated. If the former is true, technical analysis such as that based on the Dow Theory is not likely to be helpful; if the latter is true, regularities in the patterns of change can be detected by appropriate analysis.
Another controversy revolves about the question of what effect, if any, divi- dends exert on stock prices. Some feel
* Funds to support the work reported in this article came primarily from Merrill Lynch, Pierce, Fenner & Smith Inc. Support also came from the Graduate School of Business through funds granted by the Ford Foundation. In addition, the work was supported by the National Science Foundation through their grant to the Computation Center of the University of Chicago. We also would like to acknowledge the invaluable help of Frederic J. Meier and Milton Davis in the collection of data and the direct assistance of at least nineteen computer pro- grammers, most notably that of Sergius Kunitzky, Ann Walinski Loidl, Daniel I. Rosenfels, Lee H. Hook, and Haym L. Rabinovitz.
t Associate professor of finance and associate di- rector of the Center for Research in Security Prices, Graduate School of Business, University of Chicago.
t Professor of business administration and direc- tor of the Center for Research in Security Prices, Graduate School of Business, University of Chicago.
1
2 TTH TOURNAL OF BUSINESS
that only earnings matter and that pay- out ratios are therefore of no conse- quence. Others feel that the declaration of a dollar dividend affects the price of a stock differently from a dollar of earn- ings retained. This matter is of great con- sequence to American corporations, but the issue remains unresolved.
Another difficult problem is the sub- ject of stock-market averages. Averages are a lot like the weather in that every- one talks about them-usually with dis- satisfaction-but no one does anything. It is time that a serious effort be made to devise averages which do more than report descriptively the movement of some stock prices.
Many people would like to have more detailed and refined information regard- ing the relationship of movements in stock prices to changes of other sorts in the economy. More work needs to be done on the relationships between earn- ings and prices and on the relevance of balance-sheet data in understanding and predicting the financial fate of corpora- tions.
The Center for Research in Security Prices will work on all of the problems mentioned above and many others. It is intended to be a permanent institution which will work as rapidly as financial resources and the imagination and abili- ties of research workers will permit. The facilities of the Center will be available not only to the faculty and graduate students of the University of Chicago but also to persons at other educational insti- tutions and in the financial community who have serious problems for which the Center's facilities can be helpful. The Center's facilities will be described below.
FACILITIES
In March, 1960, Merrill Lynch, Pierce, Fenner & Smith Inc., made an initial grant of $50,000 to the University of
Chicago to establish the Center for Re- search in Security Prices. The initial funds and additional resources equiva- lent to more than $150,000 have been used to establish a "laboratory" consist- ing of a very large volume of data on security prices and related things appro- priately arranged and stored on com- puter tape. These data together with ap- propriate computer programs, make pos- sible a large variety and number of anal- yses of security prices, of their determi- nants, and of their relationships to other things in the economy.
Security prices.-Monthly closing prices of all common stocks on the New York Stock Exchange from January, 1926, through December, 1960, have been placed on tape. Their accuracy has been appraised in several ways, and, after three years of checking and rechecking, it is estimated that the incidence of error is extremely low and that remaining er- rors do not bias the results.
Further, there are on tape-though at present in less useful form-daily high, low, and closing prices of all common stocks on the New York Stock Exchange from July 1, 1960, to the present. This information is being kept up to date, but has not yet been integrated with the file on monthly prices; and its accuracy has not been tested adequately.
Capital changes.-In order for the in- formation on security prices to be useful for refined analyses, it is essential that information be recorded on all types of capital changes. This has been done. Such changes include, for example, cash dividends, stock dividends, stock splits, rights, e)xchanges of shares, etc. One way to summarize the data that have been placed on tape is to say that almost all pertinent information in the Commerce Clearing House series, Capital Changes Reporter, has been coded, checked for possible error, and placed on tape. The

RATES OF RETURN ON COMMON STOCKS 3
accuracy of these data has been exhaus- tively checked.
An additional comment is warranted on the treatment of cash dividends. Where available, four dates are recorded for each dividend: (1) the date of declara- tion, (2) the ex-dividend date, (3) the date of record, and (4) the date of pay- ment. Further, the tax status for each dividend is recorded; there are seven dif- ferent tax categories (see Appendix A, p. 10).
Other data.-A wide variety of national economic statistics has been coded and is ready to go on tape. These data cover such things as commodity prices, interest rates, industrial production, and national income.
For each period for which there is a security price, data on trading volume have also been recorded.
Data on earnings have been placed on IBM cards and ultimately will be trans- ferred to tape. This information is in the form reported by the company and re- quires extensive adjustment before its use for refined analysis will be worth- while.
PLANS FOR THE FtTTtRE
It is planned to keep the basic file of information up to date and to include new data of various kinds, depending on the projects that the Center undertakes. Undoubtedly there will be experimenta- tion with balance-sheet data, and cer- tainly an effort will be made to include data on securities other than common stocks listed on the New York Stock Ex- change. Priority will be given to research of general interest, but other projects will also be undertaken.
RATES OF RETURN ON INVESTMENTS
IN COMMON STOCKS
It is surprising to realize that there have been no measurements of the rates
of return on investments in common stocks that could be considered accurate and definitive. There have been many efforts, but each has been deficient in at least one crucial respect. Some have lacked comprehensiveness, having dealt only with a selection of individual securi- ties such as those in one of the popular stock market averages. This study em- braces all common stock listed on the New York Stock Exchange during the time periods covered-some seventeen hundred of them. Again, earlier studies have dealt only with one or two brief time periods in contrast to the twenty- two time periods within a thirty-five-year span covered here. Finally, all other stud- ies have been deficient because they have ignored taxes and transaction costs. In this study actual New York Stock Ex- change round-lot commission rates, as they existed on all purchase, sales and re-investment dates, have been included in the calculations; and all federal taxes, as they applied to income from dividends or capital gains at specific times in se- lected tax brackets, have been taken into consideration. As can be seen from Ta- bles 1 and 2, taxes and commissions can have large effects on rates of return. This study has shortcomings, but we believe that they are less pronounced than those of previous work.
RATES OF RETUTRN WITH REINVESTMENT OF DIVIDENDS
Table 1 shows the results of investing an equal sum of money in each company having one or more issues of common stock listed on the New York Stock Ex- change at the beginning of each period and of reinvesting dividends as received throughout the periods in the stock of the company making the payment. The results referred to thus include dividends and capital appreciation. Stocks listed at the beginning of any time period receive

4 THE JOURNAL OF BUSINESS
equal weight. A stock listed after the beginning and before the end of a par- ticular time period is included whenever holders of other stocks receive its shares and also to whatever extent funds for reinvestment become available through the delisting of stocks that still possess value. To be more specific, when a stock is delisted, it is sold over the counter and the proceeds are spread evenly over all stocks listed on that date.
It should be emphasized that Table 1 represents the rates of return-or rates of capital appreciation-that result from the adoption of only one of a large num-
ber of possible investment policies. An illustrative alternative would be the allo- cation of investment funds in proportion to the value of shares outstanding.
Except for the large amount of double- counting involved, this latter policy, in contrast to the one underlying Tables 1 and 2, would indicate the rates of return available to all the investors considered together.' That is, new investors as a
1 By "double counting" we mean the ownership by one company of stock in another listed company. For example, Du Pont owns large amounts of stock in General Motors. Allocation of investment funds in proportion to the value of Du Pont and General Motors stock outstanding involves counting some of the General Motors shares twice.
TABLE 1-RATES OF RETURN ON INVESTMENT IN COMMON STOCKS LISTED ON THE NEW YORK STOCK EXCHANGE WITH REINVESTMENT OF DIVIDENDS*
(Per Cent per Annum Compounded Annually)
INCOME CLASS
PERIOD Tax Exempt $10,000 in 1960 $50,000 in 1960
Cash-to- Cash-to- Cash-to- Cash-to- Cash-to- Cash-to- Portfolio t Cash t Portfolio Cash Portfolio Cash
1/26-12/60 ....... 9.0 9.0 8.4 8.2 7.4 6.8 1/26- 9/29 ....... 20.4 20.3 20.4 20.3 20.3 19.4 1/26- 6/32 ....... -16.5 -16.8 -16.5 -16.8 -16.5 -13.4 1/26-12/40 ....... 2.4 2.3 2.4 2.4 2.2 2.4 1/26-12/50 ....... 6.8 6.8 6.3 6.1 5.5 5.1
9/29- 6/32 ....... -48.4 -48.8 -48.4 -48.8 -48.2 -40.6 9/29-12/40 ....... - 3.0 -3.1 -3.0 -2.9 - 3.0 - 2.3 9/29-12/50 ....... 4.9 4.8 4.3 4.1 3.5 3.2 9/29-12/60 ....... 7.7 7.7 7.0 6.8 5.9 5.4
6/32-12/40 ....... 21.3 21.1 21.2 20.8 20.8 19.5 6/32-12/50 ....... 18.6 18.6 17.8 17.5 16.5 15.5 6/32-12/60 ....... 17.4 17.3 16.5 16.2 15.0 14.1
12/50-12/52 ....... 12.5 12.0 11.1 10.0 9.0 7.t 12/50-12/54 ....... 17.9 17.6 16.6 15.3 14.4 11.6 12/50-12/56 ....... 17.0 16.8 15.8 14.8 13.7 t1.4 12/50-12/58 ....... 16.5 16.4 15.4 14.6 13.4 11.4 12/50-12/60 ....... 14.8 14.7 13.8 13.1 12.0 10.3
12/55-12/56 ....... 6.4 5.4 5.7 4.6 4.0 2.8 12/55-12/57 ....... - 3.7 - 4.2 - 4.4 - 4.0 -6.0 - 4.2 12/55-12/58 ....... 13.0 12.6 12.2 11.1 10.5 8.2 12/55-12/59 ....... 14.0 13.7 13.3 12.2 11.6 9.2 12/55-12/60 ....... 11.2 10.9 10.5 9.6 8.9 7.2
* The data underlying this table have been exhaustively checked. We are confident that any subsecluent refinement or adjust- ment will do no more than change an occasional figure after the decimal point.
t "Cash-to-Portfolio" means the net rate of return which would have been realized after paying commissions and taxes (if any) on each transaction but continuing to hold the portfolio at the end of each period.
+ "Cash-to-Cash" means the net return which would have been realized after paying commissions and taxes (if any) on eacb transaction including the sale of the portfolio at the end of each period.
RATES OF RETURN ON COMMON STOCKS 5
group might be able to allocate funds among securities in proportion to the value of shares outstanding but could not invest equal amounts in each security without changing many prices by a sub- stantial amount.
The decision to invest equal amounts in each company with common stock listed on the Exchange was based on the desire to calculate rates of return that would on the average be available to the individual investor who selected stocks at random with equal probabilities of selection-that is, exercised no judgment. A policy of allocating funds in proportion
to shares outstanding or according to any other criterion implies less neutrality of judgment in making investments.2
Since dividends constitute income, the results of reinvesting dividends would
2 We made an estimate of the rates of return available from investing in proportion to the value of shares outstanding by using the Standard and Poor's Index of Common Stocks on the New York Stock Exchange-an index weighted according to the value of shares outstanding-and the Standard and Poor's dividend series. For three of the five starting dates covered in Table 1, the Standard and Poor's rate of return was generally higher; for two of the starting dates, the yield was lower. No system- atic differences were detectable, and on the average the yields based on the two different investment pol- icies were similar.
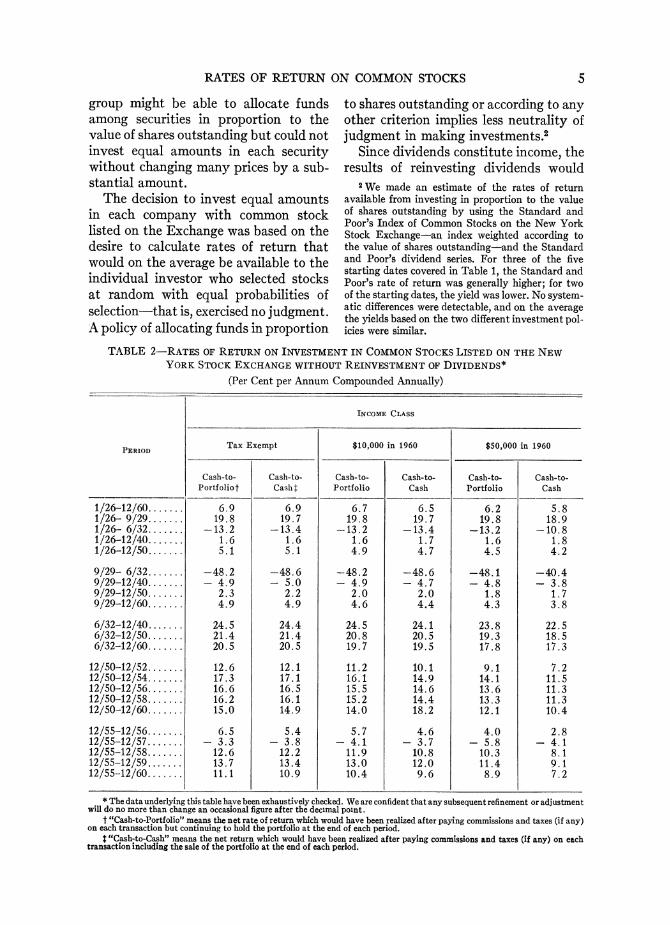
TABLE 2-RATES OF RETURN ON INVESTMENT IN COMMON STOCKS LISTED ON THE NEW YORK STOCK EXCHANGE WITHOUT REINVESTMENT OF DIVIDENDS*
(Per Cent per Annum Compounded Annually)
INCOME CLASS
PERIOD Tax Exempt $10,000 in 1960 $50,000 in 1960
Cash-to- Cash-to- Cash-to- Cash-to- Cash-to- Cash-to- Portfoliot Cash t Portfolio Cash Portfolio Cash
1/26-12/60 6.9 6.9 6.7 6.5 6.2 5.8 1/26- 9/29 19.8 19.7 19.8 19.7 19.8 18.9 1/26- 6/32 .-13.2 -13.4 -13.2 -13.4 -13.2 -10.8 1/26-12/40 1.6 1.6 1.6 1.7 1.6 1.8 1/26-12/50 5.1 5. 1 4.9 4.7 4.5 4.2
9/29- 6/32 . -48.2 -48.6 -48.2 -48.6 -48.1 -40.4 9/29-12/40. - 4.9 - 5.0 - 4.9 - 4.7 - 4.8 - 3.8 9/29-12/50 2.3 2.2 2.0 2.0 1.8 1.7 9/29-12/60 4.9 4.9 4.6 4.4 4.3 3.8
6/32-12/40 24.5 24.4 24.5 24.1 23.8 22.5 6/32-12/50 21.4 21.4 20.8 20.5 19.3 18.5 6/32-12/60 20.5 20.5 19.7 19.5 17.8 17.3
12/50-12/52 12.6 12.1 11.2 10.1 9.1 7.2 12/50-12/54 17.3 17.1 16.1 14.9 14.1 11.5 12/50-12/56 16.6 16.5 15.5 14.6 13.6 11.3 12/50-12/58 16.2 16.1 15.2 14.4 13.3 11.3 12/50-12/60 15.0 14.9 14.0 18.2 12.1 10.4
12/55-12/56 6.5 5.4 5.7 4.6 4.0 2.8 12/55-12/57 .- 3.3 - 3.8 - 4.1 - 3.7 - 5.8 - 4.1 12/55-12/58 12.6 12.2 11.9 10.8 10.3 8.1 12/55-12/59 13.7 13.4 13.0 12.0 11.4 9.1 12/55-12/60 ....... 11.1 10.9 10.4 9.6 8.9 7.2
* The data underlying this table have been exhaustively checked. We are confident that any subsequent refinement or adjustment will do no more than change an occasional figure after the decimal point.
t "Cash-to-Portfolio" means the net rate of return which would have been realized after paying commissions and taxes (if any) on each transaction but continuing to hold the portfolio at the end of each period.
t "Cash-to-Cash" means the net return which would have been realized after paying commissions and taxes (if any) on each transaction including the sale of the portfolio at the end of each period.

6 THE JOURNAL OF BUSINESS
obviously vary with the individual in- vestor's tax bracket. For the purposes of this study, three brackets were chosen, although any other set of tax rates could easily be substituted for those used.
The first category, "Tax Exempt," shows the rate of return that might have been realized by a tax-exempt institution.
Results in the $10,000 income class were computed in the following manner: 1. The marginal income tax rate as of 1960 was
figured for a married man with standard de- ductions and an adjusted gross income of $10,000.
2. For each previous year, a tax rate was deter- mined for a man who held the same relative position in the pattern of income distribution existing in those years as the man with $10,000 income in 1960.
3. The appropriate tax rate for such a married man was then applied in all preceding years.
A precisely analogous procedure was used in computing results in the third category, the $50,000 income class.3
For each period in each income class, two rates of return are shown. The first, "Cash-to-Portfolio," shows the after-tax rate of interest, compounded annually, which an individual would have had to get on a sum equal to the gross purchase price of the portfolio at the beginning of a period in order to equal the value of the portfolio at the end of the period. The second figure, "Cash-to-Cash," indicates the rate of interest, compounded annual- ly, that would be required on the value of the initial portfolio in order to equal the value of the sum at the terminal date after selling the portfolio and paying the commissions and the capital gains tax applicable.
These rates of return speak for them- selves and require little comment. The periods were chosen for obvious reasons. The period from 1926 to 1960 is a long span with booms and depressions-prime examples of each!-and war and peace. The periods beginning in September, 1929, were included to indicate the ex- perience of those who invested at the height of the stock-market boom of the 1920's. The periods beginning in June, 1932, were included to show the results of investing at the nadir of this country's worst depression. The numerous brief, recent periods were included to bring de- tails of postwar experience into sharp focus.
Aside from most periods ending in 1932 or 1940, the rates of return are sur- prisingly high. For half the twenty-two periods, the rates are above 10 per cent per annum compounded annually; and for two-thirds of the periods, the rates ex- ceed 6 per cent.
RATES OF RETURN WITHOtUT REINVESTMENT OF DIVIDENS
Table 2 presents the rates of return on common stocks listed on the New York Stock Exchange with no reinvestment of dividends, that is, under the assump- tion that dividends are spent for con- sumers goods and services at the time they are received. The method of calcula- tion is analogous to that used to compute the yield-to-maturity of a bond. The cost of the stock at the beginning of a time period is analogous to the purchase price of the bond; dividends are analogous to interest payments; and the value of the stock at the end of the period is analogous to the sum received by the holder of a bond when it matures. The rate of return is the rate of discounting which makes the stream of after-tax cash flows have a present value of zero.
I For example, men with incomes of $10,000 or $50,000 in 1960 would have had incomes of $1,780 or $8,950, respectively, in 1933. The ranges of mar- ginal tax rates were from 0 to 25 per cent for divi- dends for the $10,000 man and from 0 to 62 per cent for the $50,000 man. The capital gains tax rates ranged from 0 to 13 per cent for the $10,000 man and from 5 to 42 per cent for the $50,000 man.

RATES OF RETURN ON COMMON STOCKS 7
At first, one might expect the rates in Table 2 to be significantly lower than in Table 1, whereas in fact the rates are quite similar for most of the periods. This similarity merely reflects the fact that the rate of appreciation in the prices of stocks after the receipt of dividends was on the average about the same as the rate of appreciation before the receipt of dividends. When the latter rate was higher, the rates in Table 2 are lower than those in Table 1 and vice versa. The individual who reinvests his divi- dends is obviously wealthier at an ending
date than is the individual who spends them. On the average he also has a great deal more invested in his portfolio. Thus, some rates in Table 1 are higher than the corresponding rates in Table 2; some are lower; and several are the same.
Table 3 shows rate of capital ap- preciation or gain, ignoring dividends. COMPARISON WITH OTHER INVESTMENT MEDIA
Comparable data for other investment media are not available, but there is some information on realized rates of return on a before-tax basis. The most nearly com- plete data are for savings in commercial
TABLE 3 RATES OF CHANGE IN VALUE OF INVESTMENT IN COMMON STOCKS LISTED
ON THE NEW YORK STOCK EXCHANGE, IGNORING DIVIDENDS*
(Per Cent per Annum Compounded Annually)
INCOME CLASS
PERIOD Tax Exempt $10,000 in 1960 $50,000 in 1960
Cash to Cash to Cash to Cash to Cash to Cash to Portfoliot Casht Portfoliot Cash: Portfoliot Cashl
1/26-12/60 ....... 3.9 3.8 3.9 3.6 4.0 3.3 1/26- 9/29 ....... 15.7 15.6 15.7 15.6 15.7 14.8 1/26- 6/32 ....... -21.0 -21.2 -21.0 -21.2 -20.9 -17.8 1/26-12/40 ....... - 2.8 - 2.9 - 2.8 - 2.8 - 2.7 - 2.4 1/26-12/50 ....... 1.3 1.3 1.4 1.2 1.5 1.1 9/29- 6/32 ....... -51.5 -51.9 -51.5 -51.9 -51.3 -43.4 9/29-12/40 ....... - 8.0 - 8.0 - 8.0 - 7.7 - 7.6 - 6.4 9/29-12/50 ....... - .5 - .6 - .5 - .6 - .2 - .3 9/29-12/60 ....... 2.5 2.4 2.5 2.2 2.7 2.1 6/32-12/40 ....... 16.9 16.8 16.9 16.4 16.8 15.1 6/32-12/50 ....... 13.1 13.0 13.0 12.5 13.0 11.7 6/32-12/60 ....... 11.9 11.9 11.9 11.4 11.8 10.8
12/50-12/52 ....... 5.9 5.4 5.9 4.8 5.9 4.0 12/50-12/54 ....... 11.4 11.1 11.3 10.1 11.3 8.6 12/50-12/56 ....... 10.8 10.7 10.8 9.8 10.8 8.4 12/50-12/58 ....... 10.7 10.6 10.7 9.8 10.7 8.5 12/50-12/60 ....... 9.6 9.4 9.5 8.7 9.5 7.6 12/55-12/56 ....... 1.5 .4 1.4 .4 1.4 .2 12/55-12/57 ....... - 8.3 - 8.8 - 8.3 - 7.9 - 8.3 - 6.6 12/55-12/58 ....... 8.0 7.6 8.0 6.9 8.0 5.8 12/55-12/59 ....... 9.3 9.0 9.3 8.2 9.3 6.9 12/55-12/60 ....... 6.7 6.5 6.7 5.8 6.7 5.0
* The data underlying this table have been exhaustively checked. We are confident that any subsequent refinement or adjust- ment will do no more than change an occasional figure after the decimal point.
t "Cash-to-portfolio" means the net rate of change which would have been experienced after paying commissions and taxes (if any) on each transaction but continuing to hold the portfolio at the end of each period.
t "Cash-to-cash" means the net change which would have been experienced after paying commissions and taxes (if any) on each transaction including the sale of the portfolio at the end of each period.

8 THE JOURNAL OF BUSINESS
banks, mutual savings banks, and sav- ings and loan associations. Savings in these institutions never earned as much as 6 per cent per annum for any of the twenty-two time periods listed in Table 1 and for most of the period 1926-60 earned less than 4 per cent.4
Data on mortgage loans made by com- mercial banks and life insurance com- panies on non-farm homes are available for 1920-47 and for some subperiods.5 When all types of mortgages are consid- ered together, realized yields never ex- ceeded 6 per cent, never fell below 4 per cent, and averaged about 5 per cent.
Realized yields on municipal and U.S. government bonds, as indicated by Standard and Poor indexes, ranged from -7.0 to +7.8 per cent and averaged less than 4 per cent during the twenty-two time periods listed in Table 2.
Average realized yields on large issues of corporate bonds are available for 1900- 58.6 These yields ranged from -6 per cent to just over 15 per cent during pe- riods from 1920-43. The very high yields were achieved during the recovery from the depression of 1929-32 when prices of
industrial bonds, in particular, advanced sharply in price. During most periods, yields varied between 5 and 8 per cent and in recent periods have been lower.
The fact that many persons choose in- vestments with a substantially lower av- erage rate of return than that available on common stocks suggests the essential- ly conservative nature of those investors and the extent of their concern about the risk of loss inherent in common stocks. And yet their experience with mortgage foreclosures during the 1930's and the substantial rate of default on bonds dur- ing the same period shows that even such "conservative" investments carry con- siderable risks.
The Center for Research in Security Prices is currently at work on another study that will focus more sharply on this question of risk in common-stock ownership. While the present study is concerned with rates of return on com- mon stocks for various periods, the above- mentioned study will seek to answer the questions of how often and how much the investor might have gained or lost on every stock listed on the New York Stock Exchange from 1926 to 1960. 4Based on (1927-60) figures of U.S. Savings and
Loan League Fact Book, 1955 and 1962 editions, whose sources are as follows: (1) (savings and loan associations) data of members of Federal Home Loan Bank System, (2) (mutual savings banks) Associa- tion of Mutual Savings Banks, (3) (commercial banks) data of Board of Governors of the Federal Reserve System and Federal Deposit Insurance Cor- poration. The yields for these years were computed by dividing the total cash and credited dividends or interst by the average of deposits at the beginning and end of each year.
1926 Figures: (savings and loan associations) R. W. Goldsmith, A Study of Saving in the United States (Princeton, N.J.: Princeton University Press, 1955), Vol. I, p. 447; and (savings and commercial banks) J. V. Lintner, Mutual Savings Banks in the Savings and Mortgage Markets (Boston, Mass.: Divi- sion of Research, Graduate School of Business Ad- ministration, Harvard University, 1948), p. 477.
J. E. Morton, Urban Mortgage Lending: Com- parative Markets and Experience (Princeton, N.J.: Princeton University Press, 1956), p. 114.
6 W. B. Hickman, Statistical Measures of Cor- porate Bond Financing Since 1900 (Princeton, N.J.: Princeton University Press, 1960), pp. 291, 298-301. Hickman's sample included all straight corporate bond issues of $5 million or more.
See also David Durand, "A Quarterly Series of Corporate Basic Yields, 1952-57, and Some Attend- ant Reservations," Journal of Finance, Vol. XIII, No. 3 (September, 1958).
Basic yields, together with some discussion of the basic-yield concept, appeared in David Durand, Basic Yields of Corporate Bonds, 1900-1942 (Techni- cal Paper No. 3 [New York: National Bureau of Economic Research, 1942]). The series was later brought up to date, with additional discussion, in David Durand and Willis J. Winn, Basic Yields of Bonds, 1926-1947: Their Measurement and Pattern (Technical Paper No. 6 [New York: National Bu- reau of Economic Research, 1947]). Later basic-yield figures have appeared in the Economic Almanac and the Statistical Abstract of the United States.
RATES OF RETURN ON COMMON STOCKS 9
CONCLUSIONS
During the entire thirty-five-year pe- riod, 1926-60, the rates of return, com- pounded annually, on common stocks listed on the New York Stock Exchange, with reinvestment of dividends, were 9.0 per cent for tax exempt institutions; 8.2 per cent for persons in the $10,000 income class; and 6.8 per cent for persons in the $50,000 income class.7 These rates are substantially higher than for alternative investment media for which data are available. It is probably worth noting here that a dollar earning 9.0 per cent per annum, compounded annually, would be worth over $20 in 35 years.
The rates for the postwar periods are substantially higher than for the periods
prior to the war except during the period of recovery after 1932. It will perhaps be surprising to many that the rates have consistently been so high. For the post- war period (1950-60), as a whole, rates have exceeded 10 per cent for all tax brackets considered, even after payment of capital gains taxes, and this has been true for most subperiods as well.
Rates of return without reinvestment of dividends varied from period to period above and below rates with reinvest- ments, but on the whole the rates were similar. This merely reflects the fact that, on the average, rates of appreciation in the prices of stocks after the receipt of dividends were similar to rates before the receipt of dividends.
APPENDIX A: METHODOLOGY
DATA
COVERAGE OF THE DATA
Definition of common stock.-We have used a rather strict definition of common stock. To be considered a common stock, an issue must have residual rights to dividends. However, where the payment of a dividend is a liability for another company, which is the case for most guaranteed stocks, we do not consider the security to be a common stock. We ignore the matter of the voting power of the stock.
Initially we had the naive belief that it would be easy to distinguish between common stocks and other securities by using the designations employed in the lists in the Bank and Quotation Record. But as the study progressed we found over fifty ambiguous designations of securities. It was necessary in each such instance to exam- ine more detailed descriptions to determine the rights of the security-holder and, thus, whether the security was a common stock.
If the company had only one issue of stock, this was almost always found to be common stock; but there were exceptions. For example, Green Bay and Western Railroad has a capital structure consisting of "Class A Income De-
bentures," "Class B Income Debentures," and "common stock." Class A income debentures and the common stock have rights ordinarily ascribed to first and second non-cumulative pre- ferred stocks. The Class B income debentures have the residual rights to the income of the corporation. In our files, we treat the Class B income debentures as the common stock.
Another example is General Gas and Elec- tric's "Class A common stock," which was listed on the New York Stock Exchange from 1925 to 1933. Until 1929, the company also had out- standing dividend certificates, which were traded over the counter. These certificates were entitled to share equally in dividends after the Class A and Class B common stock had each received 5 per cent dividends. For our purposes, General Gas and Electric Company had no common stock listed until 1929.
Radio-Keith-Orpheum had both "Class A" and "Class B common stocks" outstanding. The Class B stock was entirely owned by the Radio Corporation of America. Until April, 1931, the Class A stock was in fact a participat- ing preferred stock under our definition; but then Radio Corporation of America waived its rights to dividends. Under our definition the Class A became common stock at that time.
Sometimes a company has several securities simultaneously listed, each of which we consider
7The specification of tax brackets and treatment of taxes are discussed on pp. 3, 6, 16, and 17.
10 THE JOURNAL OF BUSINESS
to be common stock. Where all of these issues had a continuous series of price quotations, we treat each of them as a separate common stock. Occassionally voting trust certificates and stock have been traded simultaneously for a relatively short period. In such cases we take as the com- mon stock the issue which has the largest dollar volume of trading.
List of common stocks.-The common stocks included in the study are those listed and traded on the New York Stock Exchange during 1926- 60. Our data cover stocks only during the period of their listing. Several issues which were seldom or never traded on the Exchange during the period have effectively been excluded from the study. Two of these issues were essentially worthless by 1926; one was the stock of a hold- ing company whose only asset is included; the remainder are New York banks traded for a short time late in 1927 and early 1928 and de- listed in 1928. Whenever a substantial amount of stock remained outstanding after a merger, this remainder is included under a different identification number as long as reasonably re- liable price quotations are available.
Period of time.-Our study covers the period from January 30, 1926, through December 30, 1960. This period was selected for a variety of reasons. First, we wanted to include a substan- tial period of time prior to the great "bull" market of 1928-29. Second, we were limited in our efforts to go back to earlier periods by the difficulties of getting complete data for the pe- riod prior to 1926.
The data terminate in December, 1960, be- cause of the amount of time needed to process the information included. We intend to bring the data up to date.
TnE BASIC DATA
We have included all data necessary for the determination of realized rates of return. There- fore our file includes price quotations; records of dividends and other distributions of cash and property to common stock holders; information on mergers and exchange offers affecting com- mon stock holders; and, in the case of companies which were delisted during the period of the study, a record of the over-the-counter price shortly after the delisting.
Price quotations.-The prices consist of the last price on the last business day of the month, whenever such prices are available. When there was no trading of a particular stock on the last business day of the month, we use the mean of
the bid-and-asked price or the bid price or the asked price.
In our file we have a price for each month that a stock was listed from January, 1926, through December, 1960-a total of more than 350,000 quotations. In addition to each price, we have recorded the transaction volume and the round-lot commission applicable at that time. We have also indicated our estimate of the quality of the price information. The over- whelming majority of prices are sales prices which are deemed to have been "good." We suspect errors in approximately 0.5 per cent of the prices in our file. A substantial proportion of these errors are believed to be caused by errors in our sources. All errors are believed to be small and unbiased.
Data on distributions to stockholders and other capital changes.-We have included data on thirty-nine kinds of distributions to stockholders and other capital changes. These data consist of information on cash dividends, stock dividends and splits, subscription rights, distributions of other stocks, mergers, exchange offers, and reor- ganizations.
Approximately 90,000 cash dividends are in- cluded. For each dividend we have recorded the amount payable (and in the case of liquidating dividends, the percentage liquidation which the dividend constitutes), the payment data, the date of record, and where available, the ex- dividend date on the New York Stock Ex- change, and the date of declaration.
These dividends are classified according to their tax status as follows: 1. Ordinary cash dividends, i.e., dividends subject to
a) Surtax only (1926-35) b) The same tax as other income (1936-July 31,
1954) c) The 4 per cent dividend credit (August 1,
1954-date) 2. Dividends not entitled to the 4 per cent dividend
credit 3. Dividends subject to both normal tax and surtax
(1926-35) 4. Distributions of capital gains 6. "Dividends" which are return of capital 5. "Dividends" which are paid in partial liquidation
of a company 7. "Dividends" which are reported capital gains re-
tained by a regulated investment company
Dividends which are paid in property other than listed common stock are also included. For these dividends we show the estimated fair mar- ket value of the dividend and classify them in the same manner as cash dividends.
RATES OF RETURN ON COMMON STOCKS 11
For distributions of subscription rights, we have recorded the following information: the number of rights required to subscribe to one additional share (or unit), the subscription price, the market value of one right, the percentage of cost basis for tax purposes which may be allo- cated to the right, and the record date for the distribution of the rights. We have also classified subscription rights according to whether they were rights to subscribe to the same issue of common stock or rights to subscribe to some- thing else such as preferred stock, stock of another company, bonds, etc.8
For each stock dividend, split, and reverse split, we have recorded the percentage change in the number of shares outstanding as a result of the split, and the change of par value occur- ring at the time of the split. We have also recorded the date of the dividend, or effective date of the split, as well as the record and ex dates.
The information recorded on distribution of other listed common stocks depends on the taxability of the distribution. We have recorded the effective date of the distribution, ex and record dates, a number identifying the stock distributed and the number of shares receivable per share held. For distributions which are treated as non-taxable exchanges (spin-offs) we have also recorded the percentage of cost basis to be allocated to the stock received. For other distributions-those which are treated as divi- dends, taxable exchanges or returns of capital- we have recorded the fair market value of each share received.
Mergers in which the old and new securities are all listed are recorded at least twice. For the security or securities absorbed in the merger, the following information is recorded:
1. The effective date of the merger 2. A number identifying the successor security 3. The tax status of the merger, i.e., non-taxable
exchange, taxable exchange, non-taxable exchange except that a portion of the proceeds may be taxable as income or as capital gain
4. The number of shares of the new security received for each share of the old
5. The dollar value of cash and other property (such as preferred stock and debentures)
6. The fair market value of each new common share except where the merger is a non-taxable exchange
7. Where the merger is a non-taxable exchange, the percentage of the cost basis to be allocated to the new common stock
8. Where a portion of the proceeds of the exchange of stock is taxable or may be taxable under a special rule, the maximum amount so taxable
Mergers are further dassified into three cate- gories: those which are probably deemed merg- ers in the legal sense; those effected through the voluntary exchange of stock where at least 50 per cent of the publicly held stock was exchanged under the terms of the offer; and exchange offers where less than half of publicly held stock is exchanged. Two other kinds of "merger" items are included in the file: reorganizations which are most easily handled by treating them as if they were mergers and occasional changes in security identification numbers to simplify the analytical programs.
For the emergent security, the date of the merger and the identity of the security or se- curities merged are recorded.
Data on other changes.-When a security ceases to be traded on the New York Stock Exchange for any reason other than by being absorbed by a merger into another listed com- mon stock, we have recorded the mean of the bid-and-asked prices over the counter at the end of the month in which the delisting occurs.9
In order to facilitate reference to the file, we have recorded effective dates of changes of name and have generally noted reported reorganiza- tions and bankruptcy proceedings.
Organization of the data.-The data have been arranged to facilitate the use of an electronic computer in making the calculations reported in the text. Our file is recorded on magnetic tape.10 All data pertaining to a particular common stock are arranged chronologically within the records for that stock. The sequence of securities is essentially alphabetical within the restrictions imposed by two requirements: (1) stocks which
8 Where the subscription rights apply to "units" including the same issue of stock, we arrive at the subscription price per share by deducting the value of other securities making up the unit from the gross subscription price.
9 In a few cases the price recorded is the price on some other stock exchange rather than the over-the- counter price. Very occasionally a security had sub- stantial value at the time of delisting, but we could find no over-the-counter price until several months after the delisting. In these cases we have used the first reasonable price available.
10 The number of reels of tape occupied by the file depends on the particular use to be made of it the next time we use the data, e.g., when arranged for printing, it requires eight reels of magnetic tape; when arranged for the computations described in the text, two reels.

12 THE JOURNAL OF BUSINESS
have been delisted without being merged into another listed stock are at the beginning of the file arranged in the order of the dates of their delisting, and (2) stocks whose holders received another stock precede the other stock in the file. Each event-the price at the end of the month, the occurrence of the ex date of the dividend, the distribution of rights, etc.-constitutes an independent "record" which contains informa- tion pertinent to that event.
Unless the majority of the stock is exchanged, the data for a particular stock are kept together regardless of name changes. If the stock is still listed after an exchange, the remainder of the record for that stock constitutes information for another "security" in our file."'
METHODS OF COLLECTION AND CONTROL12
The methods of collection and control are complicated. We have organized the material in the following section approximately in the chron- ological order in which the project progressed.
Strenuous efforts were made to keep all cleri- cal procedures as simple as possible. This effort was made in order to reduce the amount of error in the file by making much of the work within the capacity of clerks and leaving for the com- puter that work for which it had superior effi- ciency. The first step in carrying out this policy was to get for each month a list of companies with stocks listed on the New York Stock Exchange. This was done by reference to the files of the Exchange.
Collection of price data.-The list for each month was then arranged in alphabetical order and an IBM card for each listed company was punched and printed with the company name, the month and year, and an identifying number. These cards were believed to be in the same order as lines in the Bank and Quotation Record, which was the basic source of information on
stock prices and volume of trading.'3 Clerks were instructed to write relevant data in pre- pared spaces on these specially designed punch cards. They were to fill out a card for each price quotation other than one which was spe- cifically stated as being for preferred or pref- erence stock. If there was a prepunched card it was to be used. If there was no prepunched card, a blank card was to be filled out. Pre- punched cards for which no information was found were put in a special file. In addition to the information described in the preceding sec- tion, the clerk placed a code on each card desig- nating the kind of stock (e.g., 1 for common stock: 2 for Class A; 3 for Class B; 4 for Class C; - for new or when-issued, etc.). Also re- corded was the par value, which was useful as a quality-control device. Prices were recorded precisely as printed. When there was no sale price, the clerk recorded the bid price, the asked price, or if available, both. Conversions of frac- tions to decimals and computation of the means of bid and asked prices were later performed on the computer. A staff of approximately forty full-time and part-time clerks worked approxi- mately 6 months to code these price data.
The punching of the partly prepunched cards was completed by one keypunch operator. Rath- er than check the accuracy of the keypunching alone by means of the usual methods of verifica- tion, the quality of both clerical recording of prices and the keypunching was checked by means of independent coding and punching a sample of 5,000 price quotations. We have relied on this sample check of the coding and punching and the consistency checks which will be dis- cussed below.
The accuracy of the recording and punching of data was estimated from this sample, which had 100 clusters of 50 entries each. In all, 133 prices were found to be in error. Of these errors, approximately 79 per cent were of the sort which would be detected by the computer pro- grams and corrected. Thus, approximately 0.5 per cent of the total number of prices would continue to be erroneous after all data-process- ing. By a coincidence which will not be described, it was found that the original data after correc- tion through data-processing would be 99- 44/100% pure. The errors which are not detect-
11 Where we gathered information before discov- ering that a particular security is not a common stock for our purposes, we have nevertheless retained that information in our file and have placed special indicators on it. We have not, however, applied the error detection and correction procedures reported below to most of these data.
12Much of the material in this section is also presented in L. Fisher, "Use of Electronic Comput- ers in the Quality Control of Financial Data" in 1963 Proceedings of the Business and Economics Sec- tion of the American Statistical Association (Washing- ton, D.C.: American Statistical Association, 1963), pp. 169-71.
I3 Prior to February, 1928, the basic reference was the predecessor of the Bank and Quotation Rec- ord, the "Bank and Quotation Section" of the Corn- mercial and Financial Chronicle.
RATES OF RETURN ON COMMON STOCKS 13
able by our data-processing procedures are small and unbiased.
We began with approximately 400,000 pre- punched cards. Of these the clerks filled out 380,000, leaving 20,000 blank. In addition, the clerks found about 10,000 prices for which they had no prepunched cards. Many of these addi- tional prices were for stocks which were not in the list obtained from the files of the New York Stock Exchange. The prepunched cards that had either sales or both bid-and-asked prices for issues designated as common stock in the Bank and Quotation Record were sorted by identifica- tion numbers and date and placed on magnetic tape. This file was called the "main file." All other cards were sorted in the same manner and listed before they were also placed on magnetic tape. This file was the "hold-out file." From this list the decision was made as to which of the stocks among those not specifically designated as common in the Bank and Quotation Record were common stocks for our purposes.
Initial error detection and correction.-The first correction procedure applied was the detec- tion prices which were invalid on their face. Both files were checked to make certain that fractions were valid, that is, that the numerator was an odd number smaller than the denomina- tor and that the denominator was a power of 2. Where both a bid and an asked price appeared, they were compared to make sure that the bid was less than the asked price. The "mail file" was also checked to make sure that each entry in fact contained either a sale price or both bid and asked prices. The same additional test was ap- plied to the "hold-out file" except that the ex- istence of only a bid price or only an asked price was ignored if the volume of trading was less than one thousand shares for the month. All errors detected by these procedures were cor- rected.
Collection and initial correction of cask divi- dends.-Two different methods had to be used for the collection of cash dividends. For the period 1937-60, annual issues of Moody's or Standard and Poor's Dividend Records or the annual section of Standard Corporation Records were used, depending on which was in the Uni- versity of Chicago Library. For the period 1926- 36, Moody's Quarterly Dividend Record was used. Since the only known complete file of this last publication is in Moody's New York offices, the data from the earlier period were recorded by trainees working for the research division of Merrill Lynch, Pierce, Fenner & Smith Inc.
For each dividend the data described above were recorded, and also recorded was a code to indicate whether the dividend was annual, quarterly, monthly, or extra, etc. As a cross- check, annual total payments per share were taken from the appropriate Moody's Manual. The computer was then used to check the an- nual totals of the individual dividends taken from the dividend records against the annual totals from Moody's Manuals. All discrepancies were resolved.
Other distributions to stockholders, mergers, exchange offers, name changes, and reorganiza- tions.-After preliminary experiments, data on other distributions to stockholders, mergers, ex- change offers, name changes, and reorganiza- tions were taken from the Commerce Clearing House Corporation's Capital Changes Reporter.
Nine specially designed printed forms were used for this purpose. After the initial coding and punching, a printed list was made, classi- fied by company name. This list was compared with the original source to make sure that the interpretation of the entries was correct and that capital changes had been collected for each company. For companies for which a list of capital changes did not appear in the Capital Changes Reporter or was incomplete, reference was made to a variety of sources including Prentice-Hall's Capital Adjustments, Moody's Manuals, the Commercial and Financial Chroni- cle, and Poor's Daily Digest of Corporate News.
At the same time that the list of capital changes was being checked against the source, the information it contained about mergers and name changes was used in conjunction with our now-corrected information on dates of trading to assign a new number to each new security so as to place it in the appropriate order within the file. When the errors detected by this check had been corrected, the file of capital changes was recorded on magnetic tape and the security identification numbers were placed in the file.
Because there were thirty-nine different kinds of records in this file, a computer program was written which decoded the information to pro- vide a verbal description of each item. These verbal descriptions were then checked against the sources of data, and more errors were de- tected and corrected.
Tax status of distribution of cash.-Since the existence of a special tax status for a cash divi- dend is generally not shown in any of the divi- dend records, it was necessary to find out about any special tax status from other sources. We
14 THE JOURNAL OF BUSINESS
used the appropriate sections of the Capital Changes Reporter and Capital Adjustments for this purpose. However, we then found that our records of distributions of cash had come from three sources, each of which had only a portion of the information required. We therefore wrote and used computer programs to collate the in- formation about the distributions from the three sources.
Editing and detecting additional errors in the price-volume files.-The security numbers were applied to the two files of price and volume in- formation by means of a computer program. Fractions were converted to decimals; bid and asked prices were averaged; the commission ap- plicable to each price of each stock was comput- ed, and the sums of the price and commission were inserted into the file. After correction for prices which had not been assigned new identifi- cation numbers with the original program, these files were sorted according to the new number and merged together.
Until this time the computer we used was the UNIVAC I at the University of Chicago. The file of prices then consisted of thirty-three reels of magnetic tape. The University was installing an IBM 7090 computer (which has since been converted to an IBM 7094). At this time the entire file was printed, and the UNIVAC I tapes were copied onto IBM tapes through the data conversion facilities of the Reader's Digest As- sociation.
The error detection program designed to make price data "99-44/100% pure" was now written for the IBM 7074 computer owned by Merrill Lynch, Pierce, Fenner & Smith Inc. and used. The program performed the following tasks:
1. Except for securities we do not regard as common stock, price quotations were placed into two cate- gories:14 a) Sole quotations for a security for a month b) One of several quotations for a security for a
month 2. Quotations in category lb were further broken
down a) The quotation with the highest product of
price and trading volume for the month b) All other
(If there was no trading the quotation with the highest price was placed in category 2a. If there was a tie, the first quotation in the file was placed in category 2a.)
3. Quotations in categories la and 2a were further divided into three subcategories each: a) The magnitudes of the changes from both the
preceding quotation in category la or 2a for this security to this quotation and from this quotation to the next such quotation exceed a point plus 10 per cent of the first quotation of the pair and the changes are of opposite sign-the price is "bad"
b) The price is not bad but one of these changes exceeds a point plus 25 per cent-it is "sus- picious"
c) The price is neither bad nor suspicious-it is "good"
4. For each security, a one-to-three-line list of time periods for which a quotation falling into cate- gories la or 2a is in the file for each month was prepared.
5. For each gap in the series of price quotations for a security, further action was taken. If the gap was for less than 12 months, dummy records were created. For longer gaps a special report was made.
6. A two-page summary of the price information for each common stock was prepared. For each month, January, 1926-December, 1960, this sum- mary shows the category of the real or dummy quotation and the price.
The output from the program consisted of several files, each on one or more reels of mag- netic tape: 1. The main file consisting of all good, suspicious,
and duplicate (category 2b) quotations, and all quotations which were for other than common stock or which show a volume of trading but no price
2. A "bad and missing" file containing the dummy and bad quotations
3. A suspicious file'5 4. A "multiple-price" file showing all quotations in
category 2 5. A list of deletions
All of these files, except the main file, were printed and examined in order to make correc- tions and to revise our plans for the next steps in preparing the data. For January, 1926, and December, 1960, it was impossible for the pro- gram to call a price bad. Suspicious prices for these months were treated as if they were bad. A sample of the remaining suspicious items was checked. In almost every case the price agreed with a price in the Bank and Quotation Record.
For the calculations reported in the text we did not think it necessary to correct all the bad and missing items. We checked all quotations classified as bad and missing for the beginning
14 If there were identical quotations, all but one were deleted.
15 Files 2 and 3 were sorted by date and company name as well as by security number and date.

RATES OF RETURN ON COMMON STOCKS 15
or ending dates of the various periods studied. We further corrected all discrepancies for a num- ber of other dates where, through printer's er- rors, prices had not been aligned with company names in the Bank and Quotation Record (in this case several consecutive prices had been at- tributed to wrong securities). In addition, all discrepancies were checked for a sample of 115 securities.
Construction of the combined file.-The sepa- rate files for prices, cash dividends, and ten groups of other events were rearranged to pro- vide a convenient, common format and were merged together. The arrangement of the data is described in Appendix B. Critical discrep- ancies, discovered by checking the output of the error detection program just described were corrected and several thousand additions were made by means of special correction programs. This first application of the correction programs altered data for about 16,000 events.
Error detection procedure for the combined file. -The data in the combined file had come from several independent sources. Hence it was likely that inconsistencies would be found. For exam- ple, when a company's stock is split, this action must generally be approved by a meeting of the stockholders. The Capital Changes Reporter states the date the action was approved by the stockholders. Trading in the new (split) shares cannot take place until the stock exchange has been notified of the stockholders' action. Hence, the split may not actually be effective until the next month or even later. Thus it was necessary to search the file for further inconsistencies in the data.
A fairly elaborate program for the IBM 7094 was used for this purpose. This program, which we have called "Filter King," reports the follow- ing kinds of inconsistencies:
1. Some or all of the events for a security may be misplaced within the file if a) Price quotations are missing for more than 12
consecutive months b) Price quotations are available on the Exchange
after the date at which we thought the stock had been exchanged through a merger or after the date for which we had collected an over- the-counter price
c) The information for a security was above that of a company whose stockholders received this security through merger or other distribution
2. Prices or capital changes may have been mis- recorded if a price quotation is inconsistent with previous and/or subsequent quotations, adjusted for dividends, stock dividends, rights, etc.
The program also performs other functions: (1) If a stock is being traded with a stock divi- dend on and also on a when-issued basis, the program chooses the price consistent with the date of the stock dividend. (2) Visual reference to the information in the file is not convenient. When printed, the file takes about 22,000 pages of 11 X 15-inch paper. Therefore, Filter King produces a 2,500-page summary of the file. This summary contains the most recent name and the identification number of each security and part of the information about each event, that is, for prices, the year and month, whether the price is consistent with previous and subsequent prices and the price itself; for other events, the year and month of the ex date, the kind of event, and the most useful number pertaining to the event (the amount of a dividend; the size of a stock dividend, split, or reverse split; the value of one right; the number of shares received in a spin-off or merger); but other information is omitted.
Filter King was used twice to test the entire file before we made the computations reported here. Between the first and second runs about 13,000 changes were made in the file and about 4,000 changes after the second run. All possible inconsistencies in the arrangement of the file were investigated and action taken to correct them. All inconsistencies in price quotations which were near capital changes in time or which suggested the existence of an unrecorded capital change were also investigated. All incon- sistent or missing price quotations for dates of sale or purchase of a portfolio were checked again.
Other inconsistencies were left until later. We are now investigating and correcting them. The process will be completed about the time this article is published.
CALCULATION OF RATE OF RETURN
In this section we describe the methods we have used to calculate rates of return. Since the programs for calculating rates of return with and without reinvestment of dividends use near- ly identical procedures, we shall first describe the calculation of rates of return with reinvest- ment of dividends and then indicate the changes required to compute rates of return without reinvestment.
The calculation of average rate of return for all listed common stocks over a particular period of time requires that we know how much was invested at the initial date and what the value
16 THE JOURNAL OF BUSINESS
of the portfolio is at the final date. Since our investor is required to pay federal income taxes, we must also know what the cost basis for tax purposes (or simply "basis") is. The file is ar- ranged by security and chronologically within each security. The computer program for cal- culating rate of return with reinvestment of dividends selects one item from the file at a time and then takes appropriate action. During the course of the computation several additional files are maintained internally:
1. A file of regular income tax rates-one entry for each month
2. A file of capital gains tax rates-one entry for each month
3. A file showing the current number of shares held, the cost of these shares, and the number of dollars available for reinvestment at the end of the cur- rent month. All of these items pertain to the security currently under consideration
4. A deferred file which shows the effective date, that is, payment date, of a distribution to stock holders or other capital change and its effect on the number of shares held, the cost of shares, and/ or funds available for reinvestment. An entry is made in this file when the ex date for some dis- tribution occurs and is maintained until the dis- tribution date
5. A cross-reference file which contains the identifi- cation number of a security distributed as a result of a spin-off or merger, the identification of the security whose holders receive something as a result of a spin-off or merger, the effective date of the spin-off or merger, and the number of shares, their cost basis, and the amount of funds received. An entry is made in this file whenever a spin-off or merger occurs and is maintained until the program is processing information for the security received
6. A file showing the amount to be reinvested in each security each month through the proceeds of sales of securities over the counter
7. The running total of the initial investment in securities
8. Running totals of the value of the investment in each security at the ending date of the study. Three such totals are maintained: one showing the market value of the portfolio, one showing net proceeds from the sale of the portfolio before payment of the capital gains taxes, and one show- ing net proceeds after payment of capital gains taxes
An event may directly affect the number of shares held, the cost basis, or the funds available for investment. In general the computations are performed as follows: when the first event for a stock is read into the computer, the number of shares, basis, and funds are set to zero. When
the price for a beginning date of the study comes up, we add $1,000 to the initial investment, place $1,000 into the basis, and divide $1,000 by the price plus commission to compute the num- ber of shares held initially."6
Most dividends and other distributions to stockholders are based on the number of shares held on the day prior to the ex-dividend date and not on the number of shares held on the distribution date. Therefore dividends, etc., have been placed in the file according to their ex dates. When a new event is perceived, its key date is noted, the deferred file is scanned, and processing of all items in the deferred file with effective dates less than the current key date is completed. Completion of the processing re- quires that the change in shares be added to the current number of shares held, change in basis be added to the current basis, change in funds available be added to current funds available, and the entry in the deferred file be destroyed.
When a price is found, the next step is to determine whether the price is for an ending date of the study. If it is for an ending date, processing of all remaining items in the deferred file is completed, and the appropriate computa- tion of the value of the interest in the security is made for each of the three assumptions about valuation of the proceeds and added to the running totals. If the price is not for an ending date for the study, the funds currently available are added to the current basis, funds are divided by price plus commission and the quotient added to the current number of shares, and funds are set to zero.
When a dividend is perceived, a new item is created in the deferred file. If the dividend is a cash dividend, current number of shares is multiplied by the amount of the dividend per share, the product is reduced by the amount of tax liability and placed in "change in funds." If the dividend causes a change in basis, the change in basis is also recorded.
When a stock dividend, split, or reverse split is perceived, a new item in the deferred file is created and the change in the number of shares held is recorded.
Perception of the description of a distribution of subscription rights requires the following ac-
16If the company has more than one common stock at the beginning date, the $1,000 is divided equally among the common stock issues, i.e., if there are two common stocks the initial investment in each stock is $500.

RATES OF RETURN ON COMMON STOCKS 17
tion. If the subscription rights are for the same security, it is assumed that enough rights are sold so that after taxes the remaining rights may be exercised. The changes in number of shares held and basis are added to current number of shares and current basis. If the rights are not to the same security, they are treated as though they were dividends with the appropriate tax status and the current basis and funds currently available are adjusted.
When a spin-off occurs, both a deferred item and an item in the cross-reference file are cre- ated. The deferred item shows the change in basis. The cross-reference item shows the num- ber of shares to be received after allowing for taxes and cost basis of these shares.
When a merger is perceived, processing of all items in the deferred file is completed and a cross-reference item is created. The cross-refer- ence item shows the after-tax figures for the number of shares received, basis, and the funds received in exchange for the old stock. To funds in the cross-reference item, currently available funds are added. Current shares, basis, and funds are then reduced to zero.
The notation of the receipt of shares and/or funds as the result of a spin-off by another se- curity or the merger of another security causes the cross-reference file to be searched. When the appropriate item is found, the shares, basis, and funds shown there are added to the respective current items; and the item in the cross-refer- ence file is destroyed.
When an over-the-counter price is perceived, processing of the remaining items in the deferred file is completed; the current number of shares is multiplied by the over-the-counter price; and the product, adjusted for tax liability on credit, is added to current funds. The current funds are then added to the file of funds received through over-the-counter sales.
When the end of the file has been reached and the computations for the last security com- pleted, the discount rates on investment are calculated. The calculation is performed by find- ing the ratio of the value of the portfolio or cash at the ending date by the total initial invest- ment, taking the natural logarithm of the ratio and dividing it by the length of the period to find the rate of return, compounding continu- ously. This rate is then converted to the equiva- lent rate of return, compounding annually.17
Rates of return without reinvestment of divi- dends.-The calculation of rates of return with- out reinvestment of dividends required several changes in the computer program. The deferred file must also show the amount of cash to be paid out. A file showing the amount of cash paid out each month must be maintained. Portions of the subprograms for handling cash dividends other than partial liquidations, rights to sub- scribe to other securities, mergers, and several housekeeping functions had to be altered to maintain the file of cash paid out. The major change, however, was in the actual computation of rate of return. The rate of return is the dis- count rate which makes the present value of the income stream purchased equal to the initial investment in the portfolio. This income stream consists of dividends received each month (as- sumed to be at midmonth) and the final value of the portfolio.
A new method of making successive approxi- mations was used. This method requires about five to ten iterations, depending on the length of the period and the magnitude of the rate, to compute the rate of return to more than seven significant decimal digits. The program for mak- ing the computations shown in Table 2 required a total of 25 minutes on the IBM 7094.
17 The actual computer program performs all of the calculations reported in Table 1 in one pass of the file. It can compute results for six starting dates, twelve ending dates, and three sets of tax rates (one of which is zero) in about 22 minutes.
APPENDIX B: ORGANIZATION OF THE FILE OF BASIC DATA
The master file of basic data is recorded by the IBM 7094 in BCD mode at 556 characters per inch on tapes written by IBM 729-II or 729-VI tape drives. Logical records, each 180 characters long, are in blocks of seven. Each logical record contains the information pertinent to one "event." For our purposes an event is the record of the price of a stock at the end of
a month, the information describing a cash divi- dend, stock dividend, split, distribution of rights, spin-off of another stock, description of a merger or exchange offer in which the security is in- volved, a name change, or an explanatory note.
The logical records are organized as follows:
Characters 1-5-Security identification number (nu- meric)

18 THE JOURNAL OF BUSINESS
Characters 6-13-A numeric key for sorting records within a security Characters 6-9-Year and month, e.g., 3507 for
July, 1935 For end of month (price-volume) records
Characters 10-13-Contain a code showing the quality of price information in terms of how nearly consistent the quotation is with previous and following quotations, and the amount of cross-checking we have done on it; whether the quotation is for a sale, a mean of bid and asked prices, only a bid or asked quotation, or shows only the value of trading for the month; and a sorting number if more than one quotation ex- ists for the month
For other events Characters 10-11-Show the day of the month on
which the event occurred. For most such items the date used is the stock exchange ex date
Characters 12-13-Are reserved for sorting within the day
Character 14-Contains a mnemonic code for the name of the security, e.g., A for Class A; F for CertiFicate; M for AMerican shares
Character 15-Contains an alphabetic code when- ever the ex date has been estimated from record or distribution dates
Characters 16-17-Contain a two-digit numeric code showing the kind of item described by the record:
(-7)-(-5)-Receipt of shares through merger, spin-off or other distribution by another listed company
00-09-Price-volume items 10-19-"Cash" dividends 20-24-Stock dividends, splits, and changes in
par value 30-42-Subscription rights 51-60-Distributions of other listed common
stocks 70-79-Mergers and exchange offers 80-Name changes 83-Record of the over-the-counter price im-
mediately after a security has been delisted on the stock exchange
90-99-Notes Character 18-For items of kind 70-77 contains a
numeric code showing the taxability of the ex- change
Character 19-For items of kind 30-79 contains an alphabetic code showing whether prices are sales or bid and asked averages
Character 20-For items of kind 10-19 contains a numeric code showing whether or not the dividend was paid in cash
Characters 21-26-Show the effective or distribu- tion dates for items of kind 10-83
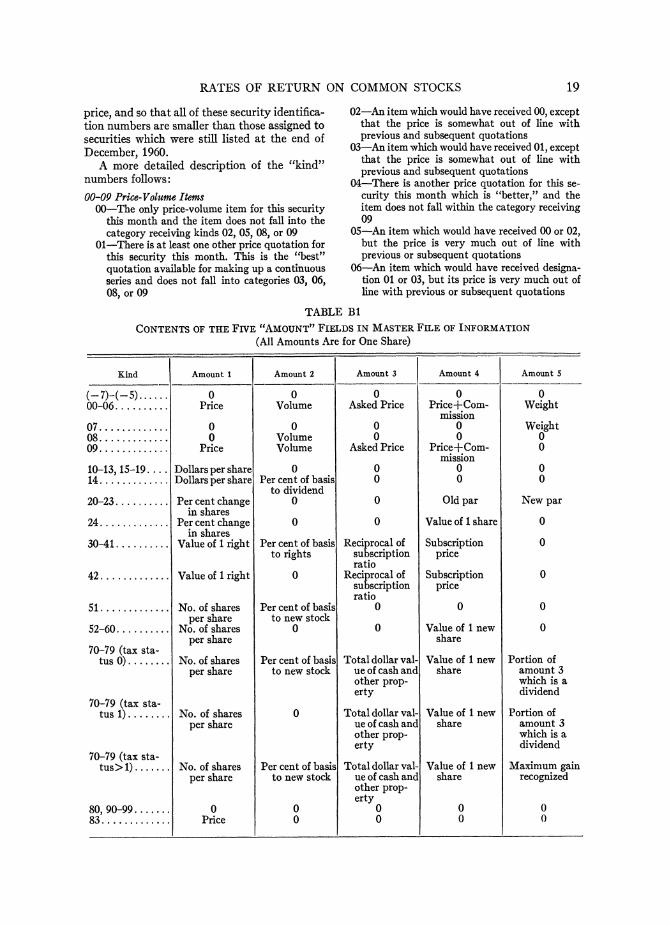
Characters 27-30-Are reserved for an industry code Characters 31-80-Are divided into five 10-column
decimal fields. The contents of these fields are shown in Table BI
Characters 80-86-Are used for events of kinds (-7)-(-5) and 51-79 Characters 81-85-Contain the security identi-
fication number of the security whose holders receive shares (kinds -7, -6, -5) or whose shares are received (kinds 51-79) in a dis- tribution or exchange of stock
Character 86-Contains the mnemonic name code, described under character 14, for the other security
Characters 87-140-Are used in alphanumeric text. For price-volume items the field contains the name of the company issuing the stock, par value, and a "company number" which was used for the initial data collection of the project. For dividends, the field contains the name of the company and, if a "cash" dividend was really property such as preferred stock, a description of what was distri- buted. For a name change, the field contains a new name. For a note, the field contains the text of the note
Characters 141-46-Contain the declared date for a dividend
Characters 147-52-Contain the record date for a dividend or other distribution
Characters 153-58-Contain an "alpha" number used in a later stage of data collection (a single security may have more than one alpha number and, conversely, a particular alpha number may correspond to more than one security). The "al- pha" number simplifies alphabetizing the file
Characters 159-64-Contain an alpha number cor- responding to the security number in characters 81-85
Characters 165-80-Do not contain significant in- formation. In effect they are padding so as to make the logical record length divisible by either 5 or 6 and thus allow the file to be used by a variety of computers
The assignment of security identification numbers was made in conformity with the fol- lowing rules: securities which are common stocks under some definitions but not under the defini- tion used by us are given numbers less than 26,000 if no listed stock of the company fits our definition of common stock, and a fifth digit of nine if the security under consideration falls into this category but at least one listed stock of the company does meet our definition. The numbers must be chosen so that, in items of kind 51-78 for the security, the security identi- fication number (characters 1-5), will be less than the number in Characters 81-85. The se- curity identification numbers have also been chosen so that the numbers for securities for which an item of kind 83 appears will be a monotonically increasing function of the year and month associated with an over-the-counter
RATES OF RETURN ON COMMON STOCKS 19
price, and so that all of these security identifica- tion numbers are smaller than those assigned to securities which were still listed at the end of December, 1960.
A more detailed description of the "kind" numbers follows:
00-09 Price-Volume Items 00-The only price-volume item for this security
this month and the item does not fall into the category receiving kinds 02, 05, 08, or 09
01-There is at least one other price quotation for this security this month. This is the "best" quotation available for making up a continuous series and does not fall into categories 03, 06, 08, or 09
02-An item which would have received 00, except that the price is somewhat out of line with previous and subsequent quotations
03-An item which would have received 01, except that the price is somewhat out of line with previous and subsequent quotations
04-There is another price quotation for this se- curity this month which is "better," and the item does not fall within the category receiving 09
05-An item which would have received 00 or 02, but the price is very much out of line with previous or subsequent quotations
06-An item which would have received designa- tion 01 or 03, but its price is very much out of line with previous or subsequent quotations
TABLE B1
CONTENTS OF THE FIVE "AMOUNT" FIELDS IN MASTER FILE OF INFORMATION
(All Amounts Are for One Share)
Kind Amount 1 Amount 2 Amount 3 Amount 4 Amount 5
(-7)-(-5) 0 0 0 0 0 00-06. Price Volume Asked Price Price+Com- Weight
mission 07 ... 0 0 0 0 Weight 08 .......... 0 Volume 0 0 0 09 .......... Price Volume Asked Price Price+Com- 0
mission 10-13, 15-19 .... Dollars per share 0 0 0 0 14 .Dollars per share Per cent of basis 0 0 0
to dividend 20-23.......... Per cent change 0 0 Old par New par
in shares 24 ............ Per cent change 0 0 Value of 1 share 0
in shares 30-41. Value of 1 right Per cent of basis Reciprocal of Subscription 0
to rights subscription price ratio
42 .Value of 1 right 0 Reciprocal of Subscription 0 subscription price ratio
51 .No. of shares Per cent of basis 0 0 0 per share to new stock
52-60 . No. of shares 0 0 Value of 1 new 0 per share share
70-79 (tax sta- tus 0) . No. of shares Per cent of basis Total dollar val- Value of 1 new Portion of
per share to new stock ue of cash and share amount 3 other prop- which is a erty dividend
70-79 (tax sta- tus 1). No. of shares 0 Total dollar val- Value of 1 new Portion of
per share ue of cash and share amount 3 other prop- which is a erty dividend
70-79 (tax sta- tus> 1) ....... No. of shares Per cent of basis Total dollar val- Value of 1 new Maximum gain
per share to new stock ue of cash and share recognized other prop- erty
80, 90-99 0 0 0 0 0 83 .Price 0 0 0 0
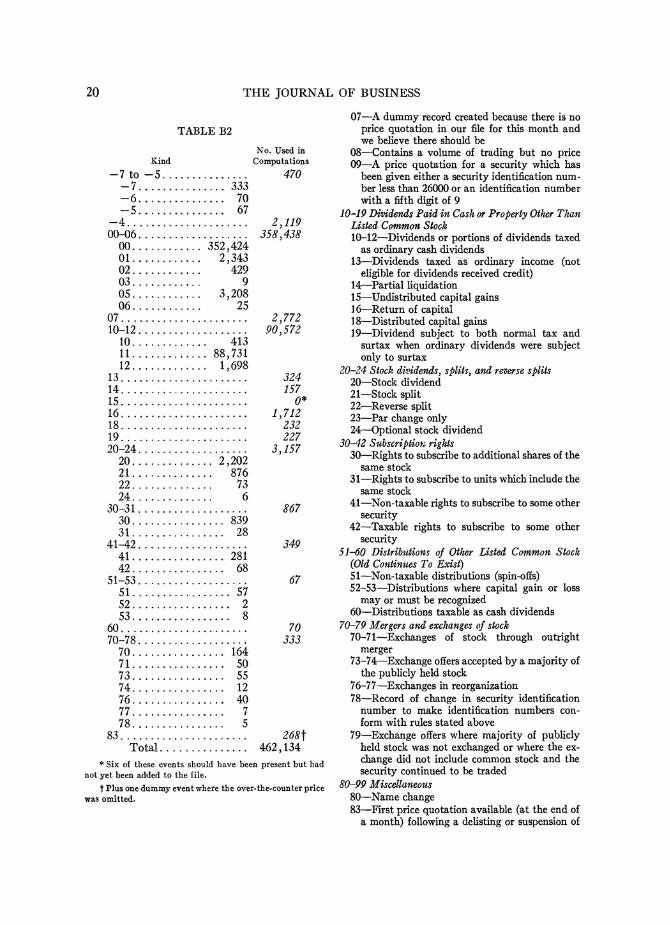
20 THE TOURNAL OF BUSINESS
TABLE B2
No. Used in Kind Computations
-7 to-5 ............... 470 -7 .333 -6 .70 -5 .. 67
-4 . ................. 2,119 00-06 .................. 358,438
00 . , 352,424 01 ... . 2,343 02 ... 429 03 ........ 9 05.....,.. 3,208 06 ... 25
07 .... ....... 2,772 10-12 ............ 90,572
10 .......... 413 11.,,....... 88,731 12.......... 1,698
13 ..324 14 ..157 15 ,... 0* 16 .. ,712 18 . ..........., 232 19 ..227 20-24 .3,157
20 . , ,,, 2,202 21 .876 22 .73 24 . ...... 6
30-31 ............. 867 30 ........839 31 .... , ,,,, 28
41-42 ......... 349 41 . , , 281 42 . , 68
51-53 .................. 67 51 .57 52 . 2 53 . 8
60 . ........... 70 70-78 . 333
7 .164 71 . 50 73 .55 74 . 12 76 .40 77 . 7 78 . 5
83 .................. 268t Total ............... 462,134
* Six of these events should have been present but had not yet been added to the file.
t Plus one dummy event where the over-the-counter price was omitted.
07-A dummy record created because there is no price quotation in our file for this month and we believe there should be
08-Contains a volume of trading but no price 09-A price quotation for a security which has
been given either a security identification num- ber less than 26000 or an identification number with a fifth digit of 9
10-19 Dividends Paid in Cash or Property Other Than Listed Common Stock 10-12-Dividends or portions of dividends taxed
as ordinary cash dividends 13-Dividends taxed as ordinary income (not
eligible for dividends received credit) 14-Partial liquidation 15-Undistributed capital gains 16-Return of capital 18-Distributed capital gains 19-Dividend subject to both normal tax and
surtax when ordinary dividends were subject only to surtax
20-24 Stock dividends, splits, and reverse splits 20-Stock dividend 21-Stock split 22-Reverse split 23-Par change only 24-Optional stock dividend
30-42 Subscriptiot rights 30-Rights to subscribe to additional shares of the
same stock 31-Rights to subscribe to units which include the
same stock 41-Non-taxable rights to subscribe to some other
security 42-Taxable rights to subscribe to some other
security 51-60 Distributions of Other Listed Common Stock
(Old Continues To Exist) 51-Non-taxable distributions (spin-offs) 52-53-Distributions where capital gain or loss
may or must be recognized 60-Distributions taxable as cash dividends
70-79 Mergers and exchanges of stock 70-71-Exchanges of stock through outright
merger 73-74-Exchange offers accepted by a majority of
the publicly held stock 76-77-Exchanges in reorganization 78-Record of change in security identification
number to make identification numbers con- form with rules stated above
79-Exchange offers where majority of publicly held stock was not exchanged or where the ex- change did not include common stock and the security continued to be traded
80-99 Miscellaneous 80-Name change 83-First price quotation available (at the end of
a month) following a delisting or suspension of
RATES OF RETURN ON COMMON STOCKS 21
a security which was not accompanied by an item of a kind 70-77
90-Note that the amount of money or price shown in the initial coding of an adjacent item was not in U.S. dollars
91-92-Note that another security was merged into this one
93-Note that this security was merged into an- other and the description under the other securi- ty had to be consulted in our sources
94-Notation of receivership, liquidation, or worthlessness of stock
95-96-Notation of distribution of security to holders of senior securities of the company
97-Notation of issuance of convertible bonds or convertible preferred stock
98-Notation of call of convertible bonds or con- vertible preferred stock and redemption
99-Miscellaneous notes -7, -6, -5 Cross-reference Notes
-5-Security spin-off -6-Security distributed as a dividend - 7-Security distributed in a merger or exchange
of stock
A condensation of the file was used for studies reported here. The condensed file omits all items for securities which are not common stocks. Also omitted are items which are not needed for these studies, viz., kinds 04, 07-09, 23, 80, 90- 99. Kind -4 is added to show the current name of security, taking its information from the first item for a security or from kind 80. The con- densed file is recorded in binary form at a den- sity of 800 characters per inch. Each item is 11 computer words long. Physical records are 1,100 words long.
The information included is taken from char- acters 1-12, 16-18, 21-26, and 31-85 of entries in the master file.
The count of each kind of item is shown in Table B2.
In the future, the master file will be kept in another condensed binary form, which will allow all the data to be contained on a fifth as much magnetic tape as the present (BCD) master file.