rare earth elements in the soil environment
TRANSCRIPT
LAND POLLUTION (G HETTIARACHCHI, SECTION EDITOR)
Rare Earth Elements in the Soil Environment
Silvio J. Ramos1 & Guilherme S. Dinali2 & Cynthia Oliveira2 & Gabriel C. Martins2 &
Cristiano G. Moreira2 & José O. Siqueira3 & Luiz R. G. Guilherme2
Published online: 25 February 2016# Springer International Publishing AG 2016
Abstract Rare earth elements (REE) are a homogenousgroup of 17 chemical elements in the periodic table that arekey to many modern industries including chemicals, consum-er electronics, clean energy, transportation, health care, avia-tion, and defense. Moreover, in recent years, they have beenused in agriculture. One of the consequences of their world-wide use is the possible increase of their levels in variousenvironmental compartments. This review addresses majortopics concerning the study of REE in the soil environment,with special attention to the latest research findings. The mainsources of REE to soils, the contents of REE in soils world-wide, and relevant information on the effects of REE to plantswere explored. Ecological and human health risk issues relat-ed to the presence of REE in soils were also discussed.Although several findings reported positive effects of REEon plant growth, many questions about their biological roleremain unanswered. Therefore, studies concerning the actualmechanism of action of these elements on cellular and phys-iological processes should be further refined. Even more ur-gent is to unveil their chemical behavior in soils and the eco-logical and human health risks that might be associated withthe widespread use of REE in our modern society.
Keywords Lanthanides . Fertilizers . Bioavailability .
Bioaccessibility . Environmental safety . Risk assessment
Introduction
Rare earth elements (REE) are identified by the InternationalUnion of Pure and Applied Chemistry (IUPAC) as a group of17 elements with similar physicochemical characteristics. Ofthese elements, 15 belong to the group of lanthanides withatomic numbers between Z=57 and Z=71, as follows: lantha-num (La), cerium (Ce), praseodymium (Pr), neodymium (Nd),promethium (Pm), samarium (Sm), europium (Eu), gadolinium(Gd), terbium (Tb), dysprosium (Dy), holmium (Ho), erbium(Er), thulium (Tm), ytterbium (Yb), and lutecium (Lu). Twomore elements join them: scandium (Sc, Z=21) and yttrium(Y, Z=39) [1]. The REE are commonly divided into two dis-tinct groups: light (LREE) and heavy (HREE). The LREE areLa, Ce, Pr, Nd, Pm, and Sm. They are found in higher amountin the environment, present smaller atomic masses, besideshigher solubility and alkalinity. The following elements are partof the HREE group: Eu, Gd, Tb, Dy, Ho, Er, Tm, Yb, Lu, andY. These elements have higher atomic masses, smaller solubil-ity, and alkalinity [2]. However there is no absolute definition inthe scientific community worldwide to classify each elementwithin the group of LREE or HREE.
Since the first report of rare earth element (REE) detectionin apatites of sedimentary and biological origins, as well as inbarley, beechwood, and rice and in the leaves of tobacco andgrape in 1878 [3], there has been an increasing interest for thestudy of REE in the soil environment. Yet, our understandingof the biological role of REE is still in its early stages [4],which reinforces the need for continuous research to betterunderstand the environmental effects of REE enrichment of
This article is part of the Topical Collection on Land Pollution
* Luiz R. G. [email protected]
1 Vale Institute of Technology—Mining, Avenida JuscelinoKubitschek, 31, Ouro Preto, Minas Gerais 35400-000, Brazil
2 Soil Science Department, Federal University of Lavras,Lavras, Minas Gerais 37200-000, Brazil
3 Vale Institute of Technology—Sustainable Development, RuaBoaventura da Silva, 955, Belém, Pará 66055-090, Brazil
Curr Pollution Rep (2016) 2:28–50DOI 10.1007/s40726-016-0026-4

soils as a consequence of their increasing use in industrial andagricultural practices.
A survey of the Web of Science database (2015 Jun 14)showed that the scientific literature comprised 1205 references(including 46 patents) on studies of REE in soils using thefollowing keywords: Brare earth elements^ AND Bsoil.^ Halfof the references (603) were published in the last 6 years (since2009), and ~56 % of them were concentrated in five countries:China (with ~27 % of the references), USA, France, Japan,and Germany. This survey was further refined by entering thekeyword Bpollution^ (rare earth elements AND soil AND pol-lution), leading to a subset of 260 references. Again, the greatmajority of the references (~57 %) were published in recentyears (since 2010), and half of them (130) came from China,Japan, Germany, and France. By replacing the third keywordwith Bplant^ (rare earth elements AND soil AND plant), wecollected 369 references, and when we added pollution to thislast refinement (rare earth elements AND soil AND plantAND pollution), we have recovered only 91 references fromthe previous search, with ~57 % published since 2010. Lastly,by using a combination of keywords rare earth elements ANDsoil AND Brisk assessment,^ we found only 15 references thatcorresponded to our search criteria.
From the previous information, it is clear that research withREE in soils has been concentratedmostly in the last 5–6 yearsand only in a few countries. It is also noteworthy that studieswith REE in soils with a focus on their effect in plants and inthe environment are still limited. Finally, we certainly couldconclude that studies focusing on risk assessment of REE inthe soil environment are an urgent need, taking into consider-ation the increasing worldwide use of REE in recent years.
This review was prepared in order to address relevant in-formation (published preferentially in the last 5–6 years)concerning REE in the soil environment, with a focus on thefollowing: (1) the main sources of REE to soils; (2) the majorfactors affecting the content of REE in soils worldwide; and(3) relevant information on the effects of REE to living sys-tems, with a focus on plant studies and on the need for urgentinvestigations related to risk assessment of REE in the soilenvironment (Fig. 1).
Discovery and Occurrence of REE
The history of the discovery of REE is a complex subject full ofcontroversy. In one of the versions, which started in 1787, CarlAxel Arrhenius discovered a heavy black mineral in a trip nearthe village of Ytterby in the Island of Resarö (east of Stockholm).In 1794, the Finnish professor of chemistry and mineralogyJohan Gadolin analyzed a sample of this mineral provided byArrhenius and found a new Bearth,^ naming it Ytterby. Yearslater, the Swedish chemist Anders Gustav Ekeberg renamed thisearth as yttrium. In another version, it is affirmed that the firstregistration occurred in 1751, when the Swedish chemist Axel
Frederik Cronstedt discovered a heavy rock in the Bastnas minein Sweden, in which Martin Heinrich Klaproth and Jons JacobBerzelius, along withWilhelmHisinger later in 1803, isolated anearth that they named cerium. Thus, in the beginning of thenineteenth century, two REE were known Byttrium^ (discoveredin 1794) and Bcerium^ (discovered in 1803) [5]. As time passedand new technologieswere developed, it was found out that thesetwo earths (yttrium and cerium) were a complex mixture of otherelements. Currently, the rare earth family consists of 17 transitionmetals located in group 3 of the periodic table.
The abundance of REE in the earth crust is significant. Incontrast with its denomination, the REE are not necessarilyrare, because they are found in almost all rock formations [6].Cerium is the most abundant REE and the 25th most abundantelement in earth’s crust [7]. The lanthanides found in smallerconcentrations—Lu and Tm—are more abundant in the earthcrust than cadmium (Cd) and selenium (Se) [8]. Pm is the onlyartificial element, which is, it does not occur naturally inearth’s crust [9, 10].
Known reserves of REE (approximately 130 million tons)are extensively distributed worldwide. They occur in 6European countries, 14 Asian countries, and 10 African coun-tries, as well as in the USA, Canada, Australia, and Brazil[11]. China has the largest reserves (approximately 55 milliontons) and appears as the world’s largest REE producer (about86 % of the production). Brazil is the second country in REEreserves (approximately 22 million tons), followed byAustralia, with approximately 3.2 million tons [12].
Characteristics and Uses of REE
The REE are very similar chemically and physically, and thisuniformity comes from the nature of their electronic configu-ration, generally reaching an oxidation state B+3,^ particularlystable, and a small but constant reduction in the ionic radius,with an increase of the atomic number, which is calledBlanthanide contraction^ [7]. Elements Ce and Eu can alsobe present in oxidation states B+4^ and B+2,^ respectively[7, 13]. The REE are soft elements, malleable, ductile, and con-sidered great electrical conductors, which allow their applica-tion in several industrial segments of high technology, such asautomotive, nuclear, petroleum, electronic, military, metallur-gical, and renewable energy [14–17]. REE can also be appliedin studies of pedogenic processes, as tracers in geochemicalstudies [18, 19], and in agricultural fertilizers [20].
Regarding their natural distribution, the REE show regular-ity and follow the Oddo-Harkins rule, in which elements withan even atomic number (Ce, Nd, Sm, Gd, Dy, Er, and Yb) aremore abundant than elements with an odd atomic number (La,Pr, Eu, Tb, Ho, Tm, and Lu), besides having decreasing con-tents with an increase in atomic mass [9]. This Oddo-Harkinsrule refers to a Bzigzag^ standard in diagrams of composition-
Curr Pollution Rep (2016) 2:28–50 29

abundance, in which REE are normally presented. This stan-dard comes from the variable concentrations that these ele-ments have due to the inconstancy in their atomic nuclei,where the elements with even atomic numbers, by having aproton pairing in their chemical distribution, are more stablethan their odd periodic neighbors [21].
In order to eliminate this zigzag standard effect andgraphically demonstrate the behavior of REE in the envi-ronment, the normalization of their contents is done in thestudy sample, through recognized standards [22], as shownin Fig. 2. This tool helps in comprehending analyticalresults and allows the identification of possible abnormal-ities, when normalized. Several standards are used for thispurpose, with the chondrite meteorites being the mostused, since they are considered materials that have thesame chemical composition of the material that originatedthe solar system bodies [24]. Besides the chondrite mete-orites [23], other standards are also used such as the uppercontinental crust [25], the North American shale composite[26], and the Post-Archean Australian shales [27].
Sources and Fate of REE in Soils
Sources
REE are found in more than 270 minerals—either primary orsecondary—in a wide range of concentrations [16, 28].Despite this, 95 % of all mineral resources containing REEin the world are concentrated in only three minerals:bastnasite, monazite, and xenotime [29].
The REE mineral content is directly proportional to itsvalence and ionic radius, with LREE occupying sites withthe largest coordination numbers, while HREE occupy thesmallest coordination numbers [30]. When a mineral hasREE, it can normally contain all REE, but in different propor-tions and with a predominance of Ce and La [29, 31].
As many metals, the REE have affinity for oxygen and aretherefore found many times in phosphatic minerals, as well asin carbonates, fluorides, and silicates [8, 32–34]. Phosphaticminerals can contain high REE concentrations, which are di-rectly related to the mineral genesis [8, 35, 36]. However,there is a difference between LREE and HREE as regard totheir enrichment in phosphatic minerals, with a predominanceof a negative anomaly of Ce [37, 38]. Of the phosphatic min-erals, monazite contains the highest concentration of REE,with LREE being preferentially incorporated in its structure;while in xenotime, the HREE are preferentially accommodat-ed in its structure [39].
The availability of REE in the environment under naturalconditions depends on the parent material, as well as on geo-chemical and biological processes [40–42]. It is known thatmineral weathering is an important source of elements to thesoils [43]. However, even after weathering of primary min-erals, REE can still, partially or totally, be again incorporatedin secondary minerals, remaining immobilized [44].
The fast increase in the exploration of mineral resourcesthat contain REE, along with their constant application inthe modern industry and everyday life, can contribute to an
Fig. 1 Graphical illustration ofthe sources of rare earth elements(REE) to soils (picture on the leftshows the mineral apatite), whereREE may undergo a series ofreactions in the soil profile priorto entering the mainenvironmental compartments
Fig. 2 Concentration (mg kg−1) of rare earth elements in the uppercontinental crust and chondrite normalization of REE in UCC. Asterisk:data from [23]
30 Curr Pollution Rep (2016) 2:28–50

increase of these elements in ecosystems [45]. The main areaswith an increase of REE in the soil are restricted to regionswhere the agriculture is intense, to zones next to polluted sites(large cities), and/or where the parent material presents highcontents of REE [46]. Industrial activities have been relatedwith an increase of REE in soils, mainly in locations next toindustrial centers [47, 48].
In agricultural areas, the main REE entrance is caused byapplication of phosphate fertilizers. This occurs because phos-phatic rocks can present elevated concentrations of REE intheir composition. Apatite is the main mineral explored forproduction of phosphate fertilizers, and the occurrence ofREE in apatites from sedimentary and biological origin wasfirst reported in 1878 [1]. The general formula for apatite isCa10(PO4)6X2, in which X can be fluoride, chlorine, or hy-droxyl. Calcium can be substituted mainly by Na, Sr, Mn, andREE. The most common substitution is P by Si, along with asubstitution of Ca by ions of trivalent REE [30].
Indirect application of REE to agricultural soils is a wide-spread practice, due to the use of phosphate fertilizers.However, in China, REE are deliberately applied to soils dueto the enrichment of fertilizers with such elements. Since the1980s, these fertilizers have been commonly applied in agricul-ture to increase seed germination, root growth, chlorophyll con-tent, plant resistance, and agricultural productivity [20]. Theamount of REE used in Chinese agriculture has been increasingyear after year, reaching some thousands of tons per year. In thiscountry, there are basically three types of fertilizers containingREE: (1) Changle (nitrates), (2) Nongle (chloride and oxides),and (3) MAR (complex with amino acids) [10, 45].
Table 1 shows REE contents reported in the worldwideliterature for the main phosphate fertilizers and other productsof relevant use in agriculture. It is noteworthy that phosphateproducts can present a great variability in their REE concen-trations. Actually, due to the different sources (raw material)used for production of phosphate fertilizers, it is not uncom-mon to see that the same product may present different REEcontents; e.g., a simple superphosphate produced in Pakistanhas an average concentration of 40.2 mg Ce kg−1, differingfrom the same product produced in Brazil, which had1499 mg Ce kg−1. This huge variation in REE content ofphosphate products occurs not only due to differences in theraw material (elemental composition of the phosphate rock),but also due to variations in rock processing operations forobtaining the final product [53, 56].
A ballpark assessment of the importance of phosphate fer-tilizers as a source of REE for agricultural ecosystems couldbe used taking Brazil as an example: if we consider the appar-ent consumption of the main phosphate fertilizers in Brazil in20141 (~4.2 million tons of monoammonium phosphate
(MAP), 5.2 million tons of single superphosphate (SSP), and1.8 million tons of triple superphosphate (TSP)) and the con-centrations reported for cerium (mg kg−1) in Table 1 (449 forMAP, 1499 for SSP, and 1332 for TSP), it is estimated that theuse of these fertilizers added approximately 12,000 t of Ce toBrazilian soils, only in 2014. This is not too much beyond theamounts estimated for annual consumption of importantmicronutrients (e.g., boron, copper, manganese, and zinc) inBrazilian agriculture.
As it was seen, the fertilizers employed in agriculture areimportant diffuse sources of REE for soils, even unintention-ally, as it occurs in countries that are great consumers of phos-phate fertilizers, such as Brazil. This might be even morerelevant in the case of a deliberate enrichment of fertilizerswith REE, as it occurs in China.
Soil Behavior
It is well known that the bioavailability, toxicity, and deficien-cy of any element in the environment depend on the element’sown characteristics and the soil capacity to release it from themineral phase or colloidal fraction. The adsorption of La, Y,Pr, and Gd depends on pH and soil cationic exchange capacity(CEC), and the availability of La, Ce, Gd, and Y increaseswith a decrease in pH and redox potential [58, 59].
The adsorption of REE in soils is also influenced by claytype and content, especially the concentrations of aluminumsilicates and iron and manganese oxides, with these last oneshaving the greatest adsorption capacity [10]. Sorption of La inthe surface of oxides of manganese and titanium and also iniron oxy-hydroxides varies with pH and the type of adsorbent,occurring preferably as surface precipitation, in the case ofMnoxides, and in the form of monomeric or small-molecular-weight complexes, in the surface of Ti and Fe oxides, demon-strating that mineralogy is crucial in REE behavior in soils[60, 61].
There is also a difference concerning light and heavy REEbehavior in soil, with LREE being mainly associated to clayeysoils, whereas HREE are more associated to sandy soils [62].This occurs because HREE are more associated to refractoryminerals (e.g., zircon), which are more resistant to weathering,and therefore remain in the coarser fraction of the soil [63].
Regarding the bond to the soil organic matter, the REEbehave in a manner similar to other trace elements. Organicmatter has fundamental importance in adsorption of REE,since it is a provider of negative charges to weathered soils[64]. However, it was also observed that the soluble organicfraction is responsible for REE desorption in soil, with com-pounds such as EDTA being able to promote the desorption ofthese elements, which is proportional to the concentration ofacid in solution [65].
The stability of REE bonding with humic substances variesaccording to a molar ratio between the REE and dissolved
1 Personal communication from ANDA, The Brazilian Fertilizer IndustryAssociation.
Curr Pollution Rep (2016) 2:28–50 31

organic carbon, and in these conditions, REE concentrations insolution are inversely correlated with soil pH and directly cor-related with dissolved organic carbon concentrations [66, 67].
Soil Reference Concentrations
The knowledge of natural contents of an element in the soil(background concentration) is crucial for ecological and hu-man health risk assessments. Regarding REE, this aspect de-serves a special attention, because our understanding on thebiological role of these elements is still in its early stages [2]and little is known about their effects in ecosystem function,which is especially relevant in areas affected by anthropogenicactivities that alter natural concentrations of REE in soils.
Contents of REE naturally found in soils basically dependon the parent material, decreasing as follows: granite > basalt> sandstone [68]. Soils originated from igneous rocks, schists,and sandstone tend to contain more REE when compared tothose originated from other materials [41]. Increased REEcontents in areas affected by anthropogenic alterations areusually a result of the application of agricultural fertilizers[49, 52, 53, 56, 69, 70]. However, environmental factors suchas rain, snow, and wind transport can contribute to these con-tents, mainly in areas close to large industrial sites [47].
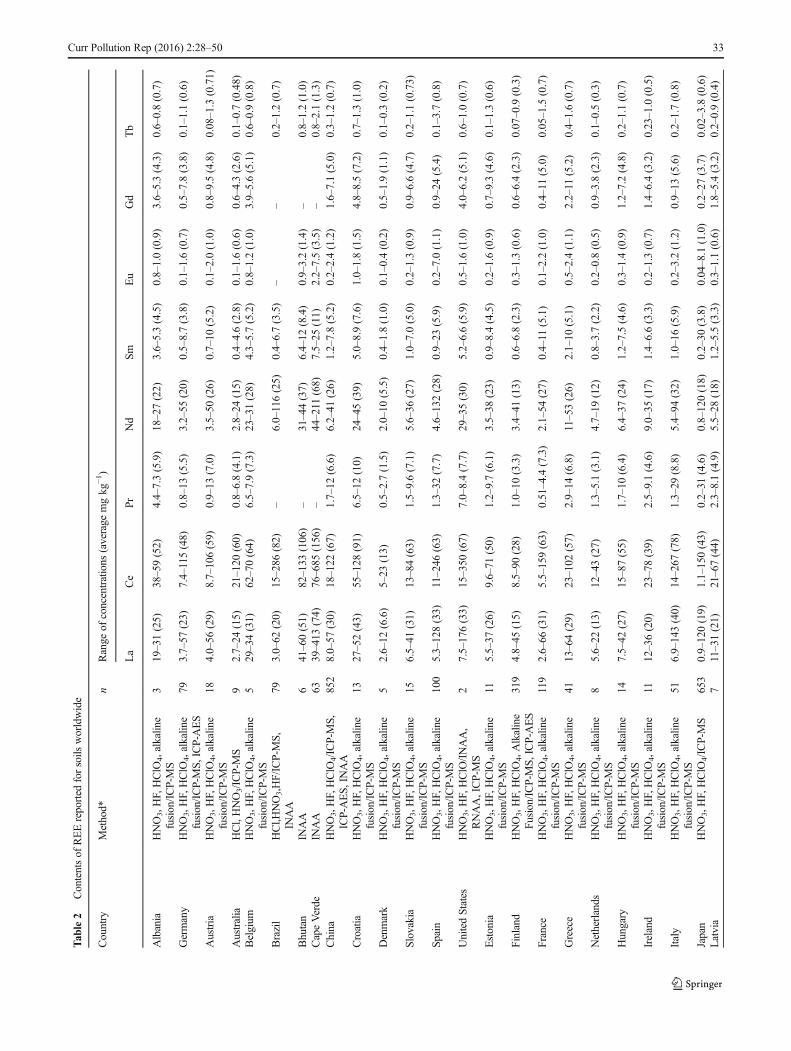
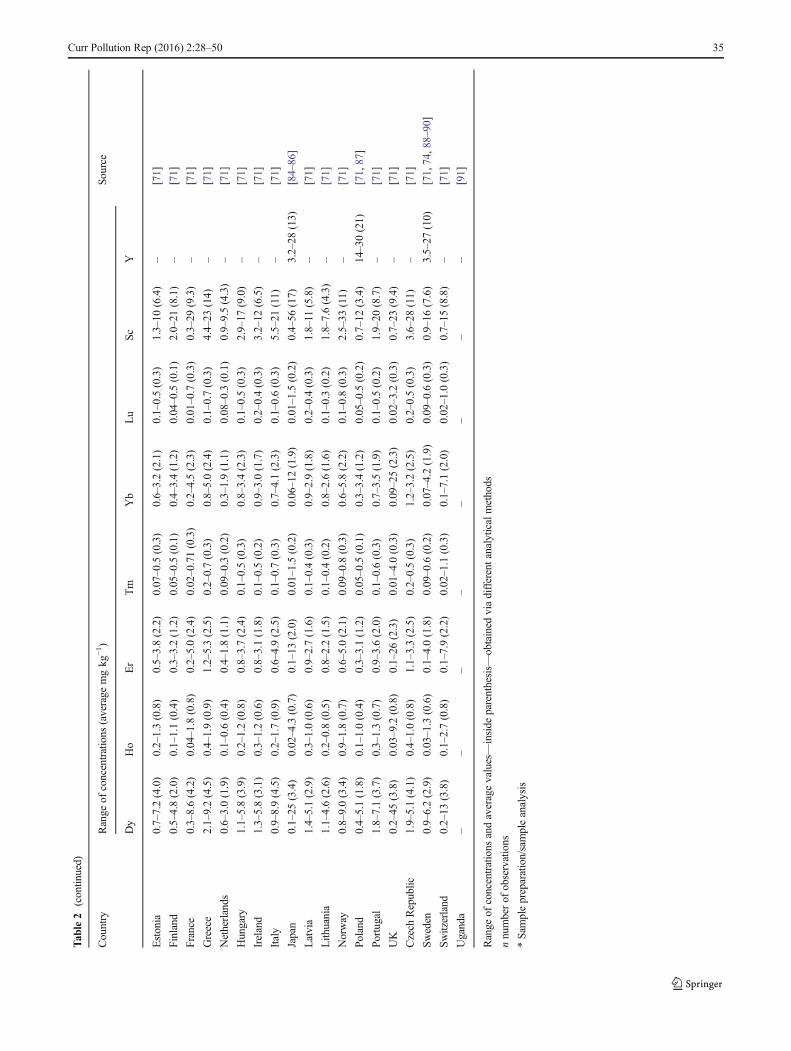
Information is still scarce in the literature about backgroundconcentrations of REE in soils, mainly when compared withdata available for many trace elements of environmental inter-est, such as Cd, Pb, Cr, and As. Table 2 presents referencevalues (natural or non-natural) for REE in soils found in sev-eral countries, as well as information regarding the methodused to quantify and qualify these elements, which can be an
additional reason for a large variability found in REE refer-ence values for soils worldwide.
Even though there are several techniques to quantify REE,the literature demonstrates that inductively coupled plasmamass spectrometry (ICP-MS) is the most used technique todetermine REE in soils (Table 2). ICP-MS has a superiordetection capability and presents elevated precision, currentlybeing the most adequate technique for quantification of REEin soil extracts, either those obtained directly following an acidextraction or via a previous alkaline fusion of the materials tobe analyzed [92–94].
Data from Table 2 revealed that La and Ce are the mostabundant REE found in soils, with average concentrations ashigh as 123 and 273 mg kg−1, respectively, found in soils fromUganda. These results agreed with previous reports that Ce,followed by La, is the most abundant REE in earth’s crust[41]. For the sum of LREE, the highest values were found insamples from Cape Verde, followed by Bhutan. In these coun-tries, REE contents in soils were assessed with instrumentalneutron activation analysis (INAA), which could have contrib-uted to the higher averages. The literature reports that INAA canoverestimate REE values in geological samples and therefore isnot the most indicated technique for REE determination, mainlyfor LREE [95], although INAA is used for REE determinationin soil and rock samples [96]. However, these results can also beconnected to the material that originated these soils.
Table 2 reveals also that samples from soils analyzed inseveral European countries presented very similar averagevalues for all REE, with Denmark being an exception. Theaverage value of the sum of REE contents (ΣREE) was higherfor Croatia (216 mg kg−1) and smaller for Denmark
Table 1 Worldwide contents of selected REE reported for major phosphate fertilizers and other particular agricultural inputs
Product La Ce Nd Sm Eu Tb Sc Country Sourcemg kg−1
Single superphosphate (SSP) 18.4 40.2 – 2.0 0.4 0.3 – Pakistan [49]NPK (08:23:18) 90 129 – 12 3.0 1.5 –
Limestone 19.5 10.4 – 1.6 0.2 – 0.2 Egypt [50]Superphosphate 18 8.5 – 0.3 – 3.9
Superphosphate 17 35 23.5 – – – – Bulgaria [51]
NPK (12:12:17) 500 600 181 33.2 9.9 3 – Spain [52]
NPK (4:14:08) 534 1181 571 77 17.1 4.5 15.2 Brazil [53]SSP 674 1499 770 122 32.5 6.5 24.6
Thermophosphate 755 1575 748 105 24.5 8.3 23.9
Phosphoric acid 18.7 16.5 14.2 0.9 0.8 2.5 9.3 USA [54]
Phosphate rock 2319 5468 1720 245 67 12 – Brazil [55]Phosphogypsum 1484 3015 970 150 37 6 –
Monoammonium phosphate (MAP) 177 449 234 43 13.6 8.7 – Brazil [56]Triple superphosphate (TSP) 727 1332 556 89 29 13.7 –
Apatite concentrate 1514 4204 1738 293 24.5 28.9 – Iran [14]
Fertilizer enriched with REE 15,400 24,100 1100 2000 200 25.8 – China [57]
32 Curr Pollution Rep (2016) 2:28–50
Tab
le2
Contentsof
REEreported
forsoils
worldwide
Country
Method*
nRange
ofconcentrations
(average
mgkg
−1)
La
Ce
Pr
Nd
Sm
Eu
Gd
Tb
Albania
HNO3,H
F,HClO
4,alkaline
fusion/ICP-MS
319–31(25)
38–59(52)
4.4–7.3(5.9)
18–27(22)
3.6–5.3(4.5)
0.8–1.0(0.9)
3.6–5.3(4.3)
0.6–0.8(0.7)
Germany
HNO3,H
F,HClO
4,alkaline
fusion/ICP-MS,ICP-AES
793.7–57
(23)
7.4–115(48)
0.8–13
(5.5)
3.2–55
(20)
0.5–8.7(3.8)
0.1–1.6(0.7)
0.5–7.8(3.8)
0.1–1.1(0.6)
Austria
HNO3,H
F,HClO
4,alkaline
fusion/ICP-MS
184.0–56
(29)
8.7–106(59)
0.9–13
(7.0)
3.5–50
(26)
0.7–10
(5.2)
0.1–2.0(1.0)
0.8–9.5(4.8)
0.08–1.3(0.71)
Australia
HCl,HNO3/ICP-MS
92.7–24
(15)
21–120
(60)
0.8–6.8(4.1)
2.8–24
(15)
0.4–4.6(2.8)
0.1–1.6(0.6)
0.6–4.3(2.6)
0.1–0.7(0.48)
Belgium
HNO3,H
F,HClO
4,alkaline
fusion/ICP-MS
529–34(31)
62–70(64)
6.5–7.9(7.3)
23–31(28)
4.3–5.7(5.2)
0.8–1.2(1.0)
3.9–5.6(5.1)
0.6–0.9(0.8)
Brazil
HCl,H
NO3,HF/ICP-M
S,
INAA
793.0–62
(20)
15–286
(82)
–6.0–116(25)
0.4–6.7(3.5)
––
0.2–1.2(0.7)
Bhutan
INAA
641–60(51)
82–133
(106)
–31–44(37)
6.4–12
(8.4)
0.9–3.2(1.4)
–0.8–1.2(1.0)
CapeVerde
INAA
6339–413
(74)
76–685
(156)
–44–211
(68)
7.5–25
(11)
2.2–7.5(3.5)
–0.8–2.1(1.3)
China
HNO3,H
F,HClO
4/ICP-M
S,ICP-AES,INAA
852
8.0–57
(30)
18–122
(67)
1.7–12
(6.6)
6.2–41
(26)
1.2–7.8(5.2)
0.2–2.4(1.2)
1.6–7.1(5.0)
0.3–1.2(0.7)
Croatia
HNO3,H
F,HClO
4,alkaline
fusion/ICP-MS
1327–52(43)
55–128
(91)
6.5–12
(10)
24–45(39)
5.0–8.9(7.6)
1.0–1.8(1.5)
4.8–8.5(7.2)
0.7–1.3(1.0)
Denmark
HNO3,H
F,HClO
4,alkaline
fusion/ICP-MS
52.6–12
(6.6)
5–23
(13)
0.5–2.7(1.5)
2.0–10
(5.5)
0.4–1.8(1.0)
0.1–0.4(0.2)
0.5–1.9(1.1)
0.1–0.3(0.2)
Slovakia
HNO3,H
F,HClO
4,alkaline
fusion/ICP-MS
156.5–41
(31)
13–84(63)
1.5–9.6(7.1)
5.6–36
(27)
1.0–7.0(5.0)
0.2–1.3(0.9)
0.9–6.6(4.7)
0.2–1.1(0.73)
Spain
HNO3,H
F,HClO
4,alkaline
fusion/ICP-MS
100
5.3–128(33)
11–246
(63)
1.3–32
(7.7)
4.6–132(28)
0.9–23
(5.9)
0.2–7.0(1.1)
0.9–24
(5.4)
0.1–3.7(0.8)
UnitedStates
HNO3,H
F,HClO/INAA,
RNAA,ICP-M
S2
7.5–176(33)
15–350
(67)
7.0–8.4(7.7)
29–35(30)
5.2–6.6(5.9)
0.5–1.6(1.0)
4.0–6.2(5.1)
0.6–1.0(0.7)
Estonia
HNO3,H
F,HClO
4,alkaline
fusion/ICP-MS
115.5–37
(26)
9.6–71
(50)
1.2–9.7(6.1)
3.5–38
(23)
0.9–8.4(4.5)
0.2–1.6(0.9)
0.7–9.3(4.6)
0.1–1.3(0.6)
Finland
HNO3,H
F,HClO
4,A
lkaline
Fusion/ICP-M
S,ICP-A
ES
319
4.8–45
(15)
8.5–90
(28)
1.0–10
(3.3)
3.4–41
(13)
0.6–6.8(2.3)
0.3–1.3(0.6)
0.6–6.4(2.3)
0.07–0.9(0.3)
France
HNO3,H
F,HClO
4,alkaline
fusion/ICP-MS
119
2.6–66
(31)
5.5–159(63)
0.51–4.4(7.3)
2.1–54
(27)
0.4–11
(5.1)
0.1–2.2(1.0)
0.4–11
(5.0)
0.05–1.5(0.7)
Greece
HNO3,H
F,HClO
4,alkaline
fusion/ICP-MS
4113–64(29)
23–102
(57)
2.9–14
(6.8)
11–53(26)
2.1–10
(5.1)
0.5–2.4(1.1)
2.2–11
(5.2)
0.4–1.6(0.7)
Netherlands
HNO3,H
F,HClO
4,alkaline
fusion/ICP-MS
85.6–22
(13)
12–43(27)
1.3–5.1(3.1)
4.7–19
(12)
0.8–3.7(2.2)
0.2–0.8(0.5)
0.9–3.8(2.3)
0.1–0.5(0.3)
Hungary
HNO3,H
F,HClO
4,alkaline
fusion/ICP-MS
147.5–42
(27)
15–87(55)
1.7–10
(6.4)
6.4–37
(24)
1.2–7.5(4.6)
0.3–1.4(0.9)
1.2–7.2(4.8)
0.2–1.1(0.7)
Ireland
HNO3,H
F,HClO
4,alkaline
fusion/ICP-MS
1112–36(20)
23–78(39)
2.5–9.1(4.6)
9.0–35
(17)
1.4–6.6(3.3)
0.2–1.3(0.7)
1.4–6.4(3.2)
0.23–1.0(0.5)
Italy
HNO3,H
F,HClO
4,alkaline
fusion/ICP-MS
516.9–143(40)
14–267
(78)
1.3–29
(8.8)
5.4–94
(32)
1.0–16
(5.9)
0.2–3.2(1.2)
0.9–13
(5.6)
0.2–1.7(0.8)
Japan
HNO3,H
F,HClO
4/ICP-MS
653
0.9–120(19)
1.1–150(43)
0.2–31
(4.6)
0.8–120(18)
0.2–30
(3.8)
0.04–8.1(1.0)
0.2–27
(3.7)
0.02–3.8(0.6)
Latvia
711–31(21)
21–67(44)
2.3–8.1(4.9)
5.5–28
(18)
1.2–5.5(3.3)
0.3–1.1(0.6)
1.8–5.4(3.2)
0.2–0.9(0.4)
Curr Pollution Rep (2016) 2:28–50 33

Tab
le2
(contin
ued)
Country
Method*
nRange
ofconcentrations
(average
mgkg
−1)
La
Ce
Pr
Nd
Sm
Eu
Gd
Tb
HNO3,H
F,HClO
4,alkaline
fusion/ICP-MS
Lith
uania
HNO3,H
F,HClO
4,alkaline
fusion/ICP-MS
167.9–28
(18)
15–59(36)
1.7–7.0(4.1)
5.9–24
(15)
1.2–5.4(3.0)
0.2–0.9(0.5)
1.0–4.6(2.9)
0.2–0.7(0.4)
Norway
HNO3,H
F,HClO
4,alkaline
fusion/ICP-MS
582.9–101(21)
5.7–253(48)
0.7–23
(5.2)
2.8–80
(20)
0.5–13
(3.7)
0.1–4.3(0.9)
0.6–11
(3.7)
0.1–1.7(0.5)
Poland
HNO3,H
F,HClO
4,alkaline
fusion/ICP-MS,
XRF
642.7–35
(13)
5.5–72
(27)
0.7–8.0(3.0)
2.3–30
(12)
0.4–5.5(2.3)
0.1–1.0(0.3
0.4–5.6(1.9)
0.05–0.8(0.3)
Portugal
HNO3,H
F,HClO
4,alkaline
fusion/ICP-MS
1919–74(38)
38–151
(77)
4.7–18
(9.0)
16–63(32)
2.9–10
(5.8)
0.4–2.0(0.9)
2.8–9.3(5.2)
0.4–1.4(0.7)
UK
HNO3,H
F,HClO
4,alkaline
fusion/ICP-MS
601.1–103(23)
2.5–206(48)
0.3–30
(5.6)
1.1–112(21)
0.2–30
(4.0)3
0.7–1.7(0.8)
0.2–36
(4.1)
0.03–7.0(0.6)
Czech
Republic
HNO3,H
F,HClO
4,alkaline
fusion/ICP-MS
1015–35(26)
32–80(57)
3.3–8.6(6.3)
13–33(23)
2.2–6.0(4.6)
0.4–1.2(0.8)
2.1–5.6(4.4)
0.3–0.9(0.7)
Sweden
HNO3,H
F,HClO
4,alkaline
fusion/ICP-MS
851.4–34
(17)
2.1–83
(37)
0.4–14
(4.2)
1.0–53
(15)
0.2–6.0(3.0)
0.03–1.5(0.6)
0.2–6.4(3.0)
0.04–1.2(0.5)
Switzerland
HNO3,H
F,HClO
4,alkaline
fusion/ICP-MS
101.7–85
(27)
3.2–117(50)
0.4–16
(6.0)
1.5–65
(23)
0.3–13
(4.4)
0.1–2.9(0.9)
0.2–15
(4.5)
0.04–2.1(0.6)
Uganda
Alkalinefusion
977–134
(123)
216–291(273)
–51–98(88)
––
––
Country
Range
ofconcentrations
(average
mgkg
−1)
Source
Dy
Ho
Er
Tm
Yb
Lu
ScY
Albania
3.8–4.8(4.2)
0.7–0.9(0.8)
2.1–2.8(2.4)
0.3–0.4(0.4)
2–2.6(2.1)
0.2–0.4(0.3)
10–15(13)
–[71]
Germany
0.5–6.0(3.1)
0.1–1.2(0.6)
0.3–3.5(1.8)
0.1–0.2(0.13)
0.1–1.5(0.5)
0.1–0.6(0.4)
0.8–15
(6.1)
–[45,71–74]
Austria
0.6–7.4(3.9)
0.1–1.3(0.8)
0.3–3.7(2.2)
0.06–0.5(0.3)
0.3–3.3(2.1)
0.04–0.5(0.3)
1.3–21
(12)
–[71]
Australia
0.3–3.2(2.1)
0.1–0.4(0.3)
0.2–1.6(0.8)
0.1–0.2(0.13)
0.1–1.5(0.5)
0.1–0.2(0.1)
–0.6–12
(5.3)
[75]
Belgium
3.6–5.0(4.5)
0.7–1.2(0.9)
2.1–3.3(2.8)
0.3–0.5(0.4)
2.1–3.5(2.9)
0.3–0.6(0.4)
7.8–14
(10)
–[71]
Brazil
––
––
1.5–4.3(2.9)
–6.6–30
(18)
4.0–16
(7.8)
[47,76,77]
Bhutan
4.2–7.8(5.4)
––
–2.9–4.4(3.5)
0.4–0.6(0.5)
––
[62]
CapeVerde
4.5–13
(7.1)
––
––
0.1–0.9(0.3)
6.0–44
(25)
–[78]
China
2.0–6.3(3.9)
0.3–1.2(0.8)
0.8–3.1(2.2)
0.1–0.4(0.2)
0.6–2.7(2.1)
0.1–0.4(0.3)
11–13(12)
14–35(27)
[46,79–82]
Croatia
3.8–7.0(6.0)
0.8–1.4(1.2)
2.3–4.2(3.6)
0.3–0.6(0.5)
2.1–4.0(3.5)
0.3–0.6(0.5)
7.7–16
(13)
–[71]
Denmark
0.5–2.2(1.1)
0.1–0.4(0.2)
0.3–1.3(0.7)
0.05–0.2(0.1)
0.4–1.5(0.9)
0.05–0.2(0.1)
0.9–3.9(2.2)
–[71]
Slovakia
1.1–5.9(4.2)
0.2–1.2(0.9)
0.7–3.4(2.5)
0.1–0.5(0.3)
0.8–3.3(2.4)
0.1–0.5(0.4)
2.0–15
(10)
–[71]
Spain
0.7–23
(4.4)
0.1–4.8(0.9)
0.3–14
(2.5)
0.04–2.1(0.3)
0.4–13
(2.3)
0.03–2.0(0.3)
1.3–54
(10)
–[71]
UnitedStates
–0.9–1.5(1.2)
1.5–2.2(1.9)
0.3–0.6(0.4)
2.3–3.5(2.9)
0.3–0.5(0.4)
2.8–17
(9.9)
3.8–169(16)
[83]
34 Curr Pollution Rep (2016) 2:28–50
Tab
le2
(contin
ued)
Country
Range
ofconcentrations
(average
mgkg
−1)
Source
Dy
Ho
Er
Tm
Yb
Lu
ScY
Estonia
0.7–7.2(4.0)
0.2–1.3(0.8)
0.5–3.8(2.2)
0.07–0.5(0.3)
0.6–3.2(2.1)
0.1–0.5(0.3)
1.3–10
(6.4)
–[71]
Finland
0.5–4.8(2.0)
0.1–1.1(0.4)
0.3–3.2(1.2)
0.05–0.5(0.1)
0.4–3.4(1.2)
0.04–0.5(0.1)
2.0–21
(8.1)
–[71]
France
0.3–8.6(4.2)
0.04–1.8
(0.8)
0.2–5.0(2.4)
0.02–0.71(0.3)
0.2–4.5(2.3)
0.01–0.7(0.3)
0.3–29
(9.3)
–[71]
Greece
2.1–9.2(4.5)
0.4–1.9(0.9)
1.2–5.3(2.5)
0.2–0.7(0.3)
0.8–5.0(2.4)
0.1–0.7(0.3)
4.4–23
(14)
–[71]
Netherlands
0.6–3.0(1.9)
0.1–0.6(0.4)
0.4–1.8(1.1)
0.09–0.3(0.2)
0.3–1.9(1.1)
0.08–0.3(0.1)
0.9–9.5(4.3)
–[71]
Hungary
1.1–5.8(3.9)
0.2–1.2(0.8)
0.8–3.7(2.4)
0.1–0.5(0.3)
0.8–3.4(2.3)
0.1–0.5(0.3)
2.9–17
(9.0)
–[71]
Ireland
1.3–5.8(3.1)
0.3–1.2(0.6)
0.8–3.1(1.8)
0.1–0.5(0.2)
0.9–3.0(1.7)
0.2–0.4(0.3)
3.2–12
(6.5)
–[71]
Italy
0.9–8.9(4.5)
0.2–1.7(0.9)
0.6–4.9(2.5)
0.1–0.7(0.3)
0.7–4.1(2.3)
0.1–0.6(0.3)
5.5–21
(11)
–[71]
Japan
0.1–25
(3.4)
0.02–4.3
(0.7)
0.1–13
(2.0)
0.01–1.5(0.2)
0.06–12(1.9)
0.01–1.5(0.2)
0.4–56
(17)
3.2–28
(13)
[84–86]
Latvia
1.4–5.1(2.9)
0.3–1.0(0.6)
0.9–2.7(1.6)
0.1–0.4(0.3)
0.9–2.9(1.8)
0.2–0.4(0.3)
1.8–11
(5.8)
–[71]
Lith
uania
1.1–4.6(2.6)
0.2–0.8(0.5)
0.8–2.2(1.5)
0.1–0.4(0.2)
0.8–2.6(1.6)
0.1–0.3(0.2)
1.8–7.6(4.3)
–[71]
Norway
0.8–9.0(3.4)
0.9–1.8(0.7)
0.6–5.0(2.1)
0.09–0.8(0.3)
0.6–5.8(2.2)
0.1–0.8(0.3)
2.5–33
(11)
–[71]
Poland
0.4–5.1(1.8)
0.1–1.0(0.4)
0.3–3.1(1.2)
0.05–0.5(0.1)
0.3–3.4(1.2)
0.05–0.5(0.2)
0.7–12
(3.4)
14–30(21)
[71,87]
Portugal
1.8–7.1(3.7)
0.3–1.3(0.7)
0.9–3.6(2.0)
0.1–0.6(0.3)
0.7–3.5(1.9)
0.1–0.5(0.2)
1.9–20
(8.7)
–[71]
UK
0.2–45
(3.8)
0.03–9.2
(0.8)
0.1–26
(2.3)
0.01–4.0(0.3)
0.09–25(2.3)
0.02–3.2(0.3)
0.7–23
(9.4)
–[71]
Czech
Republic
1.9–5.1(4.1)
0.4–1.0(0.8)
1.1–3.3(2.5)
0.2–0.5(0.3)
1.2–3.2(2.5)
0.2–0.5(0.3)
3.6–28
(11)
–[71]
Sweden
0.9–6.2(2.9)
0.03–1.3
(0.6)
0.1–4.0(1.8)
0.09–0.6(0.2)
0.07–4.2(1.9)
0.09–0.6(0.3)
0.9–16
(7.6)
3.5–27
(10)
[71,74,88–90]
Switzerland
0.2–13
(3.8)
0.1–2.7(0.8)
0.1–7.9(2.2)
0.02–1.1(0.3)
0.1–7.1(2.0)
0.02–1.0(0.3)
0.7–15
(8.8)
–[71]
Uganda
––
––
––
––
[91]
Range
ofconcentrations
andaveragevalues—inside
parenthesis—
obtained
viadifferentanalyticalmethods
nnumberof
observations
*Sam
plepreparation/sampleanalysis
Curr Pollution Rep (2016) 2:28–50 35
(32 mg kg−1). Since phosphate fertilizers are one of the maindiffuse sources of REE to soils [46, 97, 98], we could expecthigher average ΣREE for soils of France, Spain, and the UK,which are historically the major consumers of phosphate fer-tilizers in Europe (P2O5 consumption taken from IFA database– www.fertilizer.org/statistics). However, this was notobserved. Data from Table 2 suggests that the sources andthe behavior of REE in European soils tend to be very similar.
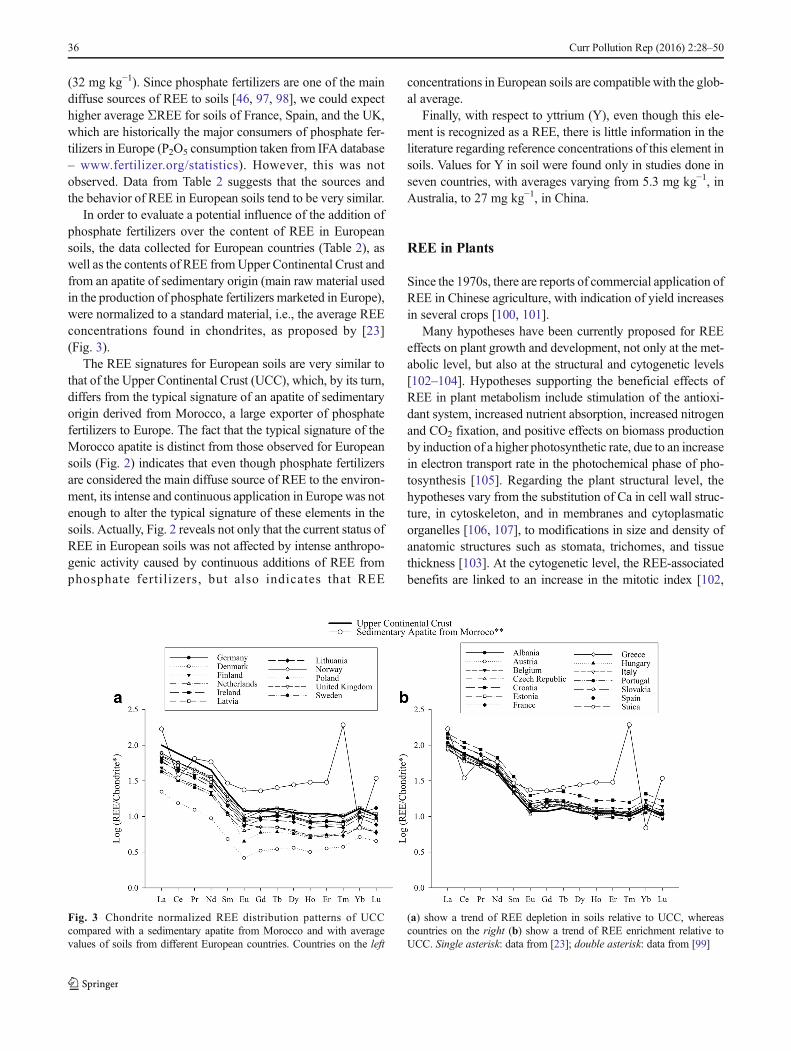
In order to evaluate a potential influence of the addition ofphosphate fertilizers over the content of REE in Europeansoils, the data collected for European countries (Table 2), aswell as the contents of REE fromUpper Continental Crust andfrom an apatite of sedimentary origin (main raw material usedin the production of phosphate fertilizers marketed in Europe),were normalized to a standard material, i.e., the average REEconcentrations found in chondrites, as proposed by [23](Fig. 3).
The REE signatures for European soils are very similar tothat of the Upper Continental Crust (UCC), which, by its turn,differs from the typical signature of an apatite of sedimentaryorigin derived from Morocco, a large exporter of phosphatefertilizers to Europe. The fact that the typical signature of theMorocco apatite is distinct from those observed for Europeansoils (Fig. 2) indicates that even though phosphate fertilizersare considered the main diffuse source of REE to the environ-ment, its intense and continuous application in Europe was notenough to alter the typical signature of these elements in thesoils. Actually, Fig. 2 reveals not only that the current status ofREE in European soils was not affected by intense anthropo-genic activity caused by continuous additions of REE fromphosphate fertilizers, but also indicates that REE
concentrations in European soils are compatible with the glob-al average.
Finally, with respect to yttrium (Y), even though this ele-ment is recognized as a REE, there is little information in theliterature regarding reference concentrations of this element insoils. Values for Y in soil were found only in studies done inseven countries, with averages varying from 5.3 mg kg−1, inAustralia, to 27 mg kg−1, in China.
REE in Plants
Since the 1970s, there are reports of commercial application ofREE in Chinese agriculture, with indication of yield increasesin several crops [100, 101].
Many hypotheses have been currently proposed for REEeffects on plant growth and development, not only at the met-abolic level, but also at the structural and cytogenetic levels[102–104]. Hypotheses supporting the beneficial effects ofREE in plant metabolism include stimulation of the antioxi-dant system, increased nutrient absorption, increased nitrogenand CO2 fixation, and positive effects on biomass productionby induction of a higher photosynthetic rate, due to an increasein electron transport rate in the photochemical phase of pho-tosynthesis [105]. Regarding the plant structural level, thehypotheses vary from the substitution of Ca in cell wall struc-ture, in cytoskeleton, and in membranes and cytoplasmaticorganelles [106, 107], to modifications in size and density ofanatomic structures such as stomata, trichomes, and tissuethickness [103]. At the cytogenetic level, the REE-associatedbenefits are linked to an increase in the mitotic index [102,
Fig. 3 Chondrite normalized REE distribution patterns of UCCcompared with a sedimentary apatite from Morocco and with averagevalues of soils from different European countries. Countries on the left
(a) show a trend of REE depletion in soils relative to UCC, whereascountries on the right (b) show a trend of REE enrichment relative toUCC. Single asterisk: data from [23]; double asterisk: data from [99]
36 Curr Pollution Rep (2016) 2:28–50
104], as well as to the development of abnormalities in the cellcycle that benefit the production of biomass, such as the ap-pearance of binucleated cells [102]. Some REE action mech-anisms in plants, as well as effects found in recent studies, arereported in the following topics, with data compiled inTable 3.
REE Uptake, Distribution, and Contents in Plants
REE concentrations in plants vary according to the contents ofthese elements in the environment and among different plantspecies [121]. Due to their higher mobility in soils, LREE aremore easily absorbed by plants, thus occurring at greater con-tents than HREE in plant tissues. In fact, citrus plants haverecently being described as REE bioaccumulators, accumulat-ing especially LREE [144]. In addition, since HREE formmuch more stable complexes in soil solution, preferential ab-sorption of LREE is favored [145].
Other factors affecting REE uptake in soil solution are thelevels of nitrogen, potassium, and phosphate fertilization.REE absorption is facilitated following an increase in the ratesof nitrogen and potassium fertilization, while phosphate fertil-ization renders the absorption of these elements more difficult[146].
Plants have a range of features that affect REE redistribu-tion, especially those related to the presence of apoplasticbarriers. Initially, the apoplastic barriers situated in the rootsare the first obstacles for these elements to reach the xylem,thus impairing their translocation to remaining plant organs.Due to this fact, the contents of REE found in different plantorgans follow the sequence: roots > stems > leaves > flowers >fruit > seeds [140, 145].
REE absorption occurs also thru foliar applications. Underthese circumstances, the apoplastic barriers continue to workas obstacles to the translocation of these elements to differentplant parts. However, in this case, the distribution of theseelements follows the order: leaves > stems > roots > flowers> fruit > seeds [145].
Within the saps of the xylem or phloem, where REE aretranslocated/remobilized, the redistribution is generally regu-lated by mechanisms that control the nutrient flow, i.e., thetranspiratory rate, in the case of the xylem, and the source-drain system (osmosis control), in the case of the phloem.Inside the vascular tissues, the REE can bind reversibly toanions such as COOH−, with the degree of bonding varyingaccording to the atomic number of the element of interest [97],which may also influence the accumulation of these elements[97, 147]. Inside the plants, most REE are bonded to cell walls[106, 148]. However, some REE can cross the cell membrane,accumulating in organelles as crystals such as BREE oxalates^[102, 107] or even in root cortical tissues, which also avoidstranslocation to plant shoots.
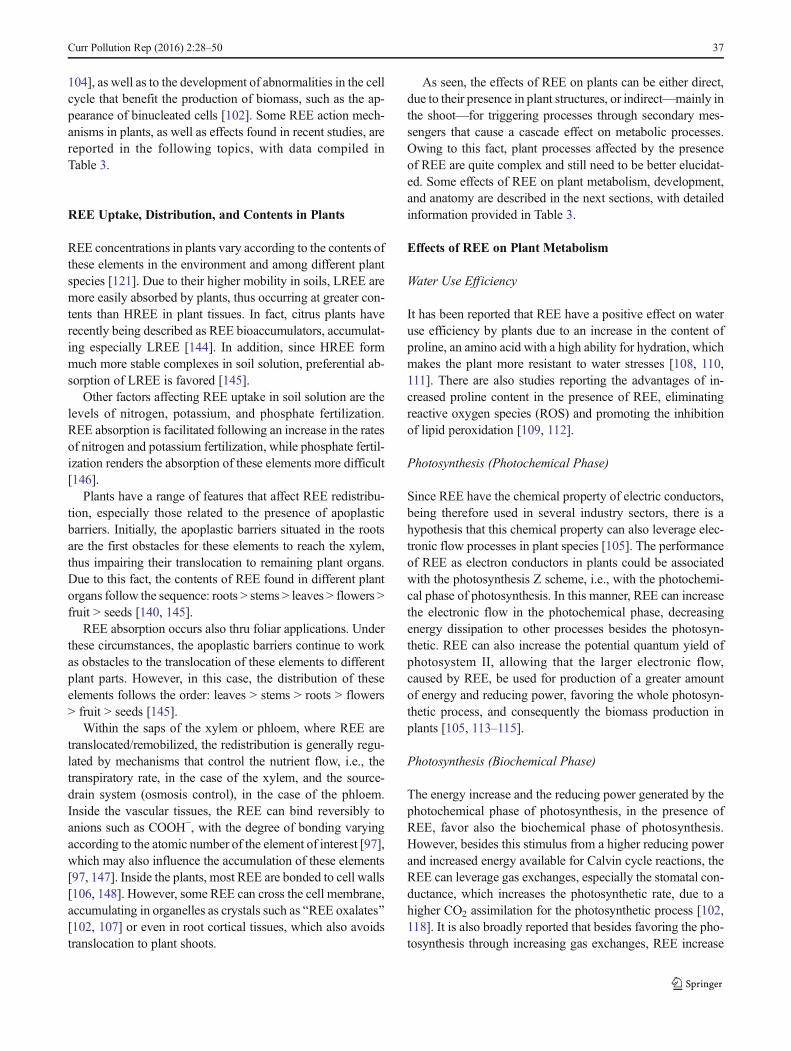
As seen, the effects of REE on plants can be either direct,due to their presence in plant structures, or indirect—mainly inthe shoot—for triggering processes through secondary mes-sengers that cause a cascade effect on metabolic processes.Owing to this fact, plant processes affected by the presenceof REE are quite complex and still need to be better elucidat-ed. Some effects of REE on plant metabolism, development,and anatomy are described in the next sections, with detailedinformation provided in Table 3.
Effects of REE on Plant Metabolism
Water Use Efficiency
It has been reported that REE have a positive effect on wateruse efficiency by plants due to an increase in the content ofproline, an amino acid with a high ability for hydration, whichmakes the plant more resistant to water stresses [108, 110,111]. There are also studies reporting the advantages of in-creased proline content in the presence of REE, eliminatingreactive oxygen species (ROS) and promoting the inhibitionof lipid peroxidation [109, 112].
Photosynthesis (Photochemical Phase)
Since REE have the chemical property of electric conductors,being therefore used in several industry sectors, there is ahypothesis that this chemical property can also leverage elec-tronic flow processes in plant species [105]. The performanceof REE as electron conductors in plants could be associatedwith the photosynthesis Z scheme, i.e., with the photochemi-cal phase of photosynthesis. In this manner, REE can increasethe electronic flow in the photochemical phase, decreasingenergy dissipation to other processes besides the photosyn-thetic. REE can also increase the potential quantum yield ofphotosystem II, allowing that the larger electronic flow,caused by REE, be used for production of a greater amountof energy and reducing power, favoring the whole photosyn-thetic process, and consequently the biomass production inplants [105, 113–115].
Photosynthesis (Biochemical Phase)
The energy increase and the reducing power generated by thephotochemical phase of photosynthesis, in the presence ofREE, favor also the biochemical phase of photosynthesis.However, besides this stimulus from a higher reducing powerand increased energy available for Calvin cycle reactions, theREE can leverage gas exchanges, especially the stomatal con-ductance, which increases the photosynthetic rate, due to ahigher CO2 assimilation for the photosynthetic process [102,118]. It is also broadly reported that besides favoring the pho-tosynthesis through increasing gas exchanges, REE increase
Curr Pollution Rep (2016) 2:28–50 37
Tab
le3
REE’seffectsin
plantp
hysiology
Element
Concentratio
nMedia
Species
Effect
Source
Water
useefficiency
Ce
89.26–446.03
μM
Soil-vessel
Vignaunguiculata
Increase
theprolinecontent.
[108]
10,30,50,and
100μM
Nutrientsolution
Hydrilla
verticillata
Nochange
inthecontento
fprolineup
to10
μM
ofCe;
startin
gat30
μM:p
rogressive
increase
ofproline
content.
[109]
La
10μM
Nutrientsolution
Hypericum
perforatum
Increase
theprolinecontent.
[110]
40,80,120,and160μM
Nutrientsolution
Hydrocharisdubia
Inductionof
prolineaccumulation,accordingwith
the
increase
ofLacontent;thehighestlevelof
prolinewas
observed
at160μM,w
hich
was
increasedby
293%,
comparedto
theabsenceof
La.
[111]
10,30,50,and
100μM
Nutrientsolution
Hydrilla
verticillata
Nochange
theprolinecontentupto10
μM
ofLa;startin
gat30
μM:p
rogressive
increase
inthecontento
fprolineaccordingwith
theLaapplied.
[109]
30,150,300,600,and
900mgkg
−1Soil-vessel
Oryza
sativa
Increase
theprolinecontent.
[112]
Y10
−5,10−
4 ,and10
−3mol
L−1
Nutrientsolution
Zeamays
Decreased
ofthefree
prolineconcentrationin
rootsand
shoots,m
orepronounced
inleaves;d
ecreaseof
water
content(startin
gat10
−3mol
L−1)andthewater
use
efficiency
(startingat10
−4mol
L−1),respectiv
ely.
[103]
Photosynthesis
Photochemistryphase
Ce
10μM
Foliarapplication
Oryza
sativa
Increase
inthequantum
yield(Fv/Fm
)of
the
photochemicalstage.
[113]
n.d.*
Isolated
chloroplasts
Spinacia
oleraceae
Increase
theyieldof
chlorophyllfluorescenceand
electron
transportrate.
[105]
20μM
Nutrientsolution
Zeamays
Under
magnesium
deficiency
conditions:preventedthe
inhibitio
nof
thesynthesisof
photosyntheticpigm
ents
(chlorophyllandcarotenoids),improved
light
absorptio
nandtransformationof
energy,evolutio
nof
oxygen,and
photophosphorylationactivity
andits
couplin
gfactor
Ca2
+-ATPase.
[114]
Y10
−5,10−
4 ,and10
−3mol
L−1
Nutrientsolution
Zeamays
Decreasethegasexchange
(photosynthetic
rate,
transpirationrate,and
stom
atalconductance)
andthe
contentofphotosyntheticpigm
ents(chlorophyllaand
bandcarotenoids),adversely
affectingthe
photosyntheticprocess.
[103]
Light
REE
n.d.*
Miningsoil(isolatedchloroplasts)
Dicranopterisdichotom
aIncrease
theefficiency
ofPS
IIandelectron
transportrate.
Increase
theefficiency
ofPS
IIandelectron
transportrate.
[115]
mgkg
−1
La—
55.27
Ce—
160.53
Pr—12.26
Nd—
47.56
Sm—10.13
Eu—
2.43
Gd—
11.67
Miningsoil(isolatedchloroplasts)
Dicranopterisdichotom
a[116]
Biochem
istryphase
Ce
0.5μmol
L−1
Tissuecultu
reArabidopsisthaliana
Increase
thechlorophyllcontent.
[117]
La
81.6
μM
Nutrientsolution
Oryza
sativa
Increase
thephotosyntheticrateandstom
atal
conductance.
[118]
38 Curr Pollution Rep (2016) 2:28–50
Tab
le3
(contin
ued)
Element
Concentratio
nMedia
Species
Effect
Source
5and10
μM
Nutrientsolution
Glycine
max
Stim
ulationthephotosyntheticrateandthetotal
chlorophyllcontent.
[102]
Y10
−5,10−
4 ,and10
−3mol
L−1
Nutrientsolution
Zeamays
Decreasethestom
atasize
andincrease
thestom
atal
density
onbothsidesof
adaxialand
abaxialepiderm
is.
[103]
Physiologicalroleof
calcium
inplants
Tb
4,20,40,120,200,and400μM
Foliarapplication
Arm
oracia
rusticana
Increase
productio
nof
H2O
2thatcauses
astim
ulus
tothe
increase
influx
ofextracellularCa2
+andCa2
+release
structure;causingtheoverload
ofCa2
+andinhibitio
nof
biochemicalprocessescontrolledby
thiselem
entas
asecond
messenger.
[119]
La
5,10,20,40,80,and160μM
Nutrientsolution
Glycine
max
Disruptionthecellwallsby
Careplacem
entb
yLa,
accordingwith
theincrease
theLacontent.
[102]
1.0mmol
L−1
Tissuecultu
reOryza
sativa
Appearanceof
irregularitiesin
thecellwallstructuredue
tothereplacem
ento
fCaby
La.
[106]
Gd
100,200,300,400,and
500μmol
L−1
Isolationof
mito
chondria(nutrient
solution)
Oryza
sativa
Inhibitio
nof
Cachannels.
[120]
Mineralnutrition
Ce
n.d.*
Soil-vessel
Arm
oracia
rusticana
Cepenetrates
bytheapoplastandsymplastw
ay.
[121]
La
5,10,20,40,80,and160μM
Nutrientsolution
Glycine
max
Increase
thecontentofC
a,P,K,and
Mn,whileCuandFe
levelsdecreased.
[102]
0.08,0.24,and1.20
mmol
L−1
Nutrientsolution
Glycine
max
Increase
theionuptake.
[122]
0.05
to1.5mgL−1
Soil-vessel
Oryza
sativa
Highergrow
thandnutrient
absorption.
[123]
Eu
0.01
mgL−1
Soil-vessel
Triticumaestivum
Improveuptake
anddistributio
nof
nutrients.
[124]
Y1,2,4,and5mgL−1
Nutrientsolution
Nym
phoidespelta
taNutritio
nalimbalance.
[125]
CeandLa
0.2,1.0,and5.0mM
Laor
Ce
Nutrientsolution
ZeamaysandVignaunguiculata
Negativelyaffectsmineralnutrition.
[126]
AllETR
mgg−
1
La—
12.46
Ce—
26.96
Pr—5.20
Nd—
—7.80
mgkg
−1
Sm—544.41
Eu—
83.04
Gd—
91.92
Tb—
40.85
Dy—
8.92
Ho—
3.90
Tm—8.76
Yb—
7.79
Lu—
3.28
Y—140.05
Miningsoil
ZeamaysandSorghumbicolor
Increase
thegrow
thandnutrient
absorptio
n.[127]
AllETR
μgg−
1
La—
35.7
Ce—
79.2
Pr—8.92
Nd—
34.7
Sm—6.85
Eu—
1.39
Gd—
5.73
Tb—
0.876
Soil
Helianthusannuus
Increase
absorptionof
otherelem
entswith
noknow
nbiologicalfunction,such
asCd.
[128]
Curr Pollution Rep (2016) 2:28–50 39

Tab
le3
(contin
ued)
Element
Concentratio
nMedia
Species
Effect
Source
Dy—
5.12
Ho—
1.01
Er—
2.859
Tm—0.409
Yb—
2.70
Lu—
0.409
Enzym
es
Ce
100μM
Tissuecultu
reTetrastig
mahemsleyanum
Increase
theflavonoidproductionby
higher
enzyme
activ
ity.
[129]
10μM
Nutrientsolution
Oryza
sativa
Amelioratin
gtheCdtoxicity
byincreasing
activ
ityof
enzymes
oftheantio
xidant
system
anddecrease
the
oxidativestress.
[113]
La
<120μmol
L−1
Nutrientsolution
Viciafaba
Increase
theactiv
ityof
superoxide
dism
utase,catalase,
guaiacolperoxidase
andascorbateperoxidase,and
the
heatshockprotein70
(HSP
70).
[130]
40,80,120,and160μM
Nutrientsolution
Hydrocharisdubia
Inductionof
antio
xidant
system
.[111]
0.08,0.24,and1.20
mmol
L−1
Nutrientsolution
Glycine
max
Mitigatio
nof
thedeleteriouseffectsof
UV-B
radiation,
thegreateractiv
ationof
antioxidant
system
.[122]
Tb
20,80,320,and1280
μM
Soil-vessel
Arm
oracia
rusticana
Increase
theperoxidase
activ
ityandcontento
flig
nin.
[119,131]
LaandCe
100mgL−1
Foliarapplication
Brassicachinensis
Increase
thesolublesugarcontentandvitaminCform
ost
enzymaticactio
n.[132]
Plantd
evelopment
Germination
Ce
5,10,15,20,and
25mgL−1
Soil
Zeamays
Prom
otes
improvem
entsin
seed
quality.
[133]
Eu
0.01
mgL−1
Soil-vessel
Triticumaestivum
Increase
thegerm
ination.
[124]
Growth
Ce
100μM
Tissuecultu
reTetrastig
mahemsleyanum
Increase
thebiom
assgrow
th.
[129]
5,10,15,20,and
25mgL−1
Soil
Zeamays
Increase
thecrop
yield.
[133]
La
0.05
to1.5mgL−1
Soil-vessel
Oryza
sativa
Increase
thegrow
th.
[123]
Eu
0.01
mgL−1
Soil-vessel
Triticumaestivum
Increase
thegrow
thof
rootsandleaves
with
better
architectureandstructure.
[124]
LaandCe
100mgL−1
Foliarapplication
Brassicachinensis
Prom
otionof
shootshigher,growthof
mostfresh
anddry
weighto
fleaves
andstem
s,andthehigherproportio
nofdryweight/w
etweight.(M
oreon
Cetreatm
entsthan
La).
[132]
EuandCe
10and50
mgL−1,ofEuandCe,
respectiv
ely
Soil
Triticumaestivum
andSecale
cereale
Increase
thebiom
assyield.
[134]
AllREE
mgg−
1
La—
12.46
Ce—
26.96
Pr—5.20
Nd—
7.80
mgkg
−1
Sm—544.41
Eu—
83.04
Gd—
91.92
Tb—
40.85
Dy—
8.92
Ho—
3.90
Soil
ZeamaysandSorghumbicolor
Increase
thegrow
th.
[127]
40 Curr Pollution Rep (2016) 2:28–50
Tab
le3
(contin
ued)
Element
Concentratio
nMedia
Species
Effect
Source
Tm—8.76
Yb—
7.79
Lu—
3.28
Y—140.05
Phytohormones
La
10μmol
L−1
Tissuecultu
reArabidopsisthaliana
Inhibitio
nthecontentand
actio
nof
theabscisicacid.
[135]
Tb
4,20,40,120,200,and400μM
Foliarapplication
Arm
oracia
rusticana
Reductio
nthecontento
fgibberellin
andauxinand
increase
theabscisicacid
levels.
[119]
Nd
5μmol
L−1
Tissuecultu
reDendrobiumdensiflorum
Maintenance
thetotallevelsof
endogenous
cytokininand
increase
theendogenous
andauxin.
[136]
Internalstructuralchanges
Chrom
osom
es-cellcycle
La
5,10,20,40,80,and160μM
Nutrientsolution
Glycine
max
Increase
themito
ticindex;Appearanceof
binucleatecells
(startingat5μM);
Appearanceof
c-metaphase
(startingat10
μM);
Greater
inductionof
c-metaphase
(startingat20
μM).
[102]
1,10,100,and
1000
μM
and
10mM
Tissuecultu
reZeamays
Affectsthestabilizatio
nof
thecytoskeleton.
[137]
La,Ce,Pr,N
d,Gd
0.1,1,and10
mM
ofREE
solution(La100.07;C
e327.57;
Pr25.76;
Nd0.14,and
Gd
0.006mM)
Nutrientsolutionforseed
germ
ination
test
Triticumdurum
Decreasein
mito
ticindexaccordingto
theREE
concentration
[104]
Organelles
Ce
50,100,200,and
400μM
Isolationof
mito
chondria(nutrient
solution)
Oryza
sativa
Increase
themem
braneperm
eability.
[138]
La
5,10,20,40,80,and160μM
Nutrientsolution
Glycine
max
Lossof
theoriginalshape(ellipsoidalshape)of
chloroplastsandthylakoids,w
hich
presenteda
disorganized
arrangem
ent;
Lossoftheglobularconfigurationofmitochondriaandfewer
mitochondrialcristaeandinterm
embranespacegreater;
Dam
ages
innuclearmem
branewerealso
observed.
[102]
1mmol
L−1
Tissuecultu
reDryopteriserythrosora
Laaccumulationwas
notv
erifiedin
thesameplaces
that
theCa,butm
ainlyin
thechloroplasts.
[139]
1mmol
L−1
Tissuecultu
reOryza
sativa
Lossof
theoriginalform
atof
organelles.
[106]
0.08,0.24,and1.20
mmol
L−1
Nutrientsolution
Glycine
max
Increase
theroot
mem
braneperm
eability.
[122]
Y1,2,4,
and5mgL−1
Nutrientsolution
Nym
phoidespeltata
Mobile
gradientYwas
asfollo
ws:cellwall>
organelle
>solublefractio
n.[125]
Eu
500μmol
L−1
Tissuecultu
reOryza
sativa
Increase
themito
chondria’ssize,causing
thecollapseof
themem
brane,mito
chondrialfluidity,and
decrease
inmem
braneperm
eability,besidesthemodificationof
theultrastructureof
mitochondria.
[140]
Gd
20,60,100,200,300,400,and
500μmol
L−1
Tissuecultu
reOryza
sativa
Mito
chondrialb
iogenesiswas
negativ
elyaffected
bydisordersin
mito
chondrialp
ermeability.
Worsening
ofoxidationof
unsaturatedfatty
acids;
[120]
Tb
20and200μM
Foliarapplication
Arm
oracia
rusticana
Decreased
mem
branefluidity;o
ccurrenceof
damageto
theplasmamem
braneandlossthemem
braneproteins
functio
n;
Decreasetheexchange
forextracellular/intracellular
substance,leadingto
changesin
intracellularnutrient
content.
[141]
Curr Pollution Rep (2016) 2:28–50 41

the content of photosynthetic pigments such as chlorophyll,which contributes for a higher photosynthetic rate [102, 114,117].
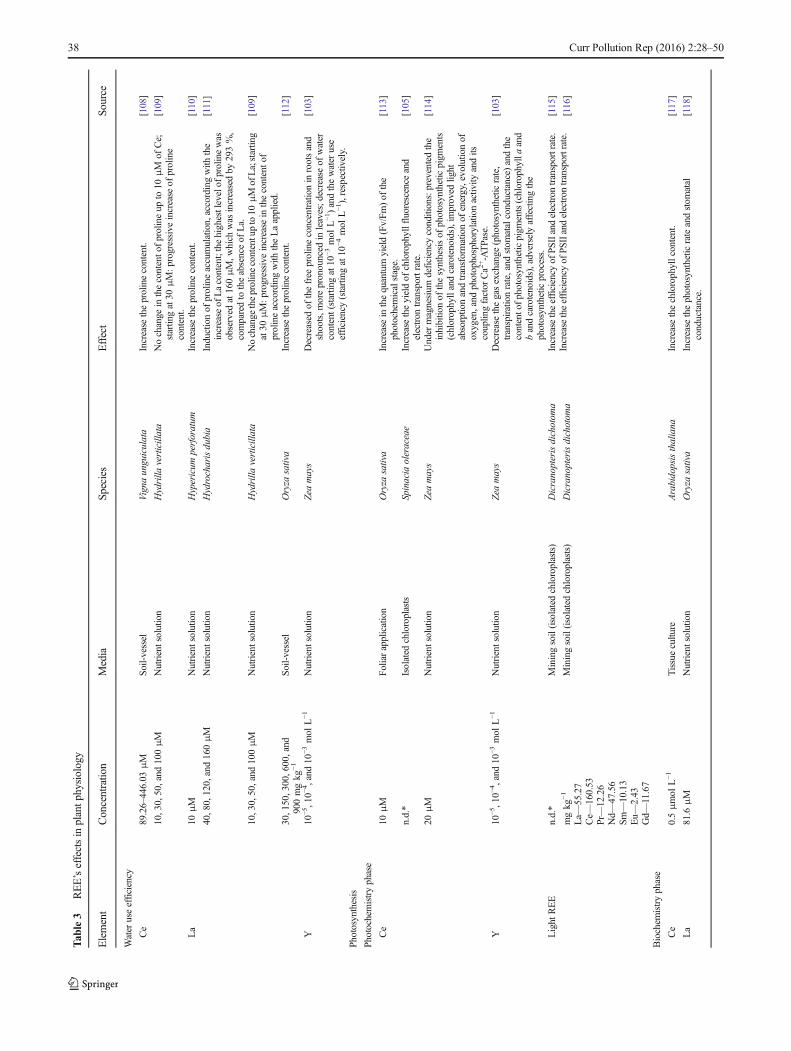
Calcium-Like Physiological Effects
The REE, La in special, can act as Ca replacements, mainly inplant structure, bonding with cell walls in which Ca would bepart of the composition and replacing it in its function as asecondary messenger [106].
Due to the fact that La and Ca are chemically and physi-cally similar, the manner that they act is similar in plants,inducing the competition and substitution of Ca by La [20,149]. This replacement in general promotes structural modifi-cations [106, 120], such as loss of structuring in the mediumlamella. La can also replace Ca in the protoplasm, chloro-plasts, mitochondria, and cytoplasmatic membranes [102,107]. Besides this, La can replace Ca in Ca oxalate crystals,which are present in many plant tissues [103]. Similarly to La,other REE have also been associated to this type of Ca re-placement, due to their very similar ionic radius [118, 120].
Mineral Plant Nutrition
The effects of REE in plant mineral nutrition are varied. Somestudies report synergism with some elements, while othersshow antagonism [124, 126, 127, 149, 150]. For some species,the presence of REE can promote beneficial effects on uptakeand translocation of nutrients such as nitrogen, thus increasingthe production of amino acids and proteins, which will act inseveral metabolic routes, leveraging plant vital processes [97].
Other nutrients such as Fe, Cu, and Mn can also have theirabsorption increased in the presence of REE, in several spe-cies. This can increase the amount of cofactors involved inseveral metabolic processes and promote an increase in plantgrowth [102, 127, 134, 150]. In addition, there are reports thatthe presence of REE may lead also to an increased absorptionof other elements with no known biological function, such asCd [128].
Enzymatic System
The stimulus to enzyme production and activation in plants,due to the presence of REE, is associated with an influx ofnutrients that constitute these enzymatic molecules and also toa higher influx of cofactors and catalysts of enzymatic reac-tions that will trigger their activity [129, 132]. There are alsostudies that correlate the presence of REE to a higher activityof the antioxidant enzymatic system [112, 117, 119, 130, 131,150].T
able3
(contin
ued)
Element
Concentratio
nMedia
Species
Effect
Source
LaandCe
30,200,and
500mgkg
−1Soil-vessel
Guanglin
9(Eucalyptusgrandis×
Eucalyptusurophylla)and
Eucalyptusgrandis5
Disruptionthecellwalland
mem
branes.
[142]
Tissues
La
10and40
μM
Nutrientsolution
Pistia
stratio
tes
Inductionof
coifgrow
thof
thecoif.
[143]
Y10
−5,10−
4 ,and10
−3mol
L−1
Nutrientsolution
Zeamays
Decreasethestom
atasize
andincreasedstom
ataldensity
onboth
sidesof
theadaxialand
abaxialepiderm
is.
[103]
42 Curr Pollution Rep (2016) 2:28–50
Effects of REE on Plant Development
Seed Germination
Some studies report positive effects of REE in seed germina-tion, mainly because these elements act in a synergistic man-ner with phytohormones that stimulate germination, besidesinhibiting phytohormones that negatively affect seed germi-nation, as it will be described further [124, 133].
Plant Growth
It has been broadly reported that REE positively influenceplant growth, increasing biomass production [127, 129, 132,134, 149]. Other factors related to plant growth that contributeto an increase of productivity, such as better plant structuringand architecture, have been also associated with the presenceof REE [124].
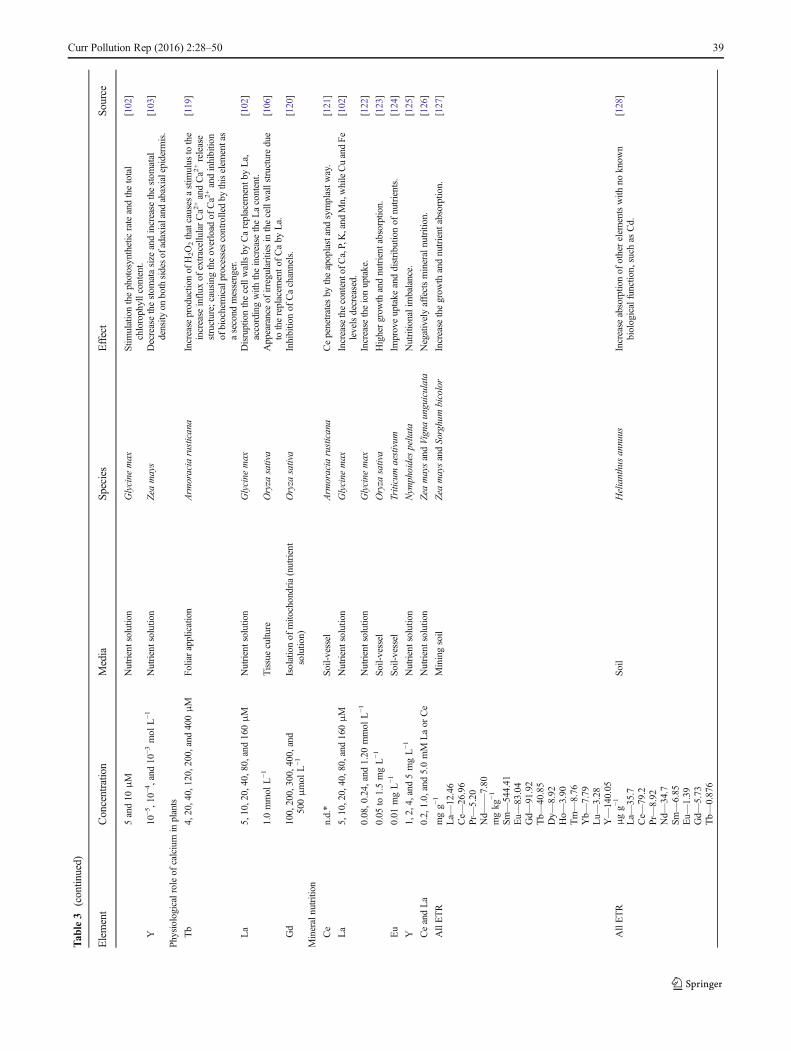
Phytohormones
The production of phytohormones is affected by the presenceof REE, and this interaction has been proposed as one of themechanisms through which these elements can influence plantgrowth. However, it is not clear yet if REE are directly in-volved with signalization of plant hormones, and the re-sponses regarding stimulus or inhibition of phytohormonesare variable among species and among REE [119]. While asynergism has been reported between the presence of Tb andthe production and action of abscisic acid, the opposite wasobserved regarding auxin and gibberellin [119]. On the otherhand, Nd did not influence total levels of endogenous cytoki-nin and significantly increased the level of auxin [136].
Effects of REE on Plant Internal Structure
Chromosomes-Cell Cycle
It is reported that REE may act as inducers of the cell cycle,increasing or reducing the mitotic index in plants [102, 104].Besides altering the mitotic index, at low concentration, Lawas described to promote the appearance of abnormalities inthe cell cycle, favoring biomass growth due to the duplicationof the cell genome; i.e., the appearance of polyploidized cells(binucleated) resulted in increasing tissue size. Yet, a furtherincrease in La concentration led to the appearance of abnor-malities such as c-metaphases, indicating La toxicity [102].Moreover, there are studies demonstrating that REE maycause destabilization of the cytoskeleton, affecting the cellcycle [137].
Organelles
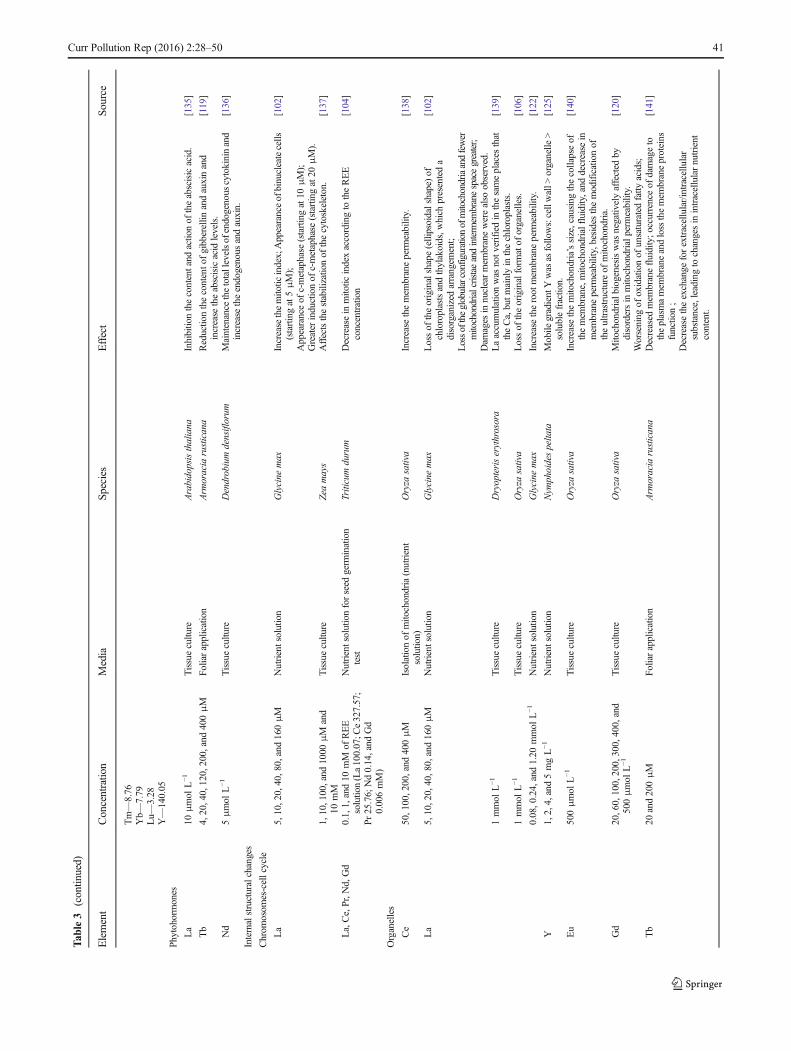
Since REE can bind to plant structures, they can cause celldestructuring (by Ca replacement). These destructuring pro-cesses are commonly verified in cell walls [125, 142] and alsooccur frequently in chloroplasts, mitochondria, and nuclei thatlose their original format [102, 106, 140]. The main reports ofREE effects on membrane stability are associated to alter-ations of stability, functionality, and permeability [120, 138,140, 150, 151].
Tissues
There are reports that root protecting tissues (cap), which havedirect contact with REE present in soil solution, can be in-creased, as a protection to their excessive influx, which con-stitutes the mechanism of plant tolerance to these elements.Besides this, other tissues can be thickened, such as apoplasticbarriers, to avoid the translocation of these elements to shoots[143]. Additionally, the dimensions and density of structuressuch as the stomata can be modified as a way to keep thephotosynthetic process in the presence of these elements[103].
Ecological and Human Health Risks Associatedwith REE
Even though many medical and pharmacological studies havebeen reported with REE [152–156], so far, little attention hasbeen given to ecological and environmental aspects related tothe presence of REE in soils and their possible transference inthe trophic chain [157, 158].
Several studies involving effects of REE in experimentalanimals have reported an accumulation of these elements withtime. The main spots for accumulation are the bones, liver,and lungs [156, 159, 160]. Some damage can be mentioned,such as cardiac, hepatic, hematological, and renal problems,besides effects in the gastrointestinal tract, in bones, in thecentral nervous system, and in the pulmonary and cytogeneticsystems [79, 156, 159–162]. Despite this, the current informa-tion is not enough to determine the safe levels of exposure inhumans [160], with values found being described as tempo-rary [163].
In studies that evaluate the risk to human health, the doserepresenting an estimate, with uncertainty spanning perhapsan order of magnitude, of a daily oral exposure to the humanpopulation (including sensitive subgroups) that is likely to bewithout an appreciable risk of deleterious effects during alifetime is called oral reference dose (RfD) [160, 161].Toxicological studies provide a basis for deriving non-observed adverse effect level (NOAEL) and lowest observedadverse effect level (LOAEL) contents. By applying
Curr Pollution Rep (2016) 2:28–50 43

uncertainty and modification factors (specific to each condi-tion), values for RfD are obtained [160, 161]. It is possible tocompare the toxicity of different substances through RfDvalues. These values are used to estimate the risk for a certaingroup, by comparing the exposure level to the effect level(RfD). Table 4 presents RfD values for some REE. The exis-tence of a distinct toxicity between the elements and for oneelement alone is emphasized in this table, depending on itsaccompanying ion.
Even though these data are useful to evaluate potential risksof REE to humans, only in specific cases, there will be directexposure to salts/oxides of these elements. In most cases, themajor exposure routes will be ingestion of food, water, andcontaminated soil, as well as dermal contact and inhalation offumes and particulate materials [163]. Therefore, it is neces-sary to know the real doses to which the organisms are ex-posed to.
There are evidences that REE may accumulate in the soilsurface due to their sorption onto soil colloids [79, 157],which consequently can lead to low bioavailability. This isdirectly affected by factors such as pH and the presence oforganic and inorganic ligands [158]. Under these circum-stances, if there is ingestion of REE-contaminated soil, thetotal content of the element possibly would not represent thereal risk.
For better risk estimates of soil-derived REE, it would benecessary to perform bioaccessibility studies, such as thoseimplemented by Smith et al. [91], who evaluated bioaccessi-ble contents (physiologically based extraction test) of La, Ce,and Nd in soil samples (ground soils) and soils eaten deliber-ately, such as termite nest soils and traditional herbal-soil rem-edies, in the district of Mukono (Uganda). The average bioac-cessibility varied from 2.9 to 14 % for La, 1 to 15 % for Ce,
and 3.4 to 19 % for Nd. A smaller bioaccessibility was ob-served in soil samples, when compared with the other mate-rials evaluated. The authors concluded that the low bioacces-sible levels of Ce considerably reduce the contribution of Ceexposure values via direct soil ingestion. In addition, the au-thors suggest that REE bioaccessibility in food is reduced dueto the presence of organic complexes, such as phytates. Theseresults are relevant, since bioaccessibility studies performedfor other elements show evidences to conclude that an over-estimation of risk can occur if the risk evaluation considersonly the total contents [164, 165]. Adding to this, there is alsothe need for speciation studies, in order to identify the solubleand insoluble species for each soil environment [79, 157].
Thus, additional experiments that seek to evaluate the realcontents to which human beings are exposed to REE are anurgent need. These results could possibly reduce the pressuresimposedmainly on agriculture, which is the main activity (as adiffuse source) responsible for increasing the contents of REEin soils [53], due to either REE direct (China) or indirect use(other countries). Knowing several bioaccessibility scenariosfor these elements would allow decision-making with highersafety.
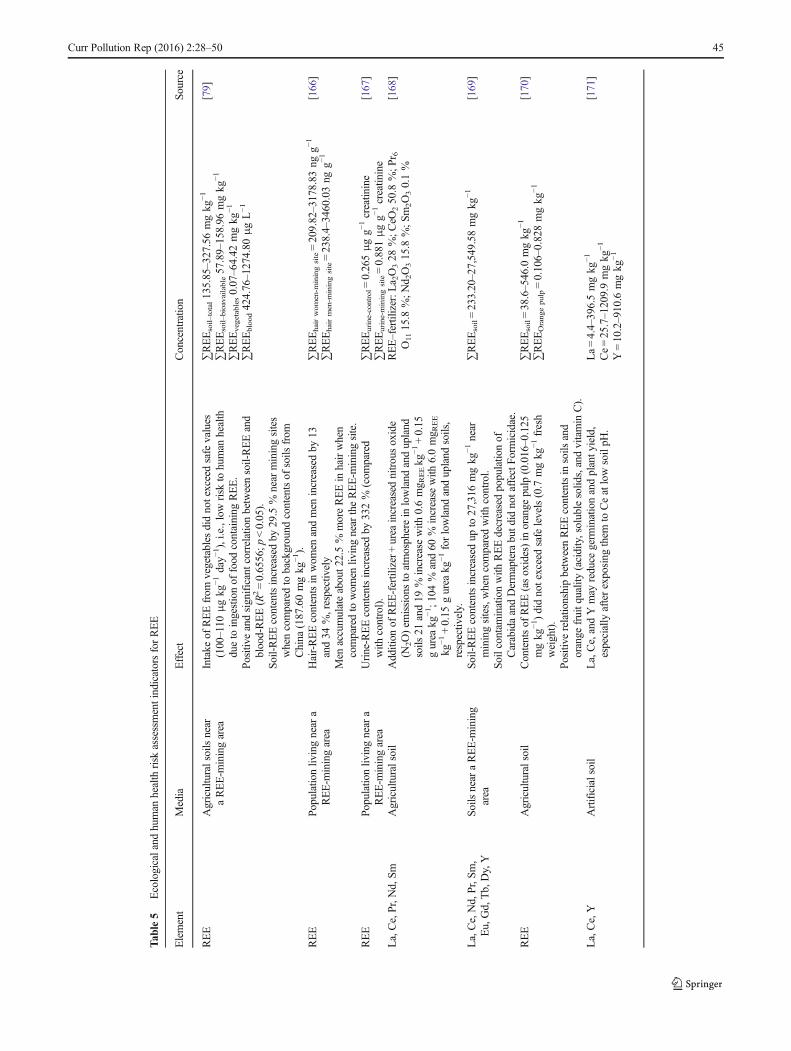
In the absence of these researches, analyses of Bcasestudies^ can allow, in a preliminary manner, to associate ex-posure conditions to their effects. Table 5 shows some of thesestudies. It is verified that hair, blood, and urine can be used asexposure indicators. Populations exposed to elevated REEcontents can present alterations in these parameters. Table 5also shows studies that can help to evaluate ecological risks.
Regarding ecological risk evaluations, it cannot be af-firmed if there is or there is not risk in a generalized manner.Each scenario must be specifically evaluated, taking the in-trinsic variability of each environment into consideration, aswell as the evaluation objectives, target organisms, amongothers [172].
It is known that REE toxicity is variable, depending ontoxicological parameters and the target organisms [157].Besides this, the chemical forms of REE compounds primarilydetermine deposition and retention of REE following the dif-ferent routes of exposure [156]. Tables 6 and 7 show LD50
values (lethal dose to 50 % of exposed individuals) for someREE through different administration routes. These data rein-force the need to evaluate bioaccessible contents, particularlywhen taking into consideration the great differences foundbetween different routes of exposure, e.g., oral versusintravenous.
With the purpose of evaluating ecological risk, part ofthe information shown in Table 3, which report selectedadverse effects of REE in plants (and their respective con-centrations), could be used to construct a database thatallows the elaboration of mathematical models to estimatesafe doses of REE in soils. However, the existence of alimited number of studies in this subject, as well as others
Table 4 Provisional reference doses (p-RfD) for selected REE.
Element p-RfD (mg kg−1 day−1)
Europium (chloride) 0.03
Europium (oxide) 0.002
Lanthanum (carbonate)a 0.5
Lanthanum (chloride) 0.005
Lanthanum (oxide) 0.02
Lutetium(chloride) 0.0009
Neodymium (chloride) 0.5
Praseodymium (chloride) 0.5
Samarium (chloride) 0.5
Samarium (nitrate) 0.00002
Scandium (oxide) 0.005
Yttrium (chloride) 0.004
Source: [160–163]a This value was not considered provisional
44 Curr Pollution Rep (2016) 2:28–50
Tab
le5
Ecologicaland
human
health
risk
assessmentindicatorsforREE
Element
Media
Effect
Concentratio
nSource
REE
Agriculturalsoilsnear
aREE-m
iningarea
Intake
ofREEfrom
vegetables
didnotexceedsafe
values
(100–110
μgkg
−1day−
1),i.e.,lowrisk
tohuman
health
dueto
ingestionof
food
containing
REE.
Positive
andsignificantcorrelatio
nbetweensoil-REEand
blood-REE(R
2=0.6556;p
<0.05).
Soil-REEcontentsincreasedby
29.5
%near
miningsites
whencomparedto
background
contentsof
soils
from
China
(187.60mgkg
−1).
∑REEsoil–total135.85–327.56mgkg
−1
∑REEsoil–bioavailable57.89–158.96
mgkg
−1
∑REEvegetables0.07–64.42
mgkg
−1
∑REEblood424.76–1274.80
μgL−1
[79]
REE
Populationliv
ingnear
aREE-m
iningarea
Hair-REEcontentsin
wom
enandmen
increasedby
13and34
%,respectively
Men
accumulateabout2
2.5%
moreREEin
hairwhen
comparedto
wom
enliv
ingnear
theREE-m
iningsite.
∑REEhairwomen-m
iningsite=209.82–3178.83
ngg−
1
∑REEhairmen-m
iningsite=238.4–3460.03ng
g−1
[166]
REE
Populationliv
ingnear
aREE-m
iningarea
Urine-REEcontentsincreasedby
332%
(com
pared
with
control).
∑REEurine-control=0.265μgg−
1creatin
ine
∑REEurine-miningsite=0.881μgg−
1creatin
ine
[167]
La,Ce,Pr,Nd,Sm
Agriculturalsoil
Addition
ofREE-fertilizer+urea
increasednitrousoxide
(N2O)em
issionsto
atmospherein
lowland
andupland
soils
21and19
%increase
with
0.6mg R
EEkg
−1+0.15
gurea
kg−1;1
04%
and60
%increase
with
6.0mg R
EE
kg−1+0.15
gurea
kg−1
forlowland
andupland
soils,
respectiv
ely.
REE–fertilizer:L
a 2O328
%;C
eO250.8
%;P
r 6O1115.8
%;N
d 2O315.8
%;S
m2O30.1%
[168]
La,Ce,Nd,Pr,Sm,
Eu,Gd,Tb,Dy,Y
Soils
near
aREE-m
ining
area
Soil-REEcontentsincreasedup
to27,316
mgkg
−1near
miningsites,whencomparedwith
control.
Soilcontam
inationwith
REEdecreasedpopulatio
nof
CarabidaandDermaptera
butd
idnotaffectF
ormicidae.
∑REEsoil=233.20–27,549.58
mgkg
−1[169]
REE
Agriculturalsoil
Contentsof
REE(asoxides)in
orange
pulp
(0.016–0.125
mgkg
−1)didnotexceedsafe
levels(0.7
mgkg
−1fresh
weight).
Positive
relatio
nshipbetweenREEcontentsin
soils
and
orange
fruitq
uality(acidity,solublesolid
s,andvitamin
C).
∑REEsoil=38.6–546.0
mgkg
−1
∑REEOrangepulp=0.106–0.828mgkg
−1[170]
La,Ce,Y
Artificialsoil
La,Ce,andYmay
reduce
germ
inationandplanty
ield,
especially
afterexposing
them
toCeatlowsoilpH
.La=4.4–396.5mgkg
−1
Ce=25.7–1209.9mgkg
−1
Y=10.2–910.6
mgkg
−1
[171]
Curr Pollution Rep (2016) 2:28–50 45
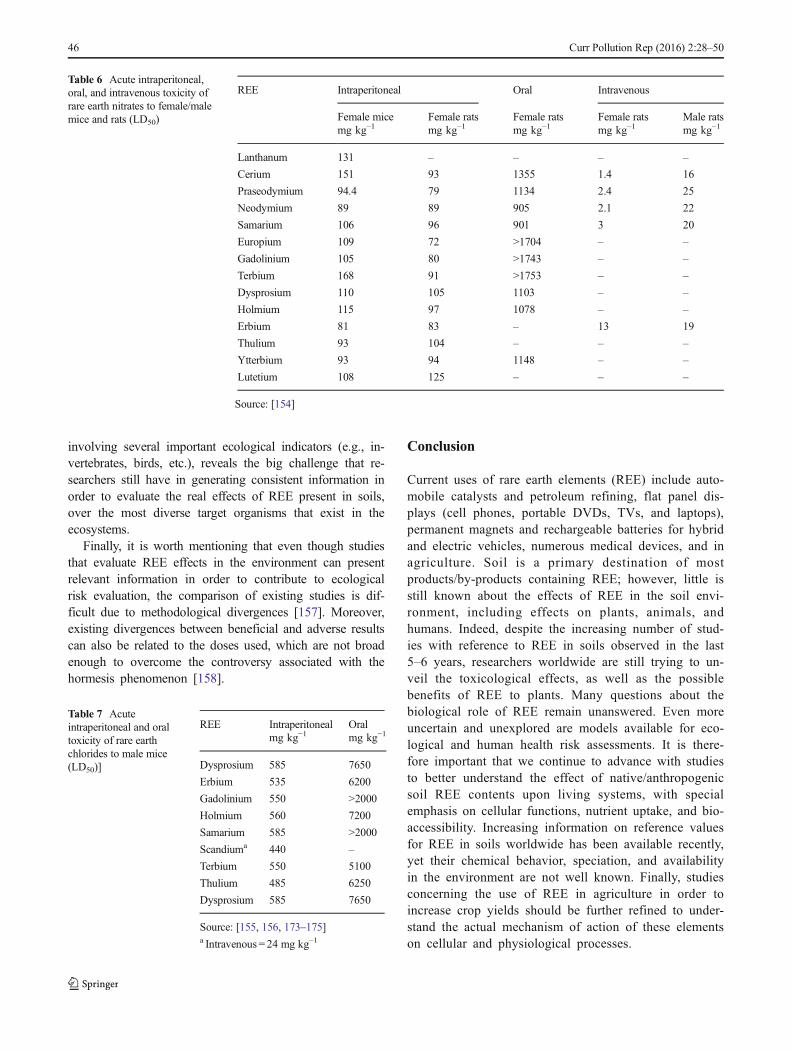
involving several important ecological indicators (e.g., in-vertebrates, birds, etc.), reveals the big challenge that re-searchers still have in generating consistent information inorder to evaluate the real effects of REE present in soils,over the most diverse target organisms that exist in theecosystems.
Finally, it is worth mentioning that even though studiesthat evaluate REE effects in the environment can presentrelevant information in order to contribute to ecologicalrisk evaluation, the comparison of existing studies is dif-ficult due to methodological divergences [157]. Moreover,existing divergences between beneficial and adverse resultscan also be related to the doses used, which are not broadenough to overcome the controversy associated with thehormesis phenomenon [158].
Conclusion
Current uses of rare earth elements (REE) include auto-mobile catalysts and petroleum refining, flat panel dis-plays (cell phones, portable DVDs, TVs, and laptops),permanent magnets and rechargeable batteries for hybridand electric vehicles, numerous medical devices, and inagriculture. Soil is a primary destination of mostproducts/by-products containing REE; however, little isstill known about the effects of REE in the soil envi-ronment, including effects on plants, animals, andhumans. Indeed, despite the increasing number of stud-ies with reference to REE in soils observed in the last5–6 years, researchers worldwide are still trying to un-veil the toxicological effects, as well as the possiblebenefits of REE to plants. Many questions about thebiological role of REE remain unanswered. Even moreuncertain and unexplored are models available for eco-logical and human health risk assessments. It is there-fore important that we continue to advance with studiesto better understand the effect of native/anthropogenicsoil REE contents upon living systems, with specialemphasis on cellular functions, nutrient uptake, and bio-accessibility. Increasing information on reference valuesfor REE in soils worldwide has been available recently,yet their chemical behavior, speciation, and availabilityin the environment are not well known. Finally, studiesconcerning the use of REE in agriculture in order toincrease crop yields should be further refined to under-stand the actual mechanism of action of these elementson cellular and physiological processes.
Table 6 Acute intraperitoneal,oral, and intravenous toxicity ofrare earth nitrates to female/malemice and rats (LD50)
REE Intraperitoneal Oral Intravenous
Female mice Female rats Female rats Female rats Male ratsmg kg−1 mg kg−1 mg kg−1 mg kg−1 mg kg−1
Lanthanum 131 – – – –
Cerium 151 93 1355 1.4 16
Praseodymium 94.4 79 1134 2.4 25
Neodymium 89 89 905 2.1 22
Samarium 106 96 901 3 20
Europium 109 72 >1704 – –
Gadolinium 105 80 >1743 – –
Terbium 168 91 >1753 – –
Dysprosium 110 105 1103 – –
Holmium 115 97 1078 – –
Erbium 81 83 – 13 19
Thulium 93 104 – – –
Ytterbium 93 94 1148 – –
Lutetium 108 125 – – –
Source: [154]
Table 7 Acuteintraperitoneal and oraltoxicity of rare earthchlorides to male mice(LD50)]
REE Intraperitoneal Oralmg kg−1 mg kg−1
Dysprosium 585 7650
Erbium 535 6200
Gadolinium 550 >2000
Holmium 560 7200
Samarium 585 >2000
Scandiuma 440 –
Terbium 550 5100
Thulium 485 6250
Dysprosium 585 7650
Source: [155, 156, 173–175]a Intravenous = 24 mg kg−1
46 Curr Pollution Rep (2016) 2:28–50

Acknowledgments This reviewwas made possible due to funding pro-vided for the activities of ITV-UFLA Grant No. 020/2012 and CNPqGrant No. 406806/2013-6. The authors are grateful to ITV-Vale, CNPq,CAPES, and FAPEMIG for financial support and scholarships.
Compliance with Ethical Standards
Conflict of Interest On behalf of all authors, the corresponding authorstates that there is no conflict of interest.
References
1. IUPAC. Nomenclature of inorganic chemistry. Recommendations2005. Connelly NG et al., editors. 2005.
2. Šmuc NR et al. Geochemical characteristics of rare earth elements(REEs) in the paddy soil and rice (Oryza sativa L.) system ofKočani Field, Republic of Macedonia. Geoderma. 2012;183–184:1–11.
3. Robinson WO et al. Biogeochemistry of the rare earth elementswith particular reference to hickory trees. Geochim CosmochimActa. 1958;14:55–67.
4. Skovran E, Martinez-Gomez NC. Just add lanthanides. Science.2015;348:862–3.
5. Thyssen P, Binnemans K. Accommodation of rare earths in theperiodic table: a historical analysis. In: Jr. KAG et al., editors.Handb. Phys. Chem. Rare Earths. 41st ed. 2011.
6. Hurst CA. China’s ace in the hole. U.S. Geological SurveyNational Minerals Information Center. Jt Force Q. 2010;59:121–6.
7. Migaszewski ZM, Gałuszka A. The characteristics, occurrence,and geochemical behavior of rare earth elements in the environ-ment: a review. Crit Rev Environ Sci Technol. 2014;45:429–71.
8. Tyler G. Rare earth elements in soil and plant systems—a review.Plant Soil. 2004;267:191–206.
9. Kabata-Pendias A. Trace elements in soils and plants. 2011.10. Pang X et al. Application of rare-earth elements in the agriculture
of China and its environmental behavior in soil. Environ Sci PollutRes Int. 2002;9:143–8.
11. Chen Z. Global rare earth resources and scenarios of future rareearth industry. J Rare Earths. 2011;29:1–6.
12. USGS. U.S. Geological Survey. Mineral commodity summaries2015: U.S. Geological Survey. Reston. 2015.
13. Dołęgowska S, Migaszewski ZM. Anomalous concentrations ofrare earth elements in the moss-soil system from south-centralPoland. Environ Pollut. 2013;178:33–40.
14. Jorjani E, Shahbazi M. The production of rare earth elementsgroup via tributyl phosphate extraction and precipitation strippingusing oxalic acid. Arab J Chem King Saud University. 2012;2:433–598.
15. Alonso E et al. Evaluating rare earth element availability: a casewith revolutionary demand from clean technologies. Environ SciTechnol. 2012;46:3406–14.
16. Chakhmouradian AR, Wall F. Rare earth elements: minerals,mines, magnets (and more). Elements. 2012;8:333–40.
17. Massari S, Ruberti M. Rare earth elements as critical raw mate-rials: focus on international markets and future strategies. ResourPolicy. 2013;38:36–43.
18. ZhuMYet al. A review of REE tracer method used in soil erosionstudies. Agri. Sci. China. Chinese Academy of AgriculturalSciences. 2010;9:1167–1174.
19. Wang L et al. An experimental study on using rare earth elementsto trace phosphorous losses from nonpoint sources. Chemosphere.2011;85:1075–9.
20. Hu Z et al. Physiological and biochemical effects of rare earthelements on plants and their agricultural significance: a review. JPlant Nutr. 2004;27:183–220.
21. Nikanorov AM. The Oddo-Harkins rule and distribution of chem-ical elements in freshwater ecosystems. Dokl Earth Sci. 2009;426:600–4.
22. Pourmand A et al. A novel extraction chromatography and MC-ICP-MS technique for rapid analysis of REE, Sc and Y: revisingCI-chondrite and post-Archean Australian shale (PAAS) abun-dances. Chem Geol. 2012;291:38–54.
23. Haskin LA, Frey FA. Meteoritic, solar and terrestrial rare-earthdistributions. Phys Chem Earth. 1966;7:167–321.
24. Teixeira, Wet al. Decifrando a Terra. 1ª Edição.São Paulo: EditoraNacional. 2000.
25. Taylor SR, Mclennan SM. The geochemical the continental evo-lution crust. Am Geophys Union. 1995;241–265.
26. Gromet LP et al. The BNorth American shale composite^—itscompilation, major and trace element characteristics. 1984;48:2469–2482.
27. McLennan SM. Rare earth elements in sedimentary rocks; influ-ence of provenance and sedimentary processes. Rev inMineralogy Geochemistry. 1989;21:169–200.
28. Jordens A et al. A review of the beneficiation of rare earth elementbearing minerals. Miner Eng. 2013;41:97–114.
29. Gupta C, Krishnamurthy N. Extractive metallurgy of rare earths.Florifa: CRC Press; 2005.
30. Kanazawa Y, Kamitani M. Rare earth minerals and resources inthe world. J Alloys Compd Lausanne. 2006;408–412:1339–43.
31. Sha LK, Chappell BW. Apatite chemical composition, determinedby electron microprobe and laser-ablation inductively coupledplasma mass spectrometry, as a probe into granite petrogenesis.Geochim Cosmochim Acta. 1999;63:3861–81.
32. Pendias AK, Mukherjee AB. Trace elements of group 3(Previously Group IIIb). Trace Elem. from Soil to Human.2007. pp. 127–150.
33. Vijayan S et al. Rare earths: their mining, processing, and growingindustrial usage. Min Eng. 1989;41:13–8.
34. Kynicky J et al. Diversity of rare earth deposits: the key exampleof China. Elements. 2012;8:361–7.
35. Picard S et al. Rare earth element contents of Jurassic fish andreptile teeth and their potential relation to seawater composition(Anglo-Paris Basin, France and England). Chem Geol. 2002;186:1–16.
36. Taunton AE et al. Geomicrobiological controls on light rare earthelement, Yand Ba distributions during granite weathering and soilformation. J Alloys Compd. 2000;303–304:30–6.
37. Condie KC et al. Behavior of rare earth elements in apaleoweathering profile on granodiorite in the Front Range,Colorado. USA Geochim Cosmochim Acta. 1995;59:279–94.
38. Grandjean-Lécuyer P et al. Rare earth elements in old biogenicapatites. Geochim Cosmochim Acta. 1993;57:2507–14.
39. Yunxiang Ni JMH, Mariano AN. Crystal chemistry of the mona-zite and xenotime structures. Am Mineral. 1995;80:21–6.
40. Zhang FS et al. Rare earth element content in various waste ashesand the potential risk to Japanese soils. Environ Int. 2001;27:393–8.
41. Hu Z et al. Rare earth elements in soils. Commun Soil Sci PlantAnal. 2006;37:1381–420.
42. Cidu R et al. Dynamics of rare earth elements in water-soil sys-tems: the case study of the Pineta San Vitale (Ravenna, Italy).Geoderma. 2013;193–194:52–67.
43. Price DG. Weathering and weathering processes. Quarterly J EngGeol. 1995;28:243–52.
44. Gnandi K, Tobschall HJ. Distribution patterns of rare-earth ele-ments and uranium in tertiary sedimentary phosphorites ofHahotoé–Kpogamé. Togo J African Earth Sci. 2003;37:1–10.
Curr Pollution Rep (2016) 2:28–50 47

45. El-Ramady HRH. Ecotoxicology of rare earth elements: ecotoxi-cology of rare earth elements within soil and plant environments.KG: VDM Verlag Dr. Muller Aktiengsellsellshaft & Co; 2010.
46. Lijun W et al. Biogeochemical cycle and residue of extraneousrare earth elements in agricultural ecosystem. J Rare Earths.2004;22:701–6.
47. Smidt GA et al. Heavy metal concentrations in soils in the vicinityof a fertilizer factory in Southern Brazil. Agriculture and ForestryResearch. 2011;61:353–64.
48. Xie Y et al. REE geochemistry of modern eolian dust deposits inHarbin city, Heilongjiang province. China: Implications for prov-enance Catena. 2014;123:70–8.
49. Waheed S et al. Rare earths elements in phosphorite and granulat-ed single super-phosphate fertilizers of Pakistan, a study usinginstrumental neutron activation analysis. J Radioanal NuclChem. 2011;289:521–8.
50. Abdel-Haleem AS et al. Heavy metals and rare earth elements inphosphate fertilizer components using instrumental neutron acti-vation analysis. Appl Radiat Isot. 2001;55:569–73.
51. Todorovsky DS et al. Effect of the application of superphosphateon rare earths’ content in the soil. Sci Total Environ. 1997;203:13–6.
52. Otero N et al. Fertiliser characterisation: major, trace and rare earthelements. Appl Geochemistry. 2005;20:1473–88.
53. Turra C et al. Evaluation on rare earth elements of Brazilian agri-cultural supplies. J Environ Chem Ecotoxicol. 2011;3:86–92.
54. Al-Thyabat S, Zhang P. REE extraction from phosphoric acid,phosphoric acid sludge, and phosphogypsum. Miner. Process.Extr. Metall. 2015;0: 1–8.
55. Leonardo L et al. Lichen specie Canoparmelia texana asbioindicator of environmental impact from the phosphate fertilizerindustry of São Paulo. Brazil J Radioanal Nucl Chem. 2014;299:1935–41.
56. Dinali GS. Elementos terras raras em materiais derivados daindústria de fosfatos. Universidade Federeal de Lavras. 2014.
57. Xu X et al. Distributions of rare earths and heavy metals in field-grown maize after application of rare earth-containing fertilizer.Sci Total Environ. 2002;293:97–105.
58. Jones DL. Trivalent metal (Cr, Y, Rh, La, Pr, Gd) sorption in twoacid soils and its consequences for bioremediation. Eur J Soil Sci.1997;697–702.
59. Cao X et al. Effects of redox potential and pH value on the releaseof rare earth elements from soil. Chemosphere. 2001;44:655–61.
60. Fendorf S, Fendorf M. Sorption mechanism of lanthanum on ox-ide minerals. Clay Clays Miner. 1996;44:220–7.
61. Bao Z, Zhao Z. Geochemistry of mineralization with exchange-able REY in the weathering crusts of granitic rocks in SouthChina. Ore Geol Rev. 2008;33:519–35.
62. Caspari T et al. Geochemical investigation of soils developed indifferent lithologies in Bhutan. Eastern Himalayas Geoderma.2006;136:436–58.
63. Ayres M, Harris N. REE fractionation and Nd-isotope disequilib-rium during crustal anatexis: constraints from Himalayanleucogranites. Chem Geol. 1997;139:249–69.
64. Beckwith R, Butler J. Aspect of the chemistry of soil organicmatter. Soil, an Australian viewpoint. Vic CSIRO/AcademicPress. 1993. pp. 561–581.
65. Xiangke Wet al. Sorption and desorption of Eu and Yb on alumi-na: mechanisms and effect of fulvic acid. Appl Radiat Isot.2000;52:165–73.
66. Pourret O et al. Organic complexation of rare earth elements innatural waters: evaluating model calculations from ultrafiltrationdata. Geochim Cosmochim Acta. 2007;71:2718–35.
67. Tang J, Johannesson KH. Rare earth elements adsorption ontoCarrizo sand: influence of strong solution complexation. ChemGeol. 2010;279:120–33.
68. Zhu QQ, Liu Z. REEs in soil of eastern China. J Chinese RareEarth Soc. 1988;6:59–65.
69. Kawasaki A et al. Rare earth elements and other trace elements inwastewater treatment sludges. Soil Sci Plant Nutr. 2012;44:433–41.
70. Zhang S, Shan XQ. Speciation of rare earth elements in soil andaccumulation by wheat with rare earth fertilizer application.Environ Pollut. 2001;112:395–405.
71. Salminen RB et al. FOREGSGeochimical Atlas of Europe, part 1:background information, methodology and maps. Geol. Surv.Finland, Espoo. 2005.
72. Markert B. The pattern of distribution of lanthanide elements insoils and plants. Phytochemistry. 1987;26:3167–170.
73. Loell M et al. Contents and bioavailability of rare earth elements inagricultural soils in Hesse (Germany). J Plant Nutr Soil Sci.2011;174:644–54.
74. Markert B, Li ZD. Natural background concentrations of rare-earth elements in a forest ecosystem. Sci Total Environ.1991;103:27–35.
75. Diatloff E et al. Concentrations of rare earth elements in someAustralian soils. Aust J Soil Res. 1996;34:735.
76. Moreira CG. Elementos terras raras em solos agrícolas comaplicações de fertilizante fosfatado e fosfogesso. 2014.
77. Oliveira KAP et al. Transfer factor of rare earth elements fromphosphogypsum amended Brazilian tropical soils to lettuce, cornand soybean. J Solid Waste Technol Manag. 2012;38:202–10.
78. Marques R et al. REE and other trace and major elements in thetopsoil layer of Santiago island. Cape Verde J African Earth Sci.2012;64:20–33.
79. Li X et al. A human health risk assessment of rare earth elementsin soil and vegetables from a mining area in Fujian Province.Southeast China Chemosphere. 2013;93:1240–6.
80. Miao L et al. Geochemistry and biogeochemistry of rare earthelements in a surface environment (soil and plant) in SouthChina. Environ Geol. 2008;56:225–35.
81. Cheng H et al. Vertical distribution of rare earth elements in awetland soil core from the Sanjiang Plain in China. J. RareEarths. The Chinese Society of Rare Earths. 2012;30:731–8.
82. Zhang Q et al. Estimation of the detachment rate in eroding rills influme experiments using an REE tracing method. Geoderma.2008;147:8–15.
83. Laul JC et al. Biogeochemical distribution of rare earths and othertrace elements in plants and soils. Phys ChemEarth. 1979;11:819–27.
84. Takeda A et al. Analysis of 57 elements in Japanese soils, withspecial reference to soil group and agricultural use. Geoderma.2004;119:291–307.
85. Yoshida S et al. Concentrations of lanthanide elements, Th, and Uin 77 Japanese surface soils. Environ Int. 1998;24:275–86.
86. Uchida S et al. Soil-to-plant transfer factors of stable elements andnaturally occurring radionuclides (1) upland field crops collectedin Japan. J Nucl Sci Technol. 2007;44:628–40.
87. Chojnicki ZEF et al. Rare earth elements in alluvial soils. RoczGlebozn Tom. 2000;57–65.
88. Sadeghi M et al. Rare earth element distribution and mineraliza-tion in Sweden: an application of principal component analysis toFOREGS soil geochemistry. J Geochemical Explor. 2013;133:160–75.
89. Öhlander B et al. Mobility of rare earth elements duringweathering of till in northern Sweden. Appl Geochemistry.1996;11:93–9.
90. Tyler G, Olsson T. Conditions related to solubility of rare andminor elements in forest soils. J Plant Nutr Soil Sci. 2002;165:594–601.
48 Curr Pollution Rep (2016) 2:28–50
91. Smith B et al. The bioaccessibility of essential and potentiallytoxic trace elements in tropical soils from Mukono District.Uganda J Geol Soc. 2000;157:885–91.
92. Saha A et al. Determination of trace rare earth elements in gado-linium aluminate by inductively coupled plasma time of flightmass spectrometry. Spectrochim Acta Part B At Spectrosc.2014;94–95:14–21.
93. Spalla S et al. Determination of rare earth elements in tomatoplants by inductively coupled plasma mass spectrometry tech-niques. Rapid Commun Mass Spectrom. 2009;23:3285–92.
94. Tanase IG et al. Validation and quality control of an ICP-MSmethod for the quantification and discrimination of trace metalsand application in paper analysis: an overview. Crit Rev AnalChem. 2014;44:311–27.
95. Kawabe I et al. Comparison of REE analyses of GSJ carbonatereference rocks by ICP-AES and INAA: fission and spectral inter-ferences in INAA determination of REE in geochemical sampleswith high U/REE ratios. Geochem J. 1994;28:19–29.
96. Alnour IA et al. Rare earth elements determination and distribu-tion patterns in granite rock samples by using INAA absolutemethod. J Radioanal Nucl Chem. 2015;303:1999–2009.
97. Redling K. Rare earth elements in agriculture. UniversitatMunchen; 2006.
98. Volokh AA et al. Phosphorus fertilizer production as a source ofrare-earth elements pollution of the environment. Sci TotalEnviron. 1990;95:141–8.
99. Chahi A et al. Rare-earth elements as tracers of the genetic rela-tionship between smectite and palygorskite in marine phospho-rites. Clay Miner. 1999;34:419.
100. Xiong BK. Application of rare earths in Chinese agriculture andtheir perspectives of development. In: Rare earths in agriculturalsciences, Australian Academy of Technology and Engineering,Carlon South. 1995. pp. 3–9.
101. Guo BS. The application of rare earth elements on agriculture andbreeding. Chinese Rare Earths. 1993;34–43.
102. Oliveira C et al. Bioaccumulation and effects of lanthanum ongrowth and mitotic index in soybean plants. Ecotox EnvironSafe. 2015;122:136–144.
103. Maksimovic I et al. Effect of yttrium on photosynthesis and waterrelations in young maize plants. J Rare Earths. 2014;32:371–8.
104. d’Aquino L et al. Effect of some light rare earth elements on seedgermination, seedling growth and antioxidant metabolism inTriticum durum. Chemosphere. 2009;75:900–5.
105. Giraldo JP et al. Plant nanobionics approach to augment photo-synthesis and biochemical sensing. Nat Mater. 2014;13:400–8.
106. Liu D et al. Effects of lanthanum on growth and accumulation inroots of rice seedlings. Plant Soil Environ. 2013;59:196–200.
107. Faheed F et al. Physiological and ultrastructural studies on calciumoxalate crystal formation in some plants. 2013;139–152.
108. Shyam R, Aery N. Effect of cerium on growth, dry matter produc-tion, biochemical constituents and enzymatic activities of cowpeaplants [Vigna unguiculata (L.) Walp.]. J. soil Sci. plant Nutr.2012;12:1–14.
109. Wang X et al. Lanthanum- and cerium-induced oxidative stress insubmerged Hydrilla verticillata plants. Russ J Plant Physiol.2007;54:693–7.
110. Babula P et al. Lanthanum rather than cadmium induces oxidativestress and metabolite changes in Hypericum perforatum. J HazardMater. 2015;286:334–42.
111. Xu Q et al. Laboratory assessment of uptake and toxicity of lan-thanum (La) in the leaves of Hydrocharis dubia (Bl.) Backer.Environ Sci Pollut Res. 2012;19:3950–8.
112. Zeng Q et al. Phytotoxicity of lanthanum in rice in haplic acrisolsand cambisols. Ecotoxicol Environ Saf. 2006;64:226–33.
113. Wu M et al. Alleviation of cadmium toxicity by cerium in riceseedlings is related to improved photosynthesis, elevated
antioxidant enzymes and decreased oxidative stress. PlantGrowth Regul. 2014;74:251–60.
114. ZhouM et al. Improvement of cerium of photosynthesis functionsof maize under magnesium deficiency. Biol Trace Elem Res.2011;142:760–72.
115. Wang L-F. Photosystem 2 photochemistry and pigment composi-tion ofDicranopteris dichotomaBernh under different irradiances.African J Biotechnol. 2011;10:13453–60.
116. Wang LF et al. Photosystem 2 activities of hyper-accumulatorDicranopteris dichotoma Bernh from a light rare earth elementsmine. Photosynthetica. 2006;44:202–7.
117. Wang X et al. Cerium toxicity, uptake and translocation inArabidopsis thaliana seedlings. J Rare Earths The ChineseSociety of Rare Earths. 2012;30:579–85.
118. Wang L et al. Combined effects of lanthanum (III) chloride andacid rain on photosynthetic parameters in rice. Chemosphere.2014;112:355–61.
119. Wang L et al. Effects of terbium (III) on signaling molecules inhorseradish. Biol. Trace Elem. Res. 2014;122–129.
120. Zhao J et al. High concentration of gadolinium ion modifyingisolated rice mitochondrial biogenesis. Biol Trace Elem Res.2013;156:308–15.
121. Guo X et al. Distribution and translocation of 141Ce (III) in horse-radish. Ann Bot. 2007;100:1459–65.
122. Huang G et al. Combined effects of lanthanum(III) and elevatedultraviolet-b radiation on root nitrogen nutrient in soybean seed-lings. Biol Trace Elem Res. 2014;163:224–34.
123. Hu X et al. Bioaccumulation of lanthanum and cerium and theireffects on the growth of wheat (Triticum aestivum L.) seedlings.Chemosphere. 2002;48:621–9.
124. Shtangeeva I, Ayrault S. Effects of Eu and Ca on yield andmineralnutrition of wheat (Triticum aestivum) seedlings. Environ ExpBot. 2007;59:49–58.
125. Fu Y et al. Bioaccumulation, subcellular, and molecular localiza-tion and damage to physiology and ultrastructure in Nymphoidespeltata (Gmel.) O. Kuntze exposed to yttrium. Environ. Sci.Pollut. Res. 2014;21:2935–2942.
126. Diatloff E et al. Effects of lanthanum and cerium on the growthand mineral nutrition of corn and mungbean. Ann Bot. 2008;101:971–82.
127. Guo W et al. Effects of arbuscular mycorrhizal fungi on maize(Zea mays L.) and sorghum (Sorghum bicolor L. Moench) grownin rare earth elements of mine tailings. Appl. Soil Ecol. 2013;72:85–92.
128. Kötschau A et al. Sunflower (Helianthus annuus): phytoextractioncapacity for heavy metals on a mining-influenced area inThuringia, Germany. Environ. Earth Sci. 2014;2023–2031.
129. Peng X, He JY. The inhibitory effect of Ca2+ on the flavonoidproduction of Tetrastigma hemsleyanum suspension cells inducedby metal elicitors. Vitr Cell Dev Biol Plant. 2013;49:550–9.
130. Wang CR et al. Antioxidant and prooxidant effects of lanthanumions on Vicia faba L. seedlings under cadmium stress, suggestingecological risk. Environ. Toxicol. Chem. 2012;31:1355–62.
131. Zhang X et al. Roles of horseradish peroxidase in response toterbium stress. Biol Trace Elem Res. 2014;161:130–5.
132. Ma JJ et al. Effects of spray application of lanthanum and ceriumon yield and quality of Chinese cabbage (Brassica chinensis L)based on different seasons. Biol Trace Elem Res. 2014;160:427–32.
133. Espindola MCG et al. Efeito do cério na qualidade fisiológica desementes de milho e no desempenho agronômico das plantas.Biosci J. 2013;29:1501–7.
134. Shtangeeva I. Europium and cerium accumulation in wheat andrye seedlings. Water Air Soil Pollut. 2014;225:1964–73.
135. Wang J et al. Effects of lanthanum on abscisic acid regulation ofroot growth in Arabidopsis. J Rare Earths. 2014;32:78–82.
Curr Pollution Rep (2016) 2:28–50 49
136. Luo J et al. Changes in endogenous hormone levels and redoxstatus during enhanced adventitious rooting by rare earth elementneodymium of Dendrobium densiflorum shoot cuttings. J RareEarths. 2008;26:869–74.
137. Liu M, Hasenstein KH. La3+ uptake and its effect on the cytoskel-eton in root protoplasts of Zea mays L. Planta. 2005;220:658–66.
138. Xia CF et al. Ce(III)-Induced rice mitochondrial permeability tran-sition investigated by spectroscopic and microscopic studies. BiolTrace Elem Res. 2013;152:284–91.
139. Ozaki Tet al. Beneficial effect of rare earth elements on the growthof Dryopteris erythrosora. J Plant Physiol. 2000;156:330–4.
140. Gao J et al. Membrane permeability transition and dysfunction ofricemitochondria effected by Er(III). JMembr Biol. 2014;248:39–46.
141. Yang Q et al. Toxic effects of heavy metal terbium ion on thecomposition and functions of cell membrane in horseradish roots.Ecotox Environ Safe. 2015;111:48-58.
142. Shen Y et al. Eucalyptus tolerance mechanisms to lanthanum andcerium: subcellular distribution, antioxidant system and thiolpools. Chemosphere. 2014;117:567–74.
143. Duarte ACO Efeito de elementos terras raras nas característicasanatômicas , fisiológicas e nutricionais de Pistia stratiotes L .(Araceae) e Zea mays L . (Poaceae). Universidade Federal deLavras; 2015.
144. Turra C et al. Rare earth elements in citrus production systems. JPlant Nutr. 2013;36:762–71.
145. Brioschi L et al. Transfer of rare earth elements (REE) from naturalsoil to plant systems: implications for the environmental availabil-ity of anthropogenic REE. Plant Soil. 2013;366:143–63.
146. Gao Yet al. Research of the entry of rare earth elements Eu3+ andLa3+ into plant cell. Biol Trace Elem Res. 2003;91:253–65.
147. Xu X et al. Accumulation of rare earth elements in maize plants(Zea mays L.) after application of mixtures of rare earth elementsand lanthanum. Plant Soil. 2003;252:267–77.
148. Liu D et al. The effects of cerium on the growth and some antiox-idant metabolisms in rice seedlings. Environ Sci Pollut Res.2012;19:3282–91.
149. Xie ZB et al. Effect of lanthanum on rice production, nutrientuptake, and distribution. J Plant Nutr. 2002;25:2315–31.
150. Huang GR et al. Combined effects of lanthanum(III) and elevatedultraviolet-B radiation on root growth and ion absorption in soy-bean seedlings. Environ Sci Pollut Res. 2014;21:3621–33.
151. Wang L et al. Toxic effect of heavy metal terbium ion on cellmembrane in horseradish. Chemosphere. 2010;80:28–34.
152. Haley TJ et al. Pharmacology and toxicology of dysprosium, hol-mium, and erbium chlorides. Toxicol Appl Pharmacol. 1966;37–43.
153. Haley TJ et al. Toxicological and pharmacological effects of gad-olinium and samarium chlorides.pdf. Brit. J. Pharmacol.1961;526–532.
154. Bruce DW et al. The acute mammalian toxicity of rare earth ni-trates and oxides. Toxicol Appl Pharmacol. 1963;5:750–9.
155. Lachine EE et al. Toxicity, tissue distribution and excretion of46ScCl3 and 46Sc-EDTA in mice. Int J Appl Radiat Isot.1976;27:373–7.
156. Hirano S, Suzuki KT. Exposure, metabolism, and toxicity of rareearths and related compounds. Environ Health Perspect.1996;104:85–95.
157. Gonzalez V et al. Environmental fate and ecotoxicity of lantha-nides: are they a uniform group beyond chemistry? Environ Int.2014;71:148–57.
158. Pagano G et al. Health effects and toxicity mechanisms of rareearth elements—knowledge gaps and research prospects.Ecotoxicol Environ Saf. 2015;115:40–8.
159. Rim KT et al. Toxicological evaluations of rare earths and theirhealth impacts to workers: a literature review. Saf Health Work.2013;4:12–26.
160. USEPA. Toxicological review cerium oxide and cerium com-pounds. United States Environment Protection Agency. 2009.http://www.epa.gov/iris/toxreviews/1018tr.pdf
161. TERA. Development of reference doses and reference concentra-tions for lanthanides. prepared for the Bureau of LandManagement, National Applied Resource Sciences Center byToxicology Excellence for Risk Assessment. 1999. http://www.tera.org/Publications/
162. ITER. Report on chemical name: lanthanum carbonate, CASRegistry Number: 587-26-8, Noncancer oral risk values —level2. International Toxicity Estimates for Risk. https://iter.ctc.com/publicURL/p_report_l2_non.cfm?crn=587-26-8&type=NCO.Accessed 09Jul 2015.
163. USEPA. Rare earth elements : a review of production , processing, recycling , and associated environmental issues.2012. http://nepis.epa.gov/Adobe/PDF/P100EUBC.pdf
164. Ono FB et al. Arsenic bioaccessibility in a gold mining area: ahealth risk assessment for children. Environ Geochem Health.2012;34:457–65.
165. Toujaguez R et al. Arsenic bioaccessibility in gold mine tailings ofDelita. Cuba J Hazard Mater. 2013;262:1004–13.
166. Wei B et al. Rare earth elements in human hair from a mining areaof China. Ecotoxicol Environ Saf. 2013;96:118–23.
167. Hao Z et al. Levels of rare earth elements, heavy metals and ura-nium in a population living in Baiyun Obo, Inner Mongolia,China: a pilot study. Chemosphere. 2015;128C:161–70.
168. Wang Z et al. Effects of rare-earth fertilizers on the emission ofnitrous oxide from agricultural soils in China. Atmos Environ.2008;42:3882–7.
169. Li J et al. Effects of the accumulation of the rare earth elements onsoil macrofauna community. J Rare Earths. 2010;28:957–64.
170. Cheng J et al. Rare earth element transfer from soil to navel orangepulp (Citrus sinensis Osbeck cv. Newhall) and the effects on in-ternal fruit quality. PLoS ONE. 2015;10:e0120618.
171. Thomas PJ et al. Rare earth elements (REEs): effects on germina-tion and growth of selected crop and native plant species.Chemosphere. 2014;96:57–66.
172. USEPA. Guidelines for ecological risk assessment. United StatesEnvironmental Protection Agency; 1998. http://www2.epa.gov/sites/production/files/2014-11/documents/eco_risk_assessment1998.pdf.
173. Haley TJ et al. Pharmacology and toxicology of dysprosium, hol-mium, and erbium chlorides. Toxicol Appl Pharmacol. 1966;8:37–43.
174. Haley TJ et al. Toxicological and pharmacological effects of gad-olinium and samarium chlorides. Br J Pharmacol Chemother.1961;17:526–32.
175. Haley TJ et al. Pharmacology and toxicology of terbium, thulium,and ytterbium chlorides. Toxicol Appl Pharmacol. 1963;5:427–36.
50 Curr Pollution Rep (2016) 2:28–50