rapid trichioroacetic acid extraction and liquid chromatography
TRANSCRIPT

Rapid Trichioroacetic Acid Extraction and Liquid Chromatography Methodfor Determination of Nicotinamide in Commercial Cereals
Denis E. LaCroix,' Wayne R. Wolf.' 2 and Albert L. Kwansa3
ABSTRACT
Cereal Chem. 82(3):277-281
Determination of niacin in fortified infant and dairy products has beenaccomplished using a variety of analytical liquid chromatography (LC)methods. Applications of these LC techniques to other food matricessuffer due to the presence of endogenous absorbing peaks at 260 nm thatco-chromatograph with the nicotinic acid and nicotinamide vitamcrs. Wehave successfully adapted the LC method of Woollard and Indyk for thedetermination of nicotinamide in reference and commercial cereal products.Unbound nicotinamide in fortified cereal was extracted with 0.6M tn-chloroacetic acid and chromatographed on a C, 5 reversed-phase columnusing a mobile phase of 75 1/c methanol and water (pH 2.8, with formicacid) with sodium dioctvlsulphosuccinate (0.1 17) as the ion-pairing agent.Using Spectral Analysis ChromQuest software, a three-dimensional view
Niacin (vitamin B-3) occurs in foods as either nicotinic acid oras nicotinamide, which is the most commonly used form forenriching foods for dietary supplementation. Niacin measurementin food matrices for food labeling regulatory purposes is generallydone using either microbiological (Official Method of Analysis,AOAC International 2000) or chemical analysis methods (Eiten-miller and Landen 1999).
More robust liquid chromatography (LC) methods have beenreported as replacement of the labor-intensive microbiologicalmethods for these determinations. LC methods for nicotinic aciddetermination usually involve detection in the ultraviolet (UV)part of the spectrum at 260 nm (Tyler 1980: Krishan, et al 1999).Application of LC for niacin analysis has been reported insupplemented infant formulas and cereals (Tyler et al 1980;Woollard and Indyk 1997. 2002: Krishnan 1999). Niacin analysisby LC in complex food matrices is complicated by the presenceof endogcnous compounds that absorb at 260 nm and may inter-fere with the purity of the LC peak. We have employed solid phaseextraction (SPE) as a sample clean-up procedure to remove thesematerials before analysis of infant formula and cereal samples fornicotinic acid by LC (LaCroix et al 1999, 2001, 2002a). TheSPE/LC method was successfully applied for determination ofniacin in wheat flour reference materials, but was unsuccessful forcommercial all-purpose wheat flour due to the co-elution ofendogenous absorbing LC peaks at 260 nm (LaCroix 1999).
Because nicotinamide is the main form of niacin added toformulated or supplemented products. Woollard and Indyk (1997.2002) have developed a trichloroacetic acid (TCA) extraction ofnicotinamide in milk products prior to LC analysis. Our objectivein this study was to investigate the application of Woollard's TCA/LC
'Food Composition Laboratory, Beltsville Human Nutrition Research Center (BHNRC).United States Department of Agriculture-Agricultural Research Service (USDA-ARS). Buildin g 161, Beltsvitle, MD 20705-2350. Names are necessary to reportfactuall y oil data; however, the USDA neither guarantees nor warrantsthe standard of the product, and the use of the name by the USDA implies noapproval of the product to the exclusion of others that may also be suitable.
2 Corresponding author. Phone: 301-504-8927. Fax: 301 .504 .8314. E-mail:[email protected],,govStudent intern. Eleanor Roosevelt Hi g h School. Greenbelt. MD. Current Address:University of Wisconsin. Madison, WI.
Dot: 10.1094/CC-82-0277This article is in the public domain and not copyrightable. It may be freely re-printed with customary crediting of the source. AACC International. Inc.. 2005.
showed only nicotinamide under the LC peak. Similarity index spectralmatches of nicotinamide standard and the LC peak were 100 1/c, indi-cating the absence of interferences. Nicotinamide recoveries for the refer-ence cereals of VMA 195 and VMA 399 (from AACC International. St.Paul. MN) and GM 19B (from General Mills. Medallion Laboratories,Minneapolis. MN) were 90-103% of assigned value. Experimental valuesfor oat, corn, rice, and bran cereals showed that actual niacin content incommercial cereals may he significantly above (111-170%) declaredlabel values. Because manufacturers may fortify at a level higher than thedeclared label level to ensure shelf life compliance, these data do havesignificant implications when making precise estimates of niacin intakebased on label claims.
method for the qualitative and quantitative analysis of commercialcereal products for nicotinantide. Qualitative evaluation of the puri-ty of the nicotinamide LC peak is done by spectral analysis.Verification and validation of the quantitative determination ofnicotinamide content is done by using statistical protocols such aslinear regression analysis of samples spiked with nicotinamideusing the method of standard additions (MOSA) (Cardone 1983a.b:Mishalanie 1996).
Evaluation of the purity of the chromatographic peak is usuallydone by visual inspection of the single component LC peak as a2-D (single wavelength absorbance vs. time) parameter. Use of amultiwavelength photodiode array detector (PDA), combined withappropriate computer software (manual A009651, ThermoQucst,San Jose. CA), allows for scanning the entire spectrum at 190-800nm. During the course of an LC run, these systems allow forrepetitive, multiwavelength spectral scans of the desired wave-length range for niacin at 220-300 rim to be obtained and proces-sed. Spectral analysis of the subsequent views of the spectral scansallows definitive visual information of the presence of one ormore compounds tinder an LC peak. These spectral analysisfeatures can examine how clean the LC peak is (Lacroix et al2002b).
LC methodology, combined with the use of appropriate matchingreference materials (Tanner et al 1993: Wolf et al 2001) canprovide high-quality data for nutrient content of foods that can beconfidently incorporated by the end user in food compositionaltables, to satisfy food labeling requirements, and to prepareformulated diets (Mishalanie 1996: Wolf and lyengai' 1997).
MATERIALS AND METHODS
MaterialsThree types of cereal reference materials were used iii this study.
Two cereals (VMA 195 and VMA 399) were obtained from AACCInternational (St. Paul. MN) and one cereal (GMI913) was ob-tamed from Medallion Laboratories (General Mills, Minneapolis,MN). Samples representing a variety of commercial cereal ma-trices, including four manufacturers' brands, were purchased fromlocal supermarkets before their expiration dates. A total of sevensamples including two separate brands of oat and rice cereals, andone brand each of corn, wheat, and bran cereal products werechosen. The cereals were ground dry in a blender and stored inplastic bags with no further storage precautions taken.

300
200E
100
200250200150100
10.010.5
W^
PP
220
290 nm130
Sample Extraction for LC AnalysisThe dry cereal powders were accurately weighed to give a final
concentration of 100-200 tg of nicotiiiarnide per analysis basedon the declared label value. Sampling constant studies show thatsignificant analytical errors can result from using sample sizesbelow these levels (Wolf and LaCroix 1998). The weighed drycereal powders were suspended in 0.6M TCA (15.0 mL). and thentcotinaniide was extracted into the supernatant by shaking for 15min using a mechanical wrist shaker. The suspension was thencentrifuged for 20 mm at 1000 x g. An aliquot of the supernatantwas filtered using a 0.45-i.tm syringe filter disk to remove minuteparticles before chromatography and made up to a volume of 30mL. A calibrating standard solution of nicotinaniide (99+% purity,Sigma Chemical Co) was prepared in the same manner as thecereal products with each batch of samples (Woollard 2002).
LC InstrumentationAn LC (ThermoSeparation Products [TSP]) system equipped
with a photodiode array detector (PDA) (UV6000LP) and ThermoQuest software was used. Nicotinarnide was separated from en-dog enous 260 urn absorbing components using a mobile phase ofmethanol (250 mL) and formic acid (10 mL) diluted to l.OL withdemineralized water and adjusted to pH 2.7-2.9 with potassiumhydroxide (KOH). Dioctyl sulfosuccinatc (1.0 g) was added to themobile phase solution as an ion-pairing agent (Sood 1977;Woollard 2002). Reagents were obtained from Aldrich ChemicalCo. Mobile phase flow rate was 0.6 niL/mm, with an injection of100 tL sample size. The LC column used was a Vydac 201TPCareversed-phase (150 x 4.6 mm, particle size 5) (The SeparationsGroup, Hesperia, CA). Quantitative analysis of nicotinamide wasdetermined at the LC peak maximum of 260 non using a FDA.
Spectral AnalysisThe spectral analysis feature of the ChrornQuest software (La-
Croix et al 2002b) was used to determine the purity of the LCanalyte peak by comparison to the standard nicotinarnide peak. A
0 5 10 15 20Time (mm)
Fig. 1. Liquid chromatography results for trichloroacetic acid (TCA)extract of reference cereal VMA- 195.
Time (mm)
Fig. 2. 3-D view of nicotinamide liquid chromatography peak fromtrichloroacetic acid (TCA) extract of reference cereal VMA-195.
278 CEREAL CHEMISTRY
three-dimensional configurational analysis (wavelength, absor-bance, and time) is obtained by means of a generated 3-D spectralscan over the spectral range of 220-300 nm. A similarity index(SI) is a spectral match of the library nicotinamidc standard withthe LC analyte peak of interest. A peak purity index (PPI) is thealgorithm of the internal symmetry of the LC peak shape relativeto the apex of the LC peak.
Statistical AnalysisAnalytical response characteristics of the nicotinamide standard
curves were determined by linear regression analysis (Wilson1970; Cardone 1983a: Mishalanie 1996). Nicotinamide content incereal reference materials and commercial cereal products wasdetermined by measuring the peak area at 260 nm and by usinglinear regression analysis (LaCroix and Wolf 2001, 2002). Allassumptions of linear regressions analysis were met. The nicotin-amide data obtained was then examined for outliers using theoutlier statistical criteria for extreme values (Dixon and Massey1957).
Method performance characteristics examined by the method ofstandard additions (MOSA) for the VMA reference samples andfor the commercial Oat-I sample were 1) instrument response asa function of concentration, and 2) ratio of found to expectedamount of nicotinamide added to the cereal matrix. MOSA involvesthe addition of increasing amounts of the analyte to equivalentsamples of the test matrix. The slope of the resulting plot of theaddition-response curve of the analyte (nicotinamide) in thecereal matrix gives information about the presence or absence oferrors of the analytical system due to matrix effects (Cardone1983a, 1986; Mishalanie 1996).
RESULTS AND DISCUSSION
Spectral AnalysisVisual 3-D inspection of multiple wavelength scans of an LC
peak combined with spectral analysis software is a useful tool toidentify presence or absence of components with retention timessimilar to that of the analyte (LaCroix et al 2002b). The softwareprogram also allows for calculation of the SI by means of alibrary spectral match that compares the spectra of an LC peak ofthe analyte with that of the standard. Figures 1-3 arerepresentative of the data obtained for all samples examined inthis study. Figure 1 is the LC chromatogram of the referencecereal VMA-195. The nicotinamide peak is a single peak at 260nm, which is resolved from potentially interfering endogenouscompounds that also absorb at 260 nm. Other samples showedsimilar chromatograms.
Figure 2 is a multiwavelength spectra of the nicotinamide peakof the VMA-95 sample. Visual inspection of the 3-D spectra ofthe nicotinainide LC peak obtained from both cereal matrices
Similarity Index: 0.9999 Rt: 10.55 mm
220240260280300nm
Fig. 3. Similarity index (SI) for nicotinamide standard and referencecereal VMA-195.
480
400
320
0U- 240ci
EC00z
80
clearly show that the nicotinamide peak is free from interferingendogenous peaks at 260 nrn. Other reference and commercialsamples showed similar spectra.
Figure 3 shows a spectral library SI match of 0.999 for theVMA-195 reference sample relative to the spectra of the nicotin-amide standard.
Performance CharacteristicsThe performance characteristics of an analytical method are
parameters for assessing the suitability of a method for any givenpurpose based on experimentally determined quantitative values(Wilson 1970). Thus, performance characteristics refer to the qual-ity of the data obtained by the method of Mishalanie (1996). Themethod performance characteristics examined in this study wereI) effect of instrument response as a function of increased nico-tinamide concentration in the matrix as determined by the methodof standard additions, and 2) the ratio of nicotinamide found tothe amount of nicotinamide added to the cereal matrix (Cardone1983b).
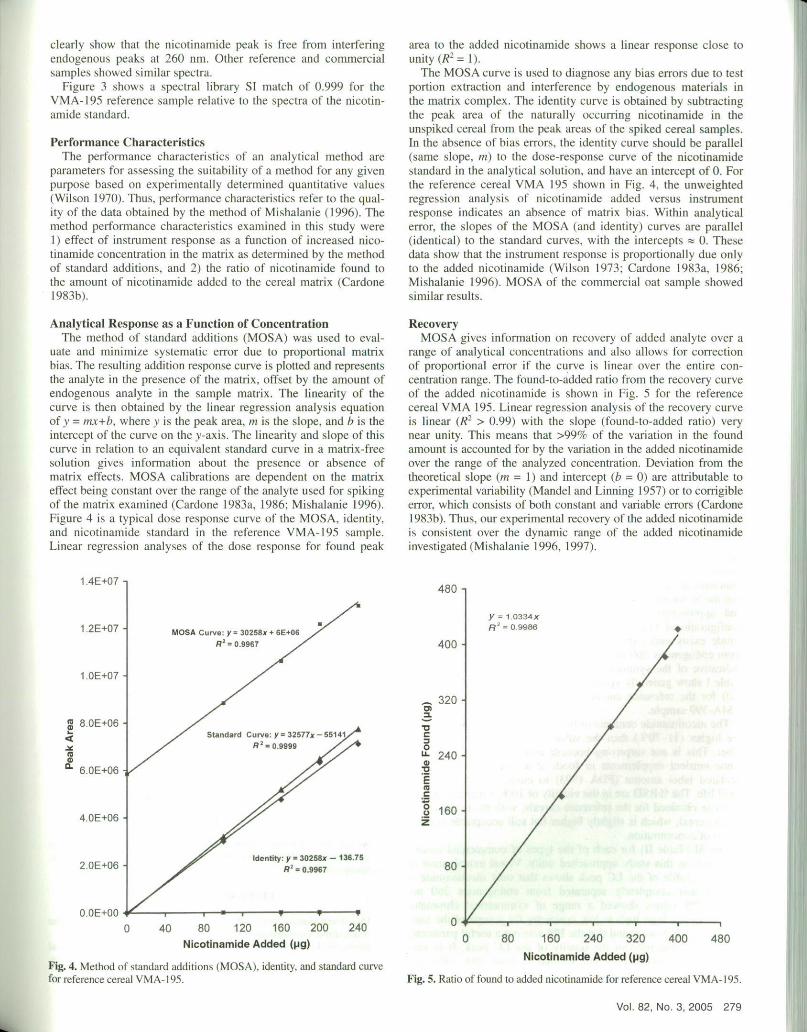
Analytical Response as a Function of ConcentrationThe method of standard additions (MOSA) was used to eval-
uate and minimize systematic error due to proportional matrixbias. The resulting addition response curve is plotted and representsthe analyte in the presence of the matrix, offset by the amount ofendogenous analyte in the sample matrix. The linearity of thecurve is then obtained by the linear regression analysis equationof' = mx+b, where v is the peak area, m is the slope, and b is theintercept of the curve on the y-axis. The linearity and slope of thiscurve in relation to an equivalent standard curve in a matrix-freesolution gives information about the presence or absence ofmatrix effects. MOSA calibrations are dependent on the matrixeffect being constant over the range of the analyte used for spikingof the matrix examined (Cardone 1983a, 1986: Mishalanie 1996).Figure 4 is a typical dose response curve of the MOSA. identity,and nicotinamide standard in the reference VMA-195 sample.Linear regression analyses of the dose response for found peak
area to the added nicotinamide shows a linear response close tounity (R1).
The MOSA curve is used to diagnose any bias errors due to testportion extraction and interference by endogenous materials inthe matrix complex. The identity curve is obtained by subtractingthe peak area of the naturally occurring nicotinamide in theunspiked cereal from the peak areas of the spiked cereal samples.In the absence of bias errors, the identity curve should be parallel(same slope, in) to the dose-response curve of the nicotinamidestandard in the analytical solution, and have an intercept of 0. Forthe reference cereal VMA 195 shown in Fig. 4, the unweightedregression analysis of nicotinamide added versus instrumentresponse indicates an absence of matrix bias. Within analyticalerror, the slopes of the MOSA (and identity) curves are parallel(identical) to the standard curves, with the intercepts 0. Thesedata show that the instrument response is proportionally due onlyto the added nicotinaniide (Wilson 1973: Cardone 1983a, 1986;Mishalanie 1996). MOSA of the commercial oat sample showedsimilar results.
RecoveryMOSA gives information on recovery of added analyte over a
range of analytical concentrations and also allows for correctionof proportional error if the curve is linear over the entire con-centration range. The found-to-added ratio from the recovery curveof the added nicotinamide is shown in Fig. 5 for the referencecereal VMA 195. Linear regression analysis of the recovery curveis linear (R2 > 0.99) with the slope (found-to-added ratio) verynear unity. This means that >99c/r of the variation in the foundamount is accounted for by the variation in the added nicotinamideover the range of the analyzed concentration. Deviation from thetheoretical slope (in = 1) and intercept (b = 0) are attributable toexperimental variability (Mandel and Linning 1957) or to corrigibleerror, which consists of both constant and variable errors (Cardone1983b). Thus, our experimental recovery of the added nicotinamideis consistent over the dynamic range of the added nicotinamideinvestigated (Mishalanie 1996. 1997).
1.4E+07
1.2E+07
1 .OE+07
8.OE+06
ILci
6.OE+06
4.OE+06
2.OE+06
0.OE+O0
04080120160200240Nicotinamide Added (pg)
Fig. 4. Method of standard additions (MOSA), identity, and standard curvefor reference cereal VMA-] 95.
080160240320400480Nicotinamide Added (jig)
Fig. 5. Ratio of found to added nicotinaniide for reference cereal VMA-l95.
Vol. 82. No. 3, 2005 279

% AssignedValue
98.2103.790.7
SimilarityIndex
0.9490.9980.998
Peak PurityIndex
0.9800.7600.892
No. ofAnalyses
24197
TABLE INicotinamjde Values Obtained from Reference Cereals
ReferenceReference ValueAnalyzed ValueStandard% RelativeCereal (pglg)Avg. (ig!g)DeviationSDVMA-19580' ± 20.2176.8"9.645.45VMA-399749.6" ± 6.54777.6"55.927.19GM-19B220.2 ± 15.5199.520.210.44
Microbiological method.Assigned value. AACC International, St. Paul, MN.Analyzed value. Medallion Laboratories, Minneapolis. MN.
"MOSA value VMA-195 = 181.2: VMA-399 749.4,
TABLE HNicotinamide Values Obtained from Commercial Cereals
Label ValueAnalyzed ValueStandard% Relative% of LabelSimilarity Peak PurityNo. of(pg/g)Avg. (ig/g)Deviation (jaglg)SDValueIndexIndexDeterminations113.10.9570.993 17119.21.0000.957 12170.10.9980.888 1 3121.41,0000.763 9123.30.9970.794 1 0111.30.9960.484'10121.20.9970.384'10
Niacin value on cereal box label based per Code of Federal Regulations (CFR): 1.0 1.9 at 20 mg/day Recommended Daily Allowence (RDA).MOSA value for oat- I = 191.3 RgJg.Asymmetrical peak shape.
CommercialCereal
Oat-I"Oat-2CornWheatRice-IRice-2Bran
167 188.831.4916.6867 199.0 19.759.93
180 306.1 29.929.77667 809.833.414.13167 205.9 12.656.14152 169.2 17.8110.53167 202.324.0911.91
Experimental Niacinamide LevelsUsing this LC method. ntcotinarnide content of the three refer-
ence cereals and seven commercial cereals are listed in Tables Iand II, respectively.
The nicotinamide values were calculated from the daily standardlinear calibration curves of the peak area of the chromatographicpeak. Recovery values of nicotinamide from the reference cerealswere 100% (Table I) and are within the assigned values thatwere obtained by microbiological assay for these samples. Earlierresearch (Lacroix et al 1999) has shown that there is no statisticaldifference in niacin values as determined b y HPLC and micro-biological assay. The %RSD of the analytical method at 10% areindicative of the robustness of the method. Spectral analysis showsthat the SI for each nicotinamide chromatographic peak was >95C/cand approached unity. This parameter, along with the 3-Dconfigurational visualization, clearly showed that only nicotin-amide exists under the LC peak and it is completely resolvedfrom endogenous 260 nm absorbing peaks. The PPI parameter isindicative of the symmetry of the LC peak shape. The data inTable I show generally symmetric chromatographic peaks (PPI1.0) for the reference cereals, with some slight tailing for theVMA-399 sample.
The nicotinaniide contents of the commercial cereals (Table II)are higher (11-70%) than the value declared on the cereal boxlabel. This is not surprising because manufacturers may fortifysome nutrient supplements in foods at a level higher than thedeclared label amount (FDA 1993) to ensure compliance withshelf life. The %RSD are in the vicinity of 10%., which are similarto those obtained for the reference cereals, with the exception ofOat-I cereal, which is sli ghtly higher hut still acceptable at theselevels of concentration
The SI (Table II) for each of the types of commercial cerealsexamined in this study approached unity. Visual examination ofthe 3-D profile of the LC peak shows that only nicotinamide ispresent and completely separated from endogenous 260 nmpeaks. PPI values showed a range of symmetrical chromato-graphic peaks from high to low symmetry for several of the sam-ples. In general, we found that the PPI was not a useful parameterfor the determination of the quality of the LC peak. It is verysensitive to slight tailing and seemed to have little effect onresulting quantitatiori.
280 CEREAL CHEMISTRY
CONCLUSIONS
A rapid TCA extraction and LC method for the determinationof the nicotinamide content of a variety of commercial cerealswas evaluated. The inclusion of reference materials with anassigned nicotinamide content as an integral part of the methodverification and validation process gives the user confidence in thequality of the data obtained. Spectral analysis over a wavelengthrange of 220-300 rim and visual 3-D configurational analysesprovides further definitive information that only nicotinamideexists under the LC peak. The spectrum library match (SI) ofnicotinamide in standard and cereal matrices clearly shows thatthe LC peak obtained is completely resolved fi-orn interferingendogenous compounds at 260 tim. The MOSA and recoverycurves of nicotinamide added to the cereal matrix demonstratethat the instrument response is solely due to the proportionalincrease of the added analyte. Use of the combination of thesetools of statistical and spectral analysis generates information asto the robustness of the method and to the quality of the dataobtained.
Experimental values for oat, corn, rice, and bran commercialcereals were 11 1-170% of label value, showing that actual niacincontent in commercial cereals may he significantly above declaredlabel values. These levels are not surprising because manufacturersmay fortify some added nutrients in foods at if higher thanthe declared label level to ensure compliance over a shelf life.These data do have significant implications when making preciseestimates of niacin intake based upon label claims.
ACKNOWLEDCMEN''S
We gratefully acknowledge the generous gift of the (.iM-19B referencecereal from Jon Devris and Brad Aeberg, Medallion Laboratories,Minneapolis, MN.
LITERATURE CITED
AOAC International. 2000. Official Methods of Analysis. 17th Ed. TheAssociation: Gaithershurg. MD.
Cardone, M. J. 1983a. Detection and determination of error in analyticalmethodolo gy. 1. In the method verification pmgra,n. J .AO.AC lot.66:257-1282).

CaidOfle. M. J. I9S31). Dctccuon and deicrininaijisi ol cins in aiiaIicaImethodology. H. Correction for corrigible error in the course of realsample analysis. J. AOAC ml. 66:1283-1294.
Cardone. M. J. 1986. New technique in chemical assay calculations. 2.Correct solution to the model problem and related concepts. Anal.Chem. 58:438-445.
Dixon. W. J.. and Massey. F. J., Jr. 1957. Introduction to StatisticalAnalysis. McGraw-Hill: New York.
Fitenmiller, R. R.. and Landen. W. 0. 1998. Vitamin Analysis for theHealth and Food Sciences. CRC Press: Boca Raton. Ft..
FDA. 1993. Nutrition Labeling Manual: A Guide for Developing andUsing Databases. U.S. Food and Drug Administration: Washington DC.
Krishnan, P. D., Mahmud. 1.. and Matliees. D. 1999. Postcolumn tluoro-metric LC procedure for determination of niacin content of cereals.Cereal Chem. 76:512-518.
LaCroix. D. E.. and Wolf. W. R.. 2001. Determination of niacin in infantformula by solid-phase extraction and anion-exchange liquid chroma-tography. J. AOAC mt. 84:789-804.
LaCroix, D. F., Wolf, W. R.. and Vanderslice. J. T., 1999. Determinationof niacin and wheat flour by anion-exchange liquid chromatographywith solid-phase extraction cleanup. J. AOAC Int. 82:128-132.
LaCroix, D. E.. Wolf, W. R.. and Chase. G. W., Jr. 2002a. Determinationof niacin in infant formula by solid-phase extraction/liquid chroma-tography: Peer-verified method performance-interlaboratory validation.J. AOAC Int. 85:654-664.
LaCroix. D. F.., Wolf, W. R.. and I-lindsley. T. H. 2002h. Evaluation ofniacin LC methods by diode array/spectral analysis. Anal. Lett.35:2187-2198.
Mandel. L.. and Linning. F. J. 1957. Study of accuracy in chemical analy-
siuiiic Iiiicar C,111hidlion Lur\c. .\ii;iI. ( 11cin.)..-).Mishalanie, E. A. 1996. lntralaboratory Analytical Method Validation.
AOAC International: Gaithersburg. MD.Mishalanie, E. A. 1997. Basic Statistics for Analytical Science. AOAC
International: Gaithersburg. MD.Sood. S. P.. Wittmer. D. P.. Ismaicl. S. A.. and Haney. W. G. 1977. Simul-
taneous high-pressure liquid chromatographic determination of niacinand nicotinamidc in multivitamin preparations: Reversed-phase, ionpairing approach. J. Pharm. Sci. 66:40-42.
Tanner, J. T., Wolf. W. R.. and Horwitz. W. 1993. Nutritional metrology:The role of reference materials in improving quality of analyticalmeasurements and data on food components. Pages 99-104 in: Qualityand Accessibility of Food-Related Data. H. Greenfield, ed. AOACInternational: Gaithershurg, MD.
Tyler, T. A.. and Shrago. R. R. 1980. Determination of niacin in cerealsby LC. J. Liquid Chromatogr. 3:269-277.
Wilson, A. L. 1970. The performance characteristics of analyticalmethods. L Talanta 17:21-29.
Wolf. W. R.. and lyengar. V. 1997. Food-based reference materials. FoodTesting Anal. 2:27-31.
Wolf, W. R.. and LaCroix. D. F. 1998. Sampling constants for niacincontent in standard reference material 1846 infant formula. Fresenius J.Anal. Chem. 360:459-464.
Wolf, W. R., DeVries. J., and lkcns, W. 2001. Matching referencematerials with AOAC International methods of analysis. Fresenius J.Anal. Chem. 371:300-306.
Woollard, D. C.. and Indyk. H. F. 2002. Rapid determination of thiamine.riboflavin, pyridoxine, and nicotinamide in infant formulas by liquidchromatography. J. AOAC hit. 85:945-951.
[Received December 30, 2003. Accepted December 2, 2004.1
Vol. 82, No. 3, 2005 281