rapid proteomic analysis using 1-mm scale chromatography ...€¦ · rapid proteomic analysis using...
TRANSCRIPT

[ TECHNOLOGY BRIEF ]
1
GOALDemonstrate the applicability of 1 mm scale chromatography for proteomic analyses, exhibiting a six-fold increase in throughput while maintaining similar identification results of that achieved with nanoscale chromatography.
BACKGROUNDToday, there is an increased interest in clinical proteomics and its application for the analysis of large population cohorts. Traditional discovery proteomics typically uses nanoflow chromatography with 75 µm internal diameter columns using a flow rate between 0.2 and 0.5 µL/min, providing the high sensitivity and coverage for complex proteomic digests. However, long gradients and equilibration times are disadvantageous. For one sample, the total run time is typically between 60 and 180 min. Although the design of the LC has been largely improved for usability, for instance with finger tight fittings (i.e., Waters™ ZenFit™ Connectors), nanoscale chromatography remains challenging to use and troubleshoot, restricting its applicability for large cohort analysis. Recently, with improved mass
One millimeter (1 mm) scale chromatography
coupled to the SYNAPT XS using HDMSE analysis
for complex proteomic sample analysis.
spectrometry resolution and sensitivity, microflow scale chromatography using 300 µm column internal diameters with flow rates between 7 and 12 µL/min have been implemented to analyze large cohorts of digested human plasma samples.1,2,3 Here, we show the utility of 1 mm scale chromatography coupled to the SYNAPT™ XS Mass Spectrometer to analyze mid-complexity samples such as E. coli and human plasma digests in a reduced timeframe (i.e., 15-min gradient), while maintaining comparable protein/peptide identifications.
THE SOLUTIONTwo sample types were used to evaluate the 1 mm scale chromatography performance: human plasma and a Waters digested E. coli cytosolic extract (p/n: 186003196).
The human plasma samples corresponding to seven conditions and one pool control (QC) were reduced, alkylated, tryptically digested, and concentrated
Figure 1. Extracted chromatograms representing three E. coli peptides, showing the full width at half-maximum and at 10% with the 1 mm column set-up.
Rapid Proteomic Analysis Using 1 mm Scale Chromatography, Providing the Required Throughput for Large Cohort Studies Sarah Lennon,¹ Christopher J. Hughes,¹ Robert S. Plumb,² and Lee A. Gethings¹¹Waters Corporation, Wilmslow, UK; ²Waters Corporation, Milford, MA, USA

[ TECHNOLOGY BRIEF ]
2
using solid phase extraction (SPE) following the Waters ProteinWorks™ protocol (p/n: 176003688). iRT peptides (Biognosys) were used as an internal reference with 1 µL spiked into 50 µL of sample. The E. coli digest were prepared at a concentration of 1 µg/µL and 100 ng/µl.
The different scales of chromatography used are described in Table 1. The mobile phases consisted of 0.1% formic acid in water (mobile phase A) and 0.1% formic acid in acetonitrile (mobile phase B). Peptides were eluted using a gradient from 3–35% mobile phase B; 3.5 µg of plasma were injected in triplicate (1 mm set-up only). The quantity of E. coli injected for the various column geometries is outlined in Table 1.
Data were acquired on the SYNAPT XS Mass Spectrometer operating in HDMSE (positive ion mode) and processed using Progenesis™ QI for Proteomics v4.2 and Skyline v20.1 (MacCoss Lab, University of Washington, USA).
Three E. coli peptides were extracted at different retention times across the 15-min gradient to show the high chromatographic resolution obtained from 1 mm scale chromatography. Peak widths at full width half-maximum (FWHM) and 10% peak heights were shown to be 0.03–0.04 min and 0.05–0.07 min respectively (Figure 1). Representative chromatograms for each column I.D. are provided in Figure 2. The number of E.coli proteins and peptides identified for each of the columns evaluated are shown in Figure 3. Interestingly, the difference in protein identifications were shown to be minimal with increasing column I.D., while showing increased benefits in terms of throughput,
Figure 2. Chromatograms representing the E. coli digest for all three columns with gradients ranging from 90 min (75 µm) to 15 min (1 mm).
Figure 3. Number of identified E. coli proteins (A) and peptides (B) for the three column diameters (75 µm, 300 µm, and 1 mm) over duplicate replicates. In all cases, data were processed using Progenesis QI for Proteomics (FDR <1%).
Table 1. Chromatographic configurations with associated gradient conditions and E.coli loadings.
Column scale
LC system ColumnColumn
dimensionsFlow rate (µL/min)
Gradient length (min)
E. coli injected amount (µg)
1 mmACQUITY UPLC
I-Class PLUS
ACQUITY UPLC Peptide CSH C18 (p/n: 186006934)
130 Å, 1.7 µm, 1 mm × 100 mm
70 15 5
300 µmACQUITY UPLC
M-Class
nanoEase M/Z Peptide
(p/n: 186009255)
130 Å, 1.7 µm, 300 µm × 100 mm
7 45 1
75 µmACQUITY UPLC
M-Class
nanoEase M/Z HSS T3
(p/n: 186008818)
100 Å, 1.8 µm, 75 µm × 250 mm
0.35 90 0.1
whereby the gradient was reduced by six times from 90 min (75 µm) to 15 min (1 mm).
Excellent chromatographic reproducibility based on 1 mm scale was obtained for the plasma samples and is shown with the overlay of five pooled QC samples (Figure 4). The median coefficient of variation (CV) in retention time for the 11 iRT peptides across all samples was observed to be 0.05%
Waters Corporation 34 Maple Street Milford, MA 01757 U.S.A. T: 1 508 478 2000 F: 1 508 872 1990 www.waters.com
[ TECHNOLOGY BRIEF ]
Waters, The Science of What’s Possible, ACQUITY, UPLC, SYNAPT, ZenFit, Progenesis, and ProteinWorks are trademarks of Waters Corporation. All other trademarks are the property of their respective owners.
©2020 Waters Corporation. Produced in the U.S.A. April 2020 720006833EN TC-PDF
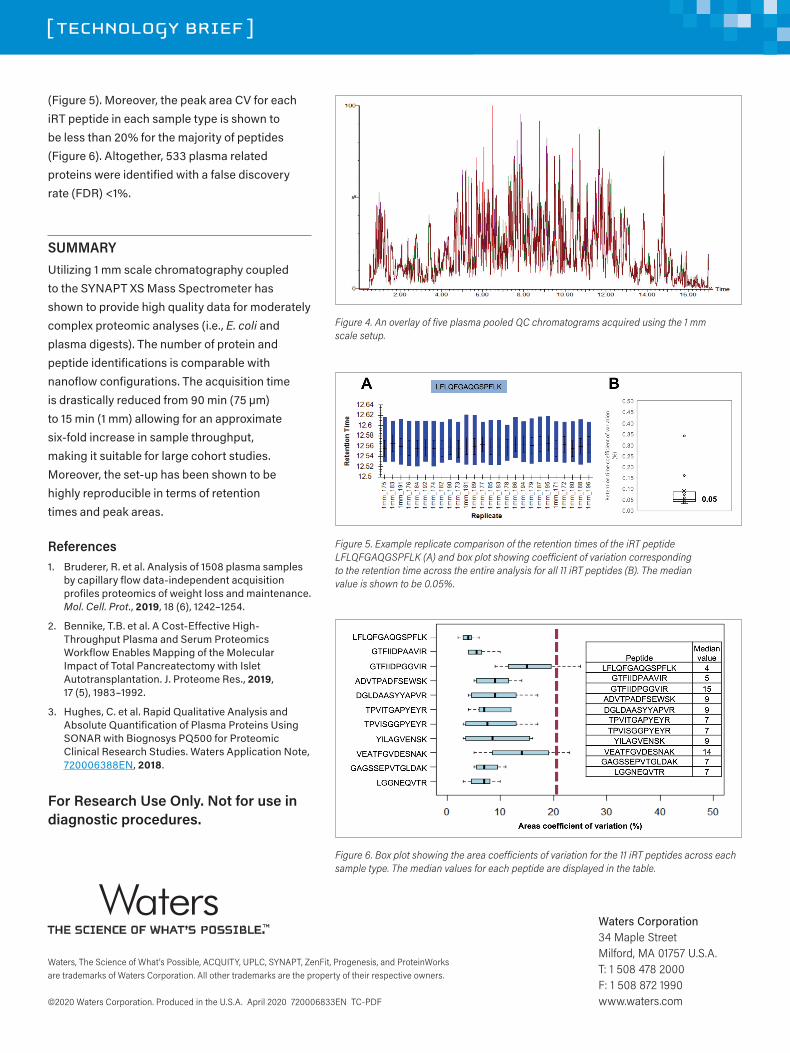
(Figure 5). Moreover, the peak area CV for each iRT peptide in each sample type is shown to be less than 20% for the majority of peptides (Figure 6). Altogether, 533 plasma related proteins were identified with a false discovery rate (FDR) <1%.
SUMMARYUtilizing 1 mm scale chromatography coupled to the SYNAPT XS Mass Spectrometer has shown to provide high quality data for moderately complex proteomic analyses (i.e., E. coli and plasma digests). The number of protein and peptide identifications is comparable with nanoflow configurations. The acquisition time is drastically reduced from 90 min (75 µm) to 15 min (1 mm) allowing for an approximate six-fold increase in sample throughput, making it suitable for large cohort studies. Moreover, the set-up has been shown to be highly reproducible in terms of retention times and peak areas.
References1. Bruderer, R. et al. Analysis of 1508 plasma samples
by capillary flow data-independent acquisition profiles proteomics of weight loss and maintenance. Mol. Cell. Prot., 2019, 18 (6), 1242–1254.
2. Bennike, T.B. et al. A Cost-Effective High-Throughput Plasma and Serum Proteomics Workflow Enables Mapping of the Molecular Impact of Total Pancreatectomy with Islet Autotransplantation. J. Proteome Res., 2019, 17 (5), 1983–1992.
3. Hughes, C. et al. Rapid Qualitative Analysis and Absolute Quantification of Plasma Proteins Using SONAR with Biognosys PQ500 for Proteomic Clinical Research Studies. Waters Application Note, 720006388EN, 2018.
For Research Use Only. Not for use in diagnostic procedures.
Figure 4. An overlay of five plasma pooled QC chromatograms acquired using the 1 mm scale setup.
Figure 5. Example replicate comparison of the retention times of the iRT peptide LFLQFGAQGSPFLK (A) and box plot showing coefficient of variation corresponding to the retention time across the entire analysis for all 11 iRT peptides (B). The median value is shown to be 0.05%.
Figure 6. Box plot showing the area coefficients of variation for the 11 iRT peptides across each sample type. The median values for each peptide are displayed in the table.