rapid employment model evaluation: update...
TRANSCRIPT
RRaappiidd EEmmppllooyymmeenntt MMooddeell
EEvvaalluuaattiioonn:: UUppddaattee ##22
Ray Marshall Center for
the Study of Human
Resources
LBJ School of Public Affairs
The University of Texas at Austin 3001 Lake Austin Blvd.,
Suite 3.200
Austin, TX 78703
Phone: 512-471-7891 www.utexas.edu/research/cshr
Prepared by:
Tara C. Smith
Christopher T. King
Daniel G. Schroeder
Submitted to:
Travis County Health and Human Services Department
January 2010

This report was prepared with funds provided through a grant and cooperative agreement from the Travis
County Health and Human Services Department to the Ray Marshall Center for the Study of Human Resources at the University of Texas at Austin. The views expressed here are those of the authors and do not represent the positions of the funding agencies or The University.
i
Table of Contents
List of Figures ........................................................................................................................... ii
List of Tables ............................................................................................................................ ii
Introduction ................................................................................................................................1
Background ........................................................................................................................1
Evaluation Approach .........................................................................................................3
Report Organization ...........................................................................................................4
The Rapid Employment Model Project .....................................................................................5
Participant Characteristics .................................................................................................5
Components, Services, and Duration .................................................................................6
Pre-Employment Training .....................................................................................6
Occupational Skills Training .................................................................................7
Initial Labor Market Outcomes for 2008 REM Participants .....................................................9
Immediate, Provider-reported Employment and Wages ....................................................9
UI Wage Records Data on Employment and Earnings ......................................................9
Updated Labor Market Outcomes and Impact Findings for 2006 and 2007 REM Participants .......................................................................................................11
Unemployment Insurance Benefits ..................................................................................12
Quasi-Experimental Impacts Analysis .............................................................................14
Quasi-Experimental Estimation ...........................................................................14
Employment and Earnings Impacts .....................................................................16
Impacts on Unemployment Insurance..................................................................19
Concluding Observations and Next Steps................................................................................21
References ................................................................................................................................23
Appendix A ........................................................................................................................... A-1

ii
LIST OF FIGURES
Figure 1: REM 2006 and 2007 Participant Flowchart .............................................................. 2
Figure 2: REM 2008 Participant Flowchart .............................................................................. 3
Figure 3: REM 2006 vs. Comparison Group Earnings Over Time ........................................ 18
Figure 4: REM 2007 vs. Comparison Group Earnings Over Time ........................................ 19
LIST OF TABLES
Table 1: Number and Percent of REM Participants by Program and Service Year ................ 6
Table 2: REM Participants Completing Pre-Employment Training ........................................ 7
Table 3: REM Participants Completing Occupational Training .............................................. 7
Table 4: Number and Percent of REM Participants by Occupational Training ...................... 8
Table 5: Quarterly Employment for 2008 REM Participants ................................................ 10
Table 6: Average Quarterly Earnings of those Employed, 2008 REM Participants ............. 10
Table 7: Quarterly Employment for REM Participants .......................................................... 11
Table 8: Average Quarterly Earnings of those Employed ...................................................... 12
Table 9: Percent of REM Participants Qualified for UI Benefits ........................................... 13
Table 10: Percent of REM Participants Filing UI Claims ...................................................... 13
Table 11: Quarterly Employment Impacts .............................................................................. 16
Table 12: Quarterly Earnings Impacts .................................................................................... 17
Table 13: UI Claims Impacts .................................................................................................. 19
Table 14: Impact on UI Benefits Qualifications ..................................................................... 20

1
INTRODUCTION
This report is an update to the report, Rapid Employment Model Evaluation: Update
published in December 2008. Travis County contracted with the Ray Marshall Center to
extend the evaluation of the Rapid Employment Model (REM) demonstration project. The
intent of this effort is to track longer-term participant outcomes for the cohorts served in
2006 and 2007, and to document outcomes for the third cohort of participants served in 2008.
In addition, this report presents quasi-experimental impact analysis for participants in the
2006 and 2007 cohorts.
Background
Travis County and the City of Austin are unique among local governments in the
United States in their approach to workforce development. Rather than relying exclusively
on federal funding to support services for their residents as most jurisdictions do, they have
augmented federal and state funds with local tax dollars in workforce services for about a
decade,1 strategically coordinating their investments with Workforce Solutions – Capital
Area,2 the local workforce investment board. In recent years, Travis County and the City
together have expended around $3 million annually on workforce services for local
residents.3 Primary areas of emphasis for these local investments have been occupational
training and support services, offerings that have typically been constrained under federal
program rules.
In 2005, Travis County and workforce board staff began discussing the need for
improved services to assist jobseekers find suitable work more quickly through a structured
effort that would supplement their longer-term skill development offerings. These
discussions ultimately resulted in the creation of the Rapid Employment Model (REM). The
REM project seeks to demonstrate that work readiness and short-term occupational skills
training, when combined with active job placement assistance, can lead to successful
employment outcomes for jobseekers who might otherwise struggle in the labor market.
1 City and county tax expenditures on workforce services grew out of the experience with tax abatement
agreements related to Samsung in the mid-to-late 1990s (Glover et al., 2007). 2 Formerly known as WorkSource—The Greater Austin Workforce Board
3 See Smith and King (2007) for an evaluation of locally-funded workforce development services.
2
REM began operations in January 2006 as a joint effort of the County, Workforce Solutions
and area workforce service providers to decrease the amount of time individuals are out of
work. Like all County-funded workforce services, the REM project targets disadvantaged,
indigent County residents, particularly those individuals who have been released from
incarceration, as well as individuals receiving Food Stamps or cash welfare benefits.
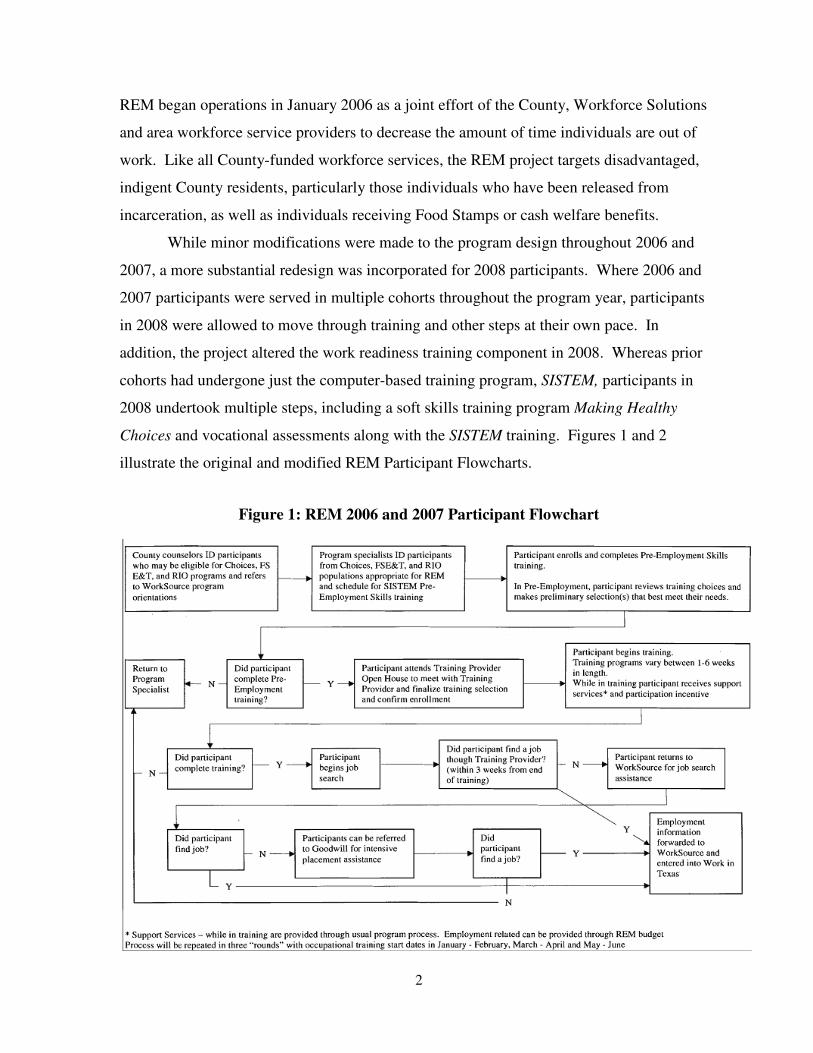
While minor modifications were made to the program design throughout 2006 and
2007, a more substantial redesign was incorporated for 2008 participants. Where 2006 and
2007 participants were served in multiple cohorts throughout the program year, participants
in 2008 were allowed to move through training and other steps at their own pace. In
addition, the project altered the work readiness training component in 2008. Whereas prior
cohorts had undergone just the computer-based training program, SISTEM, participants in
2008 undertook multiple steps, including a soft skills training program Making Healthy
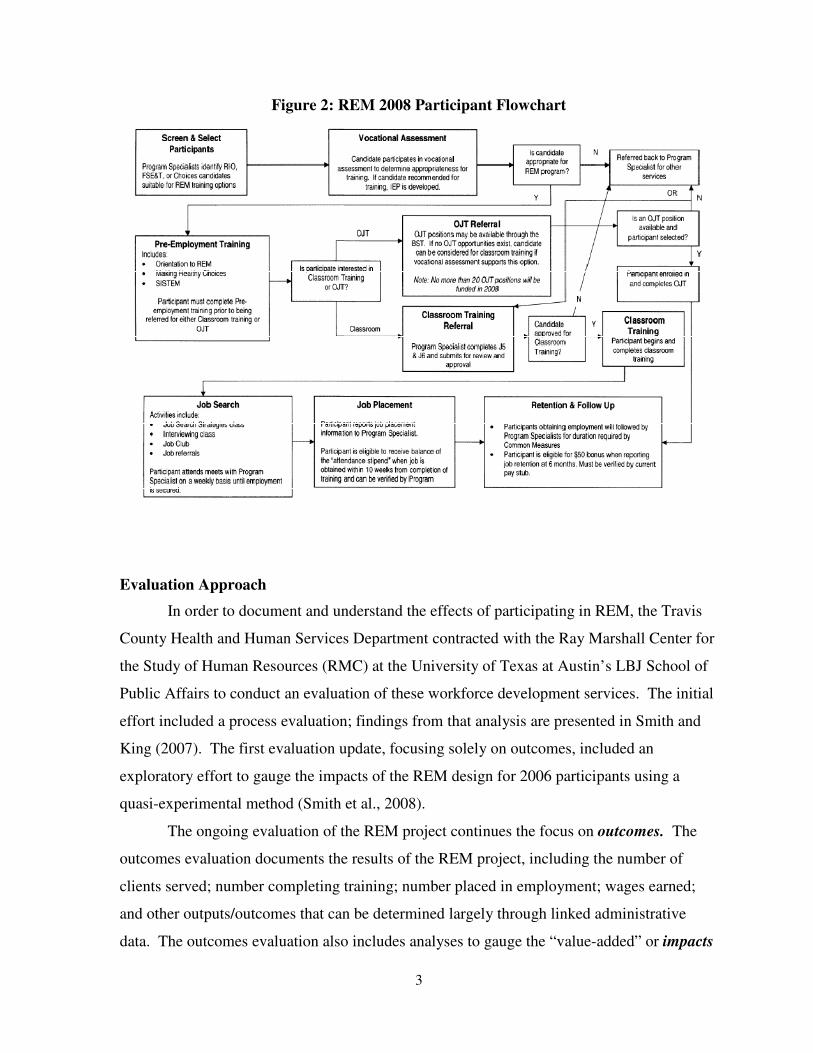
Choices and vocational assessments along with the SISTEM training. Figures 1 and 2
illustrate the original and modified REM Participant Flowcharts.
Figure 1: REM 2006 and 2007 Participant Flowchart
3
Figure 2: REM 2008 Participant Flowchart
Evaluation Approach
In order to document and understand the effects of participating in REM, the Travis
County Health and Human Services Department contracted with the Ray Marshall Center for
the Study of Human Resources (RMC) at the University of Texas at Austin’s LBJ School of
Public Affairs to conduct an evaluation of these workforce development services. The initial
effort included a process evaluation; findings from that analysis are presented in Smith and
King (2007). The first evaluation update, focusing solely on outcomes, included an
exploratory effort to gauge the impacts of the REM design for 2006 participants using a
quasi-experimental method (Smith et al., 2008).
The ongoing evaluation of the REM project continues the focus on outcomes. The
outcomes evaluation documents the results of the REM project, including the number of
clients served; number completing training; number placed in employment; wages earned;
and other outputs/outcomes that can be determined largely through linked administrative
data. The outcomes evaluation also includes analyses to gauge the “value-added” or impacts

4
from these services through quasi-experimental analysis comparing labor market outcomes
for 2006 and 2007 REM participants with those of a comparison group of similar non-REM
participants.
Report Organization
This report is organized into five sections including this Introduction. The second
section briefly characterizes the REM model design and explains its key features. The third
section presents the initial labor market outcomes for 2008 REM participants. The fourth
section presents longer-term outcomes for 2006 and 2007 REM participants and findings
from the quasi-experimental impact analysis. The fifth section offers several concluding
observations and identifies next steps for the ongoing evaluation effort.

5
THE RAPID EMPLOYMENT MODEL PROJECT
The REM project enrolled jobseekers in four separate rounds of training for up to six
weeks between January 2006 and October 2006; in 2007, there were six separate rounds
between February and October. The project design and offerings were modified slightly in
each round of implementation. In 2008 the model was further refined; the cohort design was
dropped in favor of more rapid entry into training for participants.
Participant Characteristics
REM participants were identified for possible inclusion in the project based on their
association with one of three programs serving populations typically at a disadvantage in the
labor market (see Table 1):
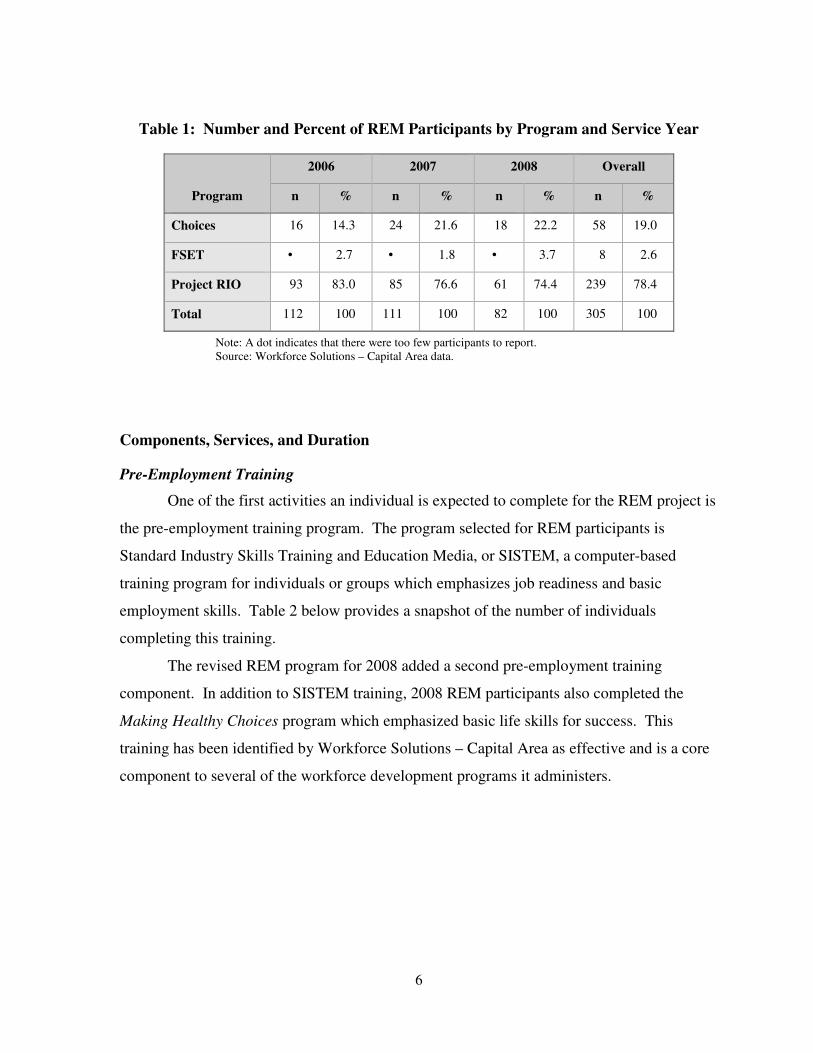
• Project RIO (Re-Integration of Offenders) – an employment and training
program targeting individuals who have been released from incarceration in the
state jail system. REM participants were overwhelmingly Project RIO clients
(78.4% of all participants).
• Choices – the workforce program in Texas serving recipients of Temporary
Assistance for Needy Families (TANF) funds. Almost one-fifth of all REM
participants (19%) were Choices clients.
• Food Stamp Employment and Training (FSET) – a program providing access
to employment and training programs for individuals receiving food stamp
assistance. Few REM participants were FSET clients (just 2.6% overall).
Because each of these programs has specific participant eligibility requirements, as
well as distinct policies on the amount and type of employment and training activities that
individuals must engage in, the individuals participating in the REM project are not a
homogenous group and should not be assumed to fully share motivations for employment.
6
Table 1: Number and Percent of REM Participants by Program and Service Year
Program
2006 2007 2008 Overall
n % n % n % n %
Choices 16 14.3 24 21.6 18 22.2 58 19.0
FSET • 2.7 • 1.8 • 3.7 8 2.6
Project RIO 93 83.0 85 76.6 61 74.4 239 78.4
Total 112 100 111 100 82 100 305 100
Note: A dot indicates that there were too few participants to report. Source: Workforce Solutions – Capital Area data.
Components, Services, and Duration
Pre-Employment Training
One of the first activities an individual is expected to complete for the REM project is
the pre-employment training program. The program selected for REM participants is
Standard Industry Skills Training and Education Media, or SISTEM, a computer-based
training program for individuals or groups which emphasizes job readiness and basic
employment skills. Table 2 below provides a snapshot of the number of individuals
completing this training.
The revised REM program for 2008 added a second pre-employment training
component. In addition to SISTEM training, 2008 REM participants also completed the
Making Healthy Choices program which emphasized basic life skills for success. This
training has been identified by Workforce Solutions – Capital Area as effective and is a core
component to several of the workforce development programs it administers.

7
Table 2: REM Participants Completing Pre-Employment Training
2006 2007 2008
Total Number of Participants 112 111 82
Number Completing
Pre-Employment Training1
79 102 82 / 80
Percent Completing1 71% 92% 100% / 98%
1 The first number refers to SISTEM training while the second refers to the Making Healthy Choices training. Source: Workforce Solutions – Capital Area data.
Occupational Skills Training
After the pre-employment training, REM participants selected and entered a short-
term training program. Overall, 88% of REM participants completed occupational skills
training, as detailed in Table 3.
Table 3: REM Participants Completing Occupational Training
2006 2007 2008 Overall
Total Number of Participants 112 111 82 305
Number Completing
Occupational Training 97 99 71 267
Percent Completing 87% 89% 87% 88%
Source: Workforce Solutions – Capital Area data.
The occupational training programs available in the REM project varied considerably.
The length of the programs in 2006 ranged from three days to six weeks, while programs
offered in 2007 and 2008 ranged from two to six weeks. Though most programs did include
training on resume development and interviewing skills, these activities were not necessarily
part of the normal training sequence offered by the providers. Three training providers from
2006 continued on in 2007: Austin Academy, Construction Gateway, and Austin Community
College’s (ACC) Truck Driving program. The Central Texas Nurse Network, which offered
Certified Nurse Aide training, joined the project in 2007. There were no new providers or
training offerings for 2008.
8
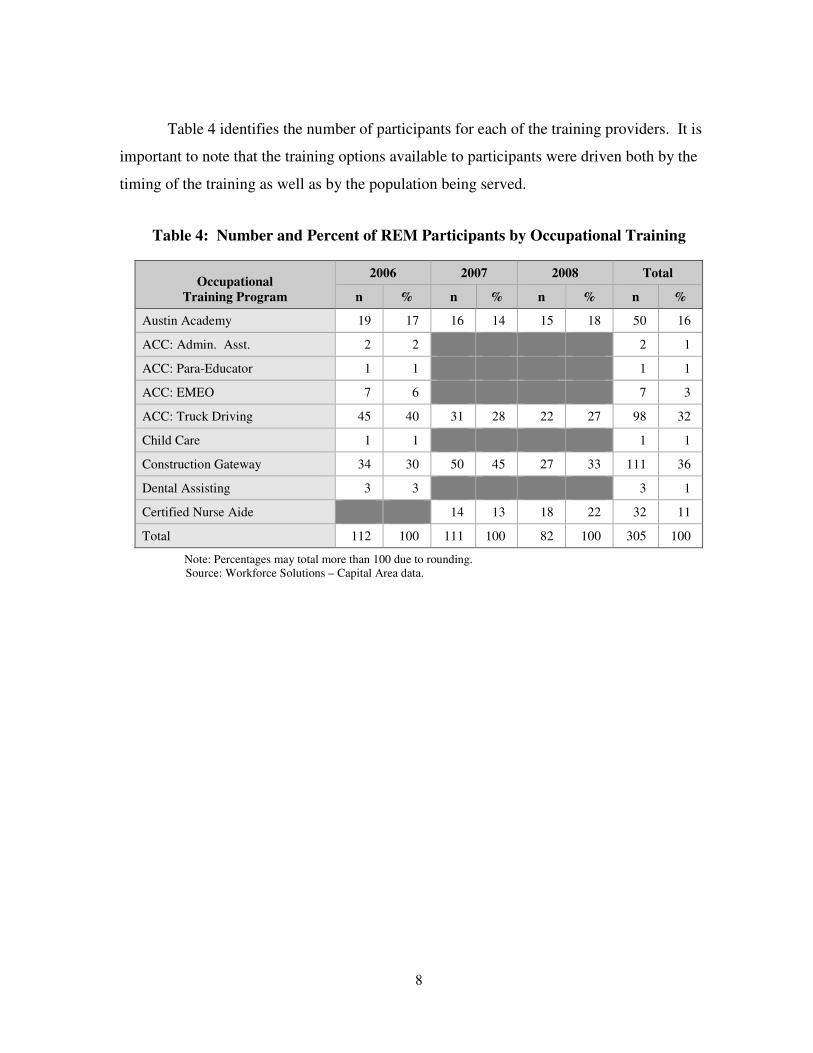
Table 4 identifies the number of participants for each of the training providers. It is
important to note that the training options available to participants were driven both by the
timing of the training as well as by the population being served.
Table 4: Number and Percent of REM Participants by Occupational Training
Occupational
Training Program
2006 2007 2008 Total
n % n % n % n %
Austin Academy 19 17 16 14 15 18 50 16
ACC: Admin. Asst. 2 2 2 1
ACC: Para-Educator 1 1 1 1
ACC: EMEO 7 6 7 3
ACC: Truck Driving 45 40 31 28 22 27 98 32
Child Care 1 1 1 1
Construction Gateway 34 30 50 45 27 33 111 36
Dental Assisting 3 3 3 1
Certified Nurse Aide 14 13 18 22 32 11
Total 112 100 111 100 82 100 305 100
Note: Percentages may total more than 100 due to rounding. Source: Workforce Solutions – Capital Area data.
9
INITIAL LABOR MARKET OUTCOMES FOR 2008 REM PARTICIPANTS
The outcomes analysis draws on three types of data: 1) provider-reported data on
employment and wage levels submitted to Workforce Solutions; 2) program (Project RIO,
Choices and FSET) specialists’ data entered into The Workforce Information System of
Texas (TWIST) database; and 3) Unemployment Insurance wage records maintained by the
Texas Workforce Commission.
Immediate, Provider-reported Employment and Wages
For 2008 REM participants who completed occupational training (71 of 82
participants), 68% were employed within 90 days of completing their training program.
Employment includes both part-time and full-time work. Participants with reported wages
averaged $9.37 per hour, in a range of $2.15 to $20 per hour. The Construction Gateway
program and Austin Academy reported the most 2008 REM participants in employment
(88% and 73%, respectively). Both the ACC-Truck Driving program and the Certified
Nurse Aide program reported 53% of participants employed within 90 days of completing
training.
UI Wage Records Data on Employment and Earnings
Prior to examining labor market outcomes based on UI wage records, two caveats
should be noted. First, it is anticipated that UI wage records for construction and truck
driving will under-report employment and earnings for these workers due to lower rates of
UI coverage in these industries.4 Second, the employment and earnings numbers reported in
the following tables for 2008 participants are based on an early analysis. As additional
quarters of information become available, more definitive numbers can be reported.
Researchers are tracking 81 of 82 participants from the 2008 cohort. Missing
identification data precluded the inclusion of all participants in the analysis. Participants in
the 2008 REM project were employed approximately 29% of the time in the four quarters
prior to their enrollment in the REM project (see Table 5, third column). In their last quarter
4 See Stevens (2007) for a review of employment that is not covered by state unemployment insurance laws.

10
of participation in the REM project, 49% of participants were employed (fourth column).
Approximately 68% of REM participants were employed two quarters after their
participation in the project had ended (fifth column) and 66% were employed when looking
at all post-service quarters (last column).
Table 5: Quarterly Employment for 2008 REM Participants
Cohort
Total
Participants
Four
quarters
before
service
Last
quarter
of
service
Second
quarter
after
service
ends
Sixth
quarter
after
service
ends
Tenth
quarter
after
service
ends
All
quarters
after
service
ends
2008 81 29.3% 49.4% 68.2% . . 65.6%
Note: A dot indicates too few participants or no information to report.
Source: UI wage records.
UI wage records also provide information on the individual’s quarterly earnings. In
the four quarters prior to their participation in the 2008 REM project, participants who were
reported as employed earned an average of $4,574 per quarter (see Table 6). In their last
quarter of REM services, employed participants earned an average of $2,981. In the second
quarter after completing the 2008 REM project, employed participants earned an average of
$4,524. In all post-service quarters, employed 2008 REM participants earned on average
$3,838 per quarter. It is interesting to note that these average earnings (pre- and post-service)
for 2008 participants are higher than the average earnings (pre- and post-service) at the same
points in time for the 2006 and 2007 cohorts.
Table 6: Average Quarterly Earnings of those Employed, 2008 REM Participants
Cohort
Total
Participants
Four
quarters
before
service
Last
quarter
of
service
Second
quarter
after
service
ends
Sixth
quarter
after
service
ends
Tenth
quarter
after
service
ends
All
quarters
after
service
ends
2008 81 $4,574 $2,981 $4,524 . . $3,838
Note: A dot indicates too few participants or no information to report.
Source: UI wage records

11
UPDATED LABOR MARKET OUTCOMES AND IMPACT FINDINGS FOR 2006
AND 2007 REM PARTICIPANTS
Researchers are tracking multiple cohorts of REM participants, including 103
participants from the 2006 REM cohort and 85 participants from the 2007 REM cohort. As
UI wage records for some quarters in the evaluation have now been finalized, some of the
numbers reported in the following tables may not exactly match those reported in the first
update report (Smith et al, 2008). The numbers reported here are based on the most
complete, up-to-date records available.
REM participants were much more likely to be found in UI wage records in the
quarters following their participation in the project than they were in the quarters prior to it.
In the four quarters prior to their participation in the 2006 REM project, individuals were
employed approximately 16% of the time (Table 7), while 2007 REM participants were
employed approximately 22% of the time. Two quarters after they finished the project, 59%
of 2006 REM participants were employed as were 55% of 2007 REM participants. In the
sixth quarter after service, almost equal shares of participants from each cohort were
employed (47.6% vs. 47.1%). In all post-service quarters, at least half of participants from
both cohorts were employed.
Table 7: Quarterly Employment for REM Participants
Cohort
Total
Participants
Four
quarters
before
service
Last
quarter
of
service
Second
quarter
after
service
ends
Sixth
quarter
after
service
ends
Tenth
quarter
after
service
ends
All
quarters
after
service
ends
2006 103 16.3% 51.5% 59.2% 47.6% 44.0% 51.9%
2007 85 22.1% 30.6% 55.3% 47.1% . 50.4%
Note: A dot indicates too few participants or no information to report.
Source: UI wage records
REM participants also experienced earnings increases of 50% or higher in the post-
service period compared to what they had earned prior to entering the program (Table 8). In

12
the four quarters prior to participating in the REM project, employed 2006 participants
earned an average of $1,953 per quarter and employed 2007 participants earned an average
of $2,360 per quarter. In the sixth quarter following their participation in the project,
employed 2006 participants earned an average of $5,333 while 2007 participants earned an
average of $4,060.
Table 8: Average Quarterly Earnings of those Employed
Cohort
Total
Participants
Four
quarters
before
service
Last
quarter
of
service
Second
quarter
after
service
ends
Sixth
quarter
after
service
ends
Tenth
quarter
after
service
ends
All
quarters
after
service
ends
2006 103 $1,953 $1,598 $3,145 $5,333 $5,291 $4,512
2007 85 $2,360 $1,141 $3,191 $4,060 . $3,600
Note: A dot indicates too few participants or no information to report.
Source: UI wage records
Unemployment Insurance Benefits
Ray Marshall Center researchers examined two measures related to UI benefits. In
the first measure, qualification for UI benefits, researchers examined participants’ work
histories in the pre- and post-service period to determine if workforce development services
had increased participants’ eligibility for receiving UI insurance in the event of a layoff or
other employment separation. Qualification for UI benefits is based on length of
employment, earnings levels, and reason for separation, among other factors. An individual
must have sufficient earnings in at least two of the four quarters prior to separation to qualify
for UI benefits (i.e., monetary eligibility). This measure is significant as it looks at the
stability of an individual’s employment. Prior to entering the REM project, most participants
had a history of unstable employment. After their participation in these services, many of
these individuals have moved into stable employment that qualifies them for benefits through
the UI program, the nation’s first-tier safety net for laid-off workers that is funded by both
employers and workers.5 In the second measure, UI benefit claims filed, researchers
5 Employers pay taxes that directly support the UI program; economists point out that workers also contribute to
the program indirectly in the form of somewhat lower wages.

13
examined UI claims in both the pre- and post-service period to determine if the REM project
had reduced participants’ reliance on UI benefits.
In the four quarters prior to participation in the REM project, approximately 10% of
2006 participants would have qualified for UI benefits based on their earnings history (Table
9). Approximately one-fifth of 2007 participants met the monetary eligibility criteria for UI
benefits prior to their participation in the program. In the sixth quarter after they completed
the REM project, fully 53% of 2006 participants qualified for UI benefits based on their
earnings history as well as 41% of 2007 participants.
Table 9: Percent of REM Participants Qualified for UI Benefits
Cohort
Total
Participants
Four
quarters
before
service
Last
quarter
of
service
Second
quarter
after
service
ends
Sixth
quarter
after
service
ends
Tenth
quarter
after
service
ends
All
quarters
after
service
ends
2006 103 9.7% . . 53.4% 41.0% 46.1%
2007 85 19.7% . . 41.2% . 39.6%
Note: A dot indicates too few participants or no information to report.
Source: UI claims records
Despite the large increase in eligibility for UI benefits, few REM participants filed an
unemployment insurance claim in the post-service period (Table 10). Note though, that
almost 5% of 2007 REM participants filed a claim in the sixth quarter post-service – a period
almost a year into the economic recession.
Table 10: Percent of REM Participants Filing UI Claims
Cohort
Total
Participants
Four
quarters
before
service
Last
quarter
of
service
Second
quarter
after
service
ends
Sixth
quarter
after
service
ends
Tenth
quarter
after
service
ends
All
quarters
after
service
ends
2006 103 0.2% 0.0% 0.0% 0.0% 1.0% 1.4%
2007 85 0.9% 0.0% 0.0% 4.7% . 1.3%
Note: A dot indicates that there were too few participants to report. Source: UI claims records
14
Quasi-Experimental Impacts Analysis
This section reports the results of exploratory quasi-experimental impact estimation
that Ray Marshall Center researchers conducted to gauge the “value added” of participation
in the REM project. Researchers are continuing to refine their approach to impact estimation
and will present additional estimates in future reports. The quasi-experimental impact
analysis compared employment and earnings outcomes for 2006 and 2007 REM participants
with a comparison group of individuals who received basic workforce services (e.g., job
matching, resume development). The analysis reveals mixed impacts, only some of which
are statistically significant. Findings are detailed below.
Quasi-Experimental Estimation
In an attempt to measure the impacts of REM participation, researchers conducted a
quasi-experimental analysis comparing labor market outcomes for REM participants with
those of a comparison group of similar non-participants. Quasi-experimental analysis has
been shown to produce impact estimates comparable to those resulting from more rigorous
and costly approaches involving the use of experimental designs that randomly assign
individuals to treatment and control status.6 In fact, for many groups, quasi-experimental
estimates may understate employment and earnings impacts from workforce services. In
addition, the outcomes examined here compare individuals engaged in minimal, short-term
training to those who received basic labor force attachment services; large impacts are not
expected. For these reasons, results presented in this report, while exploratory, should be
considered conservative estimates of the true impacts.
Quasi-experimental approaches tend to work well when participants for whom
comparison groups are being created have sufficient prior employment and earnings histories
and when data are available on a sufficient number of variables with which to perform the
requisite match. Youth and ex-offenders are problematical in this regard precisely because
their prior employment and earnings histories are either lacking or difficult to determine.
Potential comparison group members were drawn from two sources: individuals who
either registered to look for employment using the state’s WorkinTexas program or received
“core” services under the Workforce Investment Act (such as job-matching or resume
6 For example, see Greenberg et al. (2006) and Hollenbeck and Huang (2006).

15
development). Thus, the comparison group selected as described below is not a “no-
services,” but rather a “low-intensity services” group. The resulting impact estimates thus
reflect the incremental value of the County’s investments in the REM project.
REM participants were matched on a one-to-one basis with potential comparison
group members using a method known as weighted multivariate matching. This technique
places greater weights on those variables showing greater initial (pre-service) differences.
Matching was done by selecting for each participant the one comparison group member
judged most similar. Matching was done without replacement, with no caliper applied to
eliminate poor matches, since doing so would have reduced the generalizability of the results.
Exact matches carried out included: county; year of entry into the program; and
whether or not individuals had recently experienced an earnings dip of 20% or more.
Distance matches were carried out on additional variables by treating them as numeric and
including them in the overall multivariate distance measurement. These variables included:
age, gender, race/ethnicity (white, black, Hispanic), time since first earnings, employed at
entry, percent of time employed over four (4) years prior to program entry, average quarterly
earnings over four (4) years prior to program entry, and percent of time in any workforce
development service in the year immediately prior to program entry (matched according to
service intensity: high for training programs, and low for job placement services). For those
experiencing a recent earnings dip, the time since the earnings dip and the percent of earnings
represented by the dip were also included in the matching process.
Adequacy of each comparison group was judged by performing t-tests comparing
treatment and comparison groups on the same dimensions. If the groups were statistically
different at p<.01 on more than two dimensions, the comparison was considered inadequate.
Using these parameters, the comparison group differed significantly from all REM
participants taken as a whole. Taken as individual cohorts, however, REM 2006 and REM
2007 participants did not differ significantly from their comparison groups on any of the
tested variables. Therefore, the impacts analysis is computed separately for each annual
cohort. See Appendix A for more details.
It should be emphasized that matches could not be made based on offender status as
those data were not available for the comparison group. The REM project primarily serves
ex-offenders who may be at a disadvantage in the labor market given the current economic
16
climate and limited access to some occupations. Therefore, it is likely that the comparison
group has some unmeasured advantage in the labor market relative to the REM participants
that may affect the impact estimations below.7
Note that the impacts tables display two effects columns. The Unadjusted Net Effect
simply shows the computed difference between the treatment and comparison groups on the
outcome in question. The Adjusted Net Effect column presents the net effect after further
statistical adjustments have been made (e.g., demographic differences). The figures in the
Adjusted Net Effect column are the measures of program impacts emphasized in the
discussion that follows.
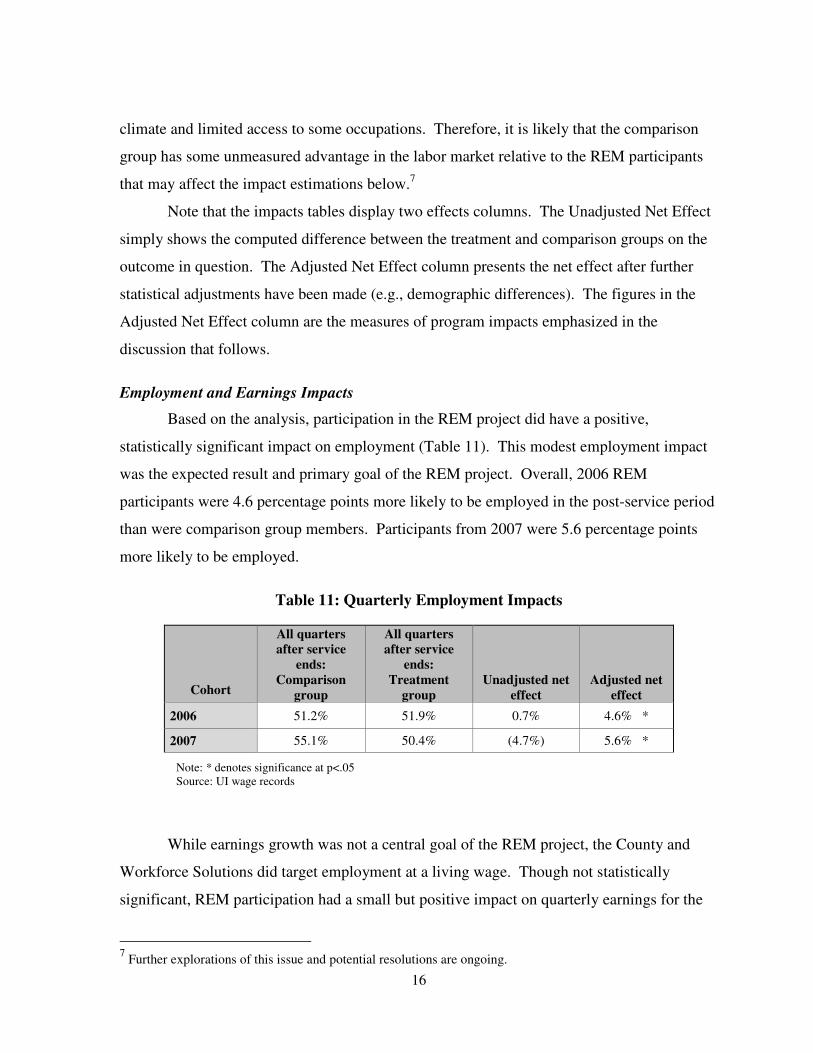
Employment and Earnings Impacts
Based on the analysis, participation in the REM project did have a positive,
statistically significant impact on employment (Table 11). This modest employment impact
was the expected result and primary goal of the REM project. Overall, 2006 REM
participants were 4.6 percentage points more likely to be employed in the post-service period
than were comparison group members. Participants from 2007 were 5.6 percentage points
more likely to be employed.
Table 11: Quarterly Employment Impacts
Cohort
All quarters
after service
ends:
Comparison
group
All quarters
after service
ends:
Treatment
group
Unadjusted net
effect
Adjusted net
effect
2006 51.2% 51.9% 0.7% 4.6% *
2007 55.1% 50.4% (4.7%) 5.6% *
Note: * denotes significance at p<.05 Source: UI wage records
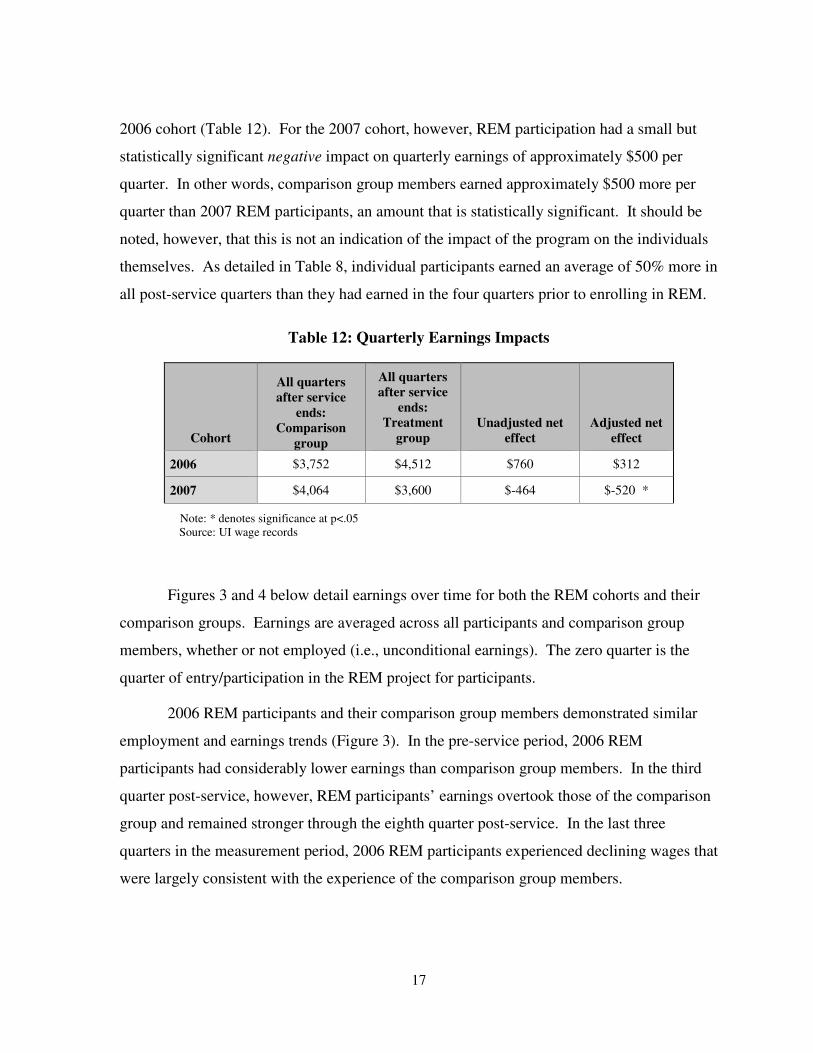
While earnings growth was not a central goal of the REM project, the County and
Workforce Solutions did target employment at a living wage. Though not statistically
significant, REM participation had a small but positive impact on quarterly earnings for the
7 Further explorations of this issue and potential resolutions are ongoing.
17
2006 cohort (Table 12). For the 2007 cohort, however, REM participation had a small but
statistically significant negative impact on quarterly earnings of approximately $500 per
quarter. In other words, comparison group members earned approximately $500 more per
quarter than 2007 REM participants, an amount that is statistically significant. It should be
noted, however, that this is not an indication of the impact of the program on the individuals
themselves. As detailed in Table 8, individual participants earned an average of 50% more in
all post-service quarters than they had earned in the four quarters prior to enrolling in REM.
Table 12: Quarterly Earnings Impacts
Cohort
All quarters
after service
ends:
Comparison
group
All quarters
after service
ends:
Treatment
group
Unadjusted net
effect
Adjusted net
effect
2006 $3,752 $4,512 $760 $312
2007 $4,064 $3,600 $-464 $-520 *
Note: * denotes significance at p<.05 Source: UI wage records
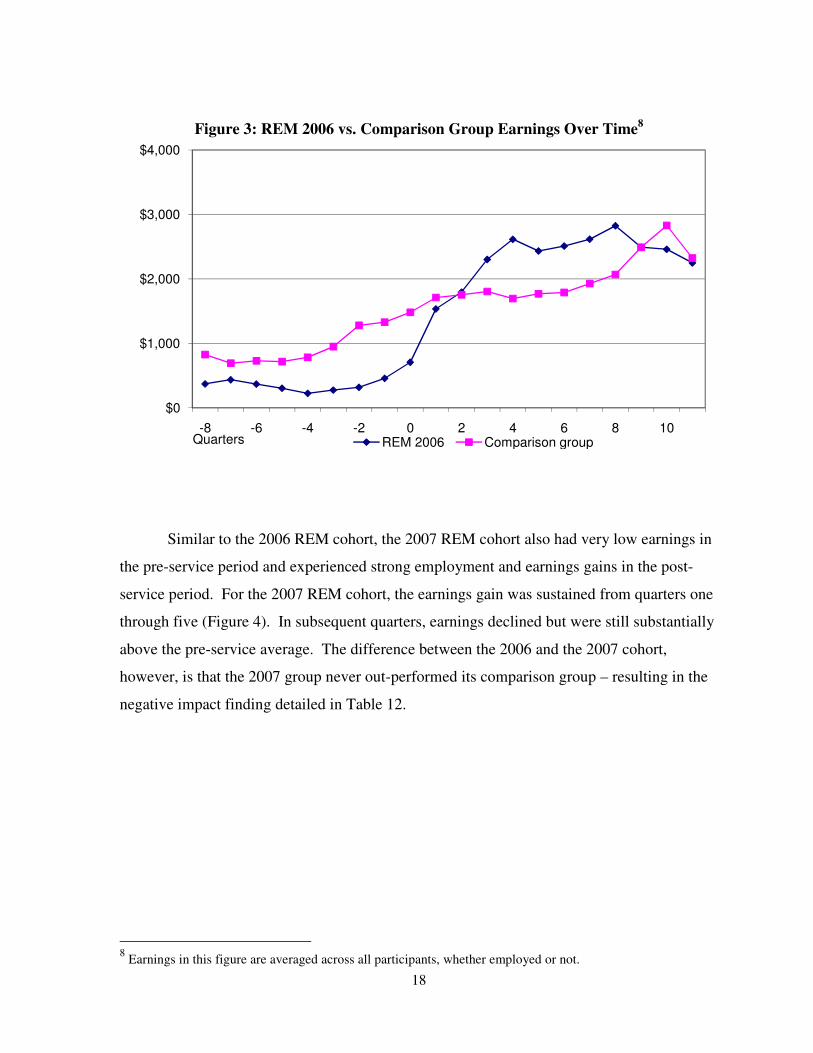
Figures 3 and 4 below detail earnings over time for both the REM cohorts and their
comparison groups. Earnings are averaged across all participants and comparison group
members, whether or not employed (i.e., unconditional earnings). The zero quarter is the
quarter of entry/participation in the REM project for participants.
2006 REM participants and their comparison group members demonstrated similar
employment and earnings trends (Figure 3). In the pre-service period, 2006 REM
participants had considerably lower earnings than comparison group members. In the third
quarter post-service, however, REM participants’ earnings overtook those of the comparison
group and remained stronger through the eighth quarter post-service. In the last three
quarters in the measurement period, 2006 REM participants experienced declining wages that
were largely consistent with the experience of the comparison group members.
18
Figure 3: REM 2006 vs. Comparison Group Earnings Over Time8
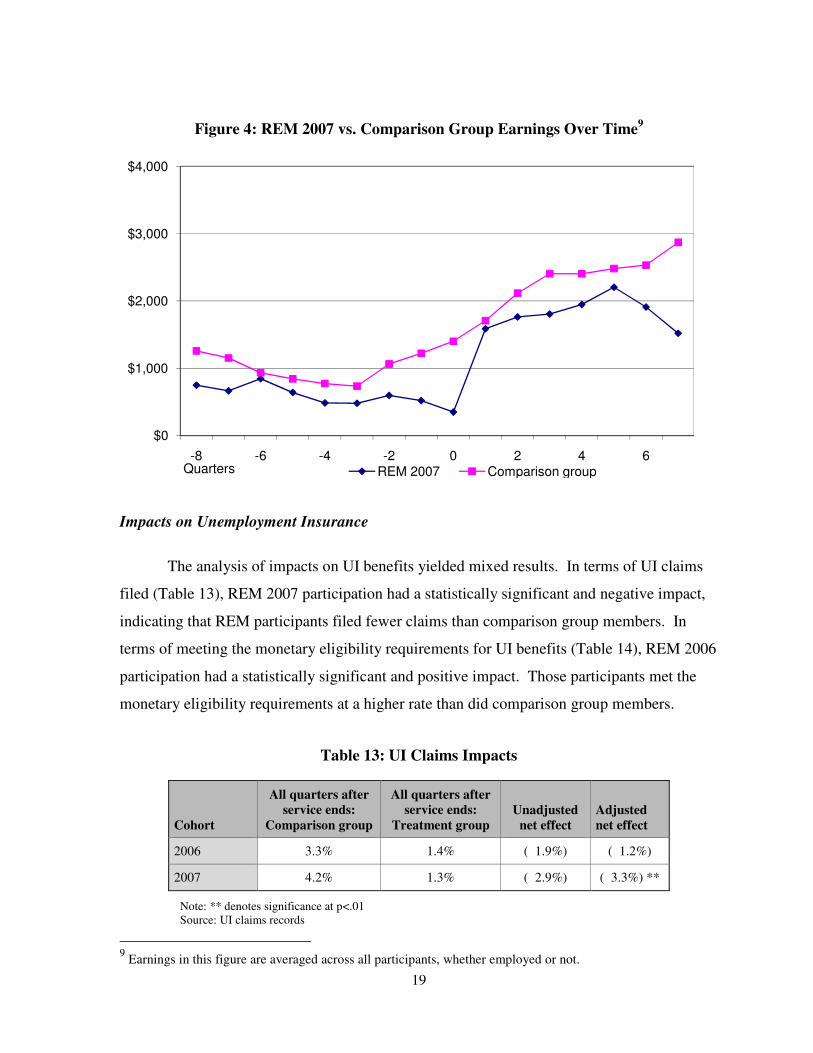
Similar to the 2006 REM cohort, the 2007 REM cohort also had very low earnings in
the pre-service period and experienced strong employment and earnings gains in the post-
service period. For the 2007 REM cohort, the earnings gain was sustained from quarters one
through five (Figure 4). In subsequent quarters, earnings declined but were still substantially
above the pre-service average. The difference between the 2006 and the 2007 cohort,
however, is that the 2007 group never out-performed its comparison group – resulting in the
negative impact finding detailed in Table 12.
8 Earnings in this figure are averaged across all participants, whether employed or not.
$0
$1,000
$2,000
$3,000
$4,000
-8 -6 -4 -2 0 2 4 6 8 10Quarters REM 2006 Comparison group
19
Figure 4: REM 2007 vs. Comparison Group Earnings Over Time9
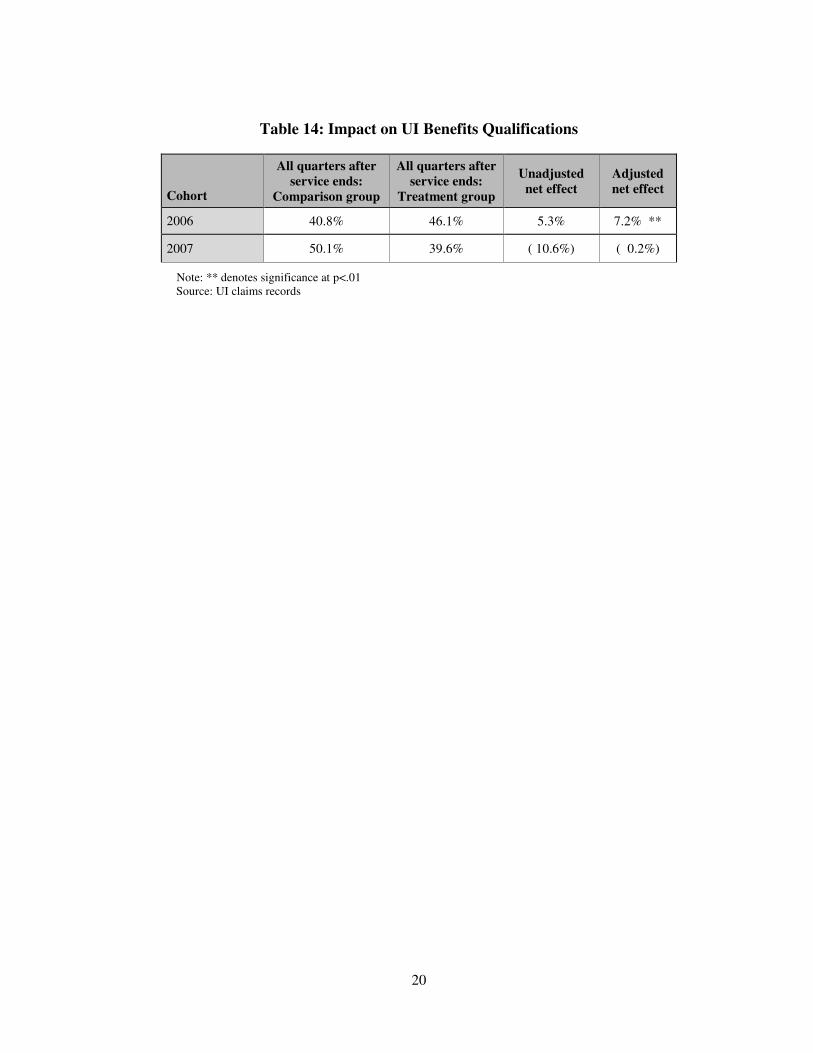
Impacts on Unemployment Insurance
The analysis of impacts on UI benefits yielded mixed results. In terms of UI claims
filed (Table 13), REM 2007 participation had a statistically significant and negative impact,
indicating that REM participants filed fewer claims than comparison group members. In
terms of meeting the monetary eligibility requirements for UI benefits (Table 14), REM 2006
participation had a statistically significant and positive impact. Those participants met the
monetary eligibility requirements at a higher rate than did comparison group members.
Table 13: UI Claims Impacts
Cohort
All quarters after
service ends:
Comparison group
All quarters after
service ends:
Treatment group
Unadjusted
net effect
Adjusted
net effect
2006 3.3% 1.4% ( 1.9%) ( 1.2%)
2007 4.2% 1.3% ( 2.9%) ( 3.3%) **
Note: ** denotes significance at p<.01 Source: UI claims records
9 Earnings in this figure are averaged across all participants, whether employed or not.
$0
$1,000
$2,000
$3,000
$4,000
-8 -6 -4 -2 0 2 4 6Quarters REM 2007 Comparison group
20
Table 14: Impact on UI Benefits Qualifications
Cohort
All quarters after
service ends:
Comparison group
All quarters after
service ends:
Treatment group
Unadjusted
net effect
Adjusted
net effect
2006 40.8% 46.1% 5.3% 7.2% **
2007 50.1% 39.6% ( 10.6%) ( 0.2%)
Note: ** denotes significance at p<.01 Source: UI claims records
21
CONCLUDING OBSERVATIONS AND NEXT STEPS
The Rapid Employment Model project was designed primarily to shorten time
unemployed and boost employment. The evidence continues to mount that the project is
indeed meeting its objectives. Travis County participants who complete the occupational
skills training component of REM are entering and retaining employment at higher rates
than individuals in the comparison group. Participants also experienced increased
earnings following the training, though those increases were not large in relation to the
comparison group. As more time passes since participants completed the REM training,
researchers will have more data to determine the project’s true impact on employment
and earnings trajectories.
It is also important to note the impact that REM participation has had on
individuals’ unemployment insurance benefits claims and monetary eligibility. Though it
is not possible to directly measure the project’s impact on time unemployed, the measures
that are available are telling. While UI claims by REM participants held steady across
pre- and post-service periods (less than one percent had filed a claim), the percent of
individuals who would qualify for UI benefits based on their employment history
increased dramatically in the post-service period. For the 2006 REM cohort, the increase
in eligibility is statistically significant. That REM participants can now access this
important safety net in the event of a job loss is a significant impact of the project.
Moreover, the impacts on UI claims filed is statistically significant for the 2007 cohort,
and for both cohorts examined the findings are in the right direction: REM participants
filed for UI benefits at a lower rate than did the comparison group.
As a demonstration project, the REM design appears to be a viable tool for
working with disadvantaged residents in Travis County. The modifications that have
been incorporated over the course of the project, particularly the narrowing of training
options to more adequately address the employment barriers that participants are working
to overcome, are important to its success. Moving forward, the County and Workforce
Solutions should continue to monitor the type of participants engaged in the project to
ensure that the training opportunities are appropriate.
22
In the next phase of the evaluation, Ray Marshall Center researchers will continue
to monitor post-service employment and earnings, as well as refine the quasi-
experimental impacts analysis and extend its application to the 2008 REM cohort. This
will be an important analysis as the project design changed considerably in 2008;
researchers will pay particular attention to the possible impact these changes have on
longer-term outcomes for participants. Center researchers will work with County staff to
identify potential data sources that would allow offender status to be included in the
comparison group matching process, ultimately leading to better impact estimates for the
REM project. Center researchers will also explore the possibility of adding a benefit-cost
or cost-effectiveness analysis to the evaluation.
23
REFERENCES
Glover, Robert W., Daniel P. O’Shea and Christopher T. King (2007). “Reflections on Austin in the 1990s: Economic Development Through Workforce Development.” In Economic Development in American Cities. Edited by Michael J. Bennett and Robert Giloth. Albany, NY: State University of New York Press, pp. 81-110.
Greenberg, David H., Charles Michalopoulos, and Philip K. Robins (2006). “Do Experimental and Nonexperimental Evaluations Give Different Answers about the Effectiveness of Government-funded Training Programs?” Journal of Policy
Analysis and Management, Vol. 25, No. 3 (Summer), pp. 523-552.
Hollenbeck, Kevin and Wei-Jang Huang (2006). Net Impact and Benefit-Cost Estimates
of the Workforce Development System in Washington State. Kalamazoo, Michigan: W. E. Upjohn Institute for Employment Research, Technical Report No. TR06-020.
King, Christopher T. (2004). “The Effectiveness of Publicly Financed Training in the United States: Implications for WIA and Related Programs.” In Christopher J. O’Leary, Robert A. Straits, and Stephen A. Wandner, Eds., Job Training Policy in
the United States. Kalamazoo, Michigan: The W. E. Upjohn Institute for Employment Research, pp. 57-99.
King, Christopher T., Robert W. Glover, Dan O’Shea, Brendan Hill and Mike Blood (2005). Construction Gateway Evaluation: Findings and Program
Recommendations. Austin: Ray Marshall Center for the Study of Human Resources, Lyndon B. Johnson School of Public Affairs, University of Texas, March.
Smith, Tara Carter and Christopher T. King (2007). Rapid Employment Model
Evaluation: Initial Findings. Austin: Ray Marshall Center for the Study of Human Resources, Lyndon B. Johnson School of Public Affairs, University of Texas, March.
Smith, Tara C., Christopher T. King, and Daniel G. Schroeder (2008). Rapid
Employment Model Evaluation: Update. Austin: Ray Marshall Center for the Study of Human Resources, Lyndon B. Johnson School of Public Affairs, University of Texas, March.
Stevens, David W. (2007). Employment That Is Not Covered by State Unemployment
Insurance Laws. Technical Paper No. TP-2007-04. Suitland, MD: U.S. Census Bureau, LEHD Program, May.
A-1
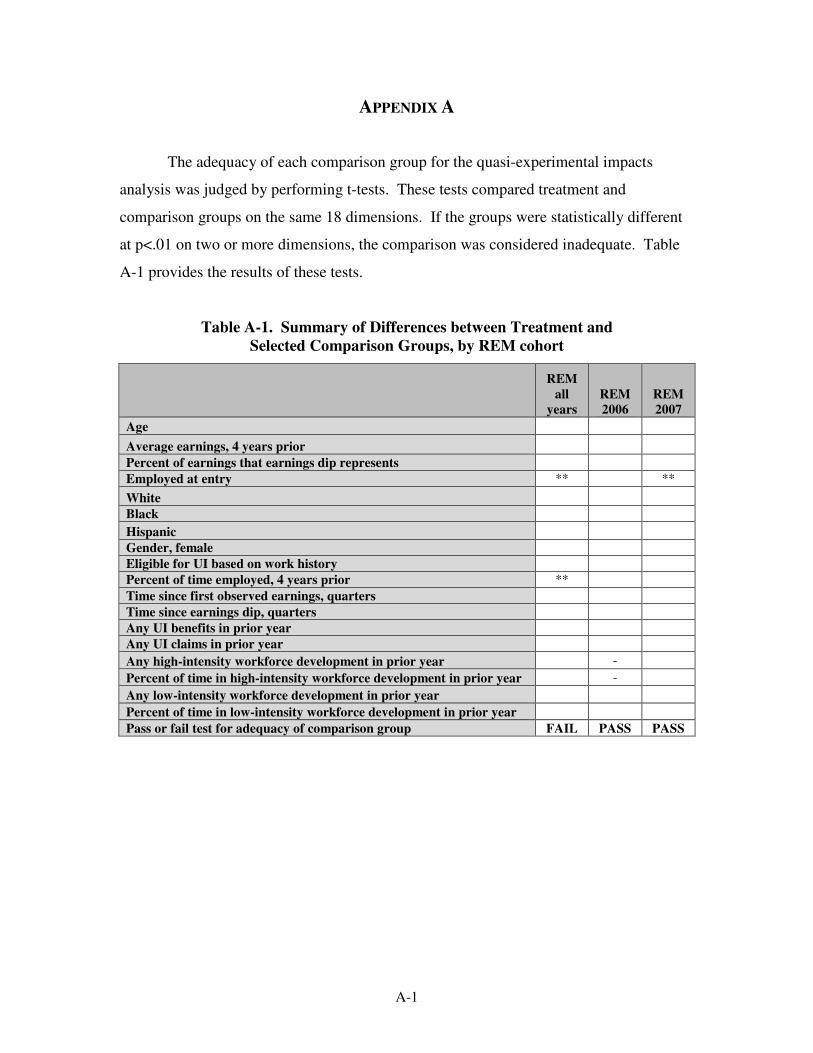
APPENDIX A
The adequacy of each comparison group for the quasi-experimental impacts
analysis was judged by performing t-tests. These tests compared treatment and
comparison groups on the same 18 dimensions. If the groups were statistically different
at p<.01 on two or more dimensions, the comparison was considered inadequate. Table
A-1 provides the results of these tests.
Table A-1. Summary of Differences between Treatment and
Selected Comparison Groups, by REM cohort
REM
all
years
REM
2006
REM
2007
Age
Average earnings, 4 years prior Percent of earnings that earnings dip represents
Employed at entry **
**
White Black
Hispanic
Gender, female
Eligible for UI based on work history
Percent of time employed, 4 years prior **
Time since first observed earnings, quarters
Time since earnings dip, quarters
Any UI benefits in prior year
Any UI claims in prior year
Any high-intensity workforce development in prior year
-
Percent of time in high-intensity workforce development in prior year
-
Any low-intensity workforce development in prior year
Percent of time in low-intensity workforce development in prior year
Pass or fail test for adequacy of comparison group FAIL PASS PASS