rapid and low carbon urbanization in china? professor xuemei bai fenner school of environment and...
TRANSCRIPT
Rapid and Low Carbon Urbanization in China?
Professor Xuemei Bai
Fenner School of Environment and Society
University of Copenhagen, Oct 21, 2014

This Talk
1. Determinants of GHG emission from cities: some recent evidence
2. Urbanization in China under the carbon lens?
3. Urban experiments and transition

Carbon Emission from Cities
• Cities responsible for “75% of global energy consumption and 80% per cent of greenhouse gas emissions” - (UN, 2007)

Cities at COP19: From periphery to center stage?
• Inaugural Cities Day of UNFCCC, a Ministerial-Mayors Dialogue (Nov. 21)
• Cities Climate Registry 2013 Report– 414 cities registered over 4,000 climate
actions either completed or in progress until 2020.
– 63% of the reduction commitments are above 1% per year, exceeding the value of even the most ambitious national governments under the Kyoto Protocol.

Cities Say…
• “National governments alone cannot tackle all corners of climate action, that’s why cities offer their ambitions, capacities and achievements as governmental stakeholders which should be tapped in the new climate regime.
• We can guarantee to deliver concrete actions as part of the global deal in Paris 2015.”
• ICLEI Secretary General Gino Van Begin.

“City Planning will determine pace of global warming” - (UN, 2007)

Figure S1. Declining per capita fuel consumption with increasing urban density incities throughout the world (Source: Newman and Kenworthy, 1989)
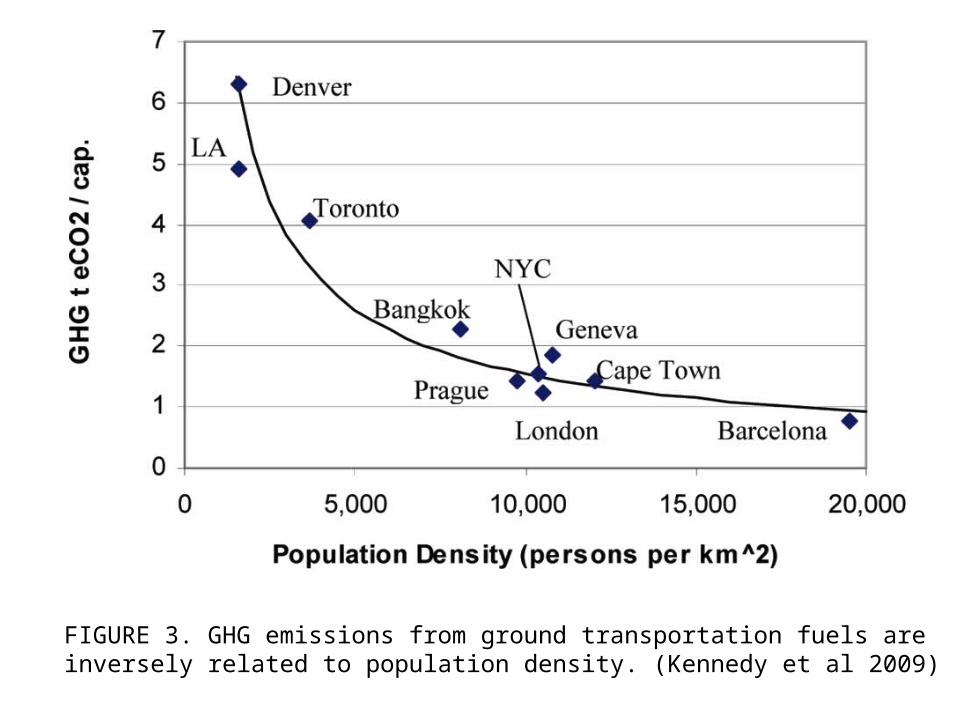
FIGURE 3. GHG emissions from ground transportation fuels areinversely related to population density. (Kennedy et al 2009)

What are we measuring?
(Source: Yunus Arikan, 2013)


Externalities
• Up to 70% of household GHG emissions are from regional and national activities that support household consumption including the supply of energy and building materials
• 17% are from urban level basic services and supplies such as sewage treatment and solid waste management
• 13% are direct emissions from household consumption.
(Source: Lin et al 2013)

• The impact of high or low density living remains limited; instead, carbon footprints can be comparatively high or low across density gradients depending on the location-specific socio-demographic, infrastructural and geographic characteristics of the area under consideration.
• Carbon footprint of cities and other human settlements in the UK is mainly determined by socio-economic rather than geographic and infrastructural drivers at the spatial aggregation of our analysis.
• It increases with growing income, education and car ownership as well as decreasing household size. (Minx et al 2013)

14
(Source: Bai, X., P. Shi, Y. Liu. Nature 509, 2014.)
Urbanization: China

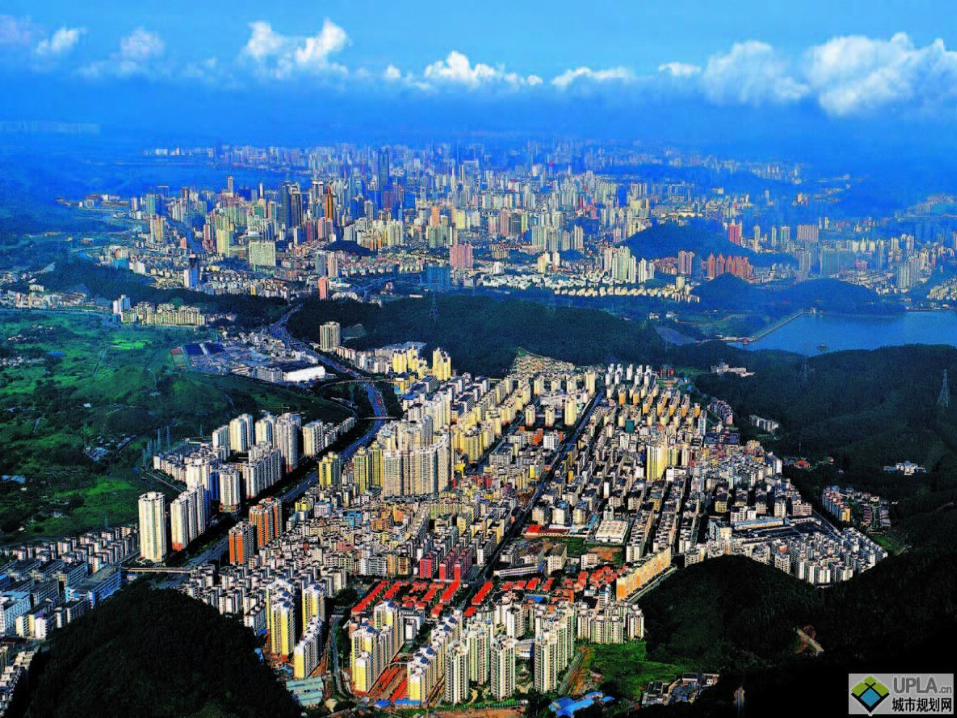
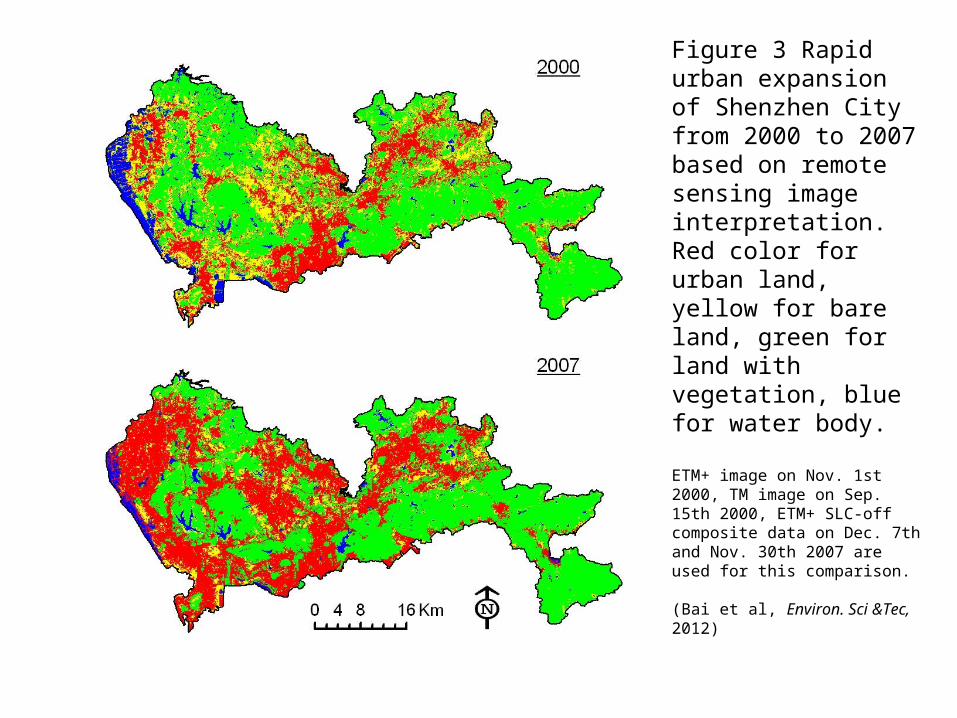
Figure 3 Rapid urban expansion of Shenzhen City from 2000 to 2007 based on remote sensing image interpretation. Red color for urban land, yellow for bare land, green for land with vegetation, blue for water body.
ETM+ image on Nov. 1st 2000, TM image on Sep. 15th 2000, ETM+ SLC-off composite data on Dec. 7th and Nov. 30th 2007 are used for this comparison.
(Bai et al, Environ. Sci &Tec, 2012)

Drivers and Impacts of Urban Growth
Primary driver: - Job opportunity and aspiration for better life
Policy factor:- Concurrence of urbanization, industrialization and economic
growth- Significant urban contribution to national economy- High income countries often have higher urbanization level
National policy to promote urbanization for economic growth

(Source: Deng and Bai, Environment, 2014)

(Bloom et al, Science, 2008)
Does urbanization bring about wealth?Urbanization and income level across countries

Figure 2 Spatial distribution of Chinese cities included in analysis. Panel U1 (1990-1998) consists of 174 cities. Panel U2 (1997-2006) consists of 135 cities. Panel U3 (1990-2006) consists of 121 cities that appear in both U1 and U2 panel.(Source: Bai et al, EST, 2012)

Figure 4 Average annual growth of GDP per capita, built-up area, and population of 135 Chinese cities during 1997-2006. (Source: Bai et al, EST 2012)

Positive Feedback
• 1) Larger cities tend to gain more income and richer cities tends to expand more
• 2) There is a long-term bi-directional causality between urban built-up area expansion and GDP per capita at both city and provincial level, and a short-term bi-directional causality at provincial level.
• 3) A positive feedback between landscape urbanization and urban and regional economic growth in China.
– (Bai et al, Environmental Science&Technology, 2012)

Policy Implications
1) Urbanization, if measured by a landscape indicator, does have causal effect on economic growth in China, both within the city and with spillover effect to the region.
2) Under its current economic growth model, it might be difficult for China to control urban expansion without sacrificing economic growth.
3) China’s policy to stop the loss of agricultural land, for food security, might be challenged by its policy to promote economic growth through urbanization.- (Bai et al, Environmental Science &Technology, 2012)

China’s urbanization model
– Landscape urbanization, and lowering density fueled by over reliance to land based revenue
– Concurrent with industrialization– Steep rise in consumption level and consumer
behavior
Urban Environmental Evolution (1)
• Cities are complex systems subject to constant change, the process of which can be viewed as a dynamic evolutionary process
• Urban environmental profiles of cities are diverse, but there are certain commonalities in the evolutionary trajectories among different cities
• (Source: Bai 2003)
3. Processes and Dynamics

Urban Environmental Evolution (2)
• However, the environmental evolution of cities exhibit a strong non-linearity in their trajectories, instead of following a fixed, stylized pattern;
• Each trajectory is shaped by a unique combination of endogenous and exogenous forces, reflecting both pressures from outside the system and the responses from within the city.
• (Source: Bai 2003)
3. Processes and Dynamics

Urban Experiments and Sustainability Transition
• If cities are evolving systems, is it possible to intervene and alter the future trajectory towards
sustainable end?

Solar energy use in Rizhao, China(Bai 2007, In: State of the World 2007)
4. Experiments and Transition

Sustainability Experiment
• Sustainability experiments are planned initiatives that embody a highly novel socio-technical configuration likely to lead to substantial (environmental) sustainability gains.
– Small initiatives in which the earliest stages of a process of socio-technical learning takes place.
– Typically bring together new networks of actors with knowledge, capabilities and resources, cooperating in a process of learning
– (Berkhout et al, 2010)
4. Experiments and Transition
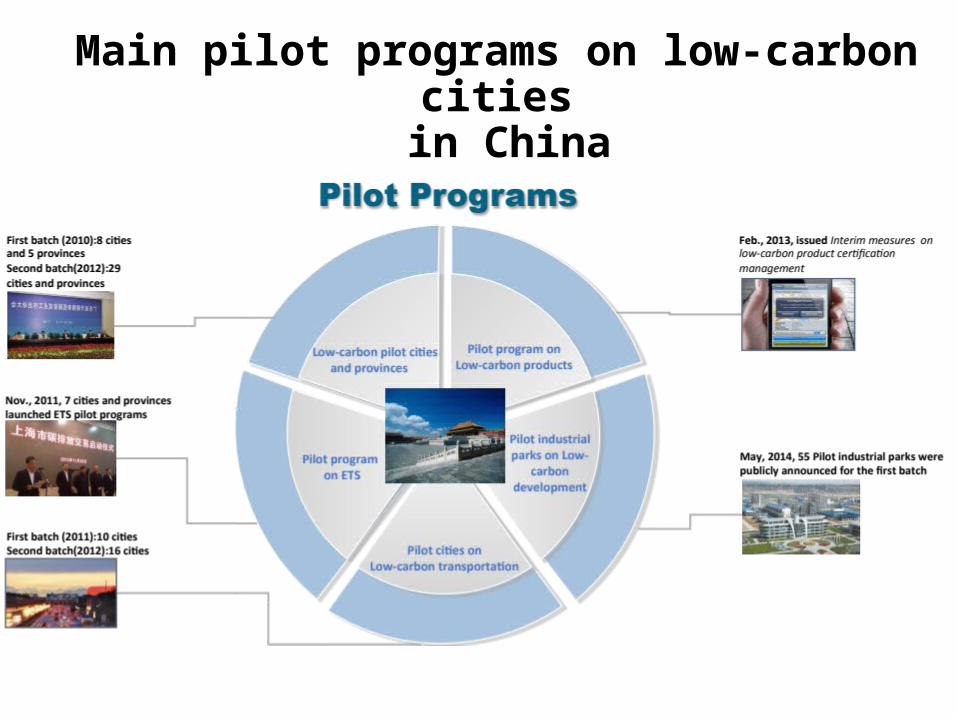
Main pilot programs on low-carbon cities in China

China’s low carbon city experiments
• Rizhao (Solar city model)
• Baoding (Low carbon industry model)
• Shenyang (Ground source heat pump model)
• Shanghai (Energy conservation building)
• Hangzhou (Public transport model)
• Chongqing (Forest City)

From single case learning to transferable knowledge?
• Single case learning often treated as too context specific or anecdotal in academic debate
• Lack of systematic, comprehensive analysis attempting to identify commonalities across large number of individual cases
• The need for understanding key characteristics and emerging common patterns, and extracting transferable knowledge across cases

Research Questions
• What contributes to the success of a “good” practice?
• Are there commonalities and emerging patterns across cases?
• What are the determining factors and mechanisms shaping these patterns?
• What are the sound analytical approaches for identifying them?
• - Bai et al (2010)
4. Experiments and Transition
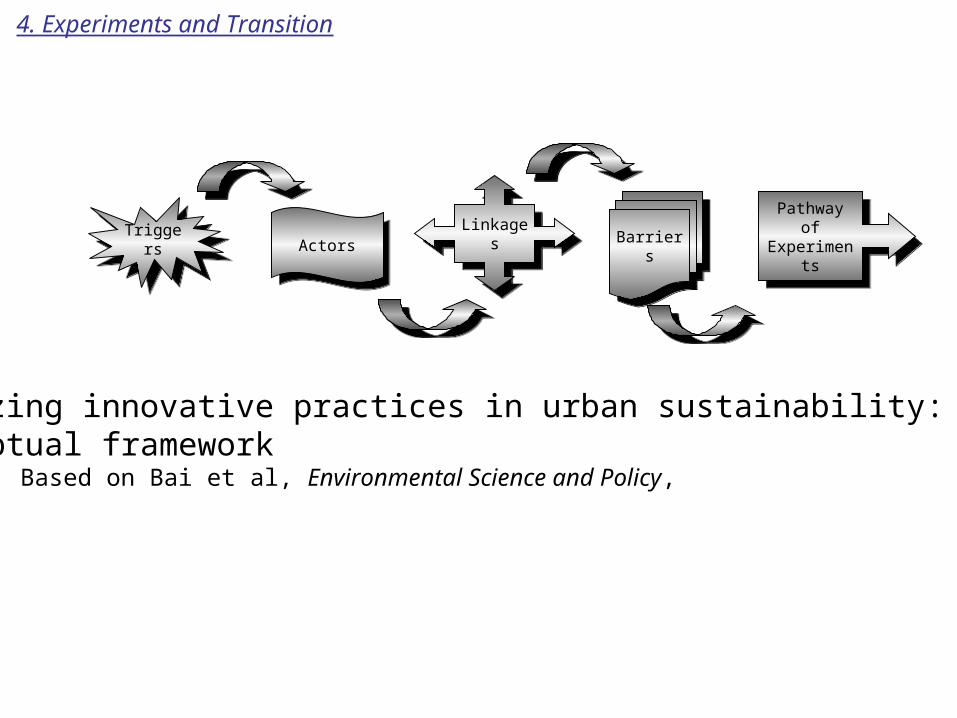
Pathway of Experiments
Pathway of ExperimentsTriggersTriggers
ActorsActorsBarriersBarriersLinkagesLinkages
Analyzing innovative practices in urban sustainability:Conceptual framework(Source: Based on Bai et al, Environmental Science and Policy, 2010)
Conceptual Framework4. Experiments and Transition

(Source: Bai et al, 2010)
4. Experiments and Transition

Fig. 1 – Distribution of primary triggers, actors, linkages and barriers according to different pathways. (Note: Prefix T, A, L, and B refers to Triggers, Actors, Linkages, and Barriers, respectively. For triggers, PCh, PCo, CC, PV, PH, O, EM, GC, ME and ND, represents policy change, pollution or congestion, community concern and action, poverty,public health issue, others, employment, global concern, media exposure, and natural disaster, respectively. For actors, LG, ID, SG, LC, LA, PS, IN, ME and O, represents localgovernment, international development assistance agencies, state/national government, local community, local activists, private sector, international NGOs, media, andothers, respectively. For linkages, CI, CB, LS, PP, IG, NP and O, represents cross/inter-agency involvement (horizontal integrated), community-based partnerships, localstategovernments (vertically integrated), public–private sector partnership PPP, international/global linkages, networks of program activities/experiments, and others,respectively. For Barriers, P, Ca, E, I, N, T, S, Cu, O, and H, represents political, capacity, economical/financial, institutional, natural/physical limits, technology, socialacceptance, cultural factors, others, and historical limits, respectively.)
(Source: Bai et al, 2010)

Findings from 30 Urban Sustainability Practices in Asia
• About half of all cases either multiplied or up-scaled to change system of practice
• Political aspect prominent for both success and failure, e.g. policy change as trigger, local government role as main actor, state government support, institutional aspect as major barrier
• Technology or cultural aspect seldom identified as major barrier
• Many international donor funded projects tend to stay as individual experiment, some times multiplied but seldom up-scaled to change system of practice
• (Bai et al 2010)
4. Experiments and Transition

39(Bai, X., P. Shi, Y. Liu 2014. Realizing China’s urban dream. Nature 509, 158-160.)

References• Bai, X., P. Shi, Y. Liu. 2014. Realizing China’s urban dream. Nature 509, pp158-160. • Deng, X. X. Bai. 2014. Sustainable urbanization in Western China. Environment: Science and
Policy for Sustainable Development, vol. 56, no. 3, pages 12–24.• Trencher, G., X. Bai, J. Evans, K McCormick, M. Yarime. 2014. University partnerships for co-
designing and co-producing urban sustainability. Global Environmental Change 28:153-165. • Lin, T., Y. YU, X.M. Bai, L. Feng, J. Wang. 2013. Carbon emission accounting of urban
residential consumption: a household survey based approach. PLoS ONE 8(2): e55642. 10.1371/journal.pone.0055642.
• Bai, X.M., J. Chen, P.J. Shi. 2012. Landscape urbanization and economic growth: Positive feedbacks and sustainability dilemmas. Environmental Science & Technology 46(1): 132–139.
• Li, G.L., X.M, Bai, S. Yu, H. Zhang, Y.G. Zhu. 2011. Urban phosphorus metabolism through food consumption: The case of China. Journal of Industrial Ecology. 16(4): 588-599. D
• Bai, XM., Roberts BH, Chen J. 2010. Urban Sustainability Experiments in Asia: Patterns and Pathways. Environmental Science & Policy 13(4):312-325.
• Grimm NB, Faeth SH, Golubiewski NE, Redman CL, Wu JG, Bai XM & Briggs JM, 2008. Global change and the ecology of cities. Science 319: 756-760.
• Bai, X.M. 2007 Integrating Global Concerns into Urban Management: The Scaleand Readiness Arguments. Journal of Industrial Ecology 11(2): 15-29.
• Bai, X. 2003. The Process and Mechanism of Urban Environmental Change: An Evolutionary View. International Journal of Environment and Pollution, 19(5):528-541.
• Bai, X.M. and H. Imura 2000. A comparative study of urban environment in East Asia: Stage model of urban environmental evolution. International Review for Global
Environmental Strategies. 1(1): 135-158.40
