xuemei gong et al.: mapping intellectual structure: a …
TRANSCRIPT
XUEMEI GONG ET AL.: MAPPING INTELLECTUAL STRUCTURE: A CO-CITATION ANALYSIS OF FOOD SAFETY IN CITESPACE II 1
Mapping Intellectual Structure: A Co-citation Analysis of Food Safety in CiteSpace II
Xuemei Gong, Ling Jiang, Haodong Yang and Fangwu Wei, College of Information Science and Technology, Drexel University
Abstract—Co-citation analysis has been a powerful method in exploring intellectual structure of knowledge domains. Many existing studies used co-citation analysis to map scientific literature in different research areas. Food safety has been attracting lots of attention from researchers, because food safety has significant impact on the well-being of human beings. In this work, we use CiteSpace II to conduct co-citation analysis in the field of food safety. Through document co-citation analysis and author co-citation analysis, we identify important articles, authors, as well as explore how topics evolve over time.
Index Terms— Document co-citation analysis, author co-citation analysis, food safety, CiteSpace II
—————————— ——————————
1 INTRODUCTIONibliographic citations in scientific literature can show the transferring of knowledge. Authors would cite the
papers that are important and related to their own re-search. Papers that are frequently cited together by other papers may have close relationship. Authors whose pa-pers are co-cited frequently are also related. Through cita-tions, documents or authors can be connected, construct-ing a network showing the whole picture of a discipline. Many researchers used citation data to visualize and ana-lyze the intellectual structure and research trends of sci-ence through various methods. Co-citation analysis is widely adopted to explore the intellectual structure of science. Through co-citation networks, we can know the whole structure of a discipline, identify important papers, authors and clusters which may represent the sub-areas or hot topics, and explore the relationship between differ-ent clusters. We can even know the changes of a disci-pline over years by comparing the periodical networks.
Food safety issues have caused wide public concern in all countries nowadays and have also been attracting re-searchers’ attention. Many studies have been done to solve food safety issues from different aspects. Food safe-ty is a research area focusing on handling, preparation and storage of food in ways that prevent foodborne dis-eases. It covers a broad range of research areas, including food labeling, food hygiene, food additives, pesticide res-idues, safe delivery and preparation of food, as well as policies on biotechnology and guidelines for manage-ment. It is meaningful to know the intellectual structure and evolvement of this discipline, and identify the re-search trend and front.
This study aims to visualize and analyze the structure of the field of food safety and how it evolves and changes over time. In the next section, we review the literature on co-citation analysis and research on food safety. In the third section, we briefly introduce the source and tool to collect and analyze data for case study. The fourth section includes visualized results based on document co-citation analysis and author co-citation analysis, as well as the discussion. The last section concludes the analysis and
briefly discusses the used data source, analysis tool and future work.
2 LITERATURE REVIEW 2.1 Co-citation Analysis Co-citation is a useful tool for mapping the intellectual structure of science. Co-citation is defined as a relation-ship which is established when two documents are cited together by later documents. The strength of this relation-ship is measured by the frequency with which two doc-uments are cited together [1]. Co-citation patterns are changing over time as documents are continually cited by later documents, leading to stronger relationship or new-ly-created relationship. If two documents are co-cited frequently, there is a relationship between them as the topics, key concepts or methods discussed may be relat-ed.
Co-citation methodology was also extended to authors, using the authors rather than the documents as the unit of analysis [2]. Authors whose works are co-cited frequently by later literature are related when mapped [3]. Author co-citation analysis provides a different way to under-stand the intellectual structure of science.
Co-citation data can be used to construct maps of sci-ence, which shows the relationships between disciplines, fields, specialties and individual papers or authors in an intuitive way, with their physical proximity and relative locations representing the strength of the relationships. With an overall map of the dataset, the multidisciplinary breadth of the document sample can be shown, while sub-maps present it at the document level [4]. Co-citation maps can facilitate our understanding of conceptual rela-tionships and developments. Within a map, visually sali-ent nodes can be identified, and the nature of their intel-lectual contributions can be validated. A searching for intellectual turning points can be narrowed down to the salient nodes [5]. Documents or authors which are repeat-edly cited together tend to cluster together when mapped. Clusters and linkages between clusters are investigated to
B
2 PROJECT D
identify different areas, explore the connections between areas. Co-citation networks are also decomposed into co-citation clusters, and then investigated by characterizing and interpreting the structure and dynamics of co-citation clusters [6]. Through the periodical maps, changes on the composition of disciplines are able to be tracked [7], the topical trends can also be revealed, in addition to the pre-dominant research areas [8, 9].
Both document co-citation analysis and author co-citation analysis have been applied by researchers to vis-ualize and investigate the structure of science. Culnan adopted author co-citation analysis to investigate and assess the intellectual development of management in-formation systems [3]. White and McCain found that au-thor co-citation analysis is useful for rendering the inertia of fields as most of the author placements on maps persist over three 8-year periods, showing the overall stability of information science[7]. Co-citation analysis of papers, as opposed to authors, can capture disciplinary history at a different, faster rate, which may better suit fields with livelier research fronts [7].
Co-citation analysis was further studied and improved by many researchers. Chen extended and transformed traditional author co-citation analysis by extracting struc-tural patterns from the scientific literature and represent-ing them in a 3D knowledge landscape [10], and also de-veloped a software called CiteSpace II to facilitate the visualization [11]. He and Hui proposed a mining process to automate the author co-citation analysis based on the Web Citation Database [12]. Author co-citation analysis was further improved by introducing advanced similarity measures to normalize and visualize the co-citation data [13], which can influence the visualizations of authors or documents. It was found that similarity measures had greater influences on network of documents than that of authors [14].
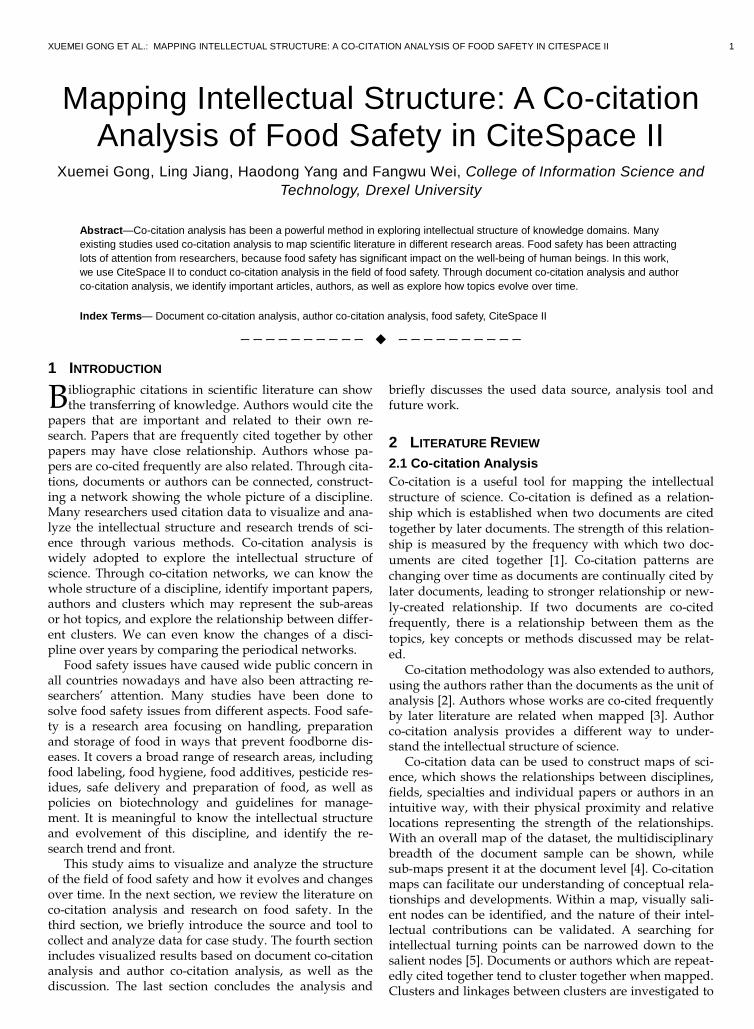
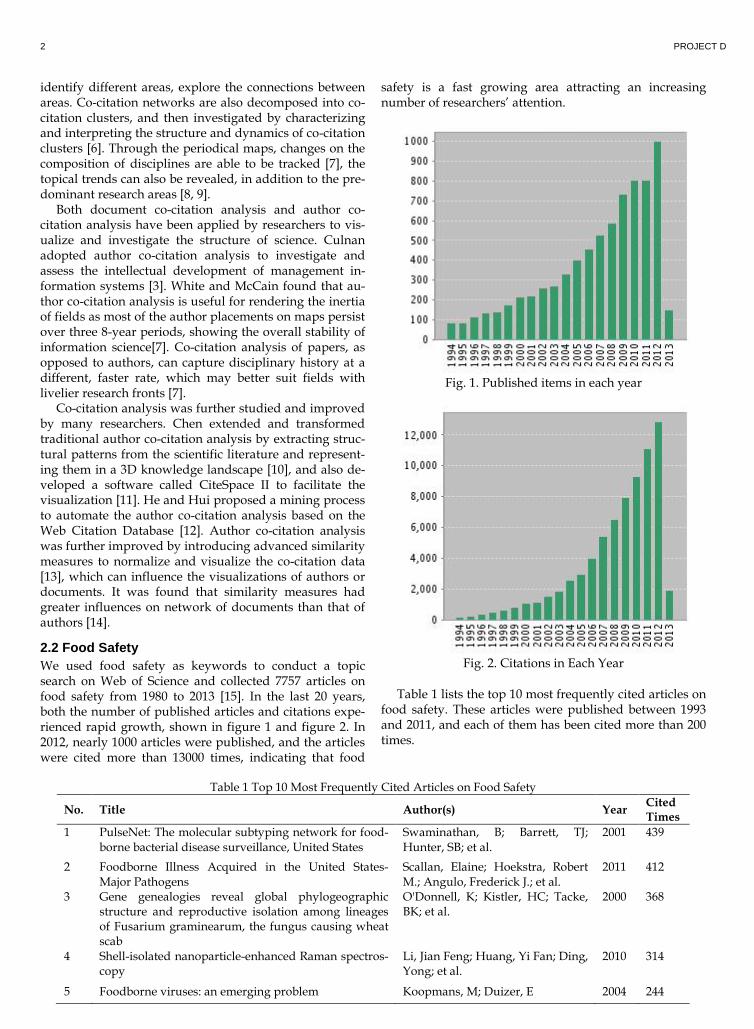
2.2 Food Safety We used food safety as keywords to conduct a topic search on Web of Science and collected 7757 articles on food safety from 1980 to 2013 [15]. In the last 20 years, both the number of published articles and citations expe-rienced rapid growth, shown in figure 1 and figure 2. In 2012, nearly 1000 articles were published, and the articles were cited more than 13000 times, indicating that food
safety is a fast growing area attracting an increasing number of researchers’ attention.
Fig. 1. Published items in each year
Fig. 2. Citations in Each Year
Table 1 lists the top 10 most frequently cited articles on
food safety. These articles were published between 1993 and 2011, and each of them has been cited more than 200 times.
Table 1 Top 10 Most Frequently Cited Articles on Food Safety
No. Title Author(s) Year Cited Times
1 PulseNet: The molecular subtyping network for food-borne bacterial disease surveillance, United States
Swaminathan, B; Barrett, TJ; Hunter, SB; et al.
2001 439
2 Foodborne Illness Acquired in the United States-Major Pathogens
Scallan, Elaine; Hoekstra, Robert M.; Angulo, Frederick J.; et al.
2011 412
3 Gene genealogies reveal global phylogeographic structure and reproductive isolation among lineages of Fusarium graminearum, the fungus causing wheat scab
O'Donnell, K; Kistler, HC; Tacke, BK; et al.
2000 368
4 Shell-isolated nanoparticle-enhanced Raman spectros-copy
Li, Jian Feng; Huang, Yi Fan; Ding, Yong; et al.
2010 314
5 Foodborne viruses: an emerging problem Koopmans, M; Duizer, E 2004 244
XUEMEI GONG ET AL.: MAPPING INTELLECTUAL STRUCTURE: A CO-CITATION ANALYSIS OF FOOD SAFETY IN CITESPACE II 3
6 Effects of high-hydrostatic-pressure processes on food safety and quality
Knorr, D 1993 239
7 On the use of the Weibull model to describe thermal inactivation of microbial vegetative cells
van Boekel, MAJS 2002 232
8 Prevalence of Campylobacter spp., Escherichia coli, and Salmonella serovars in retail chicken, turkey, pork, and beef from the Greater Washington, DC, area
Zhao, CW; Ge, BL; De Villena, J; et al.
2001 231
9 Governance and trade in fresh vegetables: The impact of UK supermarkets on the African horticulture in-dustry
Dolan, C; Humphrey, J 2000 216
10 Quantitative risk assessment for Escherichia coli O157 : H7 in ground beef hamburgers
Cassin, MH; Lammerding, AM; Todd, ECD; et al.
1998 209
Table 2 list top 10 authors on food safety according to
the number of articles they published. Friedman M, Chen YR and Pavlik I published more than 30 articles.
Table 2 Top 10 Authors on Food Safety
No. Authors Record Count % of 7757
1 Friedman M 37 0.477%
2 Chen YR 35 0.451%
3 Pavlik I 30 0.387%
4 Kim MS 28 0.361%
5 Anonymous 27 0.348%
6 Anderson RC 24 0.309%
7 Zwietering MH 23 0.297%
8 Uyttendaele M 22 0.284%
9 Chao K 21 0.271%
10 Nisbet DJ 21 0.271%
11 Frewer LJ 20 0.258 %
On Web of Science, each article belongs to one or more research areas. Table 3 lists the top 10 research areas to which the articles on food safety belong. Nearly half of the research studies were published in the area of food science technology, followed by agriculture and biotech-nology applied microbiology.
Table 3 Top 10 Research Areas in Which Papers on Food Safety Were Published
No. Research Areas
Record Count
% of 7757
1 Food Science Technology 3352 43.213%
2 Agriculture 1149 14.812%
3 Biotechnology Applied Micro-biology 982 12.660
%
4 Chemistry 981 12.647%
5 Microbiology 742 9.566%
6 Veterinary Sciences 725 9.346%
7 Nutrition Dietetics 521 6.717%
8 Environmental Sciences Ecolo- 424 5.466%
gy
9 Public Environmental Occupa-tional Health 417 5.376%
10 Business Economics 414 5.337%
3 METHODOLOGY
3.1 Data Collection Food safety has been a hot topic for the past decades. To get a panoramic view of the study on food safety, data for analysis was collected from Web of Science. Web of sci-ence is an online academic citation index developed by Thomson Reuters [16], which provides researchers with quick and powerful access to the world’s leading citation databases [15]. The data was collected from three citation databases: Science Citation Index Expanded, Social Sci-ences Citation Index and Arts & Humanities Citation In-dex.
3.2 Co-citation Analysis Co-citation analysis, which is a well-established technique in bibliometrics, has been a powerful method in exploring intellectual structure of knowledge domains. Many exist-ing studies used Author Co-citation Analysis (ACA) to map scientific literature in different research areas, using author as the unit of analysis. ACA is based on the times that two authors are cited together, regardless of which of their works are cited [7]. Here “author” means an oeuvre- a body of writings by a person. Therefore, the more fre-quently two authors are cited together, and the more sim-ilar their patterns of co-citations with each other, the clos-er if the relationship between them [17]. The document could also be the unit of analysis, and co-citation of a pair of documents will represent the relationship between them. The more two documents are cited together, the closer the relationship between them. Co-citation analysis illustrated the relationship among literatures in a two-dimensional network, and shows the literatures change over time. Through co-citation analysis, we could identify key authors and articles in certain knowledge domain, as well as learn how topics evolve and contribute to the de-velopment of the knowledge domain.
4 PROJECT D
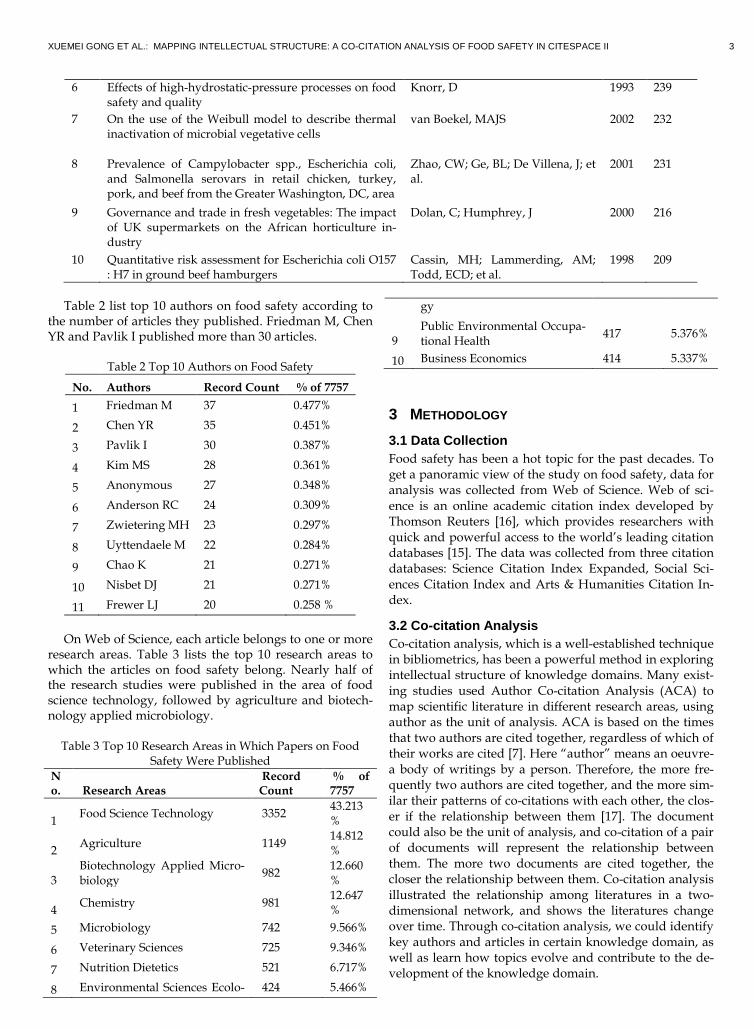
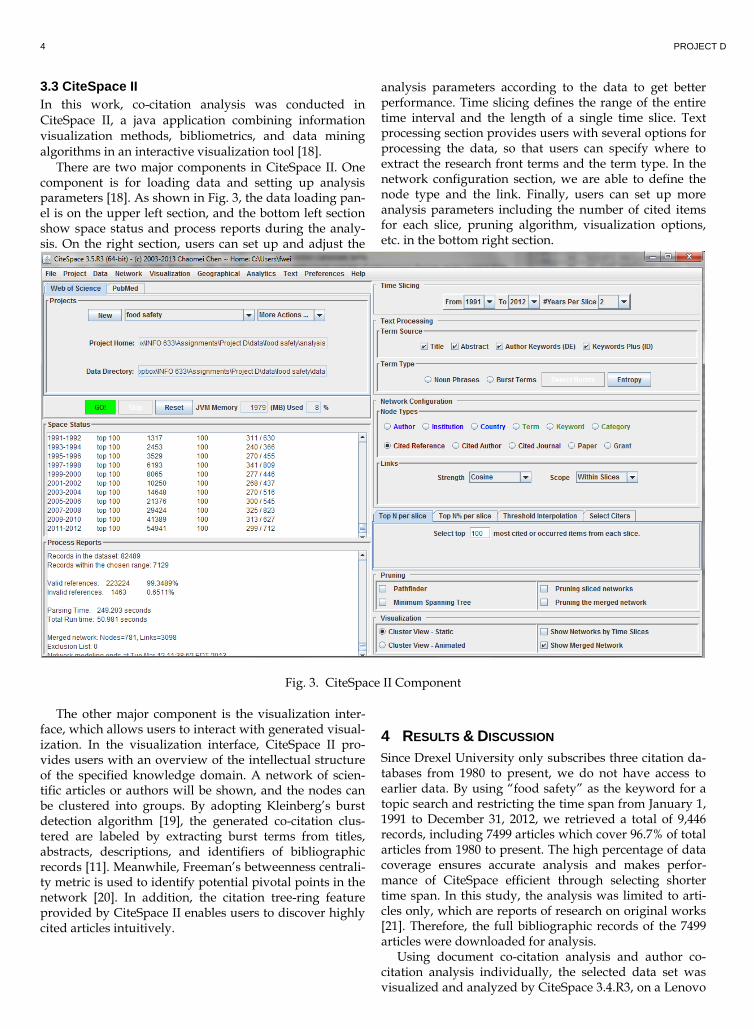
3.3 CiteSpace II In this work, co-citation analysis was conducted in CiteSpace II, a java application combining information visualization methods, bibliometrics, and data mining algorithms in an interactive visualization tool [18].
There are two major components in CiteSpace II. One component is for loading data and setting up analysis parameters [18]. As shown in Fig. 3, the data loading pan-el is on the upper left section, and the bottom left section show space status and process reports during the analy-sis. On the right section, users can set up and adjust the
analysis parameters according to the data to get better performance. Time slicing defines the range of the entire time interval and the length of a single time slice. Text processing section provides users with several options for processing the data, so that users can specify where to extract the research front terms and the term type. In the network configuration section, we are able to define the node type and the link. Finally, users can set up more analysis parameters including the number of cited items for each slice, pruning algorithm, visualization options, etc. in the bottom right section.
Fig. 3. CiteSpace II Component
The other major component is the visualization inter-face, which allows users to interact with generated visual-ization. In the visualization interface, CiteSpace II pro-vides users with an overview of the intellectual structure of the specified knowledge domain. A network of scien-tific articles or authors will be shown, and the nodes can be clustered into groups. By adopting Kleinberg’s burst detection algorithm [19], the generated co-citation clus-tered are labeled by extracting burst terms from titles, abstracts, descriptions, and identifiers of bibliographic records [11]. Meanwhile, Freeman’s betweenness centrali-ty metric is used to identify potential pivotal points in the network [20]. In addition, the citation tree-ring feature provided by CiteSpace II enables users to discover highly cited articles intuitively.
4 RESULTS & DISCUSSION Since Drexel University only subscribes three citation da-tabases from 1980 to present, we do not have access to earlier data. By using “food safety” as the keyword for a topic search and restricting the time span from January 1, 1991 to December 31, 2012, we retrieved a total of 9,446 records, including 7499 articles which cover 96.7% of total articles from 1980 to present. The high percentage of data coverage ensures accurate analysis and makes perfor-mance of CiteSpace efficient through selecting shorter time span. In this study, the analysis was limited to arti-cles only, which are reports of research on original works [21]. Therefore, the full bibliographic records of the 7499 articles were downloaded for analysis.
Using document co-citation analysis and author co-citation analysis individually, the selected data set was visualized and analyzed by CiteSpace 3.4.R3, on a Lenovo

XUEMEI GONG ET AL.: MAPPING INTELLECTUAL STRUCTURE: A CO-CITATION ANALYSIS OF FOOD SAFETY IN CITESPACE II 5
ThinkStation with two 2.13 GHz Intel Xeon processors and allocated 8GB of 12GB RAM.
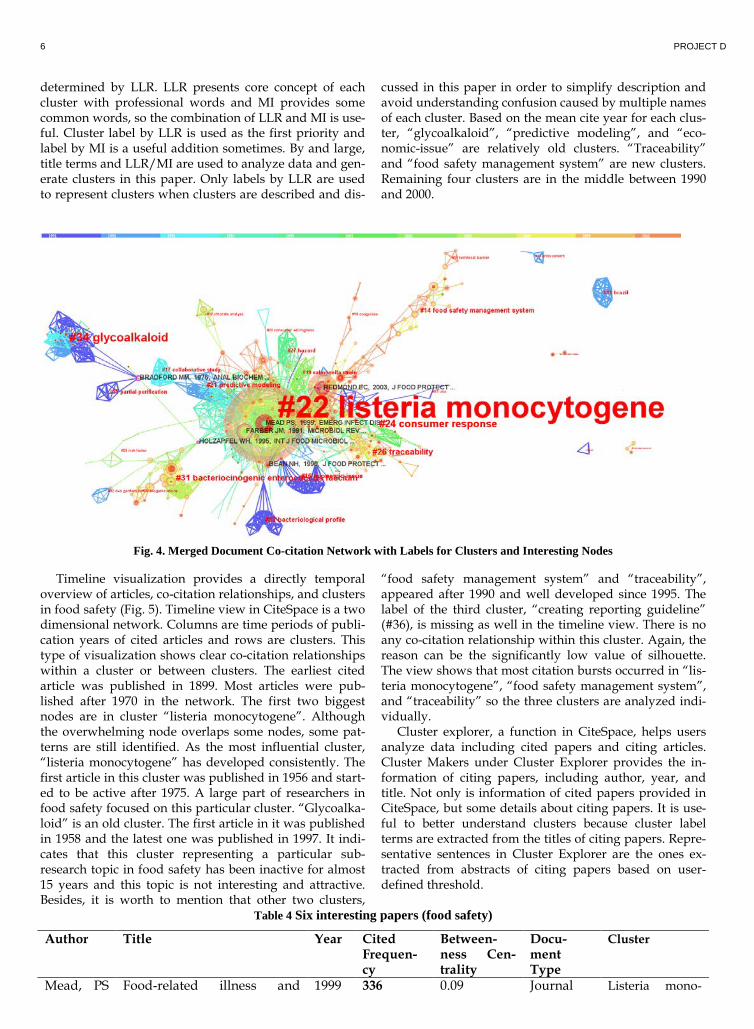
4.1 Document Co-citation Analysis CiteSpace analyzes formatted bibliographic records in food safety collected from Web of Science and generates visualized bibliographic network (Fig. 4). Six articles are highlighted and clusters are labeled. There are 781 unique nodes and 3098 links in the merged network in terms of 2-year/time-slice. Nodes and links represent the cited pa-pers and co-citation relationship in a network, respective-ly. Link colors represent different time slices and indicate the time period of co-citation relationship occurring for the first time. The color scheme of sequential time slices follows a gradual change from blue to orange. For exam-ple, a green link represents a co-citation relationship oc-curring first time around 2000. A node with bigger size indicates the article was cited more frequently. Some of nodes with several rings with different colors are the arti-cles cited during several time slices so it implies these articles are potentially important. The highlighted nodes with purple circle are the papers with high betweenness centrality in the food safety co-citation network. They are possibly important nodes connecting two clusters. It is worth noting that some nodes do not strictly follow the color scheme of time slice because of red rings, which indicates that the citation frequency of these papers sharply increased during some certain time slices. These time slices are highlighted with red rings and are called “citation bursts”. Citation bursts actually capture the sig-nificant increases of research interests in a field [11, 19]. Table 4 presents the first two articles [22, 23] with the highest cited frequency and the first four articles [24-27] with the highest betweenness centrality. The six publica-tions are all journal articles. Five of them belong to the same cluster, “listeria monocytogene”. The only exception is the one written by Bradford, belonging to “partial-purification”.
The five articles in the same cluster all discussed food safety, especially foodborne disease, but focused on dif-ferent views. Mead’s paper discussed “new estimates of illnesses, hospitalizations, and deaths due to foodborne diseases in the United States” and the purpose of this pa-per is to develop some new and accurate estimates in or-der to “guide prevention efforts and assess the effective-ness of food safety regulations” [22]. Redmond and Grif-fith reviewed the previous food safety studies and ana-lyzed the approaches reducing the risk of foodborne dis-eases [23]. They thoroughly examined the epidemiologi-cal data from different countries and methodology used in previous studies. The two papers both focused on gen-eral topics related to foodborne diseases and authors did not analyze specific topics. Researchers studying any sub topic in foodborne diseases could use these papers as ref-erences. It is a potential reason why the two papers have the highest cited frequency. Holzapfel’s paper discussed a specialized research topic, biological preservation of foods [27]. Specifically, Protective cultures, bacteriocins, and enzymes were analyzed separately. Bradford focused
on another specialized topic, protein purification, and discussed about methods for quantitation of protein [24]. The two papers can be easily identified as pivotal points connecting two separate clusters in the visualized net-work so they have the highest centrality. Other two pa-pers with high centrality both discussed foodborne dis-ease but the focus of each paper was still different. Farber and Peterkin analyzed one single foodborne pathogen, listeria monocytogenes [26]. Bean and Griffin compared pathogens using temporal analysis to find out trends of foodborne disease outbreaks [25].
Identifying potentially critical articles is the first step to analyze the bibliographic records. The second step is to discover clustering patterns in the network and to ana-lyze trends in a research field. Using log-likelihood ratio (LLR) in the food safety network, CiteSpace generated clusters labeled by title terms occurring in citing articles (Fig. 4). The size of label indicates the size of cluster, so a larger cluster with more articles has bigger label. The food safety network is divided into 45 co-citation clusters. “Listeria monocytogene”, centered in the network, can be easily identified as the largest cluster based on the associ-ated label size. It is a predominant cluster in the network. Other clusters have few connections with each other and the primary cluster plays a hub role in connecting them. Five of six important articles mentioned earlier are in this cluster. Glycoalkaloid and consumer response are other two large clusters which can be identified easily without cluster statistics. Based on the color scheme, glycoalkaloid is a relatively old cluster because most co-citation rela-tionships first occurred before 2000. Besides, Bacterioci-nogenic enterococcus faecium, traceability, food safety management system, predictive modeling, and economic issue are five smaller but still easily identified clusters. Based on the colors of time slices, the first three are rela-tively new and the last two are old (before 1995).
Table 5, generated by CiteSpace, describes the nine largest clusters. As observed, “listeria monocytogene” and “glycoalkaloid” are the first two largest clusters. “Lis-teria monocytogene” contains 334 articles and its size is far larger than others. Clusters, including from the fourth to the ninth largest one, were identified earlier based on the visualized cluster network. It is interesting to note that the third largest one, “creating reporting guideline”, cannot be identified in the network because there is no label for this cluster. The possible reason is the value of silhouette of this cluster is very low, close to 0. Silhouette is a parameter to evaluate and validate clusters of data. Its range is typically from 0 to 1. Higher value indicates a better data clustering. Using CiteSpace, cluster labels can be shown with title terms, indexing terms, or abstract terms occurring in citing papers. Each type of labels is calculated and determined by any of three algorithms: TF/IDF, log-likelihood ratio (LLR), or mutual information (MI). Comparing networks generated by using the three types of extracted terms, size, silhouette, and mean cite year are the same for each cluster. Cluster labels with title terms show more reasonable results so title terms are used to label clusters. Comparing the three algorithms, labels using TF/IDF are basically the same with the ones
6 PROJECT D
determined by LLR. LLR presents core concept of each cluster with professional words and MI provides some common words, so the combination of LLR and MI is use-ful. Cluster label by LLR is used as the first priority and label by MI is a useful addition sometimes. By and large, title terms and LLR/MI are used to analyze data and gen-erate clusters in this paper. Only labels by LLR are used to represent clusters when clusters are described and dis-
cussed in this paper in order to simplify description and avoid understanding confusion caused by multiple names of each cluster. Based on the mean cite year for each clus-ter, “glycoalkaloid”, “predictive modeling”, and “eco-nomic-issue” are relatively old clusters. “Traceability” and “food safety management system” are new clusters. Remaining four clusters are in the middle between 1990 and 2000.
Fig. 4. Merged Document Co-citation Network with Labels for Clusters and Interesting Nodes
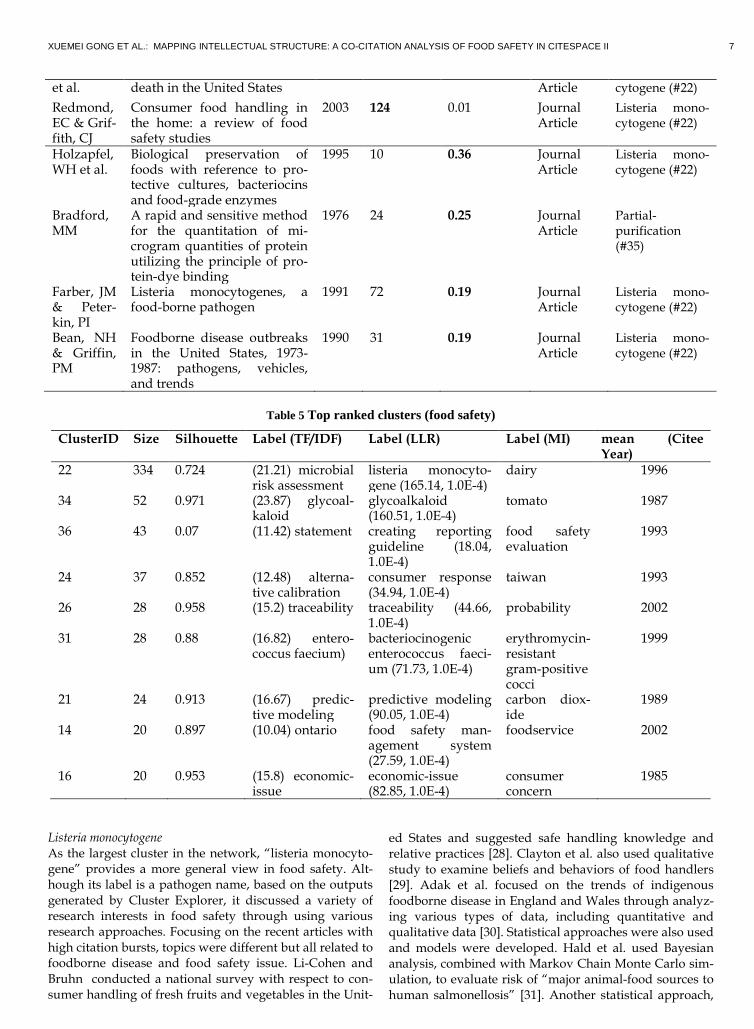
Timeline visualization provides a directly temporal overview of articles, co-citation relationships, and clusters in food safety (Fig. 5). Timeline view in CiteSpace is a two dimensional network. Columns are time periods of publi-cation years of cited articles and rows are clusters. This type of visualization shows clear co-citation relationships within a cluster or between clusters. The earliest cited article was published in 1899. Most articles were pub-lished after 1970 in the network. The first two biggest nodes are in cluster “listeria monocytogene”. Although the overwhelming node overlaps some nodes, some pat-terns are still identified. As the most influential cluster, “listeria monocytogene” has developed consistently. The first article in this cluster was published in 1956 and start-ed to be active after 1975. A large part of researchers in food safety focused on this particular cluster. “Glycoalka-loid” is an old cluster. The first article in it was published in 1958 and the latest one was published in 1997. It indi-cates that this cluster representing a particular sub-research topic in food safety has been inactive for almost 15 years and this topic is not interesting and attractive. Besides, it is worth to mention that other two clusters,
“food safety management system” and “traceability”, appeared after 1990 and well developed since 1995. The label of the third cluster, “creating reporting guideline” (#36), is missing as well in the timeline view. There is no any co-citation relationship within this cluster. Again, the reason can be the significantly low value of silhouette. The view shows that most citation bursts occurred in “lis-teria monocytogene”, “food safety management system”, and “traceability” so the three clusters are analyzed indi-vidually.
Cluster explorer, a function in CiteSpace, helps users analyze data including cited papers and citing articles. Cluster Makers under Cluster Explorer provides the in-formation of citing papers, including author, year, and title. Not only is information of cited papers provided in CiteSpace, but some details about citing papers. It is use-ful to better understand clusters because cluster label terms are extracted from the titles of citing papers. Repre-sentative sentences in Cluster Explorer are the ones ex-tracted from abstracts of citing papers based on user-defined threshold.
Table 4 Six interesting papers (food safety)
Author Title Year Cited Frequen-cy
Between-ness Cen-trality
Docu-ment Type
Cluster
Mead, PS Food-related illness and 1999 336 0.09 Journal Listeria mono-
XUEMEI GONG ET AL.: MAPPING INTELLECTUAL STRUCTURE: A CO-CITATION ANALYSIS OF FOOD SAFETY IN CITESPACE II 7
et al. death in the United States Article cytogene (#22) Redmond, EC & Grif-fith, CJ
Consumer food handling in the home: a review of food safety studies
2003 124 0.01 Journal Article
Listeria mono-cytogene (#22)
Holzapfel, WH et al.
Biological preservation of foods with reference to pro-tective cultures, bacteriocins and food-grade enzymes
1995 10 0.36 Journal Article
Listeria mono-cytogene (#22)
Bradford, MM
A rapid and sensitive method for the quantitation of mi-crogram quantities of protein utilizing the principle of pro-tein-dye binding
1976 24 0.25 Journal Article
Partial-purification (#35)
Farber, JM & Peter-kin, PI
Listeria monocytogenes, a food-borne pathogen
1991 72 0.19 Journal Article
Listeria mono-cytogene (#22)
Bean, NH & Griffin, PM
Foodborne disease outbreaks in the United States, 1973-1987: pathogens, vehicles, and trends
1990 31 0.19 Journal Article
Listeria mono-cytogene (#22)
Table 5 Top ranked clusters (food safety)
ClusterID Size Silhouette Label (TF/IDF) Label (LLR) Label (MI) mean (Citee Year)
22 334 0.724 (21.21) microbial risk assessment
listeria monocyto-gene (165.14, 1.0E-4)
dairy 1996
34 52 0.971 (23.87) glycoal-kaloid
glycoalkaloid (160.51, 1.0E-4)
tomato 1987
36 43 0.07 (11.42) statement creating reporting guideline (18.04, 1.0E-4)
food safety evaluation
1993
24 37 0.852 (12.48) alterna-tive calibration
consumer response (34.94, 1.0E-4)
taiwan 1993
26 28 0.958 (15.2) traceability traceability (44.66, 1.0E-4)
probability 2002
31 28 0.88 (16.82) entero-coccus faecium)
bacteriocinogenic enterococcus faeci-um (71.73, 1.0E-4)
erythromycin-resistant gram-positive cocci
1999
21 24 0.913 (16.67) predic-tive modeling
predictive modeling (90.05, 1.0E-4)
carbon diox-ide
1989
14 20 0.897 (10.04) ontario food safety man-agement system (27.59, 1.0E-4)
foodservice 2002
16 20 0.953 (15.8) economic-issue
economic-issue (82.85, 1.0E-4)
consumer concern
1985
Listeria monocytogene As the largest cluster in the network, “listeria monocyto-gene” provides a more general view in food safety. Alt-hough its label is a pathogen name, based on the outputs generated by Cluster Explorer, it discussed a variety of research interests in food safety through using various research approaches. Focusing on the recent articles with high citation bursts, topics were different but all related to foodborne disease and food safety issue. Li-Cohen and Bruhn conducted a national survey with respect to con-sumer handling of fresh fruits and vegetables in the Unit-
ed States and suggested safe handling knowledge and relative practices [28]. Clayton et al. also used qualitative study to examine beliefs and behaviors of food handlers [29]. Adak et al. focused on the trends of indigenous foodborne disease in England and Wales through analyz-ing various types of data, including quantitative and qualitative data [30]. Statistical approaches were also used and models were developed. Hald et al. used Bayesian analysis, combined with Markov Chain Monte Carlo sim-ulation, to evaluate risk of “major animal-food sources to human salmonellosis” [31]. Another statistical approach,
8 PROJECT D
hierarchical cluster analysis, was used to identify and categorize sub-population based on their food safety knowledge [32]. The cluster label by MI is “dairy”. The potential reason is that a significant correlation between listeria monocytogene and dairy products exists [33]. Food safety management system This cluster does not discuss the computer-based system, but a macro-level, systematic mechanism that ensures food safety. It focuses on issues related to food safety from public policy, regulation, administration, and soci-ology perspectives. Henson and Caswell discussed food safety regulation and provided a high-level analysis
about issues affecting development of food safety regula-tion [34]. Dolan and Humphrey analyzed the similar ad-ministration in food control, but they focused on the en-tire process of fresh vegetables chain, especially the crite-ria of exporting vegetables from Africa [35]. Hatanaka et al. also mentioned privacy governance became a trend in food safety and food control and they identified that su-permarkets played an important role in making food reg-ulation and operating governance [36]. In other words, this cluster focuses on food service.
Fig. 5. Timeline view (food safety)
Traceability Consumer concern in food safety has been a “hot” issue that leads to increasing needs for information in a food chain. It is a primary reason why “traceability” has been a popular research topic. In other words, consumer concern stimulates the development of this research topic. Focus-ing on articles with high citation bursts, many of them analyzed perceptions, reactions, responses, and concerns of consumers, professionals, and stakeholders with vari-ous food safety issues (e.g. general food risk management or food quality concerns, or a specific foodborne disease) [37-41]. Through considering consumers, professionals, and stakeholders as target populations in studies, re-searchers tried to capture the target population’s opinions in order to improve better monitor entire food chain, make information more transparent, and ensure food
safety. Biological study has been a primary part in food safety.
Many researchers focus on foodborne diseases through analyzing certain pathogens or food sources from a bio-logical perspective. The consumer has become a major research target gradually even though some pathogens were still focused. Consumer’s knowledge and behaviors related to food safety were examined by researchers in order to reduce safety risk and control foodborne diseases from human side. Different from traditional study, food regulation and policy and consumer’s perceptions of food safety have become new research interests. These social side studies from political and cognitive perspectives make research in food safety more complete and more thorough. Human-side study is a critical part finally for most research topics because humans are end-users. Their
XUEMEI GONG ET AL.: MAPPING INTELLECTUAL STRUCTURE: A CO-CITATION ANALYSIS OF FOOD SAFETY IN CITESPACE II 9
knowledge, behaviors, and final decisions are influential to academic and real life studies and, to some extent, stimulate the shifts of research interests.
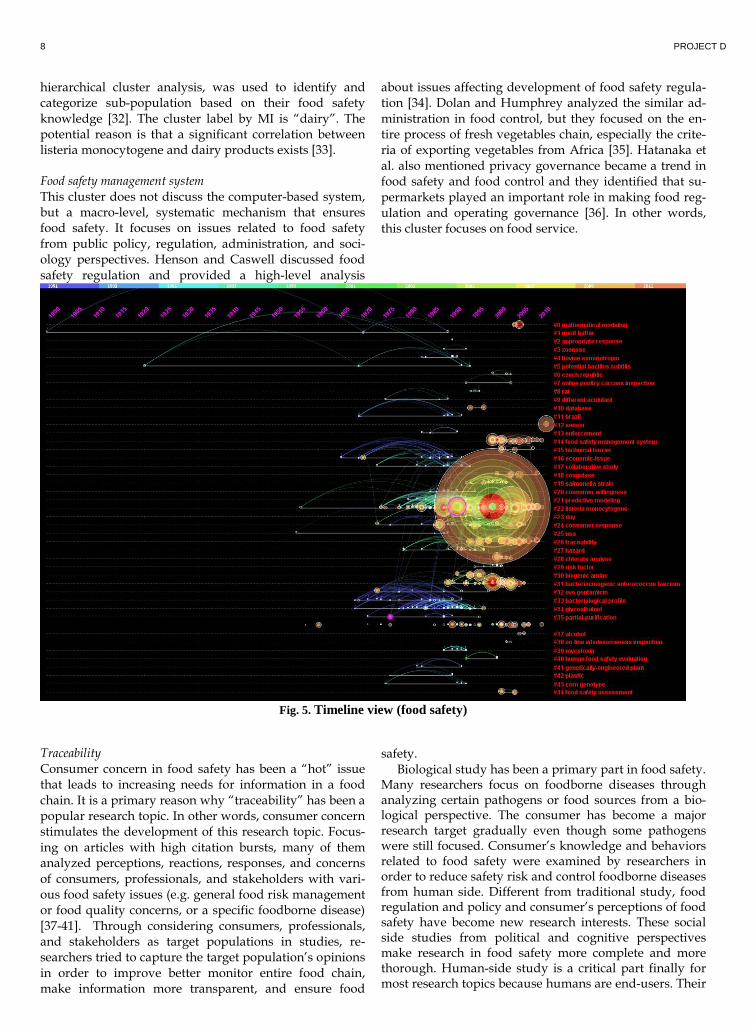
4.2 Author Co-citation Analysis In this project, given the dataset we collected from Web of Science, we also used CiteSpace to conduct visualization and analysis of author co-citation network in the field of food safety from 1991 to 2012. Fig. 6 shows the merged author co-citation network in which there are 585 nodes and 2716 links without pruning of minimum spanning tree based on 2 years’ time slice, where red labels are the
cluster names which are extracted from titles of all the citing articles by LLR, and black labels are names of some interesting nodes in terms of times cited or betweenness centrality. Each node stands for an author, institution or organization and each link connecting two nodes repre-sents the co-citation relationship between the two nodes. As we can see, two major clusters have been generated and named with “listeria monocytogene” and “glycoalka-loid” respectively by CiteSpace using title term extraction from citing papers based on LLR algorithm. The size of labels proportionally denotes the size of clusters.
Fig. 6. Merged Author Co-citation Network with Labels for Clusters and Interesting Nodes
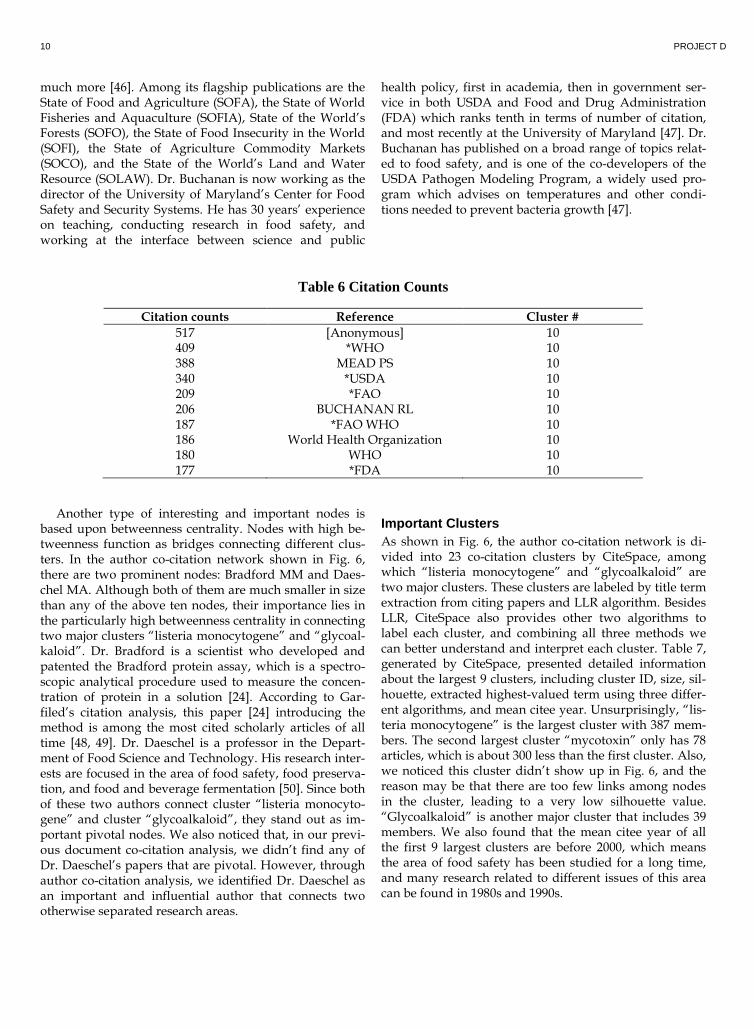
Important Nodes Table 6, generated by CiteSpace, provides detailed infor-mation about the top ten most cited authors or organiza-tions., including citation counts, author name, and cluster number that the author belongs to.
As we can see, all the ten most cited authors are from cluster 10. The first author is “[Anonymous]” which is not of interest because it might just be a combination of many references without explicit author information. We also notice that for the same organization, there may be differ-ent names appearing in different articles. For example, as shown in Table 6, the World Health Organization can also be identified by *WHO and WHO. Therefore, the real most cited author is WHO (the second biggest circle in Fig. 6), which is the directing and coordinating authority for health within the United Nations system. It is respon-sible for providing leadership on global health matters, shaping the health research agenda, setting norms and standards, articulating evidence-based policy options, providing technical support to countries and monitoring and assessing health trends [42]. Paul S. Mead, with 388 co-citations, is the second most cited author. Dr. Mead is a foodborne expert and is working as chief of the Division of Vector-Borne Diseases, U.S. Center for Disease Control and Prevention. Many of his studies have been cited ex-tensively among which paper [22] is a classic and has the
most citations. With 340 citations, USDA, standing for the United States Department of Agriculture, is the United States federal executive department responsible for de-veloping executing U.S. federal government policy on food as well as farming, agriculture, and forestry [43]. With food safety being one of the various aims, USDA has conducted and provided abundant research on food safe-ty in U.S. households and communities [44]. This research facilitates informed public debate regarding food securi-ty, and its impact on the well-being of children, adults, families, and communities, as well as its relationship to public policies, public assistance programs, and the econ-omy [44]. FAO – Food and Agriculture Organization of the United Nations – is another organization which ranks fifth among the top ten authors. FAO is dedicated to achieving food safety for all to make sure people in both developing and developed countries have regular access to enough high-quality food to live active and health lives [45]. As a knowledge organization, FAO creates and shares critical information about food, agriculture and natural resources in the form of global public goods [45]. Publications play a central role to FAO’s work as a knowledge organization, and to inform public debate and policy-making at national and international levels. more than 300 titles per year are published on topics such as hunger, food security, commodity markets, climate change, nutrition, fisheries, forests, rural livelihoods and
10 PROJECT D
much more [46]. Among its flagship publications are the State of Food and Agriculture (SOFA), the State of World Fisheries and Aquaculture (SOFIA), State of the World’s Forests (SOFO), the State of Food Insecurity in the World (SOFI), the State of Agriculture Commodity Markets (SOCO), and the State of the World’s Land and Water Resource (SOLAW). Dr. Buchanan is now working as the director of the University of Maryland’s Center for Food Safety and Security Systems. He has 30 years’ experience on teaching, conducting research in food safety, and working at the interface between science and public
health policy, first in academia, then in government ser-vice in both USDA and Food and Drug Administration (FDA) which ranks tenth in terms of number of citation, and most recently at the University of Maryland [47]. Dr. Buchanan has published on a broad range of topics relat-ed to food safety, and is one of the co-developers of the USDA Pathogen Modeling Program, a widely used pro-gram which advises on temperatures and other condi-tions needed to prevent bacteria growth [47].
Table 6 Citation Counts
Citation counts Reference Cluster # 517 [Anonymous] 10 409 *WHO 10 388 MEAD PS 10 340 *USDA 10 209 *FAO 10 206 BUCHANAN RL 10 187 *FAO WHO 10 186 World Health Organization 10 180 WHO 10 177 *FDA 10
Another type of interesting and important nodes is based upon betweenness centrality. Nodes with high be-tweenness function as bridges connecting different clus-ters. In the author co-citation network shown in Fig. 6, there are two prominent nodes: Bradford MM and Daes-chel MA. Although both of them are much smaller in size than any of the above ten nodes, their importance lies in the particularly high betweenness centrality in connecting two major clusters “listeria monocytogene” and “glycoal-kaloid”. Dr. Bradford is a scientist who developed and patented the Bradford protein assay, which is a spectro-scopic analytical procedure used to measure the concen-tration of protein in a solution [24]. According to Gar-filed’s citation analysis, this paper [24] introducing the method is among the most cited scholarly articles of all time [48, 49]. Dr. Daeschel is a professor in the Depart-ment of Food Science and Technology. His research inter-ests are focused in the area of food safety, food preserva-tion, and food and beverage fermentation [50]. Since both of these two authors connect cluster “listeria monocyto-gene” and cluster “glycoalkaloid”, they stand out as im-portant pivotal nodes. We also noticed that, in our previ-ous document co-citation analysis, we didn’t find any of Dr. Daeschel’s papers that are pivotal. However, through author co-citation analysis, we identified Dr. Daeschel as an important and influential author that connects two otherwise separated research areas.
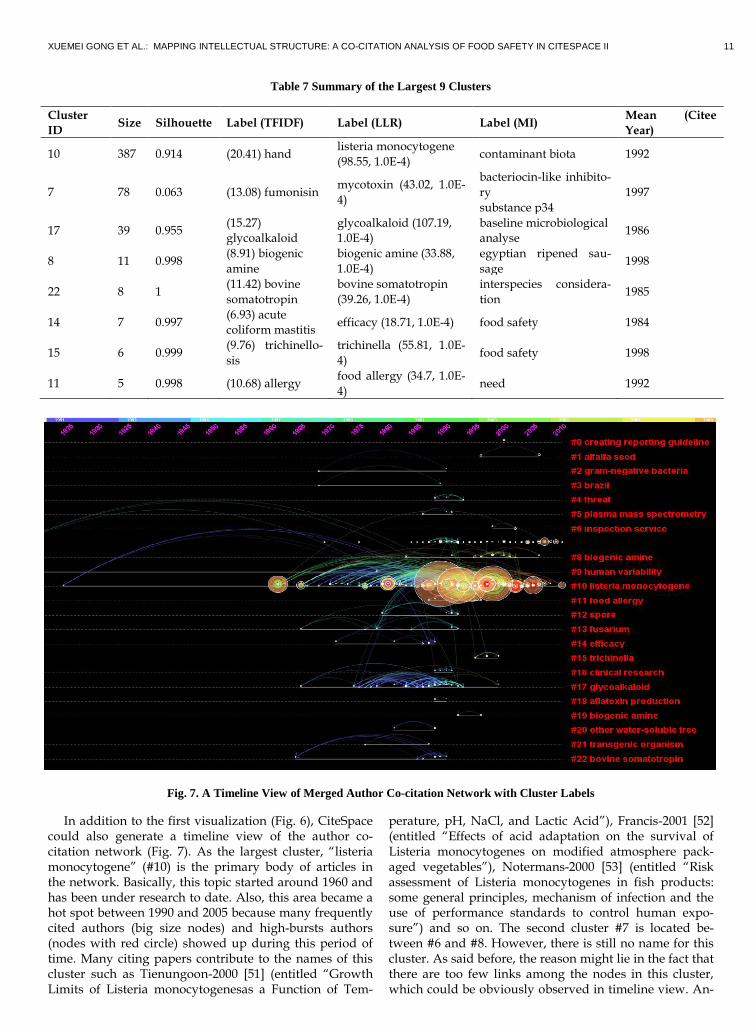
Important Clusters As shown in Fig. 6, the author co-citation network is di-vided into 23 co-citation clusters by CiteSpace, among which “listeria monocytogene” and “glycoalkaloid” are two major clusters. These clusters are labeled by title term extraction from citing papers and LLR algorithm. Besides LLR, CiteSpace also provides other two algorithms to label each cluster, and combining all three methods we can better understand and interpret each cluster. Table 7, generated by CiteSpace, presented detailed information about the largest 9 clusters, including cluster ID, size, sil-houette, extracted highest-valued term using three differ-ent algorithms, and mean citee year. Unsurprisingly, “lis-teria monocytogene” is the largest cluster with 387 mem-bers. The second largest cluster “mycotoxin” only has 78 articles, which is about 300 less than the first cluster. Also, we noticed this cluster didn’t show up in Fig. 6, and the reason may be that there are too few links among nodes in the cluster, leading to a very low silhouette value. “Glycoalkaloid” is another major cluster that includes 39 members. We also found that the mean citee year of all the first 9 largest clusters are before 2000, which means the area of food safety has been studied for a long time, and many research related to different issues of this area can be found in 1980s and 1990s.
XUEMEI GONG ET AL.: MAPPING INTELLECTUAL STRUCTURE: A CO-CITATION ANALYSIS OF FOOD SAFETY IN CITESPACE II 11
Table 7 Summary of the Largest 9 Clusters
Cluster ID Size Silhouette Label (TFIDF) Label (LLR) Label (MI) Mean (Citee
Year)
10 387 0.914 (20.41) hand listeria monocytogene (98.55, 1.0E-4) contaminant biota 1992
7 78 0.063 (13.08) fumonisin mycotoxin (43.02, 1.0E-4)
bacteriocin-like inhibito-ry substance p34
1997
17 39 0.955 (15.27) glycoalkaloid
glycoalkaloid (107.19, 1.0E-4)
baseline microbiological analyse 1986
8 11 0.998 (8.91) biogenic amine
biogenic amine (33.88, 1.0E-4)
egyptian ripened sau-sage 1998
22 8 1 (11.42) bovine somatotropin
bovine somatotropin (39.26, 1.0E-4)
interspecies considera-tion 1985
14 7 0.997 (6.93) acute coliform mastitis efficacy (18.71, 1.0E-4) food safety 1984
15 6 0.999 (9.76) trichinello-sis
trichinella (55.81, 1.0E-4) food safety 1998
11 5 0.998 (10.68) allergy food allergy (34.7, 1.0E-4) need 1992
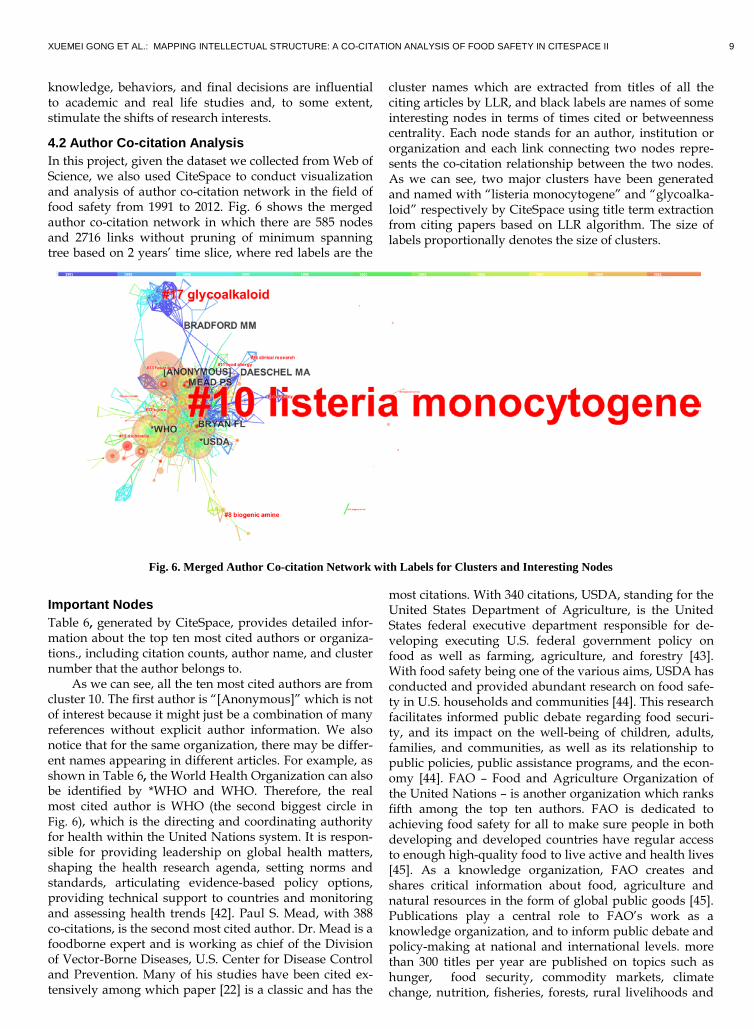
Fig. 7. A Timeline View of Merged Author Co-citation Network with Cluster Labels
In addition to the first visualization (Fig. 6), CiteSpace could also generate a timeline view of the author co-citation network (Fig. 7). As the largest cluster, “listeria monocytogene” (#10) is the primary body of articles in the network. Basically, this topic started around 1960 and has been under research to date. Also, this area became a hot spot between 1990 and 2005 because many frequently cited authors (big size nodes) and high-bursts authors (nodes with red circle) showed up during this period of time. Many citing papers contribute to the names of this cluster such as Tienungoon-2000 [51] (entitled “Growth Limits of Listeria monocytogenesas a Function of Tem-
perature, pH, NaCl, and Lactic Acid”), Francis-2001 [52] (entitled “Effects of acid adaptation on the survival of Listeria monocytogenes on modified atmosphere pack-aged vegetables”), Notermans-2000 [53] (entitled “Risk assessment of Listeria monocytogenes in fish products: some general principles, mechanism of infection and the use of performance standards to control human expo-sure”) and so on. The second cluster #7 is located be-tween #6 and #8. However, there is still no name for this cluster. As said before, the reason might lie in the fact that there are too few links among the nodes in this cluster, which could be obviously observed in timeline view. An-
12 PROJECT D
other major cluster (#17) “glycoalkaloid” started around 1965 and began to diminish since 1990, which is no longer a hot topic now. Almost all the authors in this cluster are connected by blue links which identified the first year when any two connected authors were co-cited. Many authors interested in this topic appeared between 1975 and 1995, facilitating the development of this area. The typical exemplar citing papers that contribute to the nam-ing of this cluster include Friedman-1993 [54] (entitled “Kinetics of acid-catalyzed hydrolysis of carbohydrate groups of potato glycoalkaloids alpha-chaconine and al-pha-solanine”), Friedman-1992 [55] (entitled “Distribution of glycoalkaloids in potato plants and commercial potato products”), Dao-1994 [56] (entitled “Chlorophyll, chloro-genic acid, glycoalkaloid, and protease inhibitor content of fresh and green potatoes”), etc.
5 CONCLUSION Many aspects of a scientific field can be represented in the form of a scientific network [5] , such as collaboration networks, co-authorship networks and co-citation net-works. The changes of such scientific networks over time have crucial implications for researchers in a scientific filed. Among these scientific networks, co-citation net-works have long been recognized as informative and val-uable to analyze. Co-citation analysis is an effective ap-proach in revealing otherwise hidden relationships and patterns across the author or document co-citation net-work. In this work, we studied the co-citation network in the scientific field of food safety, which has been a hot topic attracting increasing attentions from all over the world. By using CiteSpace II, a powerful information vis-ualization tool, to analyze and visualize the co-citation network of food safety, we were able to grasp a panoram-ic view of this field and better understand how this scien-tific filed evolves over the past decades.
Through document co-citation analysis, we identified six important articles based on their cited frequency or betweenness centrality. These articles have contributed significantly to the development of this field. In addition, clusters have been discovered as well as labeled in CiteSpace II, which enable us to understand how research topics emerge and evolve over time. Author co-citation analysis also provides some insights into research on food safety. One pivotal author was identified, which was un-able to be found in document co-citation analysis. Using different analysis method would give us different angles to view a given scientific filed. Comparing with the list of top 10 frequently cited articles collected from Web of Sci-ence directly (Table 1), the results generated by CiteSpace are different and some hidden pivotal articles are discov-ered based on cite frequency or betweenness centrality. In our future study, we may explore more network analysis approaches, such as how researchers in different organi-zations collaborate, or how research on certain scientific filed distribute geographically. By analyzing and visualiz-ing these metrics about certain scientific field, we may discover some hidden interesting patterns that explain development of scientific fields.
REFERENCES [1] Small, H., Co-citation in the scientific literature: A new measure of the
relationship between two documents. Journal of the American Society for information Science, 1973. 24(4): p. 265-269.
[2] White, H.D. and B.C. Griffith, Author cocitation: A literature measure of intellectual structure. Journal of the American Society for information Science, 1981. 32(3): p. 163-171.
[3] Culnan, M.J., Mapping the intellectual structure of MIS, 1980-1985: a co-citation analysis. Mis Quarterly, 1987: p. 341-353.
[4] Small, H., Visualizing science by citation mapping. Journal of the Amer-ican society for Information Science, 1999. 50(9): p. 799-813.
[5] Chen, C., Searching for intellectual turning points: Progressive knowledge domain visualization. Proceedings of the National Acade-my of Sciences of the United States of America, 2004. 101(Suppl 1): p. 5303-5310.
[6] Chen, C., F. Ibekwe-SanJuan, and J. Hou, The structure and dynamics of cocitation clusters: A multiple perspective cocitation analysis. Journal of the American Society for Information Science and Technology, 2010. 61(7): p. 1386-1409.
[7] White, H.D. and K.W. McCain, Visualizing a discipline: An author co-citation analysis of information science, 1972-1995. Journal of the Amer-ican Society for Information Science, 1998. 49(4): p. 327-355.
[8] Chen, C., Visualising semantic spaces and author co-citation networks in digital libraries. Information processing & management, 1999. 35(3): p. 401-420.
[9] Chen, C. and L. Carr. Visualizing the evolution of a subject domain: a case study. in Proceedings of the conference on Visualization'99: cele-brating ten years. 1999. IEEE Computer Society Press.
[10] Chen, C. and R.J. Paul, Visualizing a knowledge domain's intellectual structure. Computer, 2001. 34(3): p. 65-71.
[11] Chen, C., CiteSpace II: Detecting and visualizing emerging trends and transient patterns in scientific literature. Journal of the American Society for Information Science and Technology, 2006. 57(3): p. 359-377.
[12] He, Y. and S. Cheung Hui, Mining a Web Citation Database for author co-citation analysis. Information processing & management, 2002. 38(4): p. 491-508.
[13] Leydesdorff, L., On the normalization and visualization of author co-citation data: Salton's Cosine versus the Jaccard index Journal of the American Society for Information Science and Technology, 2007. 59(1): p. 77-85.
[14] Noel, S., C.-H.H. Chu, and V. Raghavan, Co-citation count vs correla-tion for influence network visualization. Information Visualization, 2003. 2(3): p. 160-170.
[15] Thomson Routers. [cited 3/12/2013; Available from: http://thomsonreuters.com/products_services/science/science_products/a-z/web_of_science/.
[16] Web of Science Wiki. [cited 3/12/2013; Available from: http://en.wikipedia.org/wiki/Web_of_Science.
[17] Ding, Y., G. Chowdhury, and S. Foo, Mapping the intellectual structure of information retrieval studies: an author co-citation analysis, 1987-1997. Journal of information science, 1999. 25(1): p. 67-78.
[18] Synnestvedt, M.B., C. Chen, and J.H. Holmes. CiteSpace II: visualization and knowledge discovery in bibliographic databases. in AMIA Annual Symposium Proceedings. 2005. American Medical Informatics Associa-tion.
[19] Kleinberg, J., Bursty and hierarchical structure in streams. Data Mining and Knowledge Discovery, 2003. 7(4): p. 373-397.
[20] Freeman, L.C., Centrality in social networks conceptual clarification. Social networks, 1979. 1(3): p. 215-239.
[21] Web of Science. [cited 3/12/2013; Available from:
XUEMEI GONG ET AL.: MAPPING INTELLECTUAL STRUCTURE: A CO-CITATION ANALYSIS OF FOOD SAFETY IN CITESPACE II 13
http://images.webofknowledge.com.ezproxy2.library.drexel.edu/WOKRS59B4/help/WOS/hs_document_type.html.
[22] Mead, P.S., et al., Food-related illness and death in the United States. Emerging infectious diseases, 1999. 5(5): p. 607.
[23] Redmond, E.C. and C.J. Griffith, Consumer food handling in the home: a review of food safety studies. Journal of Food Protection®, 2003. 66(1): p. 130-161.
[24] Bradford, M., A rapid and sensitive method for the quantitation of microgram quantities of protein utilizing the principle of protein-dye binding Anal Biochem 72: 248–254. Find this article online, 1976.
[25] Bean, N.H. and P.M. Griffin, Foodborne disease outbreaks in the Unit-ed States, 1973-1987: pathogens, vehicles, and trends. Journal of Food Protection, 1990. 53(9): p. 804.
[26] Farber, J. and P. Peterkin, Listeria monocytogenes, a food-borne patho-gen. Microbiological reviews, 1991. 55(3): p. 476.
[27] Holzapfel, W., R. Geisen, and U. Schillinger, Biological preservation of foods with reference to protective cultures, bacteriocins and food-grade enzymes. International Journal of Food Microbiology, 1995. 24(3): p. 343-362.
[28] Li-Cohen, A.E. and C.M. Bruhn, Safety of Consumer Handling of Fresh Produce from the Time of Purchase to the Plate: A Comprehensive Consumer Survey. Journal of Food Protection, 2002. 65(8): p. 1287-1296.
[29] Clayton, D.A., et al., Food handlers' beliefs and self-reported practices. International Journal of Environmental Health Research, 2002. 12(1): p. 25-39.
[30] Adak, G., S. Long, and S. O’brien, Trends in indigenous foodborne disease and deaths, England and Wales: 1992 to 2000. Gut, 2002. 51(6): p. 832-841.
[31] Hald, T., et al., A Bayesian Approach to Quantify the Contribution of Animal Food Sources to Human Salmonellosis. Risk Analysis, 2004. 24(1): p. 255-269.
[32] McCarthy, M., et al., Who is at risk and what do they know? Segment-ing a population on their food safety knowledge. Food Quality and Preference, 2007. 18(2): p. 205-217.
[33] Genigeorgis, C., et al., Growth and survival of Listeria monocytogenes in market cheeses stored at 4 to 30 degrees C. J. Food Prot, 1991. 54(9): p. 662-668.
[34] Henson, S. and J. Caswell, Food safety regulation: an overview of con-temporary issues. Food policy, 1999. 24(6): p. 589-603.
[35] Dolan, C. and J. Humphrey, Governance and trade in fresh vegetables: the impact of UK supermarkets on the African horticulture industry. Journal of development studies, 2000. 37(2): p. 147-176.
[36] Hatanaka, M., C. Bain, and L. Busch, Third-party certification in the global agrifood system. Food policy, 2005. 30(3): p. 354-369.
[37] Pennings, J.M., B. Wansink, and M.T. Meulenberg, A note on modeling consumer reactions to a crisis: The case of the mad cow disease. Interna-tional Journal of Research in Marketing, 2002. 19(1): p. 91-100.
[38] Grunert, K.G., Food quality and safety: consumer perception and de-mand. European Review of Agricultural Economics, 2005. 32(3): p. 369-391.
[39] Van Kleef, E., et al., Perceptions of food risk management among key stakeholders: Results from a cross-European study. Appetite, 2006. 47(1): p. 46-63.
[40] Loureiro, M.L. and W.J. Umberger, A choice experiment model for beef: What US consumer responses tell us about relative preferences for food safety, country-of-origin labeling and traceability. Food policy, 2007. 32(4): p. 496-514.
[41] Marvin, H., et al., A working procedure for identifying emerging food safety issues at an early stage: Implications for European and interna-tional risk management practices. Food control, 2009. 20(4): p. 345-356.
[42] WHO. [cited 2013 3/12]; Available from: http://www.who.int. [43] Wikipedia. United States Department of Agriculture. [cited 3/12/2013;
Available from: http://en.wikipedia.org/wiki/United_States_Department_of_Agriculture.
[44] USDA. Food Security. [cited 3/12/2013; Available from: http://www.usda.gov/wps/portal/usda/usdahome?navid=FOOD_SECURITY.
[45] FAO. About FAO. [cited 3/12/2013; Available from: http://www.fao.org/about/en/.
[46] FAO. Publications. [cited 3/12/2013; Available from: http://www.fao.org/publications/en/.
[47] Buchanan, R.L. Robert L. Buchanan, Ph.D. . [cited 3/12/2013; Available from: http://nfsc.umd.edu/people/faculty/robert-l-buchanan-phd.
[48] Garfield, E., The most cited papers of all time, SCI 1945±1988’. Current Contents, 1990. 7: p. 3-14.
[49] Garfield, E. The use of journal impact factors and citation analysis for evaluation of science. in 41st Annual Meeting of the Council of Biology Editors, Salt Lake City, UT. 1998.
[50] Daeschel, M. Mark Daeschel. [cited 3/12/2013; Available from: http://oregonstate.edu/dept/foodsci/faculty/mad.htm.
[51] Tienungoon, S., et al., Growth Limits of Listeria monocytogenesas a Function of Temperature, pH, NaCl, and Lactic Acid. Applied and En-vironmental Microbiology, 2000. 66(11): p. 4979-4987.
[52] Francis, G.A. and D. O'Beirne, Effects of acid adaptation on the survival of Listeria monocytogenes on modified atmosphere packaged vegeta-bles. International journal of food science & technology, 2001. 36(5): p. 477-487.
[53] Notermans, S. and E. Hoornstra, Risk assessment of Listeria monocyto-genes in fish products: some general principles, mechanism of infection and the use of performance standards to control human exposure. In-ternational journal of food microbiology, 2000. 62(3): p. 223-229.
[54] Friedman, M., G. McDonald, and W.F. Haddon, Kinetics of acid-catalyzed hydrolysis of carbohydrate groups of potato glycoalkaloids. alpha.-chaconine and. alpha.-solanine. Journal of agricultural and food chemistry, 1993. 41(9): p. 1397-1406.
[55] Friedman, M. and L. Dao, Distribution of glycoalkaloids in potato plants and commercial potato products. Journal of agricultural and food chemistry, 1992. 40(3): p. 419-423.
[56] Dao, L. and M. Friedman, Chlorophyll, chlorogenic acid, glycoalkaloid, and protease inhibitor content of fresh and green potatoes. Journal of agricultural and food chemistry, 1994. 42(3): p. 633-639.