r&s®gsacsm communication system monitoring
TRANSCRIPT

Product Brochure Version 01.00
Satcom mission planning
R&S®GSACSM COMMUNICATION SYSTEM MONITORING

2
AT A GLANCE
Remote spectrum monitoringR&S®GSACSM provides an interface for communicating with remote spectrum analyzers via remote connections; users can access their devices from all over the world. R&S®GSACSM supports monitoring of signals for one device at a time and for many different devices at once. R&S®GSACSM also handles different users monitoring the same device. Both a standalone application and a server/client solution are available.
Satellite transponder monitoringR&S®GSACSM autonomously scans transponder signals and identifies carriers, e.g. DVB-S, DVB-S2 and DVB-CID. Scanning and evaluating signals continuously makes it possible to detect wanted carriers with detailed informa-tion such as baud rate, modulation scheme, FEC rate, C/N and carrier frequency offset. It is also possible to track and identify unwanted services.
Carrier-in-carrier (CiC) detectionSystems using R&S®GSACSM can perform carrier-in- carrier detection tasks, which are a major feature in modern VSAT systems. Tasks such as paired carrier multiple access (PCMA) detection and signal identification and under-carrier signal analysis can be executed to find unwanted interferers in such systems.
R&S®GSACSM communication system monitoring is a satmon software solution for remote spectrum monitoring and signal analysis. R&S®GSACSM comes with classic spectrum analyzer functions, trapping systems, as well as advanced signal detection and identification algorithms. The modern, adaptive GUI makes it easy to implement use cases, e.g. interference identification or satcom transponder analysis.

Rohde & Schwarz R&S®GSACSM Communication System Monitoring 3
►Multichannel power measurement, history logging and alarm trapping
►Classic software-based spectrum analyzer functions
►Adaptive GUI and tailored special purpose solutions
►Autonomous detection and identification of terrestrial and satellite signals (e.g. GSM, DECT, DVB-S, DVB-S2)
►Autonomous detection and identification of paired-carrier multiple access (PCMA) and time-division multiple access (TDMA) signals
►Autonomous detection and identification of under-carrier signals
►Autonomous detection and identification of DVB carrier identification (DVB-CID) signals
►Simultaneous operations on multiple remote spectrum analyzers
►Remote spectrum monitoring over narrowband low latency connections
BENEFITS
KEY FACTS
Easy implementation of complex use cases
► page 4
Spectrum measurement tasks for interpreting signals precisely
► page 5
Spectrum scanning and carrier classification
► page 6
Detection and separation of PCMA signals
► page 8
TETRA scanning and analysis
► page 9
Cross-polarization measurement
► page 10
Under-carrier detection
► page 11
RF path measurement
► page 12
Power monitoring, recording, replay, import and export
► page 14
Distributed network structure
► page 16
TCP/IP acceleration middleware
► page 17

4
EASY IMPLEMENTATION OF COMPLEX USE CASESClear views of spectrum displays and measurement resultsR&S®GSACSM has a modern style similar to other com-mon applications. This makes it easy to use; even unexpe-rienced users can obtain meaningful results.
Signal markers provide quick, smart overview of signal parametersPower values can be shown by adding markers to the chart as shown in the screenshot below.
Clear views of measurement results and signal parameters
Multi-device monitoring with docking manager functionR&S®GSACSM allows simultaneous monitoring of multiple devices. Parallel monitoring is shown in the screenshot on the left, where two devices are displayed side by side. This makes it easy to see the uplink and downlink signal at the same time.
Multi-user monitoringSystems using R&S®GSACSM allow multiple users to con- nect to a single device at the same time. To avoid race conditions, device settings can only be changed by the first user connected to the device. A second user can only view the measurement results.

Rohde & Schwarz R&S®GSACSM Communication System Monitoring 5
SPECTRUM MEASUREMENT TASKS FOR INTERPRETING SIGNALS PRECISELY
2D and 3D spectrogram
Spectrogram for identifying signal parts by in color-coded waterfall chartsSystems using R&S®GSACSM are able to monitor the power spectral density of any spectrum analyzer input sig-nal. This helps identify potential unwanted signal sources. The spectrogram feature illustrates this with 2D and 3D waterfall charts.
Spectrum density for identifying sporadic signal partsThe spectrum density measurement feature monitors time-varying and superimposed signals by capturing and analyzing continuous spectrums over time. Rare or super-imposed events that cannot be detected using the ordi-nary spectrum analyzer functions can be visualized in a spectrum density chart.
Alarm trapping with signal masks
Spectrum density view
Alarm trapping helps identify suspicious signals automaticallyR&S®GSACSM is capable of setting alarm thresholds to inform users when unwanted signals occur. Users can define spectrum signal masks to ensure that every suspi-cious carrier is immediately identified.

6
SPECTRUM SCANNING AND CARRIER CLASSIFICATIONAutonomous spectrum scanning and carrier identification for satellite transponder monitoring
Clear visualization of constellation diagrams and signal parameters per carrierThe R&S®GSACSM classification feature enables systems to autonomously scan spectrum signals and identify car-riers. Carriers are visualized in color-coded charts and in lists. The chart and list elements make it easy to identify each carrier. The sniper tool lets users add new areas to select a specific carrier for further processing.
Large variety of standards and types of modulation can be identified (DVB-S, DVB-S2, IESS, GSM, etc.)All collected signal parameters and the constellation dia-gram are displayed so that the user sees all necessary details at a glance. Since users may not be able to deter-mine the actual signal class, the table clearly shows the detection and classification features.
Detection/ classification features Supported standards
Satcom DVB-S, DVB-S2, IESS, SCPC, TDMA
Carrier-in-carrier various, e.g. Comtech DoubleTalk
Terrestrial GSM downlink, LTE
ModulationM-QAM, M-DPSK, M-FSK, M-PSK, OFDM, DSSS, CDMA
DVB-CID DVB-Carrier ID
Signal detection and identification
Detection features and supported standards

Rohde & Schwarz R&S®GSACSM Communication System Monitoring 7
DVB carrier identification detection and demodulation
Manufacturer (SCPC) Description
COMTECH LDPC 2/3
LDPC 3/4
VersaFEC 0.642L
VersaFEC 0.789L
VersaFEC 0.803
IDirect TPC 0.793 Infinity
Radyne TPC 3/4 VSAT defacto
Various TPC 3/4
Various TPC 7/8
Various TPC 7/8 VSAT defacto
CSM list supported SCPC
Autonomous, continuous spectrum scanning and carrier detection and demodulation for DVB-CID signals
Autonomous detection and identification of CIDs for satcom signalsModern satellite communications has to deal with a lot of signal interference that needs to be efficiently avoided. The Digital Video Broadcasting organization specified a carrier ID (CID) that identifies the host carrier, effectively reducing interference between satellite signals, e.g. DVB-S2.
Manufacturer (TDMA) Description
ViaSat LinkWay, LinkWay2, Surfbeam, SkyLinx DDS
NortelDASA-SKYWAN (IDU 200, 3000, 5000),DASA-SKYWAN (IDU 7000)
PolarSat VSATplus II, VSATplus III
Nera Satlink
GilatSkyblaster, FaraWay, SkyEdge,SkyEdge II, DialAway, Sky Star VARIANT
Hughes DIRECWAY (IPoS), PE5
Shiron InterSKY
Comtec SkyWire
SatNet Advantech/EMS
Taychon Networks Taychon
NECNEXTAR48 (IC), NEXTAR4A (OC), NEXTAR Bandwidth On Demand, NEXTARV0
CSM list supported TDMA
Clear visualization of CID parameters (global unique ID, GPS coordinates, etc.)Systems using R&S®GSACSM can handle CID signals, i.e. they will be detected and then demodulated. The CID-specific “global unique ID”, the GPS coordinates and the telephone number are extracted. The global unique ID allows users to identify their satellite signal precisely.

8
DETECTION AND SEPARATION OF PCMA SIGNALS
Setup with carrier-in-carrier
(
Carrier A Carrier B
Frequency
PSD
Carrier A
Carrier B
The software solution R&S®GSACSM is able to detect, to identify and to separate paired carrier multiple access (PCMA) carriers. These carriers consist of two signals originating from two different ground stations. At the satellite, these two signals are summed together and transmitted back to earth. The two ground stations can access the other signal by subtracting their own. However, in a monitoring setup, both signals are unknown.
Detection and classification of PCMA signalsVery often, this type of transmission is hard to identify by the operator. Here, the R&S®GSACSM software can help by detecting and classifying PCMA carriers clearly. In addi-tion, several parameters of the carrier are measured such as modulation, symbol rate, the amplitude ratio and the frequency shift between the two signals.
Separation of PCMA signalsThe R&S®GSACSM also provides a feature to separate the two signals within the PCMA carrier for a defined number of symbols. This is done for providing further insight into the signals and to measure the carrier parameters even more precisely. The screenshot below shows the separa-tion of a PCMA carrier with two QPSK-modulated carriers.
Setup with carrier-in-carrier
Separation of symmetric carrier-in-carrier signals
together with their constellation diagrams
Detection and classification of symmetric
carrier-in-carrier signals

Rohde & Schwarz R&S®GSACSM Communication System Monitoring 9
TETRA SCANNING AND ANALYSISTerrestrial trunked radio (TETRA) is a European standard for a trunked radio system. It was designed for use by government agencies, emergency services, public safety networks, transport services and the military. R&S®GSACSM enables the user to continuously monitor all channels within the TETRA band and to read various information from each active TETRA carrier. In addition, it provides a feature to execute a panorama scan.
Identifying and analyzing TETRA signalsThe TETRA mode of R&S®GSACSM provides identification and continuous monitoring of TETRA signals. It focuses on fast identification algorithms and optimized usability for TETRA transmissions. As the TETRA channels are built-in directly in the software, the scanning and identifica-tion can be started with a one-click-operation by the user. After that, the identified channels are marked in green (see screenshot below). The scanning process can be carried out once or in a continuous manner.
In addition to the constellation diagram, several specific information are displayed for each identified TETRA carrier, e.g.:
ARFCN Absolute radio frequency channel numberDL/UL frequency frequency used by downlink/uplink carriers
MCC mobile country code
MNC mobile network code
LAC local area code
MCCH main control channel yes/no
CP/SNR channel power/signal-to-noise ratio
Data rate data rate of the carrier
MODCOD type of modulation and used code rate
Panorama measurement for TETRA signalsThe panorama measurement mode in R&S®GSACSM allows to check the signal power of a TETRA carrier in 360° at one specific measurement point. The measure-ment is performed in azimuth steps, assuming that the user rotates accordingly.
As a result, the measured power for each channel and each azimuth step is displayed graphically and numerically. In the graphical results, the power values are color-coded by local area code (LAC). Thus, both the signal strength and the origin of one specific TETRA carrier can be recog-nized at the same time.
Panorama measurement of TETRA signalsTETRA signal detection with their technical parameters and constellation diagram

10
CROSS-POLARIZATION MEASUREMENTCross-polarization (XPOL) distortions can occur if both polarization planes (horizontal and vertical) of an antenna are used. If a power offset to either plane occurs, for example because the low-noise blocks (LNB) are not set correctly, the orthogonality of the planes is no longer maintained. Thus, the power in the other plane can become affected and distortions can occur.
Measurement of cross-polarization The XPOL mode of R&S®GSACSM can analyze the power difference measured by two sensors in different polariza-tion planes. The two sensors can be either two distinct devices or one device with two RF inputs. R&S®GSACSM shows the spectra of both inputs and carries out the mea-surement of the power difference for a beacon signal or for a dedicated carrier.
Cross-polarization measurement results

Rohde & Schwarz R&S®GSACSM Communication System Monitoring 11
UNDER-CARRIER DETECTION
Identification of suspicious interferers using under-carrier detectionIn the satcom domain, the unwanted signal can originate from another satellite or a satcom terminal which is con-figured incorrectly. However, the intefering signal can also have a terrestrial source. For example, 5G signals cause more and more problems in traditional satellite communi-cations in C band.
The screenshot below shows an example setup where a DVB-S signal interfers with a much stronger IESS carrier. The interferer can first be made visible by demodulating and subtracting the wanted signal. Second, the interferer is detected and classified.
Under-carrier detection and identification
Systems using R&S®GSACSM can be used to detect and identify unwanted signals beneath the useful signal.
Sat modems
F = –––4πrfc( )2
Satellite downlink
L-band signal domain
Antenna gainFree space loss
Coupler loss
Pilot injection path
Interface to signal generator for autonomous station calibration
¸FPS + CSM
¸SGS100A
Receiver path
Pilot path
Feed
LNB
12
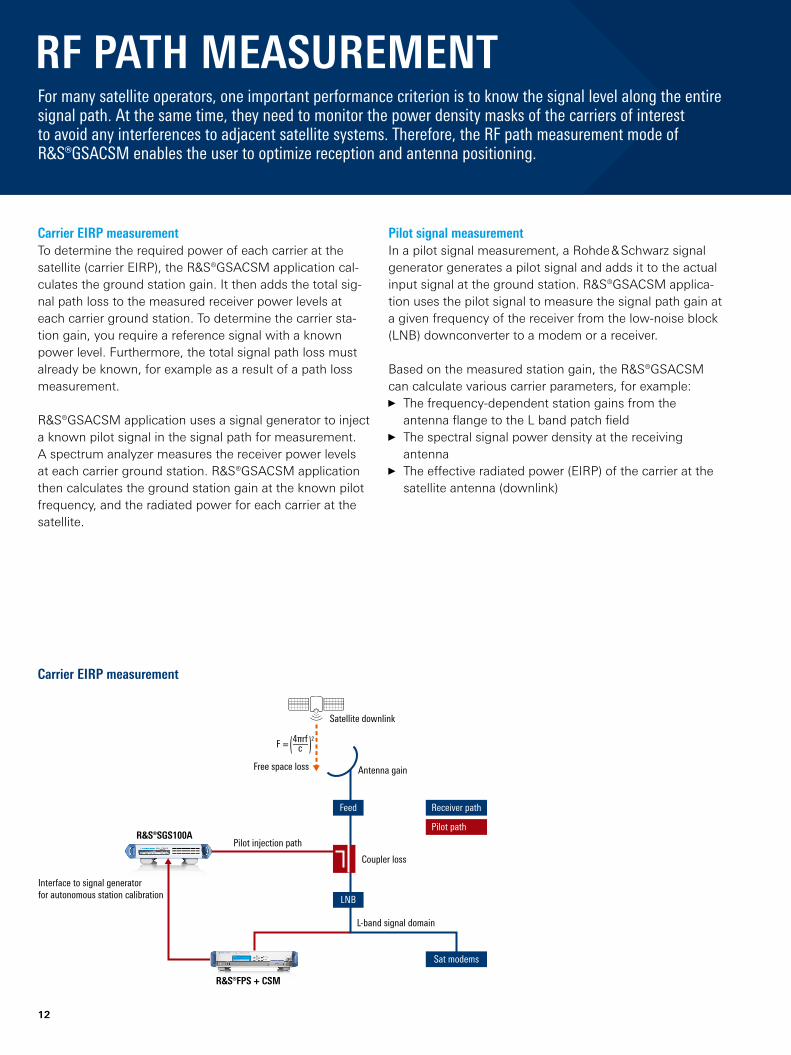
RF PATH MEASUREMENT
Carrier EIRP measurementTo determine the required power of each carrier at the satellite (carrier EIRP), the R&S®GSACSM application cal-culates the ground station gain. It then adds the total sig-nal path loss to the measured receiver power levels at each carrier ground station. To determine the carrier sta-tion gain, you require a reference signal with a known power level. Furthermore, the total signal path loss must already be known, for example as a result of a path loss measurement.
R&S®GSACSM application uses a signal generator to inject a known pilot signal in the signal path for measurement. A spectrum analyzer measures the receiver power levels at each carrier ground station. R&S®GSACSM application then calculates the ground station gain at the known pilot frequency, and the radiated power for each carrier at the satellite.
Pilot signal measurementIn a pilot signal measurement, a Rohde & Schwarz signal generator generates a pilot signal and adds it to the actual input signal at the ground station. R&S®GSACSM applica-tion uses the pilot signal to measure the signal path gain at a given frequency of the receiver from the low-noise block (LNB) downconverter to a modem or a receiver.
Based on the measured station gain, the R&S®GSACSM can calculate various carrier parameters, for example:
► The frequency-dependent station gains from the antenna flange to the L band patch field
► The spectral signal power density at the receiving antenna
► The effective radiated power (EIRP) of the carrier at the satellite antenna (downlink)
Carrier EIRP measurement
For many satellite operators, one important performance criterion is to know the signal level along the entire signal path. At the same time, they need to monitor the power density masks of the carriers of interest to avoid any interferences to adjacent satellite systems. Therefore, the RF path measurement mode of R&S®GSACSM enables the user to optimize reception and antenna positioning.

Rohde & Schwarz R&S®GSACSM Communication System Monitoring 13
Path loss measurementTo determine the power loss along the entire signal path, you must first determine the ground station gain. After this you must determine the path loss from the satellite via the antenna to the receiver of the ground station. To determine the ground station gain, the pilot signal measurement can be used.
In a system for which the antenna gain-to-noise- temperature (G/T) is already known, R&S®GSACSM can also determine the ground station loss from the G/T value. To determine the current signal attenuation due to free space propagation and optionally, rain and atmosphere attenuation, you also require a known beacon signal provided by the communications system. Based on the beacon signal, R&S®GSACSM application determines the total path loss from the satellite to the ground station.
Detailed path measurements for several carriers

14
POWER MONITORING, RECORDING, REPLAY, IMPORT AND EXPORT
Easily record and replay spectrum signalsSystems using R&S®GSACSM can record, replay and exchange measurements to view and process records offline.
Quickly import and export records to and from R&S®GSACSMTo make it easier to share records, records can be exported and imported so that users can easily analyze each other’s measurements.
Offline signal processing with the file device featureRecords can be replayed for offline analysis.
Power monitoring with service tables
Easy power monitoring via multichannel service tablesSystems using R&S®GSACSM monitor RF power by using multichannel service tables. This feature helps users who are unfamiliar with spectrum signals. The service table bar chart also helps visualize the RF power in a certain band.
Easy power monitoring over a certain amount of timeAnother way to support power measurement tasks is to use R&S®GSACSM power monitoring feature. It can moni-tor the RF power of various subbands in parallel over a defined amount of time. Users can easily add new power subbands, which will be displayed in the spectrum chart. For each power subband, a new power time chart will be generated displaying the overall RF power in a certain interval.

Rohde & Schwarz R&S®GSACSM Communication System Monitoring 15
Replay of a previously recorded measurement
Power monitoring over a defined amount of time

1. Standalone 3. Shared sensorinstruments, multi-user
2. Shared sensor instruments, single-user
CSM user CSM user
CSM server
R&S®NRQ6power sensor
R&S®GSACSM GUI R&S®GSACSM GUI
Site 1 Site 2
Site 3
R&S®NRQ6power sensor
R&S®NRQ6power sensor
R&S®NRQ6power sensor
R&S®GSACSM GUI
R&S®GSACSM GUI
CSM server CSM serverR&S®FSW signal andspectrum analyzer
R&S®TSME drivetest scanner
R&S®FPS signal andspectrum analyzer
R&S®GSACSM GUI
16
DISTRIBUTED NETWORK STRUCTUREScalable client/server architectureIn a scalable client/server architecture, R&S®GSACSM allows remote spectrum analysis in distributed systems. Operators can manage their instruments (RF components, e.g. R&S®NRQ6) in different locations.
Simultaneously managing different receivers and analyzersR&S®GSACSM supports the following Rohde & Schwarz sensor instruments:
► R&S®TSME6 ultracompact drive test scanner ► R&S®FSW signal and spectrum analyzer ► R&S®FPS signal and spectrum analyzer ► R&S®FSV and R&S®FSVA signal and spectrum analyzer ► R&S®FPL spectrum analyzer ► R&S®ESMD wideband monitoring receiver ► R&S®ESME wideband monitoring receiver ► R&S®NRQ6 frequency selective power sensor
Examples of standalone and client/server scenarios

User
Sensor
User Data storage
Near Far
Sensor
Server
Data storage
Server
Rohde & Schwarz R&S®GSACSM Communication System Monitoring 17
TCP/IP ACCELERATION MIDDLEWARE
Communications over narrowband and low latency connections
Remote spectrum monitoring over narrowband links and long latency linksR&S®GSACSM executes remote spectrum monitoring tasks even over narrowband and low latency connections such as satellite links, ensuring data communications between servers and sensors (see figure below).

18
SPECIFICATIONSSpecificationsCPU and operating system x86 CPU, Windows 7 or newer
.Net Framework required .Net Framework version 4.5
Minimum HDD space required for installation 500 Mbyte
RAM required min. 1 Gbyte, 2 Gbyte recommended
Sensor interfaces supported LAN/WLAN connection, USB port optional
Application domains satcom transponder modeling and carrier link budget analysis
satcom operations, definition of modulation and coding
satcom transponder optimization
Spectrum mode live measurement with spectrum analyzers
Spectrogram mode 2D and 3D waterfall spectrum analysis
Spectrum density mode spectrum frequency occurrence analysis
Mask mode alarm trapping with email notification
Classification modebasic detection and identification of terrestrial, satellite, TDMA and PCMA signals
Under-carrier detection mode advanced signal analysis for underlying interfering signals
Satellite mode continuous scanning, identifying and alarm trapping for satellite signals
DVB-CID continuous scanning for DVB-CID signals
Scope mode I/Q data display
Multichannel power mode power monitoring via service tables
Power monitoring mode power monitoring in a specific frequency band over a certain time
Recording record, replay, export and import measurements
Offline processing load I/Q data files to detect and demodulate signals offline
Supported Rohde & Schwarz sensor instruments R&S®TSME6 ultra compact drive test scanner
R&S®FSW, R&S®FPS, R&S®FSV signal and spectrum analyzers;R&S®FSC, R&S®FSL spectrum analyzers
R&S®NRQ6 frequency selective power sensor
R&S®MSR200 dual satellite receiver
Supported Rohde & Schwarz system solutions VSAT solution provided by Rohde & Schwarz
Software signal processing bandwidth determined by I/Q bandwidth of sensor in usage
Maximum simultaneous users per CSM server not limited, practically limited by the processing capabilities of the CPU
Maximum simultaneous sensors connected to the CSM server not limited, practically limited by the processing capabilities of the CPU
TCP/IP accelerationsupports CSM measurements with remote sensors over long latency low throughput links, e.g. data rate < 10 kbit/s, latency > 1 s
Application domains
►satcom transponder monitoring and carrier analysis ►identification/classification of unknown signals ►under-carrier signal analysis and demodulation ►satcom operations with alarming/trapping functions ►24/7 power monitoring of carriers ►DVB-CID carrier ID demodulation

Rohde & Schwarz R&S®GSACSM Communication System Monitoring 19
Designation Type Order No.Communication system monitoring (CSM) base packages CSM standalone software (for Windows OS) R&S®GSACSMSTA 3065.3532.02
CSM server software (for Windows OS and Linux OS) R&S®GSACSMSVR 3065.3526.02
CSM client software (for Windows OS) R&S®GSACSMCLNT 3065.3510.02
Communication system monitoring (CSM) modes CSM X-Pol measurement mode R&S®GSACSMXPOL 3065.3503.02
CSM analysis mode R&S®GSACSMANA 3065.3490.02
CSM power monitoring mode R&S®GSACSMPOWR 3065.3484.02
CSM measurements option R&S®GSACSMMEAS 3065.3478.02
CSM remote access R&S®GSACSMREMT 3065.3461.02
CSM HF path measurements R&S®GSACSMPTH 3069.3889.02
Advanced signal analysis for CSM analysis mode option (R&S®GSACSMANA) CSM classification and analysis of TETRA signals R&S®GSACSMCTTR 3065.3455.02
CSM classification satcom R&S®GSACSMCSAT 3065.3432.02
CSM classification carrier-under-carrier analysis R&S®GSACSMCCUC 3065.3426.02
CSM classification paired carrier detection R&S®GSACSMCPCD 3065.3410.02
ORDERING INFORMATION
Your local Rohde & Schwarz expert will help you find the best solution for your requirements.To find your nearest Rohde & Schwarz representative, visit www.sales.rohde-schwarz.com

Service that adds value► Worldwide► Local and personalized► Customized and flexible► Uncompromising quality► Long-term dependability
3683
.453
2.12
01.
00 P
DP
/PD
W 1
en
R&S® is a registered trademark of Rohde & Schwarz GmbH & Co. KG Trade names are trademarks of the owners PD 3683.4532.12 | Version 01.00 | November 2021 (ch) R&S®GSACSM Communication System Monitoring Data without tolerance limits is not binding | Subject to change© 2021 Rohde & Schwarz GmbH & Co. KG | 81671 Munich, Germany
Sustainable product design ► Environmental compatibility and eco-footprint ► Energy efficiency and low emissions ► Longevity and optimized total cost of ownership
Certified Quality Management
ISO 9001
Rohde & Schwarz customer supportwww.rohde-schwarz.com/support
Rohde & SchwarzThe Rohde & Schwarz technology group is among the trail-blazers when it comes to paving the way for a safer and connected world with its leading solutions in test & measure-ment, technology systems and networks & cybersecurity. Founded more than 85 years ago, the group is a reliable partner for industry and government customers around the globe. The independent company is headquartered in Munich, Germany and has an extensive sales and service network with locations in more than 70 countries. www.rohde-schwarz.com
Rohde & Schwarz trainingwww.training.rohde-schwarz.com
Certified Environmental Management
ISO 14001
3683453212