ramp metering operational assessment - whatdotheyknow
TRANSCRIPT

© Crown Copyright 2008
First published 2008
Printed and published by the Highways Agency
Ramp Metering Operational Assessment
Issue A April 2008

Ramp Metering
Operational Assessment
5053147_04_02_027
A To be issued by HA Neil Stockley
Neil Stockley
Baber Malik
Julian Steed 07/04/08
04 Final Neil Stockley
Neil Stockley
Baber Malik
Julian Steed 07/04/08
03 Client Approval Matthew Jones
Neil Stockley
Babar Malik
Julian Steed 07/02/08
02 Revised Issue for Comment Matthew Jones
Neil Stockley
Babar Malik
Julian Steed 27/09/07
01 Initial Issue for Comment Craig White
Neil Stockley
Babar Malik
Julian Steed 06/07/07
Originated Checked Reviewed Authorised Date
Revision Purpose Description

RAMP METERING Operational Assessment
April 2008 i 5053147_04_02_027
Contents Section Page
1. Introduction 1-1
2. Evaluation Methodology 2-3 2.1 Introduction 2-3 2.2 Mainline Evaluation 2-5 2.3 Economic Evaluation 2-6
3. Site Status 3-8 3.1 Introduction 3-8 3.2 Area 10 Site Status 3-8 3.3 Area 12 Site Status 3-9 3.4 Area 9 & 11 Site Status 3-11
4. Mainline Journey Time & Traffic Flow Evaluation 4-13 4.1 Introduction 4-13 4.2 Area 10 4-13 4.3 Area 12 4-21 4.4 Area 9 4-25
5. Spot Speed Evaluation 5-31 5.1 Introduction 5-31 5.2 Area 10 5-32 5.3 Area 12 5-37 5.4 Area 9 5-41
6. Slip Road Delays and Economic Appraisal 6-47 6.1 Introduction 6-47 6.2 Assessment Methodology 6-47 6.3 Slip Road Delays 6-48 6.4 Economic Appraisal 6-49
7. Conclusions 7-52
APPENDIX A A-53
RAMP METERING Operational Assessment
April 2008 ii 5053147_04_02_027
List of Tables Table 1.1 – Ramp Metering Site Locations 1-2 Table 2.1 – Journey Time Evaluation Lengths 2-4 Table 3.1 - Area 10 Evaluation Status Summary (November 2007) 3-9 Table 3.2 - Area 12 Evaluation Status Summary 3-11 Table 3.3 - Area 9 & 11 Evaluation Status Summary 3-12 Table 4.1 - Area 10 Mainline Journey Time Evaluation Results 4-19 Table 4.2– Area 10 Sites Data Sample Size 4-20 Table 4.3 - Area 12 Mainline Journey Time Evaluation Results 4-24 Table 4.4 - Area 12 Sites Data Sample Size 4-25 Table 4.5 - Area 9 and 11 Mainline Journey Time Evaluation Results 4-29 Table 4.6 - Area 9 & 11 Sites Data Sample Size 4-30 Table 5.1 - Area 10 Mainline Spot Speed Summary 5-33 Table 5.2 - Area 12 Spot Speed Summary 5-37 Table 5.3 - Area 9 & 11 Traffic Flow and Speed Summary 5-42 Table 6.1 – Slip Road Traffic Flows, Queues and Delays 6-49 Table 6.2 - Economic Assessment Results 6-51
List of Figures Figure 5.1 - Generalised Speed-Flow Curve 5-32 Figure 5.2 - M6 J22 Southbound AM Peak Speed Flow Curve 5-34 Figure 5.3 - M6 J23 Southbound AM Peak Speed Flow Curve 5-34 Figure 5.4 - M6 J25 Southbound AM Peak Speed Flow Curve 5-35 Figure 5.5 - M62 J11 Eastbound AM Peak Speed Flow Curve 5-35 Figure 5.6 - M6 J24 Northbound PM Peak Speed Flow Curve 5-36 Figure 5.7 - M60 J2 Clockwise AM Peak Speed Flow Curve 5-36 Figure 5.8 - M1 J39 Northbound AM Peak Speed Flow Curve 5-38 Figure 5.9 - M1 J40 Northbound AM Peak Speed Flow Curve 5-39 Figure 5.10 - M1 J41 Northbound AM Peak Speed Flow Curve 5-39 Figure 5.11 - M62 J25 Eastbound AM Peak Speed Flow Curve 5-40 Figure 5.12 - M5 J2 Northbound AM Peak Speed Flow Curve 5-43 Figure 5.13 – M6 J9 Northbound Speed Flow Curve 5-43 Figure 5.14 – M6 J10 Northbound Speed Flow Curve 5-44 Figure 5.15 - M6 J10 Southbound AM Peak Speed Flow Curve 5-44 Figure 5.16 - M6 J10 Southbound PM Peak Speed Flow Curve 5-45 Figure 5.17 - M6 J7 Southbound AM Peak Speed Flow Curve 5-45 Figure 5.18 - M42 J3 Eastbound AM Peak Speed Flow Curve 5-46 Figure 5.19 - M6 J5 Southbound PM Peak Speed Flow Curve 5-46

RAMP METERING Operational Assessment
April 2008 1-1 5053147_04_02_027
1. Introduction Ramp Metering (RM), was first introduced in the UK on the M6 near Birmingham, in 1986 on the southbound access slip road at Junction 10. Its primary aim was to reduce congestion, which regularly disrupted main carriageway traffic flow south of the junction during morning peak periods. The congestion resulted from traffic flow breakdown at bottlenecks near the junctions. As a result of the successful implementation of RM at Junction 10 of the M6 the system was subsequently installed on the northbound slips at Junction 10, the southbound slips at M6 Junction 5 and 7 and at the north and southbound slips of M6 Junction 9 during 1988.
The results of monitoring during 1990 continued to indicate achievement of substantial benefits at Junction 10 southbound. The ramp metering system remained in operation until May 2000 when the equipment became obsolete and irreparable and consequently was switched off.
With the continued development of RM outside the UK, and to confirm the benefits of the original UK installation, a new Ramp Metering Pilot Scheme (RMPS) was commissioned in 1998. To assess its operation and identify the factors that contribute to successful operation a ‘stand alone’ ramp metering system was required. This needed to be compatible with the English NMCS (National Motorway Communications Systems) network and suitable to develop national application notes and standards for the wider application of ramp metering on the road network.
In addition to the M6 J9 northbound and southbound and M6 J10 southbound sites, sites at M6 J7 southbound and M6 J5 southbound were upgraded to the new equipment as part of the RMPS scheme.
A number of sites along Junctions 3, 11 and 12 of the M3 and Junctions 5, 7, 10 and 11 of the M27 were also selected for this trial. The RMPS became operational in August 2000 and included an extensive ‘before and after’ study to support the future business case. Extensive monitoring and data collection systems were developed, including traffic data collection, video monitoring and an automatic number plate recognition system.
It was found that the M6 sites were successful in achieving benefits, whilst the M3/M27 sites showed mixed results with selected sites displaying modest and inconsistent benefits during certain time periods. These were shown as reduced journey times.
With increasing levels of congestion across the UK motorways there is greater emphasis being placed on the need to manage the demand for travel and also to make the most efficient and effective use of the existing road network. As a consequence Atkins were commissioned by the Highways Agency (HA) to undertake all the necessary design, monitoring and evaluation work to implement RM at 30 sites (RM30) across the motorway network as shown in Table 1.1 below.
RAMP METERING Operational Assessment
April 2008 1-2 5053147_04_02_027
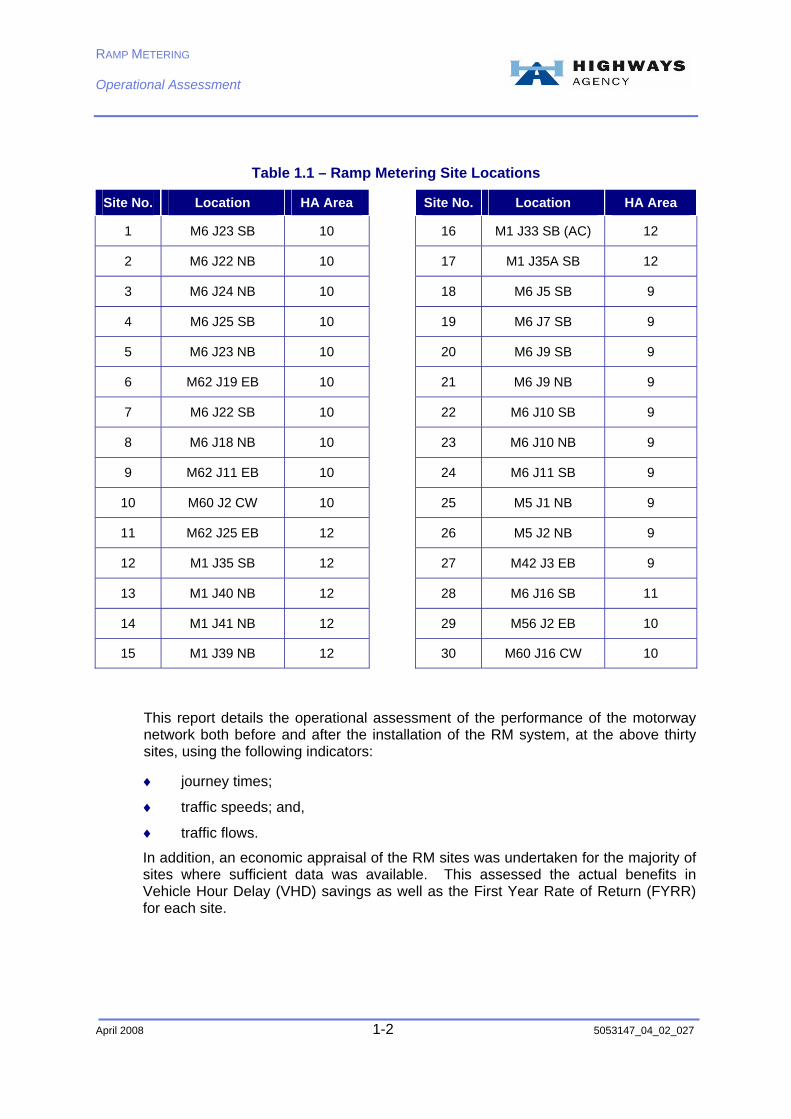
Table 1.1 – Ramp Metering Site Locations
Site No. Location HA Area Site No. Location HA Area
1 M6 J23 SB 10 16 M1 J33 SB (AC) 12
2 M6 J22 NB 10 17 M1 J35A SB 12
3 M6 J24 NB 10 18 M6 J5 SB 9
4 M6 J25 SB 10 19 M6 J7 SB 9
5 M6 J23 NB 10 20 M6 J9 SB 9
6 M62 J19 EB 10 21 M6 J9 NB 9
7 M6 J22 SB 10 22 M6 J10 SB 9
8 M6 J18 NB 10 23 M6 J10 NB 9
9 M62 J11 EB 10 24 M6 J11 SB 9
10 M60 J2 CW 10 25 M5 J1 NB 9
11 M62 J25 EB 12 26 M5 J2 NB 9
12 M1 J35 SB 12 27 M42 J3 EB 9
13 M1 J40 NB 12 28 M6 J16 SB 11
14 M1 J41 NB 12 29 M56 J2 EB 10
15 M1 J39 NB 12 30 M60 J16 CW 10
This report details the operational assessment of the performance of the motorway network both before and after the installation of the RM system, at the above thirty sites, using the following indicators:
♦ journey times;
♦ traffic speeds; and,
♦ traffic flows.
In addition, an economic appraisal of the RM sites was undertaken for the majority of sites where sufficient data was available. This assessed the actual benefits in Vehicle Hour Delay (VHD) savings as well as the First Year Rate of Return (FYRR) for each site.

RAMP METERING Operational Assessment
April 2008 2-3 5053147_04_02_027
2. Evaluation Methodology
2.1 Introduction
The performance of RM sites in the past and during trial runs has been evaluated in terms of the tangible improvements that they could bring about to the motorway network.
Existing guidance for the installation and assessment of RM in the UK is contained within the ‘Interim Advice Note IAN 103/08’. This guidance was written following the findings of RM30.
The ‘Interim Advice Note’ identifies the likely benefits of RM as being:
♦ shorter journey times for vehicles on the main carriageway;
♦ reduced congestion on the main carriageway;
♦ improved journey time reliability for vehicles on the main carriageway; and,
♦ improved safety.
However, against the above improvements there will be an increase in delays to the slip road traffic arising from traffic stopping at the signals, although these can be offset by reduced merge delays and improved speeds downstream of the ramp.
The evaluation methodology employed to assess the impact of the RM30 sites uses the following main indicators to measure the operational performance of the sites with RM before and after installation:
♦ journey times;
♦ traffic speeds; and,
♦ traffic flows.
The installation of RM could also lead to improvements in safety levels, vehicle operating costs and air quality. Nevertheless, it has been agreed with the HA that these indicators would not be the subject of the evaluation as there needs to be a considerable amount of data to be collected over a long period of time before changes are noted. These were thus agreed to be outside the scope of this evaluation.
The thrust of the operational evaluation method, as noted above, is based on calculations of average journey times, journey speeds, and traffic flow before and after installation of RM.
The main source of collecting data for evaluation is through MIDAS loops, typically spaced at 500m intervals along the mainline carriageway. Bandwidth capacity in the motorway communications system limits the number of MIDAS loops which can be configured to actively report traffic conditions.
RAMP METERING Operational Assessment
April 2008 2-4 5053147_04_02_027
In order to evaluate the performance of the RM30 sites MIDAS data is required at each location and therefore if there is limited MIDAS coverage or significant errors in the MIDAS data, evaluation is not possible and it’s likely that the full benefits of the RM system will not be evaluated.
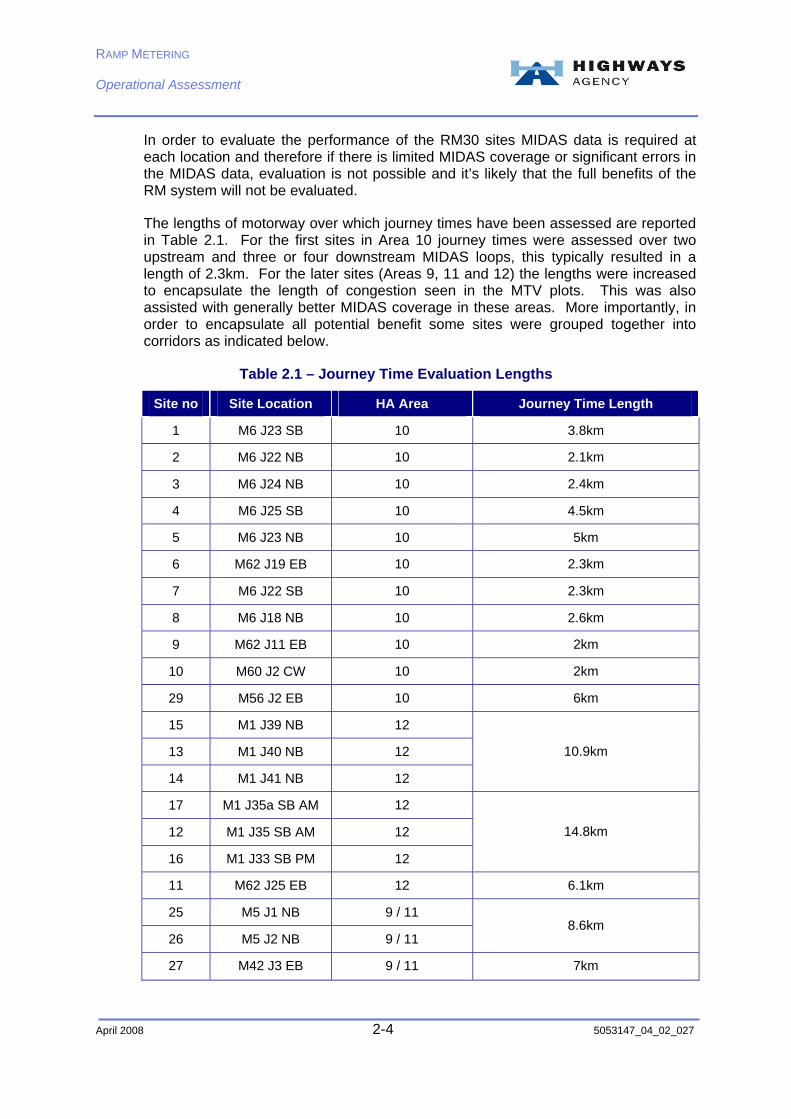
The lengths of motorway over which journey times have been assessed are reported in Table 2.1. For the first sites in Area 10 journey times were assessed over two upstream and three or four downstream MIDAS loops, this typically resulted in a length of 2.3km. For the later sites (Areas 9, 11 and 12) the lengths were increased to encapsulate the length of congestion seen in the MTV plots. This was also assisted with generally better MIDAS coverage in these areas. More importantly, in order to encapsulate all potential benefit some sites were grouped together into corridors as indicated below.
Table 2.1 – Journey Time Evaluation Lengths
Site no Site Location HA Area Journey Time Length
1 M6 J23 SB 10 3.8km
2 M6 J22 NB 10 2.1km
3 M6 J24 NB 10 2.4km
4 M6 J25 SB 10 4.5km
5 M6 J23 NB 10 5km
6 M62 J19 EB 10 2.3km
7 M6 J22 SB 10 2.3km
8 M6 J18 NB 10 2.6km
9 M62 J11 EB 10 2km
10 M60 J2 CW 10 2km
29 M56 J2 EB 10 6km
15 M1 J39 NB 12
13 M1 J40 NB 12
14 M1 J41 NB 12
10.9km
17 M1 J35a SB AM 12
12 M1 J35 SB AM 12
16 M1 J33 SB PM 12
14.8km
11 M62 J25 EB 12 6.1km
25 M5 J1 NB 9 / 11
26 M5 J2 NB 9 / 11 8.6km
27 M42 J3 EB 9 / 11 7km

RAMP METERING Operational Assessment
April 2008 2-5 5053147_04_02_027
18 M6 J5 SB 9 / 11 3.2km
19 M6 J7 SB 9 / 11 9.5km
20 M6 J9 SB 9 / 11
22 M6 J10 SB 9 / 11 11.4km
In addition to MIDAS data, data logged by the RM system at each site has been collected, particularly for the purpose of slip road evaluation.
2.2 Mainline Evaluation
Following agreement the evaluation period for each RM site was based on a 20 day sample of both OFF and ON data free of atypical events and weather. Typically, OFF data was collected prior to the installation and calibration of the RM system, with the ON data collected once the site was fully calibrated and operational. It was further agreed that the 20 days ON and OFF data would need to be obtained from a maximum period checked of 30 days for each data set. The 20 days of data were then averaged to produce an average journey time, traffic flow and speed over the evaluation period.
The data collected has been extensively checked and filtered to ensure that as far as reasonably possible, the evaluation is based upon a true and fair comparison of traffic conditions in the OFF and ON data sets. The process that has been used to obtain the evaluation data is as follows:
♦ Acquire MIDAS Traffic Data.
♦ Examine the data to identify and exclude abnormalities such as missing data due to MIDAS loop faults etc.
♦ Identify and exclude days with incidents using visual inspection of Motorway Traffic Viewer (MTV) plots and Regional Control Centre (RCC) Incident data logs.
♦ Classify and exclude days according to rainfall data obtained from weather monitoring sites in each area.
♦ Identify the typical operational periods for each site from the RM system log files.
♦ Calculate journey times using MIDAS data and MTV software.
♦ Analyse MIDAS traffic data for ON and OFF periods in order to derive spot speeds, traffic flow throughput, speed flow-curves at key upstream and downstream locations for each site.
For some of the RM sites, the journey time evaluation has been undertaken for a group of sites which are located in close proximity and where the same congestion issues have been shown to impact upon more than one site. This typically involves sites located at consecutive junctions, for example the three northbound M1 sites in Area 12, located at Junctions 39, 40 and 41.
RAMP METERING Operational Assessment
April 2008 2-6 5053147_04_02_027
In order to validate the use of average journey time savings for assessing the performance of RM three sites were reviewed using observations taken at five minute intervals. Sites were selected from each of the three main HA areas where RM has been introduced and the validation exercise confirmed that the use of average journey time savings is a reasonable basis for assessing the performance of the system.
2.3 Economic Evaluation
In addition to evaluating the operational performance of the mainline of the motorway, following the implementation of RM, the opportunity has been taken to update the economic appraisal of RM using observed data. The appraisal is based upon converting the travel time savings attributable to the introduction of RM into a monetary value using standard values of time. However, in addition to including the time savings to the mainline the opportunity has been taken to include delays experienced by slip road traffic as a result of the introduction of the traffic signals at the on slips.
Unlike the mainline of the motorway where MIDAS loops can be used to derive changes in travel time, an alternative methodology needed to be derived to calculate the delays at the slip road due to the introduction of RM. Considerable discussion took place regarding the evaluation of slip road. This culminated in the development of an agreed methodology for slip road evaluation in which the derivation of slip road delays was based upon traffic queue lengths at the signals, as extracted from the RM system, which were then converted into a delay figure using the following relationship extracted from the Design Manual for Roads and Bridges (DMRB) Volume 12 Traffic Appraisal of Roads Schemes Section 1 Traffic Appraisal Manual (TAM):
‘Over a period of one hour, the number of vehicles at rest or virtually at rest in the queue is noted at minute intervals. The average of the 60 counts is then calculated. The average delay in seconds is then given by the following formula:
Average delay per vehicle = 3600 x average number of vehicles in queue’ Traffic entering (in vehicles per hour)
Note – for the purposes of this study ‘virtually at rest’ has been interpreted as being a vehicle that is travelling slowly to join the back of a queue in order to avoid coming to a complete stop.
A comparison between the use of the formula and observed delays at a sample of RM signals indicated that the formula over predicted the level of delay experienced at the signals by between 1% and 12%. However, for the purposes of the economic appraisal it was considered that this conservative approach would be appropriate and as it would result in a robust assessment of the economic performance of RM.
To calculate slip road delays at each site, a number of typical days were chosen from the ON sample, with slip road flows and queue loop occupancies from the system logs used to determine average queue lengths and vehicle delays for each of the evaluation days. Typically, there is little variation in the results on a day-by-day basis and a sample of 5 days on the slip road was deemed to be sufficient.
RAMP METERING Operational Assessment
April 2008 2-7 5053147_04_02_027
Where significant variation in slip road delays were noted, additional days were included in the sample to ensure a more accurate estimation of average slip road delay was obtained.
Changes were made to the RM system logging process in March 2007 to enable slip road evaluation to commence. The changes included changing the reporting interval from 10 minutes to 1 minute to more accurately capture traffic conditions on the slip road. For this reason, all slip road evaluations were undertaken after March 2007.

RAMP METERING Operational Assessment
April 2008 3-8 5053147_04_02_027
3. Site Status
3.1 Introduction
Whilst RM has been introduced at thirty sites across the motorway network it has not been possible to completely evaluate the operation performance of RM at all the sites. This has been due to a variety of factors such as the presence of roadworks, faulty MIDAS loops or system faults. The data used to evaluate the RM sites has been collected at various times following the opening of each site with the last set of data collected during November 2007. The status of each site during November 2007 is detailed in the following sections of the report.
3.2 Area 10 Site Status
The status of the sites in Area 10 during November 2007 is presented in Table 3.1 below. Sites 1 to 10 were the first sites to be installed and calibrated, with all sites operational and calibrated by the end of July 2006. A further two sites in Area 10 (M56 J2 EB and M60 J16 CW) were installed during March 2007 towards the end of the RM30 programme.
Following the installation of RM at M60 Junction 16 clockwise a change in traffic conditions materialised which initially prevented the system from being fully calibrated and as a result the system was manually set in ‘off mode’. As consequence it was not possible to complete an assessment of the performance of the system at this location. However, the system has now been recalibrated at this location in order to deal with one-off incidents on the mainline as there is insufficient congestion to activate the system on a regular basis.
RAMP METERING Operational Assessment
April 2008 3-9 5053147_04_02_027
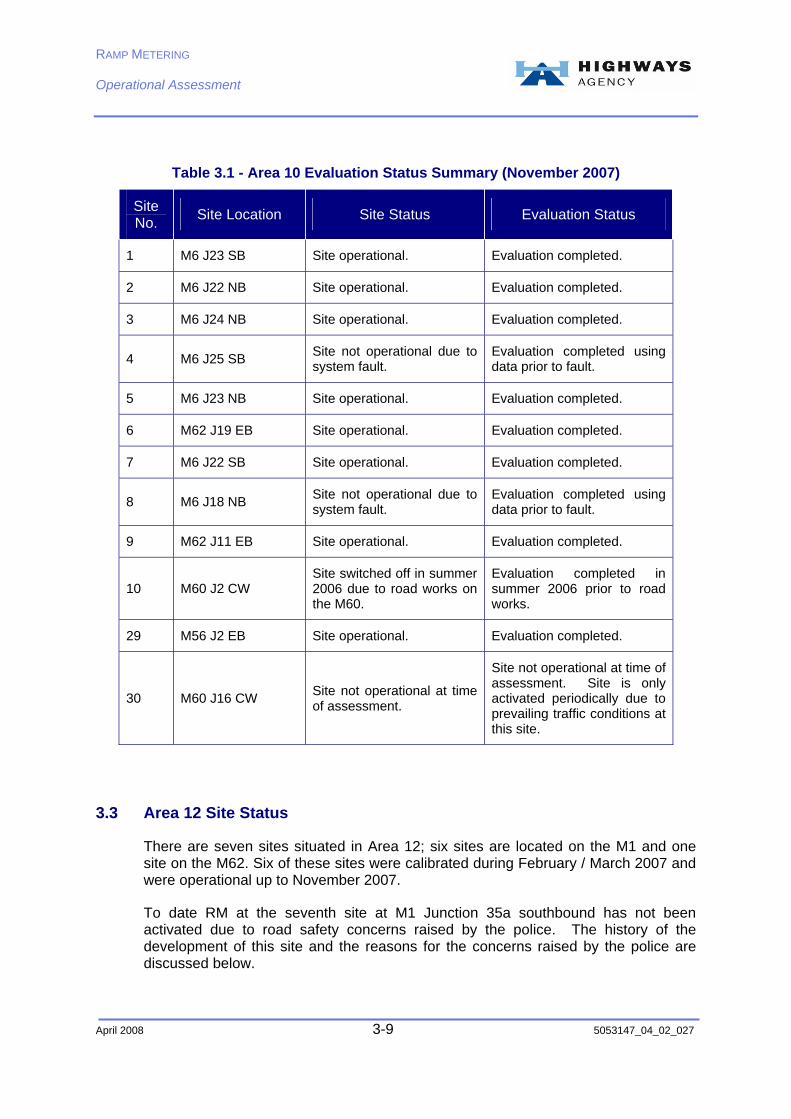
Table 3.1 - Area 10 Evaluation Status Summary (November 2007)
Site No. Site Location Site Status Evaluation Status
1 M6 J23 SB Site operational. Evaluation completed.
2 M6 J22 NB Site operational. Evaluation completed.
3 M6 J24 NB Site operational. Evaluation completed.
4 M6 J25 SB Site not operational due to system fault.
Evaluation completed using data prior to fault.
5 M6 J23 NB Site operational. Evaluation completed.
6 M62 J19 EB Site operational. Evaluation completed.
7 M6 J22 SB Site operational. Evaluation completed.
8 M6 J18 NB Site not operational due to system fault.
Evaluation completed using data prior to fault.
9 M62 J11 EB Site operational. Evaluation completed.
10 M60 J2 CW Site switched off in summer 2006 due to road works on the M60.
Evaluation completed in summer 2006 prior to road works.
29 M56 J2 EB Site operational. Evaluation completed.
30 M60 J16 CW Site not operational at time of assessment.
Site not operational at time of assessment. Site is only activated periodically due to prevailing traffic conditions at this site.
3.3 Area 12 Site Status
There are seven sites situated in Area 12; six sites are located on the M1 and one site on the M62. Six of these sites were calibrated during February / March 2007 and were operational up to November 2007.
To date RM at the seventh site at M1 Junction 35a southbound has not been activated due to road safety concerns raised by the police. The history of the development of this site and the reasons for the concerns raised by the police are discussed below.
RAMP METERING Operational Assessment
April 2008 3-10 5053147_04_02_027
Following the initial site selection process, M1 Junction 35a became a site for progression primarily due to its close proximity to M1 J35 and a design for this site was requested as a replacement for M62 J26, which was removed from the original 30 sites due to the fact that a new trial High Occupancy Vehicle lane was to be installed in the vicinity of the junction.
During the development of the design of the system at M1 Junction 35a an issue was identified with regard to the forward visibility on the approach to the signals. For safety reasons, TD 9/93 (Section 6, Volume 1 of the Design Manual for Roads and Bridges (DMRB)) specifies a minimum forward visibility required on a highway. This forward visibility (termed: Sight Stopping Distance (SSD)) considers both horizontal and vertical alignment and is based on the speed of approaching traffic. Due to the radius of curvature of the slip road as it passes over the mainline of the M1 and the visibility restrictions caused by the bridge parapets and roadside vegetation it was not possible to achieve the required SSD on the approach to the signals for a 70 mph speed limit.
To address this, it was agreed to proceed with the design on the basis of a 40mph limit on the approach to the RM site which would reduce the length of the required SSD. This reduced SSD could be achieved within the physical geometry of the on slip. As part of the design process advance warning signs were also introduced along with the 40mph limit on the slip.
Whilst the system was under construction it became apparent that the police had serious reservations about the site being switched on as they considered that approaching traffic would be travelling in excess of the 40mph limit and that the proposed SSD would not be adequate. A site meeting was therefore held on 1st March 2007 to discuss the way forward for M1 J35a. The visit was attended by South Yorkshire Police, the Road Safety Auditors, the Carillion WSP project manager and Atkins’ designers. Whilst being on site in the non-congested, off-peak period, it was apparent that motorists were exceeding 40mph despite the signs located at the entrance to the slip road indicating the 40mph speed restriction. As a result South Yorkshire Police and the Road Safety Auditors made it clear that they would not approve the use of the ramp metering at this location due to the high speed of approaching traffic.
It was subsequently shown that congestion on the main line during traffic peaks already results in queues forming on the slip road without RM. Accident statistics showed that no queue related accidents were recorded in the last three years at this site. This suggests that the presence of a queue on the slip road does not constitute a speed and safety risk. Whilst it is possible to exceed the 40mph design speed in an off-peak scenario, during busy conditions the vehicle headways are much smaller and cruise speeds much less.
In November 2007 further efforts to resolve the issues at this site were made and the designers proposed interactive signing, improved static signing, improved carriageway surface and safety barrier in line with the recommendations of the interim Stage 3 Road Safety Audit. Subject to further speed surveys for the slip road confirming that on slip traffic travels at lower approach speeds during the peak periods, the police seemed amenable to switching the site on in two stages.

RAMP METERING Operational Assessment
April 2008 3-11 5053147_04_02_027
In the first stage a very short queue would be managed by the system to allow motorists to become accustomed to the RM site. This queue would operate on the well-sighted, straight approach to the stopline which is downstream of the slip road section where the alignment issues exist. Once the motorists become accustomed to the RM signals, and learn to expect the development of the queue, the queue management algorithm could be refined to extend the queuing profile, allow a reasonable storage area and enable the RM system to operate normally.
The RM at this site currently remains in off mode awaiting completion of the works.
The status of the sites in Area 12 up to November 2007 is presented in Table 3.2.
Table 3.2 - Area 12 Evaluation Status Summary (November 2007)
Site No. Site Location Site Status Evaluation Status
11 M62 J25 EB Site operational Evaluation completed
12 M1 J35 SB Site operational Evaluation completed
13 M1 J40 NB Site operational Evaluation completed
14 M1 J41 NB Site operational Evaluation completed
15 M1 J39 NB Site operational Evaluation completed
16
M1 J33 SB
(Integrated Traffic Management (ITM) Site)
Site operational Evaluation completed
17 M1 J35A SB Site in ‘off mode’ No evaluation undertaken
3.4 Area 9 & 11 Site Status
There are ten sites in total in Area 9, located on the M5, M6 and M42 around Birmingham. A further single site is located in Area 11 at M6 J16 southbound near Crewe.
The sites in Area 9 and 11 were the last to be commissioned in March 2007 with some sites not calibrated until June 2007. Up to November 2007, eight out of the eleven sites have been operational for a long enough period to enable results to be reported.
There have been a number of technical and non-technical issues at sites in Area 9 which have prevented the evaluation of some sites. The site at M6 J9 southbound was closed during a period of roadworks on the M6 and upon completion of these works the site was switched into ‘off mode’ due to a failure of a MIDAS outstation. It was therefore not possible to complete the evaluation at this location. At M6 J11
RAMP METERING Operational Assessment
April 2008 3-12 5053147_04_02_027
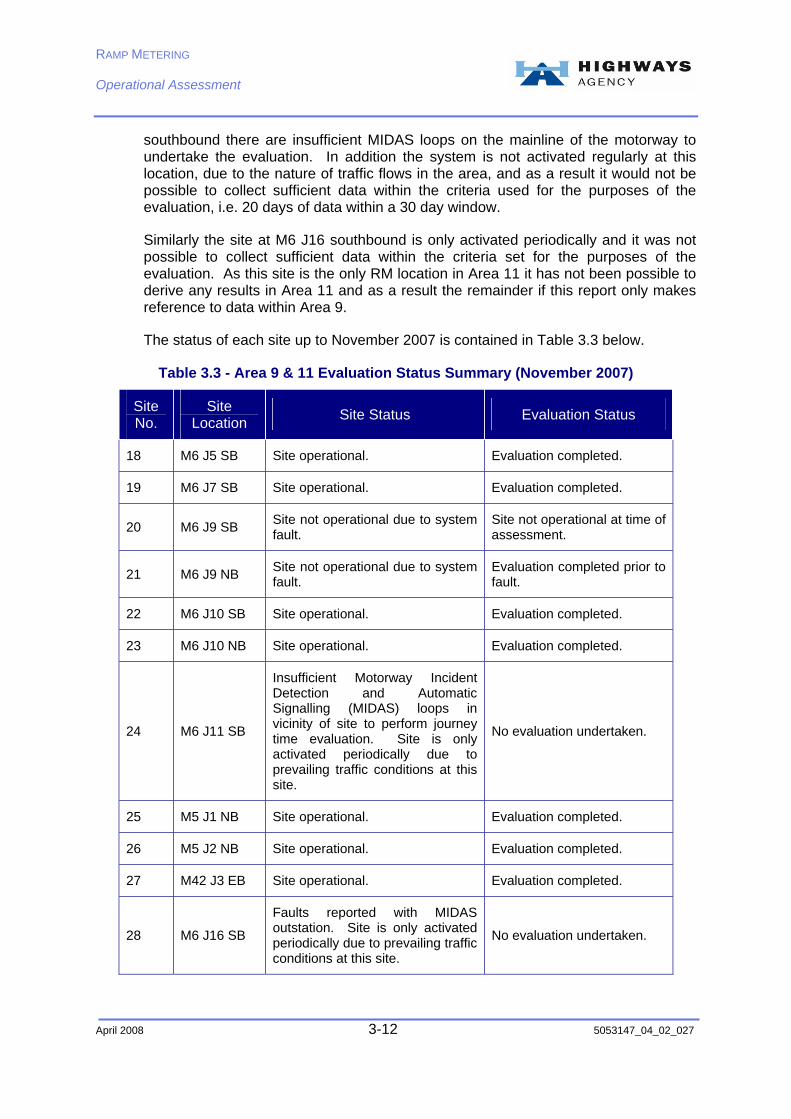
southbound there are insufficient MIDAS loops on the mainline of the motorway to undertake the evaluation. In addition the system is not activated regularly at this location, due to the nature of traffic flows in the area, and as a result it would not be possible to collect sufficient data within the criteria used for the purposes of the evaluation, i.e. 20 days of data within a 30 day window.
Similarly the site at M6 J16 southbound is only activated periodically and it was not possible to collect sufficient data within the criteria set for the purposes of the evaluation. As this site is the only RM location in Area 11 it has not been possible to derive any results in Area 11 and as a result the remainder if this report only makes reference to data within Area 9.
The status of each site up to November 2007 is contained in Table 3.3 below.
Table 3.3 - Area 9 & 11 Evaluation Status Summary (November 2007)
Site No.
Site Location Site Status Evaluation Status
18 M6 J5 SB Site operational. Evaluation completed.
19 M6 J7 SB Site operational. Evaluation completed.
20 M6 J9 SB Site not operational due to system fault.
Site not operational at time of assessment.
21 M6 J9 NB Site not operational due to system fault.
Evaluation completed prior to fault.
22 M6 J10 SB Site operational. Evaluation completed.
23 M6 J10 NB Site operational. Evaluation completed.
24 M6 J11 SB
Insufficient Motorway Incident Detection and Automatic Signalling (MIDAS) loops in vicinity of site to perform journey time evaluation. Site is only activated periodically due to prevailing traffic conditions at this site.
No evaluation undertaken.
25 M5 J1 NB Site operational. Evaluation completed.
26 M5 J2 NB Site operational. Evaluation completed.
27 M42 J3 EB Site operational. Evaluation completed.
28 M6 J16 SB
Faults reported with MIDAS outstation. Site is only activated periodically due to prevailing traffic conditions at this site.
No evaluation undertaken.

RAMP METERING Operational Assessment
April 2008 4-13 5053147_04_02_027
4. Mainline Journey Time & Traffic Flow Evaluation
4.1 Introduction
Mainline journey time evaluation has been undertaken in both the before and after period for each operational site, where MIDAS data provides sufficient coverage to enable journey time evaluation to be completed. Where possible the downstream MIDAS loop, which provides mainline information to the RM system, has also been used to calculate the mainline traffic flows with and without RM. In certain circumstances sufficient and accurate MIDAS data was not available for the purposes of deriving traffic flows and where this has occurred it has not been possible to present the traffic flow data. The results of the average journey time and traffic flow evaluation are reported in the following sections of the report, grouped by area.
4.2 Area 10
The Area 10 journey time and traffic flow evaluation are presented in Table 4.1 and are discussed below. The sample size used to derive the evaluation results are reproduced in Table 4.2.
Corridor (1) - M6 Southbound and M62 Eastbound
M6 J25 Southbound
M6 J23 Southbound
M6 J22 Southbound
M62 J11 Eastbound
Typical RM operation at these sites is during morning weekdays between 06:45 and 9:30 am. During the evaluation period there was daily congestion on this corridor in the morning peak due to the combination of high volumes of southbound traffic on the M6 and the bottleneck at Croft interchange for vehicles leaving the southbound M6 to join the M62 eastbound. It is not uncommon for queues which form at Croft interchange (Junction 21a) to reach back beyond the M6 Junction 26 at Orrell.
Evaluation of the operation of the sites on Corridor (1) was initially based upon data collected over the following periods:
♦ OFF data: March – June 2006.

RAMP METERING Operational Assessment
April 2008 4-14 5053147_04_02_027
♦ ON data: September – November 2006.
However, during February 2006 work commenced on an improvement scheme at the intersection of the M62 and M6 at Croft interchange. These works were completed in April 2006 and resulted in the M6 to M62 eastbound slip being hatched down from two lanes to one lane prior to the merge point. In addition the layout of the merge area was changed from a taper layout to a parallel merge. As a consequence of these works the layout of this slip was changed mid-way through the collection of the OFF data.
The initial evaluation highlighted that the journey times along some sections of this corridor were longer in the ramp metering ON period (September - November 2006) when compared to the OFF period in March - June 2006.
Closer inspection of the MIDAS traffic data did not provide conclusive evidence that the increase in journey times and general congestion along this corridor was attributable to introduction of RM. Nevertheless, an assessment of the operation of the southbound slip road connecting the M6 southbound to the M62 eastbound indicated that there had been a change in driver behaviour following the completion of the revision to the slip road layout. Observations indicated that drivers were not using the outside lane on the slip due to the fact that it was hatched out on the approach to the merge area. As a consequence of this behaviour the slip road effectively operates as a single lane and traffic queues rapidly build up and extend back onto the mainline of the M6 southbound.
To isolate the cause(s) of the apparent increase in journey times, caused by the revision to the layout at the M6 to M62 eastbound slip road, it was decided to switch off the ramp metering sites along Corridor (1) to collect new OFF data. This new OFF data would be directly comparable with the ON data as the highway network and driver behaviour would be the same in both cases. The ramp metering sites along Corridor (1) were turned-off during the second week of January 2007 with the new OFF data collected between January 15th and February 9th 2007.
Following the successful collection of sufficient OFF data, the sites were switched back on during the beginning of March 2007 after being re-calibrated with additional ON data.
The evaluation results detailed in Table 4.1 compares journey times and traffic flows from the new OFF and ON data collected during early 2007. The results of this comparison show that RM in fact has had a positive impact on journey times along Corridor (1) during the morning peak. Each of the sites re-evaluated along this corridor show significant journey time improvements when RM has been operational. Compared to the OFF data the ON period journey times are between 52 seconds (M62 J11 EB) and 173 seconds (M6 J23 SB) less with RM active. In comparison traffic flows through these sites have either remained stable or have increased by up to 9% (343 vehicles per hour).
Whilst significant journey time savings have accrued on this corridor as a result of RM the level of savings observed are likely to attributable to the unique set of circumstances on this corridor. In particular the effect that the level of queuing on the M6 southbound to M62 eastbound slip road has had on journey times throughout the corridor.
RAMP METERING Operational Assessment
April 2008 4-15 5053147_04_02_027
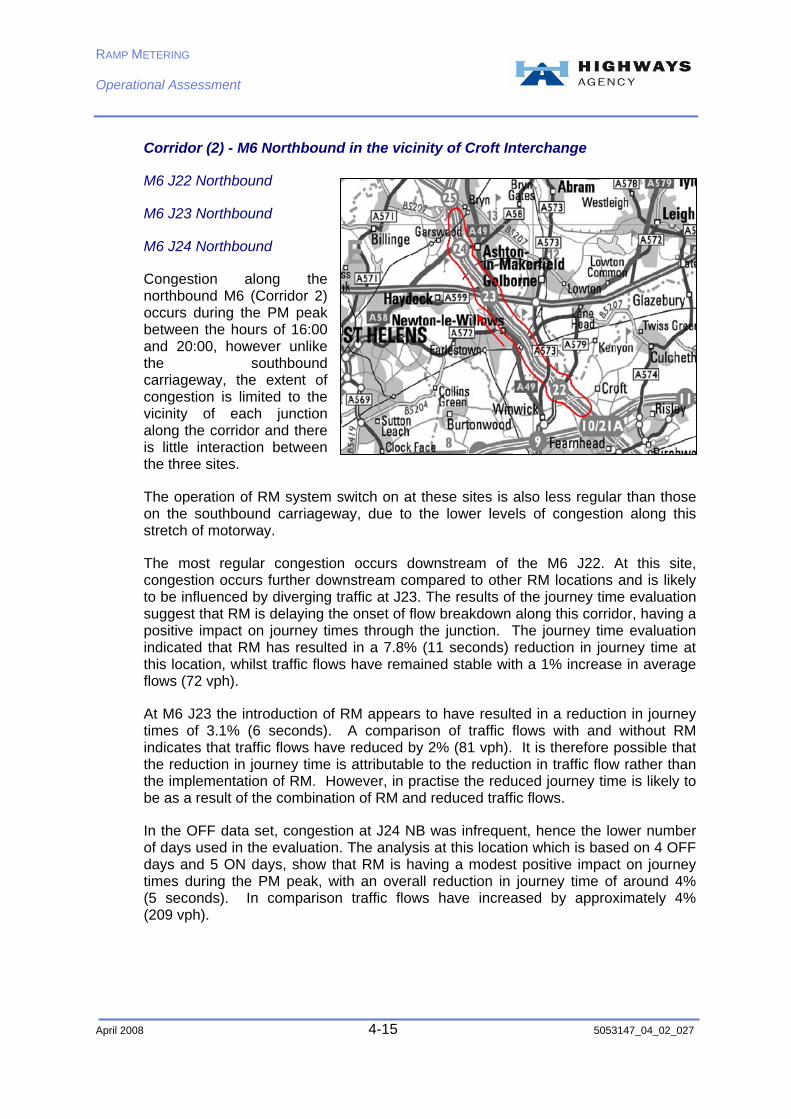
Corridor (2) - M6 Northbound in the vicinity of Croft Interchange
M6 J22 Northbound
M6 J23 Northbound
M6 J24 Northbound
Congestion along the northbound M6 (Corridor 2) occurs during the PM peak between the hours of 16:00 and 20:00, however unlike the southbound carriageway, the extent of congestion is limited to the vicinity of each junction along the corridor and there is little interaction between the three sites.
The operation of RM system switch on at these sites is also less regular than those on the southbound carriageway, due to the lower levels of congestion along this stretch of motorway.
The most regular congestion occurs downstream of the M6 J22. At this site, congestion occurs further downstream compared to other RM locations and is likely to be influenced by diverging traffic at J23. The results of the journey time evaluation suggest that RM is delaying the onset of flow breakdown along this corridor, having a positive impact on journey times through the junction. The journey time evaluation indicated that RM has resulted in a 7.8% (11 seconds) reduction in journey time at this location, whilst traffic flows have remained stable with a 1% increase in average flows (72 vph).
At M6 J23 the introduction of RM appears to have resulted in a reduction in journey times of 3.1% (6 seconds). A comparison of traffic flows with and without RM indicates that traffic flows have reduced by 2% (81 vph). It is therefore possible that the reduction in journey time is attributable to the reduction in traffic flow rather than the implementation of RM. However, in practise the reduced journey time is likely to be as a result of the combination of RM and reduced traffic flows.
In the OFF data set, congestion at J24 NB was infrequent, hence the lower number of days used in the evaluation. The analysis at this location which is based on 4 OFF days and 5 ON days, show that RM is having a modest positive impact on journey times during the PM peak, with an overall reduction in journey time of around 4% (5 seconds). In comparison traffic flows have increased by approximately 4% (209 vph).

RAMP METERING Operational Assessment
April 2008 4-16 5053147_04_02_027
Stand-alone Sites
M62 J19 Eastbound
Activation of the system is normally noted when congestion is formed further downstream at or beyond J20 (A627M Interchange) and reaches back to J19. This however, is not a regular occurrence which result in a relatively low number of days that can included in the evaluation period.
Based on the evaluation of 11 OFF days and 8 ON days, RM does not appear to be having a major impact on journey times at this location with a less than 1% saving in journey time. It is likely that the reported small decrease in journey times is merely a variation in the delay downstream due to the infrequent nature of congestion/incidents.
M6 J18 Northbound
Traffic congestion on this northbound section of the M6 is typically evident on Monday mornings and on Fridays from early afternoon until after 7 p.m. respectively. Congestion most frequently occurs on Friday afternoon/evenings therefore this period has been targeted for evaluation as RM operates more consistently.
Sixteen Fridays between 3rd March and 23rd June 2006 were checked for their suitability for OFF period evaluation. From these 16 days only six were suitable. Of the 10 days deemed unsuitable for evaluation, four were rejected due to inadequate MIDAS coverage, four were rejected due to public or school holidays, one day was rejected due to wet weather and a further day was excluded due to an absence of congestion.
Twenty-two Fridays between 4th September and 2nd February were checked for their suitability for ON Period evaluation. On inspection, eight of these days were deemed suitable for inclusion in the ON data set. Of the 14 days deemed unsuitable, five days were rejected due to incidents or abnormal traffic conditions, four days were rejected due to weather (wet days), three days were rejected due to public holiday periods
RAMP METERING Operational Assessment
April 2008 4-17 5053147_04_02_027
and one day each was rejected for inadequate MIDAS coverage and lack of congestion/switch-on.
The evaluation of six days before and eight days after (all Fridays) show a reduction of 2.2% in journey time through M6 J18 NB after the installation of RM. As with M62 J19 eastbound, it is likely that the reported small change in journey times is merely a variation in the delay due to the infrequent and irregular nature of congestion at this site.
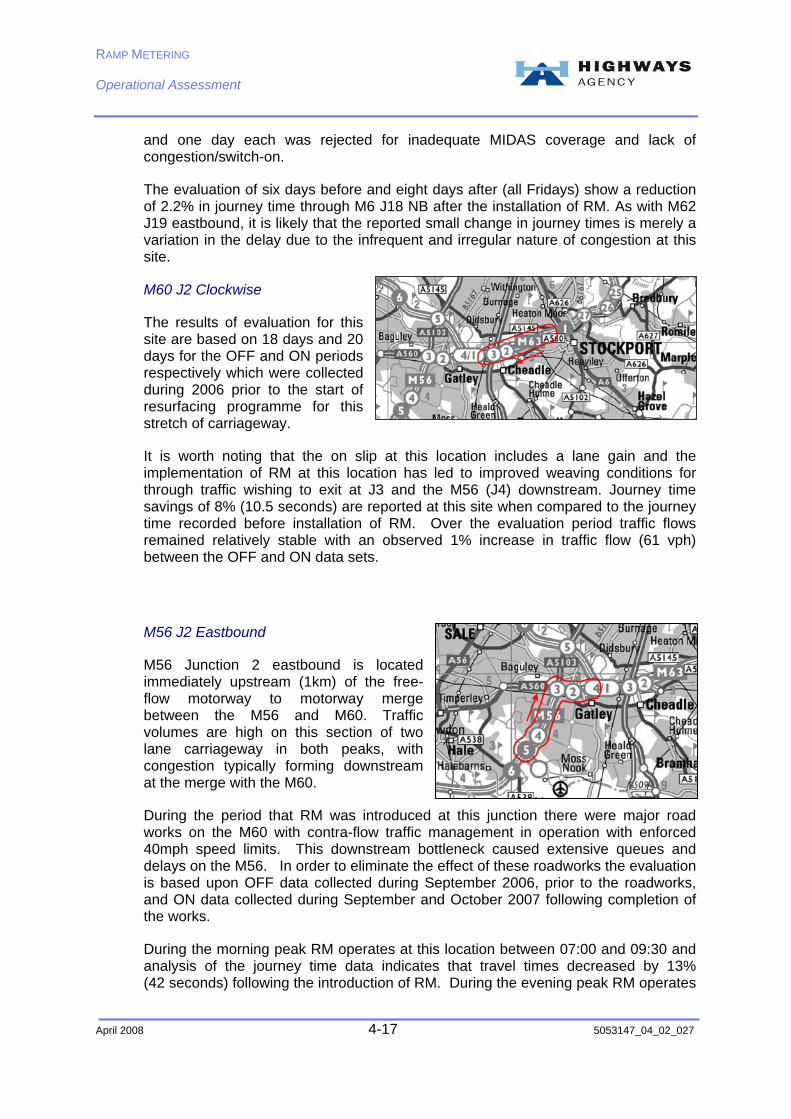
M60 J2 Clockwise
The results of evaluation for this site are based on 18 days and 20 days for the OFF and ON periods respectively which were collected during 2006 prior to the start of resurfacing programme for this stretch of carriageway.
It is worth noting that the on slip at this location includes a lane gain and the implementation of RM at this location has led to improved weaving conditions for through traffic wishing to exit at J3 and the M56 (J4) downstream. Journey time savings of 8% (10.5 seconds) are reported at this site when compared to the journey time recorded before installation of RM. Over the evaluation period traffic flows remained relatively stable with an observed 1% increase in traffic flow (61 vph) between the OFF and ON data sets.
M56 J2 Eastbound
M56 Junction 2 eastbound is located immediately upstream (1km) of the free-flow motorway to motorway merge between the M56 and M60. Traffic volumes are high on this section of two lane carriageway in both peaks, with congestion typically forming downstream at the merge with the M60.
During the period that RM was introduced at this junction there were major road works on the M60 with contra-flow traffic management in operation with enforced 40mph speed limits. This downstream bottleneck caused extensive queues and delays on the M56. In order to eliminate the effect of these roadworks the evaluation is based upon OFF data collected during September 2006, prior to the roadworks, and ON data collected during September and October 2007 following completion of the works.
During the morning peak RM operates at this location between 07:00 and 09:30 and analysis of the journey time data indicates that travel times decreased by 13% (42 seconds) following the introduction of RM. During the evening peak RM operates

RAMP METERING Operational Assessment
April 2008 4-18 5053147_04_02_027
between 16.00 and 20.00 and travel times have decreased by 11% (38 seconds) following the introduction of RM.

RAMP METERING Operational Assessment
April 2008 4-19 5053147_04_02_027
Table 4.1 - Area 10 Mainline Journey Time Evaluation Results
Average Journey Time (s) Average Downstream Flow (vph) Evaluation Duration Site No Location
MAM OFF MAM ON Change % MAM OFF
MAM ON Change % From To
Corridor (1) Sites 7 M6 J22 Southbound 285.25 191.27 -93.98 -32.9% 4329 4659 330 8% 07:00 09:30 4 M6 J25 Southbound 385.6 311.48 -75.03 -19.4% 4515 4525 10 0% 07:00 09:30 9 M62 J11 Eastbound 197.78 145.6 -52.18 -26.4% 4978 5267 289 6% 06:45 09:30 1 M6 J23 Southbound 433.38 259.9 -173.48 -40.0% 3963 4306 343 9% 06:45 09:30
Corridor (2) Sites 2 M6 J22 Northbound 139.78 128.91 -10.88 -7.8% 5454 5526 72 1% 16:30 18:00 5 M6 J23 Northbound 210.87 204.40 -6.47 -3.1% 4258 4177 -81 -2% 16:00 20:00 3 M6 J24 Northbound 139.93 134.57 -5.36 -3.8% 6000 6209 209 4% 16:00 18:00
Stand Alone Sites 10 M60 J2 Clockwise 132.75 122.27 -10.48 -7.9% 7194 7255 61 1% 07:00 09:30 8 M6 J18 Northbound 151.11 147.78 -3.34 -2.2% MIDAS traffic flow data not available 14:00 19:00 6 M62 J19 Eastbound 112.61 112.01 -0.60 -0.5% MIDAS traffic flow data not available 16:00 19:00
M56 J2 Eastbound AM Peak 322.88 280.95 -41.93 -13.0% 07:00 09:30 29 M56 J2 Eastbound PM Peak 336.54 298.95 -37.59 -11.2% MIDAS traffic flow data not available 16:00 20:00 Average -14.0%

RAMP METERING Operational Assessment
April 2008 4-20 5053147_04_02_027
Table 4.2– Area 10 Sites Data Sample Size
Sample Size (days) Location Site
RM OFF RM ON
M6 J25 Southbound 14 7
M6 J23 Southbound 12 16
M6 J22 Southbound 18 17 Corridor 1
M62 J11 Eastbound 19 16
M6 J22 Northbound 17 22
M6 J23 Northbound 10 10 Corridor 2
M6 J24 Northbound 4 5
M6 J18 Northbound 4 3
M56 J2 Eastbound (AM Peak) 16 16
(PM Peak) 13 18
M60 J2 Clockwise 18 20
Stand-alone sites
M62 J19 Eastbound 11 8

RAMP METERING Operational Assessment
April 2008 4-21 5053147_04_02_027
4.3 Area 12
The Area 12 journey time and traffic flow evaluation are presented in Table 4.3 and are discussed below. The sample size used to derive the evaluation results are reproduced in Table 4.4.
Corridor 1 - M1 Northbound
M1 J39 Northbound.
M1 J40 Northbound.
M1 J41 Northbound.
Typical RM operation at these sites is during morning weekdays between 07:00 and 09:30. There is daily congestion on this corridor in the morning peak due to the combination of high volumes of northbound traffic on the M1, high merging flows at each junction and the close proximity of the Lofthouse Interchange between the M1 and M62 immediately north of J41.
On a typical day, flow breakdown occurs at each of the three junctions in Corridor 1 around 07:00 when peak demand on the slip roads coincides with heavy flow on the mainline carriageway. This congestion builds southbound during the peak period to form a continuous congestion problem stretching from J42 in the north to J38 in the south. This congestion remains until traffic flow recovers around 09:00.
Given that the three sites along Corridor 1 were not calibrated in the same week, care was taken to ensure that during each evaluation period, RM at all of the three sites was in a consistent mode, i.e. dates were selected were all three sites were either in the ON or OFF mode. This enabled the travel time savings to be calculated for the corridor as a whole.
Evaluation of the three sites along Corridor 1 has therefore been based on the comparison of journey time and traffic data (flow and speed) collected during the following periods:
♦ OFF period (1): October 2006. ♦ OFF period (2): January - February 2007. ♦ ON period: March – April 2007.
Two OFF periods were included to account for any seasonal bias in the OFF (2) data set, particularly the fact that sunrise would be much later in this period and therefore the majority of the morning peak would be in darkness which can have a noticeable effect on driver behaviour.

RAMP METERING Operational Assessment
April 2008 4-22 5053147_04_02_027
The evaluation results detailed in Table 4.3 compares average journey times from both OFF periods with those from the ON period.
Overall journey time savings of 10.5% (75 seconds) have been observed in the ON period compared to the combined average OFF journey time from OFF periods 1 and 2. When compared separately, the journey time saving over OFF period 1 (October 2006) was 10% and for OFF period 2 (January – February 2007) was just under 14%.
The journey time savings occur towards the end of the peak period, with flow recovery occurring on average 30 minutes earlier in the ON data set. Analysis of MIDAS data indicates that traffic flows on the mainline have increased by an average 3% at each site with flow increases of between 105 and 168 vph.
Corridor 2 - M1 Southbound
M1 J35a Southbound*
M1 J35 Southbound
M1 J33 Southbound
*Not currently operational
Congestion along the southbound M1 corridor occurs during the morning and evening weekday peak periods. Traffic flows along this stretch of the M1 are ‘tidal’, with high traffic flows towards Sheffield and Rotherham in the morning peak with heavy outbound flows in the evening peak. For this reason, congestion is most common at J35a and J35 southbound in the morning peak (towards Sheffield) and J33 southbound in the evening peak (away from Sheffield).
Given their close proximity, there is significant interaction between J35 and J35a. However, as previously noted, J35a is not yet operational due to perceived site safety issues and therefore the corridor benefits reported are based on the other two operational sites. J33 southbound is located further south beyond Tinsley viaduct and congestion at this location rarely reaches back beyond J34. For this reason, results for M1 J35SB in the AM peak and J33 SB in the PM peak are reported separately.
The journey time evaluation for AM peak journeys at M6 J35 southbound suggest that RM is delaying the onset of flow breakdown in the morning peak and is having a positive impact on journey times, with an average overall reduction in AM peak journey times of 10.7%. In comparison average traffic flows have increased by 5% (237 vph).

RAMP METERING Operational Assessment
April 2008 4-23 5053147_04_02_027
Journey times at M1 J33 southbound have also improved, with an overall reduction in PM peak journey times of 9.1%, equivalent to almost 27 seconds.
Stand-alone Site
M62 J25 Eastbound
Flow breakdown typically occurs at this site during the morning peak from 07:00 onwards. The junction is located immediately south of two motorway interchanges between the M62 and the M606 and M621.
Delays forming at the two immediate downstream junctions, J26 (M606) and J27 (M621) lead to congestion building along the eastbound M62 to beyond J25 and therefore the traffic conditions on both the M606 and M621 can have a significant effect on the performance of M62 J25.
MIDAS coverage along this section of the M62 begins immediately east of J25, therefore the journey time evaluation only covers the section of the M62 downstream of J25. Any potential upstream benefit is not captured in the evaluation due to a lack of available data.
Evaluation of this site has been based on the comparison of journey time and traffic data (flow and speed) collected during the following periods:
♦ OFF period (1): October 2006. ♦ OFF period (2): January – February 2007. ♦ ON period: March 2007.
The results detailed in Table 4.3 compare average journey times from both OFF periods with those from the ON period. The results of this comparison show that average journey times during the morning peak at this site are longer in the ON period with an average increase in journey time of 4.8% (33 seconds).
A comparison of OFF period 1 (October 2006) with the ON data indicates that journey times increased by 15% (92 seconds) following the introduction of RM. However, a comparison with OFF period 2 (January to February 2007) indicates a 4% journey time saving (29 seconds).
The journey times on this section of the M62 are heavily dependant upon the traffic conditions at the downstream junctions with the M606 and M621 and it is considered that the increase in journey times are attributable to external impacts rather than the introduction of RM.

RAMP METERING
Operational Assessment
April 2008 4-24 5053147_04_02_027
Table 4.3 - Area 12 Mainline Journey Time Evaluation Results
Average Journey Time (s) Average Downstream Flow (vph) Evaluation Duration Site No Location
MAM OFF MAM ON Change* % MAM OFF MAM ON Change % From To
Corridor 1 – M1 Northbound AM Peak
15 M1 J39 NB 4221 4326 105 3% 13 M1 J40 NB 4779 4902 123 3% 14 M1 J41 NB
709.56 634.98 -74.57 -10.5% 5318 5486 168 3%
07:00 09:30
Corridor 2 – M1 Southbound AM Peak
17 M1 J35a SB AM* 12 M1 J35 SB AM
333 297 -35.72 -10.7% 4622 4859 237 5% 07:00 09:30
16 M1 J33 SB PM 293.77 267.07 -26.70 -9.1% Insufficient MIDAS data 16:30 19:00
Stand Alone Site
11 M62 J25 EB** 674.85 707.40 32.55 4.8% 4251 4438 187 4% 07:00 09:30 Average -10.1%
* Site not operational at time of evaluation ** Journey time results not indicative of performance improvement seen at M62 J25 EB, increased delays evident from downstream junctions. Journey time results excluded from final average.
RAMP METERING Operational Assessment
April 2008 4-25 5053147_04_02_027
Table 4.4 - Area 12 Sites Data Sample Size
Sample Size (days) Location Site
RM OFF RM ON
M1 J39 Northbound
M1 J40 Northbound Corridor 1
M1 J41 Northbound
13 25
M1 J35 Southbound 14 13 Corridor 2
M1 J33 Southbound 19 15
Stand-alone Site M62 J25 Eastbound 16 20
4.4 Area 9
The Area 9 journey time and traffic flow evaluation are presented in Table 4.5 and are discussed below. The sample size used to derive the evaluation results are reproduced in Table 4.6.
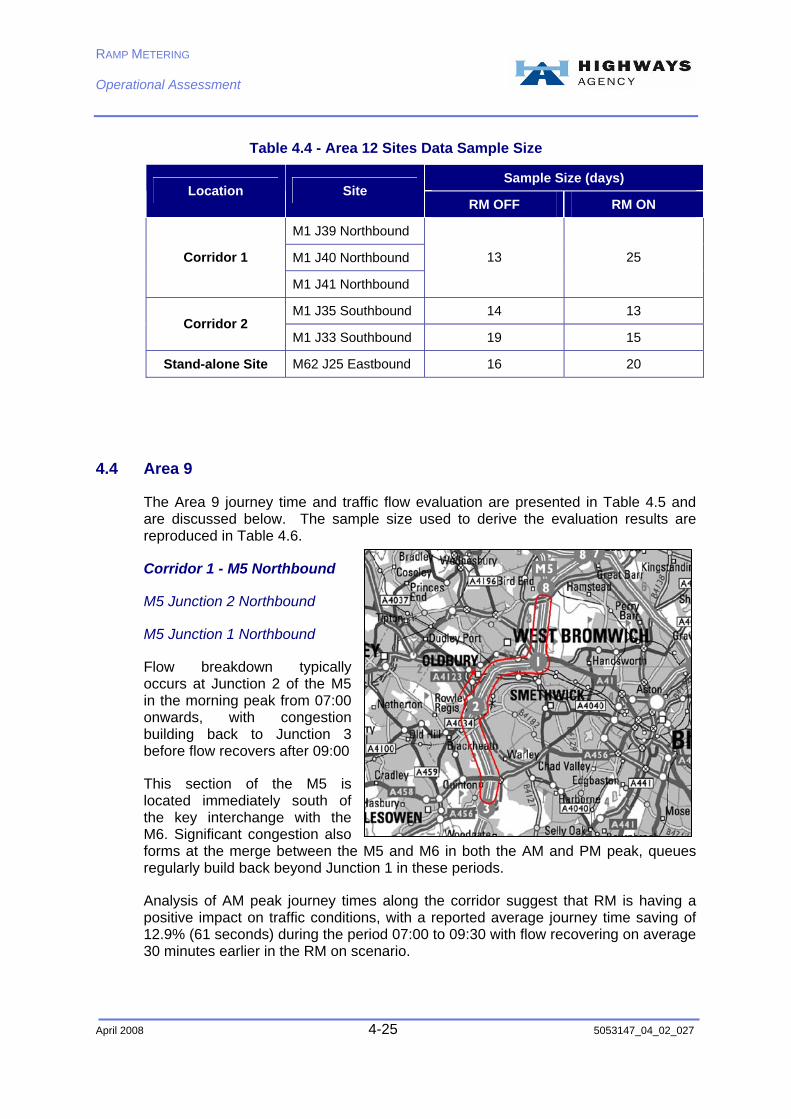
Corridor 1 - M5 Northbound
M5 Junction 2 Northbound
M5 Junction 1 Northbound
Flow breakdown typically occurs at Junction 2 of the M5 in the morning peak from 07:00 onwards, with congestion building back to Junction 3 before flow recovers after 09:00
This section of the M5 is located immediately south of the key interchange with the M6. Significant congestion also forms at the merge between the M5 and M6 in both the AM and PM peak, queues regularly build back beyond Junction 1 in these periods.
Analysis of AM peak journey times along the corridor suggest that RM is having a positive impact on traffic conditions, with a reported average journey time saving of 12.9% (61 seconds) during the period 07:00 to 09:30 with flow recovering on average 30 minutes earlier in the RM on scenario.
RAMP METERING Operational Assessment
April 2008 4-26 5053147_04_02_027
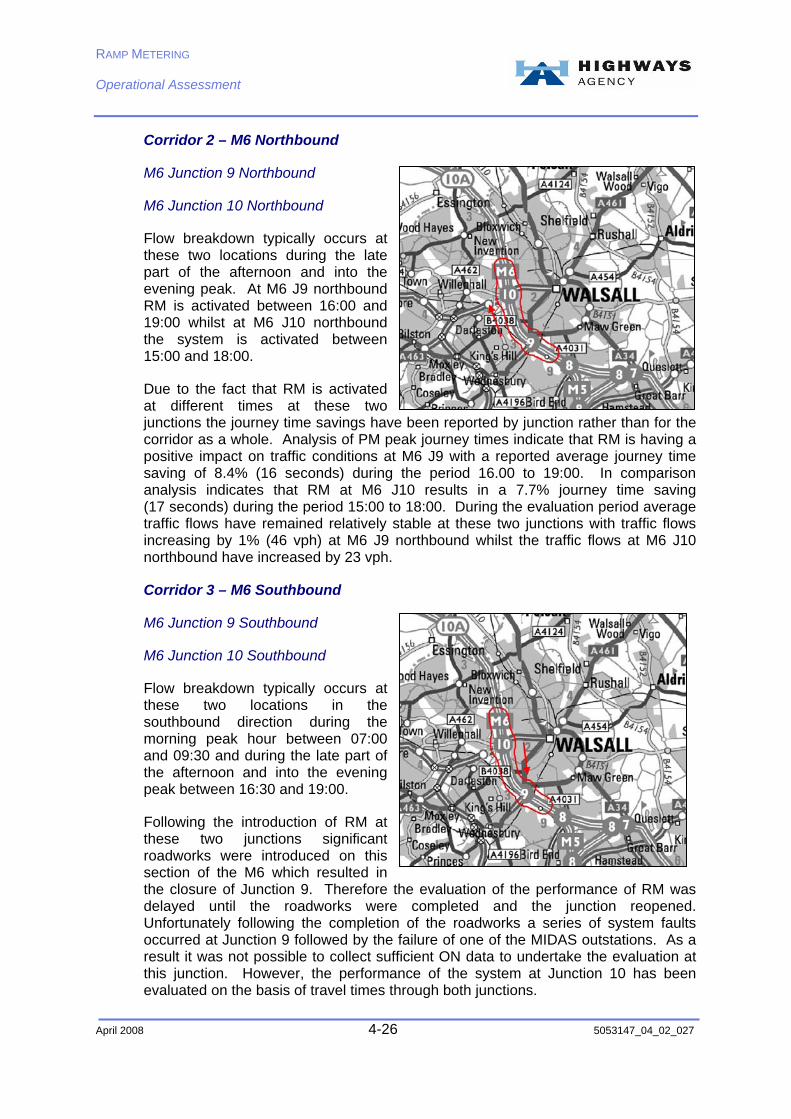
Corridor 2 – M6 Northbound
M6 Junction 9 Northbound
M6 Junction 10 Northbound
Flow breakdown typically occurs at these two locations during the late part of the afternoon and into the evening peak. At M6 J9 northbound RM is activated between 16:00 and 19:00 whilst at M6 J10 northbound the system is activated between 15:00 and 18:00.
Due to the fact that RM is activated at different times at these two junctions the journey time savings have been reported by junction rather than for the corridor as a whole. Analysis of PM peak journey times indicate that RM is having a positive impact on traffic conditions at M6 J9 with a reported average journey time saving of 8.4% (16 seconds) during the period 16.00 to 19:00. In comparison analysis indicates that RM at M6 J10 results in a 7.7% journey time saving (17 seconds) during the period 15:00 to 18:00. During the evaluation period average traffic flows have remained relatively stable at these two junctions with traffic flows increasing by 1% (46 vph) at M6 J9 northbound whilst the traffic flows at M6 J10 northbound have increased by 23 vph.
Corridor 3 – M6 Southbound
M6 Junction 9 Southbound
M6 Junction 10 Southbound
Flow breakdown typically occurs at these two locations in the southbound direction during the morning peak hour between 07:00 and 09:30 and during the late part of the afternoon and into the evening peak between 16:30 and 19:00.
Following the introduction of RM at these two junctions significant roadworks were introduced on this section of the M6 which resulted in the closure of Junction 9. Therefore the evaluation of the performance of RM was delayed until the roadworks were completed and the junction reopened. Unfortunately following the completion of the roadworks a series of system faults occurred at Junction 9 followed by the failure of one of the MIDAS outstations. As a result it was not possible to collect sufficient ON data to undertake the evaluation at this junction. However, the performance of the system at Junction 10 has been evaluated on the basis of travel times through both junctions.

RAMP METERING Operational Assessment
April 2008 4-27 5053147_04_02_027
Analysis of the AM peak travel times indicates that the RM at Junction 10 has resulted in a reduction in journey time through the corridor of 12.1% (236 seconds). In comparison the average mainline traffic flows through Junction 10, over the same period, have increased by 30% (1016 vph).
Analysis of PM peak journey times indicate that RM is having a positive impact on traffic conditions at M6 Junction 10 with a reported average journey time saving of 19% (296 seconds). During the evaluation period average traffic flows have increased during the PM peak by 8% (309 vph).
Stand- Alone Sites
M6 Junction 7 Southbound
During the OFF evaluation period, flow breakdown typically occurred at Junction 7 southbound in the morning peak from 07:00 onwards.
The journey time evaluation results indicate a journey time saving of approximately 11% (50 seconds) during the period 07:00 to 09:30 following the implementation of RM. Over the evaluation period average traffic flows have remained relatively stable with an observed 1% decrease in traffic flow (25vph).
M42 Junction 3 Eastbound
There is regular congestion along this eastbound stretch of the M42 in the morning peak, typically between 07:00 and 09:30. The seed point for this congestion is the diverge at Junction 3a where the link connector to the northbound M42 diverges from the mainline carriageway. Congestion is exacerbated by the high merge flows at J3 eastbound
The journey time evaluation results indicate a journey time saving of just over 14% (53 seconds) in the morning peak in the RM ON period. In comparison average traffic flows have increased by 3% (148 vph).

RAMP METERING Operational Assessment
April 2008 4-28 5053147_04_02_027
M6 Junction 5 Southbound
There is regular congestion along this southbound stretch of the M6 in the evening peak, typically between 16:30 and 19:00. The seed point for this congestion is the diverge at Junction 4a where the link connector to the M42 and M6 Toll Road diverges from the mainline carriageway.
The journey time evaluation results indicate a journey time saving of just over 12% (70 seconds) in the evening peak in the RM ON period. In comparison average traffic flows have remained stable with a small decrease in traffic flow (19 vph).

RAMP METERING Operational Assessment
April 2008 4-29 5053147_04_02_027
Table 4.5 - Area 9 Mainline Journey Time Evaluation Results
* Site not operational at time of evaluation. Journey time savings reported for whole corridor.
Average Journey Time (s) Average Downstream Flow (vph) Evaluation Duration Site No Location
MAM OFF MAM ON Change % MAM OFF MAM ON Change % From To
Corridor 1 – M5 Northbound 25 M5 J1 NB
26 M5 J2 NB 475.63 414.20 -61.43 - 12.9% MIDAS data not available in MAM OFF
scenario 07:00 09:30
Corridor 2 M6 Northbound 21 M6 J9 NB 184.90 169.28 -15.62 -8.4% 5571 5617 46 1% 16:00 19:00 23 M6 J10 NB 227.11 209.62 -17.49 -7.7% 5235 5258 23 0% 15:00 18:00
Corridor 3 M6 Southbound 20 M6 J9 SB – AM Peak* 22 M6 J10 SB – AM Peak
1946.56 1710.49 -236.07 -12.1% 3351 4366 1016 30%
07:00 09:30
20 M6 J9 SB – PM Peak* 16:30 19:00 22 M6 J10 SB – PM Peak
1531.88 1235.83 -296.05 -19.3% 4047 4356 309 8% 16:30 19:00
Stand Alone Sites 19 M6 J7 SB 466.12 415.83 - 50.29 - 10.8% 4691 4666 -25 -1% 07:00 09:30 27 M42 J3 EB 370.25 317.24 - 53.01 - 14.3% 4953 5101 148 3% 07:00 09:30 18 M6 J5 SB 565.08 495.06 -70.02 -12.4% 3998 3979 -19 0% 16:30 19:00
Average -12.2%
RAMP METERING Operational Assessment
April 2008 4-30 5053147_04_02_027
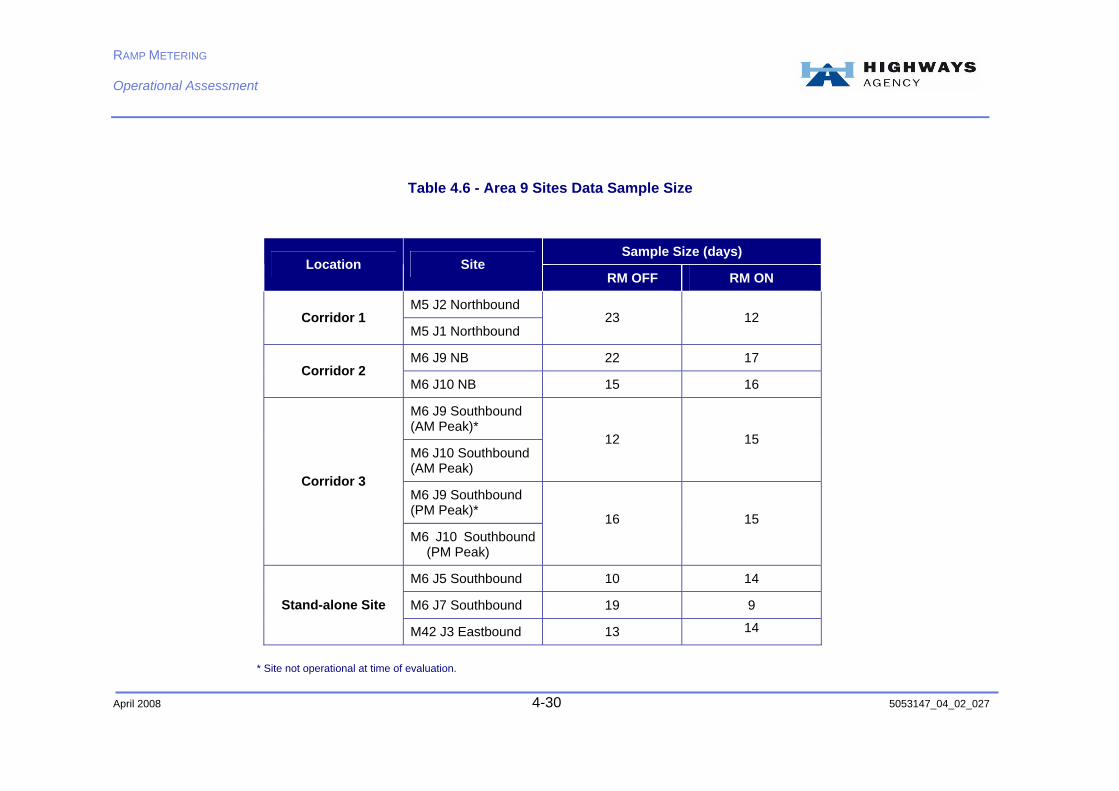
Table 4.6 - Area 9 Sites Data Sample Size
Sample Size (days) Location Site
RM OFF RM ON
M5 J2 Northbound Corridor 1
M5 J1 Northbound 23 12
M6 J9 NB 22 17 Corridor 2
M6 J10 NB 15 16
M6 J9 Southbound (AM Peak)*
M6 J10 Southbound (AM Peak)
12 15
M6 J9 Southbound (PM Peak)*
Corridor 3
M6 J10 Southbound (PM Peak)
16 15
M6 J5 Southbound 10 14
M6 J7 Southbound 19 9 Stand-alone Site
M42 J3 Eastbound 13 14
* Site not operational at time of evaluation.

RAMP METERING Operational Assessment
April 2008 5-31 5053147_04_02_027
5. Spot Speed Evaluation
5.1 Introduction
By delaying flow breakdown and / or aiding recovery from flow breakdown, RM has the potential to increase downstream traffic flows and increase both upstream and downstream traffic speed during congested peak periods.
Where possible the downstream MIDAS loop, which provides mainline information to the RM system, has been used to calculate the mainline traffic speeds with and without RM. In certain circumstances sufficient and accurate MIDAS data was not available and where this has occurred the specific site has been excluded from the assessment.
In order to maintain consistency with the journey time assessment contained in the previous chapter the results are based upon the same evaluation periods and data sets as used in the derivation of the journey times. It should also be noted that whilst the journey time evaluation compares travel time over several kilometres the traffic speeds are measured at a single point and are referred to as ‘spot speeds’.
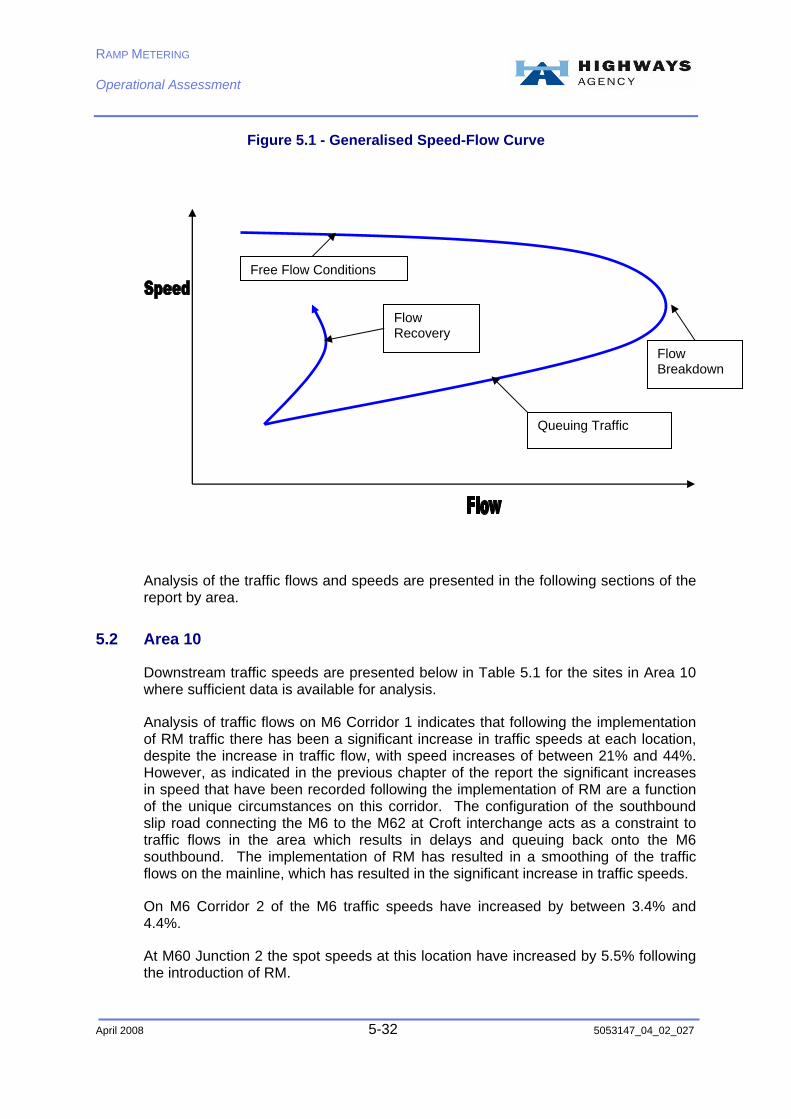
In addition to reporting changes in traffic speeds, as a result of the implementation of RM, data has been extracted from the downstream MIDAS loop in order to produce a speed-flow curve for each site. In order to assist in the interpretation of these diagrams a generalised speed-flow curve is presented in Figure 5.1 on the next page. In general conditions traffic speeds remain relatively stable as traffic flows increase until such a point as the capacity of the link is reached and at this point traffic flows become unstable and flow breakdown occurs. Once flow breakdown occurs traffic speeds decrease rapidly and vehicles begin to queue, which results in a reduction in traffic flow on the link.
As traffic flows recover following flow breakdown traffic speeds and flow increase as conditions return back to free flow levels. This recovery follows a different relationship to the original flow breakdown and a typical recovery profile is indicated on Figure 5.1.
RAMP METERING Operational Assessment
April 2008 5-32 5053147_04_02_027
Figure 5.1 - Generalised Speed-Flow Curve
Analysis of the traffic flows and speeds are presented in the following sections of the report by area.
5.2 Area 10
Downstream traffic speeds are presented below in Table 5.1 for the sites in Area 10 where sufficient data is available for analysis.
Analysis of traffic flows on M6 Corridor 1 indicates that following the implementation of RM traffic there has been a significant increase in traffic speeds at each location, despite the increase in traffic flow, with speed increases of between 21% and 44%. However, as indicated in the previous chapter of the report the significant increases in speed that have been recorded following the implementation of RM are a function of the unique circumstances on this corridor. The configuration of the southbound slip road connecting the M6 to the M62 at Croft interchange acts as a constraint to traffic flows in the area which results in delays and queuing back onto the M6 southbound. The implementation of RM has resulted in a smoothing of the traffic flows on the mainline, which has resulted in the significant increase in traffic speeds.
On M6 Corridor 2 of the M6 traffic speeds have increased by between 3.4% and 4.4%.
At M60 Junction 2 the spot speeds at this location have increased by 5.5% following the introduction of RM.
Flow Breakdown
Queuing Traffic
Free Flow Conditions
Flow Recovery

RAMP METERING Operational Assessment
April 2008 5-33 5053147_04_02_027
Table 5.1 - Area 10 Mainline Spot Speed Summary
Average Downstream Speed (kph)
RM Site No. and Location RM OFF
RM ON
% Change
M6 - Corridor (1) Sites
7 M6 J22 SB AM Peak 48 66 + 35.4%
4 M6 J25 SB AM Peak 69 83 + 20.9%
9 M62 J11 EB AM Peak 56 72 + 28.4%
1 M6 J23 SB AM Peak 55 79 + 44.1%
M6 - Corridor (2) Sites
2 M6 J22 NB PM Peak 74 77 + 3.4%
3 M6 J24 NB PM Peak 79 82 + 4.4 %
Stand Alone Sites
10 M60 J2 CW AM Peak 73 77 + 5.5%
Average + 20.3%
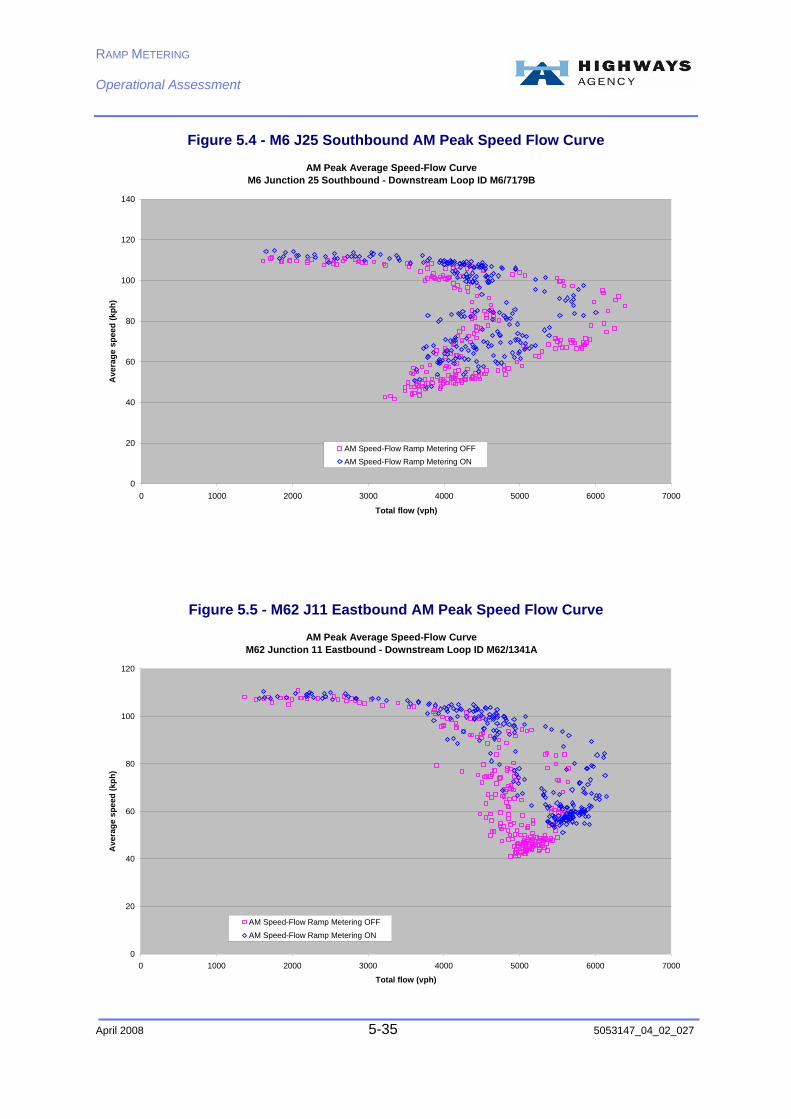
Speed-flow curves for the sites in Area 10, where sufficient data is available are presented below in Figures 5.2 to 5.7 inclusive. In general it can be seen that the impact of RM is to increase the volume of traffic that is able to travel on the link before flow breakdown occurs, as indicated by increased traffic flows prior to the onset of flow breakdown. In addition the duration and severity of this breakdown is reduced which is indicated by traffic flows and speeds recovering much earlier, in terms of traffic flows, with the implementation of RM. This is achieved by RM releasing traffic onto the mainline of the motorway, from the slip road, in a controlled manner which results in more stable flows on the mainline.

RAMP METERING Operational Assessment
April 2008 5-34 5053147_04_02_027
Figure 5.2 - M6 J22 Southbound AM Peak Speed Flow Curve AM Peak Average Speed-Flow Curve
M6 Junction 22 Southbound - Downstream Loop ID M6/7088B
0
20
40
60
80
100
120
0 1000 2000 3000 4000 5000 6000 7000
Total flow (vph)
Ave
rage
spe
ed (k
ph)
AM Speed-Flow Ramp Metering OFFAM Speed-Flow Ramp Metering ON
Figure 5.3 - M6 J23 Southbound AM Peak Speed Flow Curve
AM Peak Average Speed-Flow Curve M6 Junction 23 Southbound - Downstream Loop ID M6/7130B
0
20
40
60
80
100
120
0 1000 2000 3000 4000 5000 6000 7000
Total flow (vph)
Ave
rage
spe
ed (k
ph)
AM Speed-Flow Ramp Metering OFFAM Speed-Flow Ramp Metering ON
RAMP METERING Operational Assessment
April 2008 5-35 5053147_04_02_027
Figure 5.4 - M6 J25 Southbound AM Peak Speed Flow Curve
AM Peak Average Speed-Flow Curve M6 Junction 25 Southbound - Downstream Loop ID M6/7179B
0
20
40
60
80
100
120
140
0 1000 2000 3000 4000 5000 6000 7000
Total flow (vph)
Ave
rage
spe
ed (k
ph)
AM Speed-Flow Ramp Metering OFFAM Speed-Flow Ramp Metering ON
Figure 5.5 - M62 J11 Eastbound AM Peak Speed Flow Curve
AM Peak Average Speed-Flow Curve M62 Junction 11 Eastbound - Downstream Loop ID M62/1341A
0
20
40
60
80
100
120
0 1000 2000 3000 4000 5000 6000 7000
Total flow (vph)
Ave
rage
spe
ed (k
ph)
AM Speed-Flow Ramp Metering OFFAM Speed-Flow Ramp Metering ON

RAMP METERING Operational Assessment
April 2008 5-36 5053147_04_02_027
Figure 5.6 - M6 J24 Northbound PM Peak Speed Flow Curve
PM Peak Average Speed-Flow Curve M6 Junction 24 Northbound - Loop ID M6/7101A
0
20
40
60
80
100
120
0 1000 2000 3000 4000 5000 6000 7000 8000
Total flow (vph)
Ave
rage
spe
ed (k
ph)
PM Speed-Flow Ramp Metering OFFPM Speed-Flow Ramp Metering ON
Figure 5.7 - M60 J2 Clockwise AM Peak Speed Flow Curve
AM Peak Average Speed-Flow Curve M60 Junction 2 Clockwise - Downstream Loop ID M60/9028A
0
10
20
30
40
50
60
70
80
90
100
110
120
0 1000 2000 3000 4000 5000 6000 7000 8000 9000
Total flow (vph)
Ave
rage
spe
ed (k
ph)
AM Speed-Flow Before Ramp MeteringAM Speed-Flow With Ramp Metering
RAMP METERING Operational Assessment
April 2008 5-37 5053147_04_02_027
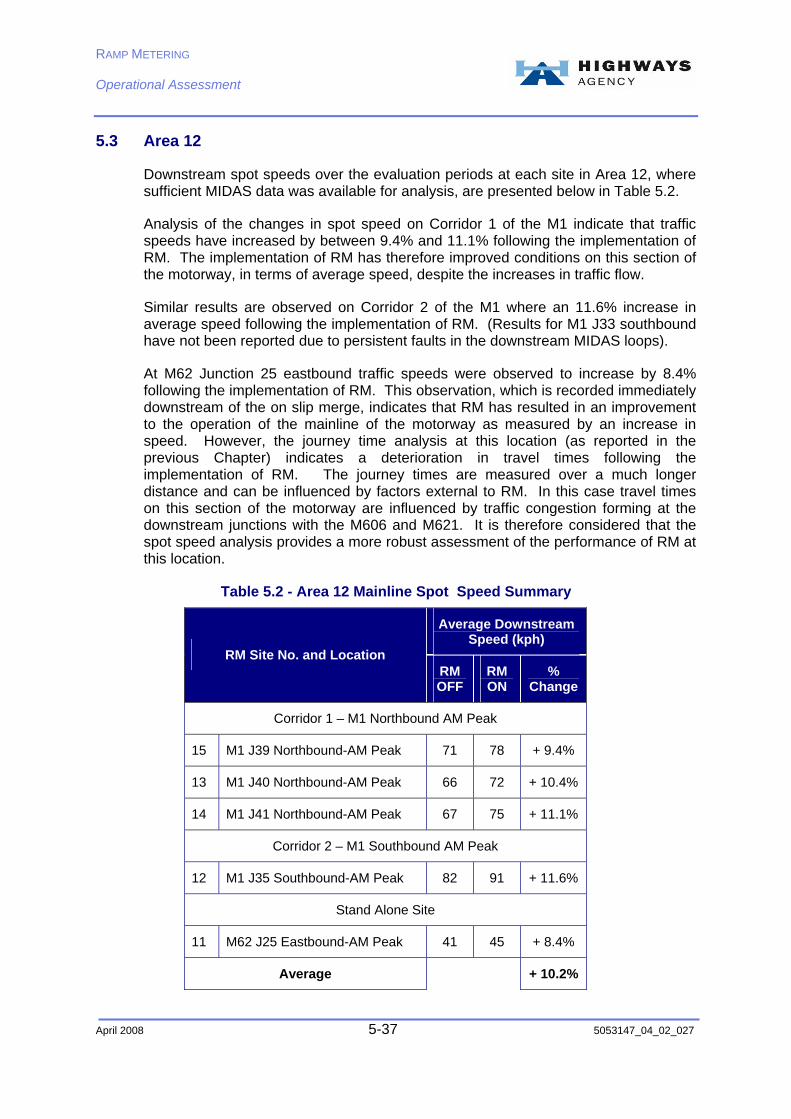
5.3 Area 12
Downstream spot speeds over the evaluation periods at each site in Area 12, where sufficient MIDAS data was available for analysis, are presented below in Table 5.2.
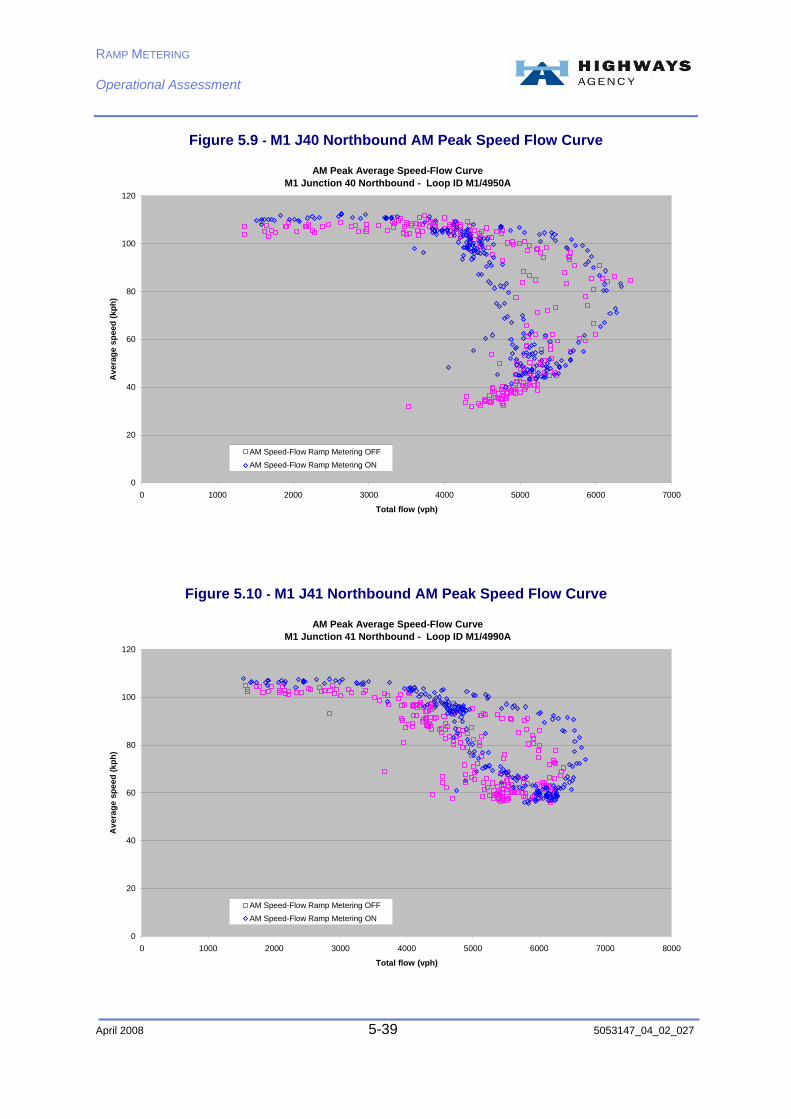
Analysis of the changes in spot speed on Corridor 1 of the M1 indicate that traffic speeds have increased by between 9.4% and 11.1% following the implementation of RM. The implementation of RM has therefore improved conditions on this section of the motorway, in terms of average speed, despite the increases in traffic flow.
Similar results are observed on Corridor 2 of the M1 where an 11.6% increase in average speed following the implementation of RM. (Results for M1 J33 southbound have not been reported due to persistent faults in the downstream MIDAS loops).
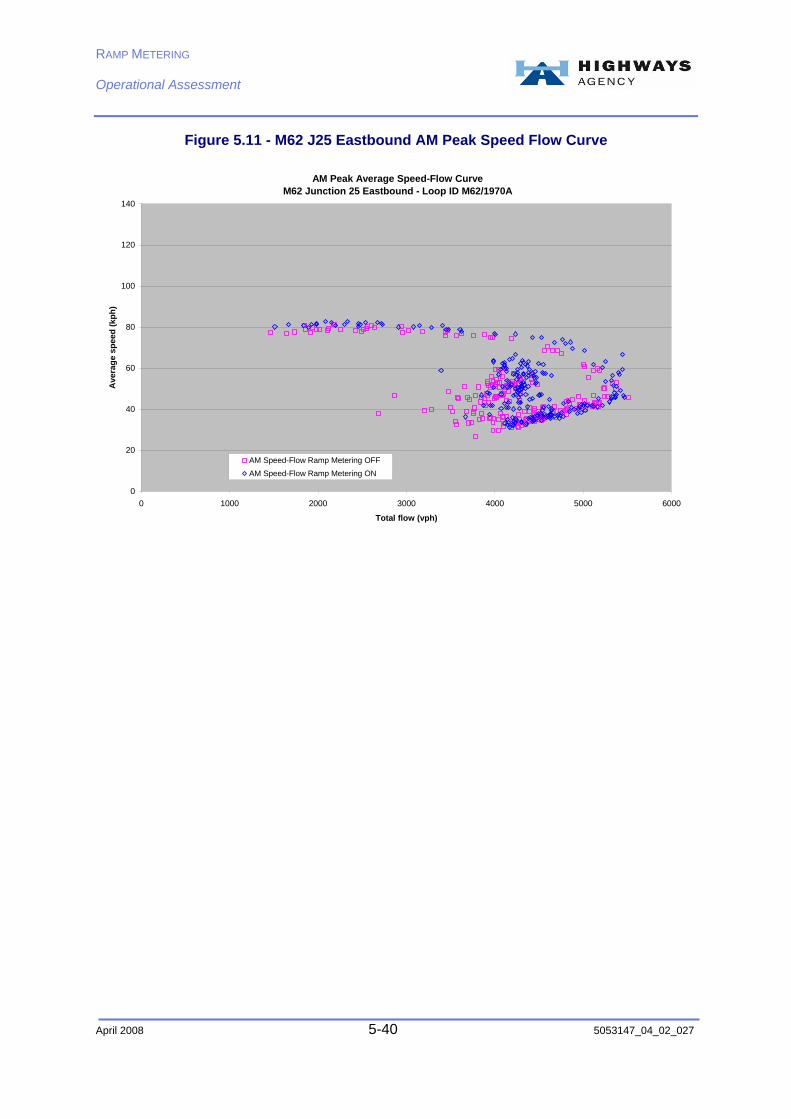
At M62 Junction 25 eastbound traffic speeds were observed to increase by 8.4% following the implementation of RM. This observation, which is recorded immediately downstream of the on slip merge, indicates that RM has resulted in an improvement to the operation of the mainline of the motorway as measured by an increase in speed. However, the journey time analysis at this location (as reported in the previous Chapter) indicates a deterioration in travel times following the implementation of RM. The journey times are measured over a much longer distance and can be influenced by factors external to RM. In this case travel times on this section of the motorway are influenced by traffic congestion forming at the downstream junctions with the M606 and M621. It is therefore considered that the spot speed analysis provides a more robust assessment of the performance of RM at this location.
Table 5.2 - Area 12 Mainline Spot Speed Summary
Average Downstream Speed (kph)
RM Site No. and Location RM OFF
RM ON
% Change
Corridor 1 – M1 Northbound AM Peak
15 M1 J39 Northbound-AM Peak 71 78 + 9.4%
13 M1 J40 Northbound-AM Peak 66 72 + 10.4%
14 M1 J41 Northbound-AM Peak 67 75 + 11.1%
Corridor 2 – M1 Southbound AM Peak
12 M1 J35 Southbound-AM Peak 82 91 + 11.6%
Stand Alone Site
11 M62 J25 Eastbound-AM Peak 41 45 + 8.4%
Average + 10.2%

RAMP METERING Operational Assessment
April 2008 5-38 5053147_04_02_027
Speed-flow curves for the sites in Area 12, where sufficient data is available are presented below in Figures 5.8 to 5.11 inclusive. In general it can be seen that the impact of RM is to increase the volume of traffic that is able to travel on the link before flow breakdown occurs, as indicated by increased traffic flows prior to the onset of flow breakdown. In addition, the duration and severity of this breakdown is reduced which is indicated by traffic flows and speeds recovering much earlier, in terms of traffic flows, with the implementation of RM. This is achieved by RM releasing traffic onto the mainline of the motorway, from the slip road, in a controlled manner which results in more stable flows on the mainline.
Figure 5.8 - M1 J39 Northbound AM Peak Speed Flow Curve
AM Peak Average Speed-Flow Curve
M1 Junction 39 Northbound - Loop ID M1/4910A
0
20
40
60
80
100
120
0 1000 2000 3000 4000 5000 6000 7000
Total flow (vph)
Ave
rage
spe
ed (k
ph)
AM Speed-Flow Ramp Metering OFFAM Speed-Flow Ramp Metering ON
RAMP METERING Operational Assessment
April 2008 5-39 5053147_04_02_027
Figure 5.9 - M1 J40 Northbound AM Peak Speed Flow Curve
AM Peak Average Speed-Flow Curve M1 Junction 40 Northbound - Loop ID M1/4950A
0
20
40
60
80
100
120
0 1000 2000 3000 4000 5000 6000 7000
Total flow (vph)
Ave
rage
spe
ed (k
ph)
AM Speed-Flow Ramp Metering OFFAM Speed-Flow Ramp Metering ON
Figure 5.10 - M1 J41 Northbound AM Peak Speed Flow Curve
AM Peak Average Speed-Flow Curve M1 Junction 41 Northbound - Loop ID M1/4990A
0
20
40
60
80
100
120
0 1000 2000 3000 4000 5000 6000 7000 8000
Total flow (vph)
Ave
rage
spe
ed (k
ph)
AM Speed-Flow Ramp Metering OFFAM Speed-Flow Ramp Metering ON
RAMP METERING Operational Assessment
April 2008 5-40 5053147_04_02_027
Figure 5.11 - M62 J25 Eastbound AM Peak Speed Flow Curve
AM Peak Average Speed-Flow Curve M62 Junction 25 Eastbound - Loop ID M62/1970A
0
20
40
60
80
100
120
140
0 1000 2000 3000 4000 5000 6000
Total flow (vph)
Ave
rage
spe
ed (k
ph)
AM Speed-Flow Ramp Metering OFFAM Speed-Flow Ramp Metering ON

RAMP METERING Operational Assessment
April 2008 5-41 5053147_04_02_027
5.4 Area 9
Downstream spot speeds at each site in Area 9, where sufficient MIDAS data was available, are presented below in Table 5.3.
At M5 Junction 2 northbound there were faults with the MIDAS loops during the OFF period and as a result it is has not been possible to report results immediately downstream of the merge. However, in order to provide some information on the performance of RM in this area the MIDAS loops immediately upstream of the merge have been used which indicate that spot speeds have remained unchanged at this location following the introduction of RM.
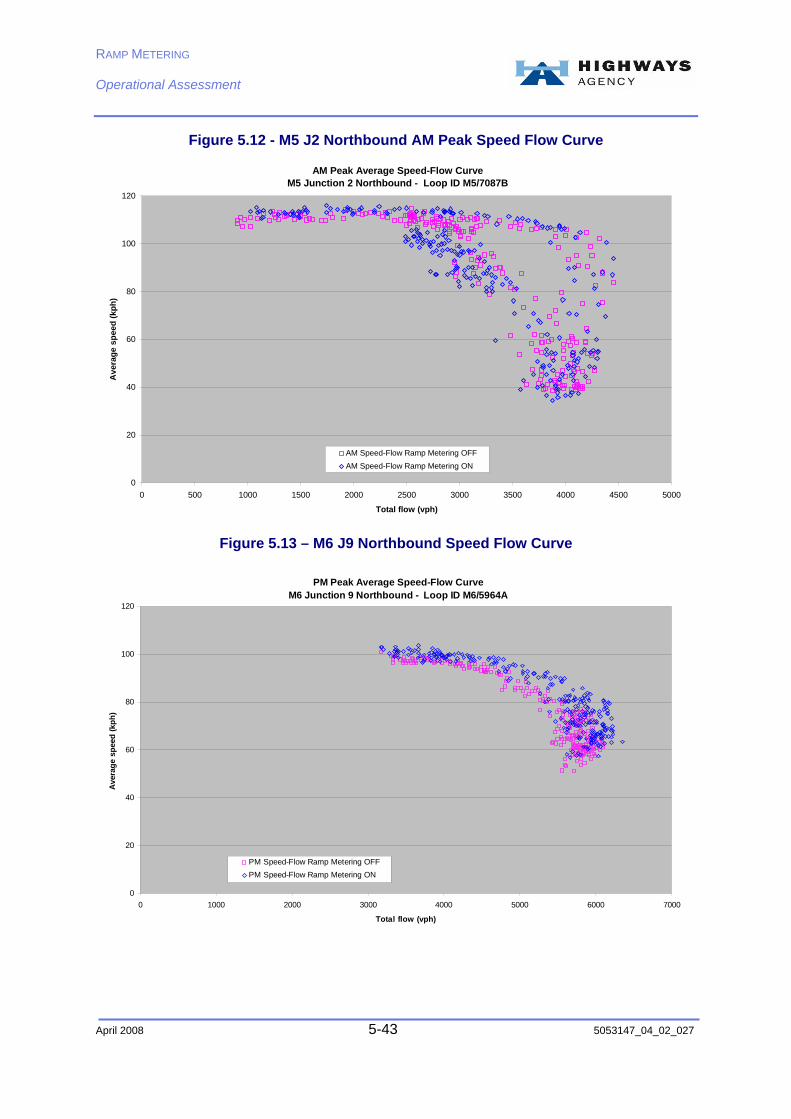
On the M6 northbound corridor spot speeds have increased by between 3.54% and 12.15% despite a small increase in traffic flow on the corridor, as reported in the previous section. In comparison spot speeds on the M6 southbound corridor, at M6 Junction 10, have decreased by 12.1% and 8.6% in the morning and evening peaks respectively. However, as discussed in the previous section, average journey times across the whole corridor have decreased following the introduction of RM. Whilst traffic speeds have reduced at this one location the introduction of RM results in smoother traffic speeds which results in an overall improvement in journey time.
At the stand alone sites in Area 9 traffic speeds were observed to decrease at M6 Junction 7 southbound by 8.3% and by 20.5% at M42 J3 eastbound between the RM OFF and ON periods. In contrast traffic speeds were observed to decrease by 3.5% at M6 Junction 5 southbound. However, as with the observed speeds at M6 Junction 10 southbound the journey time analysis reported in the previous section of the report indicates a reduction in journey time at this location. Once again whilst traffic speeds have reduced at this one location the introduction of RM results in smoother traffic speeds which results in an overall improvement in journey time.

RAMP METERING Operational Assessment
April 2008 5-42 5053147_04_02_027
Table 5.3 - Area 9 Mainline Spot Speed Summary
Average Downstream Speed (kph)
RM Site No.
and Location RM OFF
RM ON
% Change
Corridor 1 – M5 Northbound
26 M5 J2 NB – AM Peak* 70 70 -0.4%
Corridor 2 – M6 Northbound
21 M6 J9 NB – PM Peak 69 78 + 12.2%
23 M6 J10 NB – PM Peak 89 93 + 3.5%
Corridor 3 – M6 Southbound
22 M6 J10 SB – AM Peak 55 48 -12.1%
22 M6 J10 SB – PM Peak 81 74 -8.6%
Stand Alone Sites
19 M6 J7 SB – AM Peak 72 78 + 8.3%
27 M42 J3 EB – AM Peak 73 88 + 20.5%
18 M6 J5 SB – PM Peak 79 77 -3.5%
Average + 2.8%
* Upstream results reported due to faults with MIDAS OFF data
Speed-flow curves for the sites in Area 9, where sufficient data is available are presented below in Figures 5.12 to 5.19 inclusive. In general it can be seen that the impact of RM is to increase the volume of traffic that is able to travel on the link before flow breakdown occurs, as indicated by increased traffic flows prior to the onset of flow breakdown. In addition the duration and severity of this breakdown is reduced which is indicated by traffic flows and speeds recovering much earlier, in terms of traffic flows, with the implementation of RM. This is achieved by RM releasing traffic onto the mainline of the motorway, from the slip road, in a controlled manner which results in more stable flows on the mainline.
RAMP METERING Operational Assessment
April 2008 5-43 5053147_04_02_027
Figure 5.12 - M5 J2 Northbound AM Peak Speed Flow Curve
AM Peak Average Speed-Flow Curve M5 Junction 2 Northbound - Loop ID M5/7087B
0
20
40
60
80
100
120
0 500 1000 1500 2000 2500 3000 3500 4000 4500 5000
Total flow (vph)
Ave
rage
spe
ed (k
ph)
AM Speed-Flow Ramp Metering OFFAM Speed-Flow Ramp Metering ON
Figure 5.13 – M6 J9 Northbound Speed Flow Curve
PM Peak Average Speed-Flow Curve M6 Junction 9 Northbound - Loop ID M6/5964A
0
20
40
60
80
100
120
0 1000 2000 3000 4000 5000 6000 7000
Total flow (vph)
Aver
age
spee
d (k
ph)
PM Speed-Flow Ramp Metering OFFPM Speed-Flow Ramp Metering ON

RAMP METERING Operational Assessment
April 2008 5-44 5053147_04_02_027
Figure 5.14 – M6 J10 Northbound Speed Flow Curve
PM Peak Average Speed-Flow Curve M6 Junction 10 Northbound - Loop ID M6/5989A
0
20
40
60
80
100
120
0 1000 2000 3000 4000 5000 6000 7000
Total flow (vph)
Aver
age
spee
d (k
ph)
PM Speed-Flow Ramp Metering OFFPM Speed-Flow Ramp Metering ON
Figure 5.15 - M6 J10 Southbound AM Peak Speed Flow Curve
AM Peak Average Speed-Flow Curve M6 Junction 10 Southbound - Loop ID M6/5904B
0
20
40
60
80
100
120
0 1000 2000 3000 4000 5000 6000
Total flow (vph)
Ave
rage
spe
ed (k
ph)
AM Speed-Flow Ramp Metering OFFAM Speed-Flow Ramp Metering ON

RAMP METERING Operational Assessment
April 2008 5-45 5053147_04_02_027
Figure 5.16 - M6 J10 Southbound PM Peak Speed Flow Curve
PM Peak Average Speed-Flow Curve M6 Junction 10 Southbound
0
20
40
60
80
100
120
0 1000 2000 3000 4000 5000 6000
Total flow (vph)
Ave
rage
spe
ed (k
ph)
PM Speed-Flow Ramp Metering OFFPM Speed-Flow Ramp Metering ON
Figure 5.17 - M6 J7 Southbound AM Peak Speed Flow Curve
AM Peak Average Speed-Flow Curve M6 Junction 7 Southbound - Loop ID M6/5894B
0
20
40
60
80
100
120
0 1000 2000 3000 4000 5000 6000
Total flow (vph)
Ave
rage
spe
ed (k
ph)
AM Speed-Flow Ramp Metering OFFAM Speed-Flow Ramp Metering ON

RAMP METERING Operational Assessment
April 2008 5-46 5053147_04_02_027
Figure 5.18 - M42 J3 Eastbound AM Peak Speed Flow Curve
AM Peak Average Speed-Flow Curve
M42 Junction 3 Eastbound - Loop ID M42/6247A
0
20
40
60
80
100
120
0 1000 2000 3000 4000 5000 6000 7000
Total flow (vph)
Ave
rage
spe
ed (k
ph)
AM Speed-Flow Ramp Metering OFFAM Speed-Flow Ramp Metering ON
Figure 5.19 - M6 J5 Southbound PM Peak Speed Flow Curve
PM Peak Average Speed-Flow Curve M6 Junction 5 Southbound
0
20
40
60
80
100
120
0 1000 2000 3000 4000 5000 6000
Total flow (vph)
Ave
rage
spe
ed (k
ph)
PM Speed-Flow Ramp Metering OFFPM Speed-Flow Ramp Metering ON
RAMP METERING Operational Assessment
April 2008 6-47 5053147_04_02_027
6. Slip Road Delays and Economic Appraisal
6.1 Introduction
Prior to the installation of RM at the 30 sites, an economic appraisal was undertaken to assess the potential benefits of the system using assumed performance data. Now that the system has been operational the opportunity has been taken to review the economic benefits of the system using observed data.
Following discussions the initial economic appraisal of RM was based upon an assumed 5% reduction in Vehicle Hours Delay (VHD) on the mainline carriageway during peak operational periods. This reduction in delay equated to an approximate five second saving per vehicle on the mainline over a typical two hour peak period. At the time of the assessment this was considered to be a conservative estimate of the overall benefits of RM as it was anticipated that RM would result in a reduction of VHD in excess of 5% and this has proved to be the case following an assessment of observed data. In addition the initial economic appraisal did not take into consideration any increase in journey time that may accrue to slip road traffic as a consequence of introducing signals on the slip road.
This chapter reports the impact of observed data and the economic appraisal of RM based upon observed journey time savings on the mainline inclusive of any delays experienced by slip road traffic.
6.2 Assessment Methodology
The principle benefit realised by the RM system is an improvement in journey times for vehicles on the mainline carriageway. These journey time savings, net of any potential increase in delay to slip road traffic, can be converted in to monetary terms using standard Department for Transport (DfT) guidelines for the economic assessment of highway schemes.
This allows a standard cost-benefit analysis to be undertaken over a given assessment period to determine the overall economic impact for RM inline with the latest HA Project Appraisal Report Guidance (PAR 4).
The average daily journey time savings on the mainline carriageway for each operational site are detailed in Chapter 4. These daily journey time savings have been applied to the average observed upstream flow over the evaluation period to determine the total daily journey time saving for mainline traffic at each site.
The use of upstream flow in this calculation is a conservative approach which does not account for any benefit to upstream traffic diverging prior to the on-slip nor does it include downstream benefit for on-slip traffic.
Slip road delay has been calculated using the method described in Chapter 3. The economic assessment assumes this delay is entirely additional delay, when in reality there is likely to be delay on the slip road without RM operating, due to the congested nature of the junctions selected for the RM30 programme.
RAMP METERING Operational Assessment
April 2008 6-48 5053147_04_02_027
To determine the opening year benefit for each site, the daily savings need to be represented annually. The standard annual factor of 250 days per year has been used for those sites which on average operated every weekday during the evaluation period.
At some sites, congestion is less frequent and does not occur on every day of the week. Where this is the case, the annual benefits reported reflect this, using an annual factor linked to the number of days per week the site typically operates.
The average 30 year cost of the initial RM30 sites (including ongoing maintenance and replacement) has been calculated to be £334,000 per site. This cost has been used to determine the First Year Rate of Return (FYRR) for each site.
6.3 Slip Road Delays
Slip road delays, as a consequence of RM, have been calculated using the methodology detailed in Chapter 3. Details of queues on the slip road were extracted from the system logs, where available, and used with slip road traffic flows, extracted from the MIDAS system, to calculate the slip road delays.
In a number of cases it was not possible to calculate the delays on the slip roads due to system log data or MIDAS information not being available. The results for the sites where sufficient information was available are presented in Table 6.1 below.
On the basis of the calculated figures the average delays at the slip roads range from 8 seconds at M6 J10 northbound up to 78 seconds at M6 J25 southbound and M6 J22 southbound. Average queue lengths range from 3 vehicles at M6 J22 northbound to 27 vehicles at M42 J3 Eastbound.
In considering the economic performance of RM it has been assumed that these delays constitute a delay over and above that which would have been experienced had RM not been in place. In reality there would be some delays for slip road traffic in the absence of RM and the adopted approach therefore overestimates the detrimental impact of the system on slip road traffic in order to provide a robust assessment of the system as a whole. The observed economic performance of the system is detailed in the following section of the report.
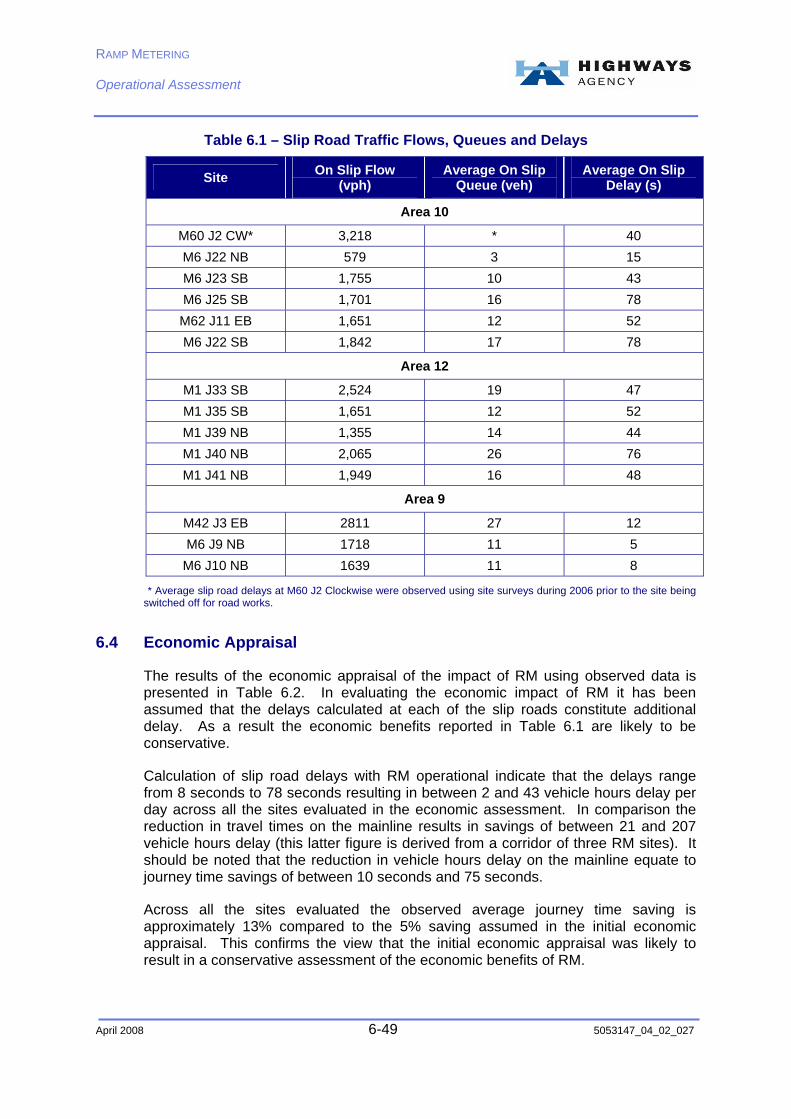
RAMP METERING Operational Assessment
April 2008 6-49 5053147_04_02_027
Table 6.1 – Slip Road Traffic Flows, Queues and Delays
Site On Slip Flow (vph)
Average On Slip Queue (veh)
Average On Slip Delay (s)
Area 10
M60 J2 CW* 3,218 * 40 M6 J22 NB 579 3 15 M6 J23 SB 1,755 10 43 M6 J25 SB 1,701 16 78 M62 J11 EB 1,651 12 52 M6 J22 SB 1,842 17 78
Area 12
M1 J33 SB 2,524 19 47 M1 J35 SB 1,651 12 52 M1 J39 NB 1,355 14 44 M1 J40 NB 2,065 26 76 M1 J41 NB 1,949 16 48
Area 9
M42 J3 EB 2811 27 12 M6 J9 NB 1718 11 5
M6 J10 NB 1639 11 8
* Average slip road delays at M60 J2 Clockwise were observed using site surveys during 2006 prior to the site being switched off for road works.
6.4 Economic Appraisal
The results of the economic appraisal of the impact of RM using observed data is presented in Table 6.2. In evaluating the economic impact of RM it has been assumed that the delays calculated at each of the slip roads constitute additional delay. As a result the economic benefits reported in Table 6.1 are likely to be conservative.
Calculation of slip road delays with RM operational indicate that the delays range from 8 seconds to 78 seconds resulting in between 2 and 43 vehicle hours delay per day across all the sites evaluated in the economic assessment. In comparison the reduction in travel times on the mainline results in savings of between 21 and 207 vehicle hours delay (this latter figure is derived from a corridor of three RM sites). It should be noted that the reduction in vehicle hours delay on the mainline equate to journey time savings of between 10 seconds and 75 seconds.
Across all the sites evaluated the observed average journey time saving is approximately 13% compared to the 5% saving assumed in the initial economic appraisal. This confirms the view that the initial economic appraisal was likely to result in a conservative assessment of the economic benefits of RM.
RAMP METERING Operational Assessment
April 2008 6-50 5053147_04_02_027
Having deducted the daily vehicle hours delay attributable to the slip roads from the vehicle hours saved on the mainline the annual vehicle hours saved across all the sites, evaluated in the economic assessment, ranged from approximately 1,700 hours to approximately 32,200 hours. Converting these figures into monetary values using standard cost benefit values results in first year benefits of between £22,000 and £380,000 across the RM sites evaluated (it should be noted that the latter figure refers to a corridor of three RM sites). This results in a FYRR of between 7% and 98% across all the sites evaluated with an average return of 34%, compared to an average of 7% derived in the initial economic appraisal using assumed performance data.
The economic assessment of the performance of RM using observed data indicates that the system performs extremely well and that the system results in a positive return.
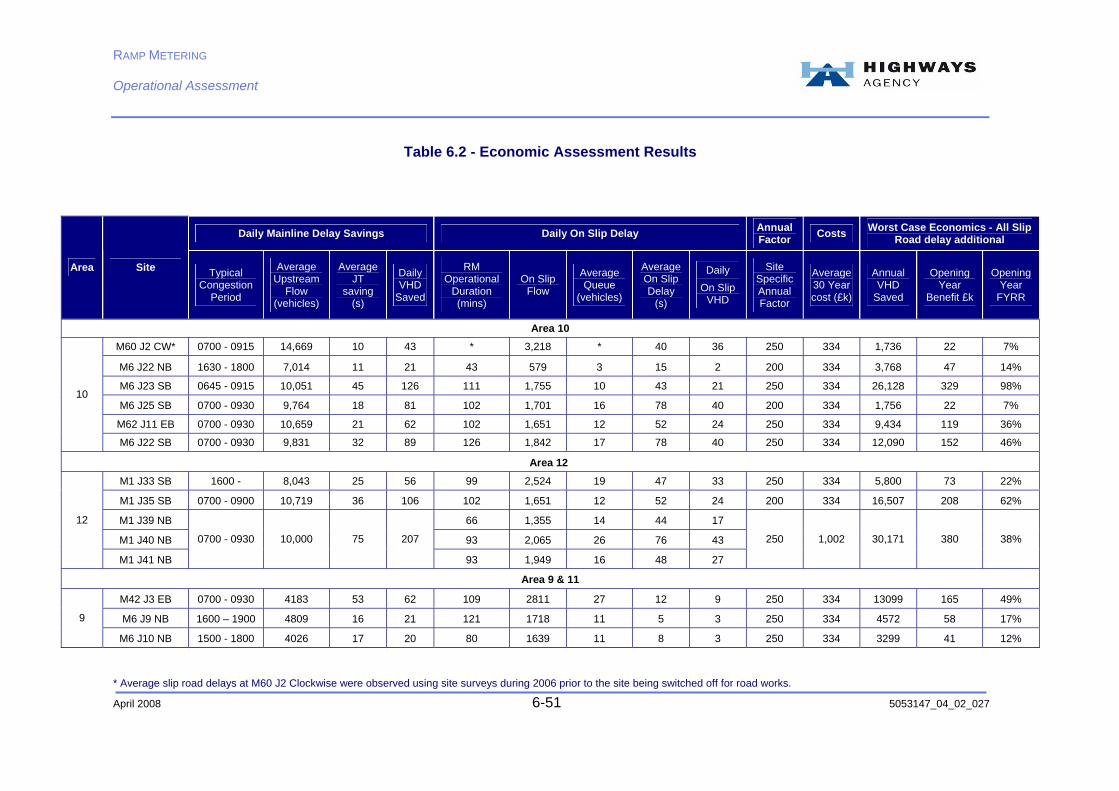
RAMP METERING Operational Assessment
April 2008 6-51 5053147_04_02_027
Table 6.2 - Economic Assessment Results
* Average slip road delays at M60 J2 Clockwise were observed using site surveys during 2006 prior to the site being switched off for road works.
Daily Mainline Delay Savings Daily On Slip Delay Annual Factor Costs Worst Case Economics - All Slip
Road delay additional
Area Site Typical Congestion
Period
Average Upstream
Flow (vehicles)
Average JT
saving (s)
Daily VHD
Saved
RM Operational
Duration (mins)
On Slip Flow
Average Queue
(vehicles)
Average On Slip Delay
(s)
Daily On Slip
VHD
Site Specific Annual Factor
Average 30 Year cost (£k)
Annual VHD
Saved
Opening Year
Benefit £k
Opening Year
FYRR
Area 10 M60 J2 CW* 0700 - 0915 14,669 10 43 * 3,218 * 40 36 250 334 1,736 22 7%
M6 J22 NB 1630 - 1800 7,014 11 21 43 579 3 15 2 200 334 3,768 47 14%
M6 J23 SB 0645 - 0915 10,051 45 126 111 1,755 10 43 21 250 334 26,128 329 98%
M6 J25 SB 0700 - 0930 9,764 18 81 102 1,701 16 78 40 200 334 1,756 22 7%
M62 J11 EB 0700 - 0930 10,659 21 62 102 1,651 12 52 24 250 334 9,434 119 36%
10
M6 J22 SB 0700 - 0930 9,831 32 89 126 1,842 17 78 40 250 334 12,090 152 46%
Area 12
M1 J33 SB 1600 - 8,043 25 56 99 2,524 19 47 33 250 334 5,800 73 22%
M1 J35 SB 0700 - 0900 10,719 36 106 102 1,651 12 52 24 200 334 16,507 208 62%
M1 J39 NB 66 1,355 14 44 17
M1 J40 NB 93 2,065 26 76 43
12
M1 J41 NB
0700 - 0930 10,000 75 207
93 1,949 16 48 27
250 1,002 30,171 380 38%
Area 9 & 11 M42 J3 EB 0700 - 0930 4183 53 62 109 2811 27 12 9 250 334 13099 165 49%
M6 J9 NB 1600 – 1900 4809 16 21 121 1718 11 5 3 250 334 4572 58 17% 9
M6 J10 NB 1500 - 1800 4026 17 20 80 1639 11 8 3 250 334 3299 41 12%

RAMP METERING Operational Assessment
April 2008 7-52 5053147_04_02_027
7. Conclusions The results contained in this report, demonstrate that RM has had a positive impact on journey times and traffic flows on the mainline carriageway when installed at carefully selected locations on the motorway network.
The results in Chapter 6, demonstrate that the delays RM can have upon on slip road traffic is more than outweighed by the benefit received by vehicles on the mainline carriageway, with a close link between the level of savings on the mainline and the level of delay on the slip road.
The overall increase in peak period traffic flows observed on the mainline after the installation of RM varies by site with individual increases in traffic flow ranging from 1% to 30%. However, it should be noted that at a number of sites traffic flows remained relatively unchanged or reduced slightly post RM.
Despite the increases in traffic flow the implementation of RM has resulted in overall journey time savings on the mainline during peak periods of up to 40% with an average journey time saving for mainline traffic of 13% across all sites evaluated. The average on-slip delay per vehicle with RM operational ranged from 8 seconds to 78 seconds; however the sites with the highest delay on the slip road in general also delivered the highest benefit on the mainline.
In many cases, RM operation has led to a delay in the onset of flow breakdown and/or earlier recovery from flow breakdown conditions.
The initial economic assessment of RM was undertaken on the basis of an assumed 5% reduction in delay for mainline traffic, which resulted in a 7% FYRR averaged across all thirty sites. The revised economic assessment, which has been based upon the observed mainline journey time savings, together with the calculated slip road delays, indicates that RM yields significantly higher returns than those assumed in the initial evaluation, with FYRR ranging from 7% through to 98%, with an average FYRR for those sites evaluated of 34%. The observed FYRRs are much higher than those derived in the initial economic assessment due to the fact that the actual journey time savings, as a result of implementing RM, are much higher than those assumed in the initial appraisal.
The operational assessment of RM has indicated that the system has resulted in significant benefits to the travelling public on the mainline of the motorway in terms of journey time savings, increased speeds, increased traffic flows and more stable conditions. In addition the system results in economic benefits with significant returns in its first year of operation, despite delays being experienced by slip road traffic.
Operationally RM has therefore proved to be a great success.

RAMP METERING Operational Assessment
April 2008 A-53 5053147_04_02_027
APPENDIX A
Glossary

RAMP METERING Operational Assessment
April 2008 A-54 5053147_04_02_027
Glossary
Acronym Description CW Clockwise DfT Department for Transport EB Eastbound FYRR First Year Rate of Return HA Highways Agency RM Motorway Access Management MIDAS Motorway Incident Detection and Automatic Signalling MTV Motorway Traffic Viewer NB Northbound RM Ramp Metering RCC Regional Control Centre SB Southbound VHD Vehicle Hours Delay WB Westbound