rain year 2000/2001 water quality analysis report quality reports/200… · rain year 2000/2001...
TRANSCRIPT
Rain Year 2000/2001Water Quality Analysis Report
County of Santa Barbara, CaliforniaSeptember 2001
Public Works DepartmentPublic Health Department
Staff Contact:Robert Almy
Manager, Project Clean Water568-3542
HTTP://WWW.COUNTYOFSB.ORG/PROJECT_CLEANWATER
Storm water sampling takes a great deal of commitment and energy in order to respond efficiently to themany false alarms, the many late nights, and the many unexpected storm events. The County is grateful tothe many volunteers and staff that participated in the efforts or who made themselves available on a stand-by basis. In particular, we would like to thank the work done by the Public Health staff, including the lab.Also, special thanks to Tommy Liddell and Willie Brummett who keep the program running smoothly dayand night.

Table of Contents
1.0 INTRODUCTION ...............................................................................................................................1
2.0 REGULATORY SETTING.................................................................................................................2
2.1 NPDES.............................................................................................................................................22.2 TMDLs.............................................................................................................................................22.3 Basin Plan Objectives and State Ocean Water Quality Standards...................................................4
3.0 METHODS ..........................................................................................................................................5
3.1 Sampling Overview..........................................................................................................................53.2 Sample Sites.....................................................................................................................................53.3 Sample Collection............................................................................................................................63.4 Analysis Performed..........................................................................................................................7
3.4.1 Bacteria.....................................................................................................................................73.4.2 Pesticides..................................................................................................................................83.4.3 VOCs .......................................................................................................................................93.4.4 Metals .......................................................................................................................................93.4.5 Nutrients ..................................................................................................................................93.4.6 Other Constituents .................................................................................................................10
3.5 Changes to Sampling Program.......................................................................................................103.5.1 Water Chemistry Analysis .......................................................................................................103.5.2 Biological Monitoring .............................................................................................................12
3.6 Precipitation and Storm Tracking ..................................................................................................133.7 Sampling QA/QC...........................................................................................................................13
4.0 RESULTS & DISCUSSION .............................................................................................................15
4.1 Low Flow Sampling.......................................................................................................................154.2 Storm Sampling Results.................................................................................................................154.3 Summary of Findings.....................................................................................................................16
4.3.1 "First Flush" Pollutant Loading ..............................................................................................164.3.2 Bacteria...................................................................................................................................174.3.3 Pesticides................................................................................................................................184.3.4 VOCs .....................................................................................................................................194.3.5 Metals .....................................................................................................................................194.3.6 Nutrients ................................................................................................................................204.3.7 Other Constituents .................................................................................................................214.3.8 Atascadero Loading Site .........................................................................................................214.3.9 Treatment Control Pilot Project (TCPP).................................................................................224.3.10 Benthic Macroinvertebrate Sampling ......................................................................................22
5.0 RECOMMENDATIONS...................................................................................................................24
6.0 REFERENCES ..................................................................................................................................26
Appendices
A Sampling Sites, Constituents, PQLs, Standards, and Basin Plan Objectives .... A-1
B Storm and Precipitation Tracking................................................................... B-1
C Storm Sampling Results ................................................................................. C-1
D Atascadero Loading Site Storm Sampling Results........................................... D-1
E Sampling Protocol, Logistics and Preparation ................................................ E-1
F Preliminary Benthic Macroinvertebrate Sampling Results............................... F-1
Water Quality Analysis ReportSeptember 2001
i
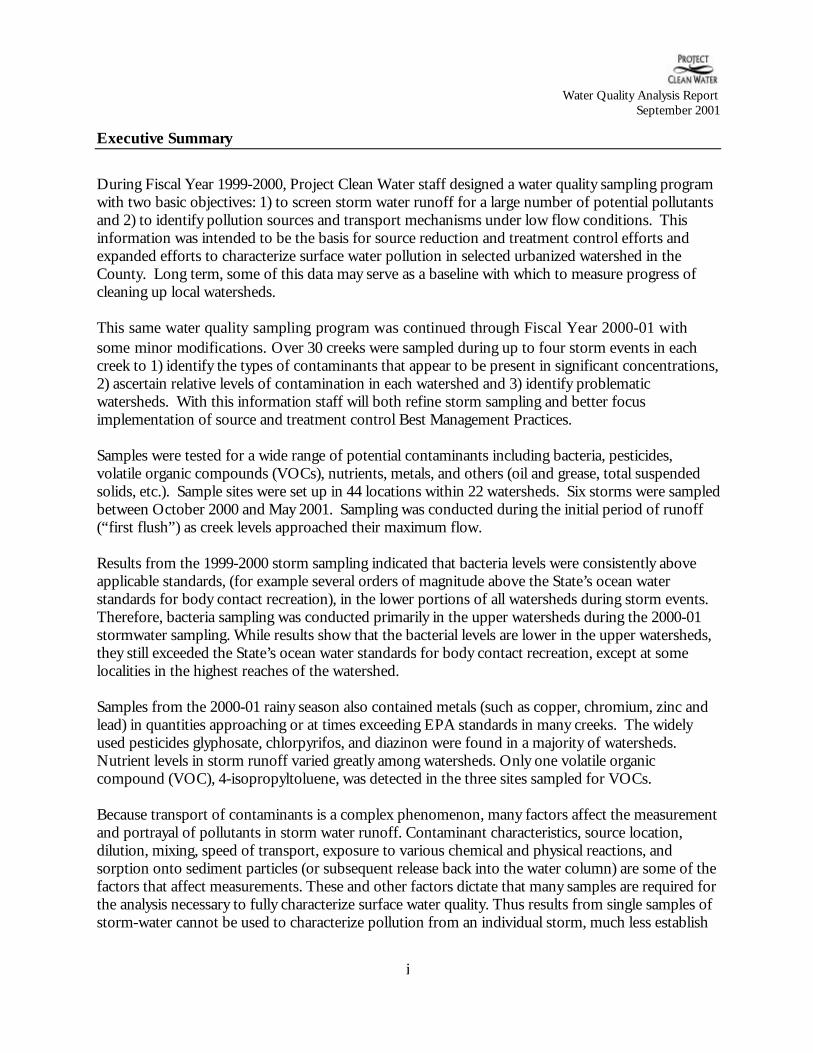
Executive Summary
During Fiscal Year 1999-2000, Project Clean Water staff designed a water quality sampling programwith two basic objectives: 1) to screen storm water runoff for a large number of potential pollutantsand 2) to identify pollution sources and transport mechanisms under low flow conditions. Thisinformation was intended to be the basis for source reduction and treatment control efforts andexpanded efforts to characterize surface water pollution in selected urbanized watershed in theCounty. Long term, some of this data may serve as a baseline with which to measure progress ofcleaning up local watersheds.
This same water quality sampling program was continued through Fiscal Year 2000-01 withsome minor modifications. Over 30 creeks were sampled during up to four storm events in eachcreek to 1) identify the types of contaminants that appear to be present in significant concentrations,2) ascertain relative levels of contamination in each watershed and 3) identify problematicwatersheds. With this information staff will both refine storm sampling and better focusimplementation of source and treatment control Best Management Practices.
Samples were tested for a wide range of potential contaminants including bacteria, pesticides,volatile organic compounds (VOCs), nutrients, metals, and others (oil and grease, total suspendedsolids, etc.). Sample sites were set up in 44 locations within 22 watersheds. Six storms were sampledbetween October 2000 and May 2001. Sampling was conducted during the initial period of runoff(“first flush”) as creek levels approached their maximum flow.
Results from the 1999-2000 storm sampling indicated that bacteria levels were consistently aboveapplicable standards, (for example several orders of magnitude above the State’s ocean waterstandards for body contact recreation), in the lower portions of all watersheds during storm events.Therefore, bacteria sampling was conducted primarily in the upper watersheds during the 2000-01stormwater sampling. While results show that the bacterial levels are lower in the upper watersheds,they still exceeded the State’s ocean water standards for body contact recreation, except at somelocalities in the highest reaches of the watershed.
Samples from the 2000-01 rainy season also contained metals (such as copper, chromium, zinc andlead) in quantities approaching or at times exceeding EPA standards in many creeks. The widelyused pesticides glyphosate, chlorpyrifos, and diazinon were found in a majority of watersheds.Nutrient levels in storm runoff varied greatly among watersheds. Only one volatile organiccompound (VOC), 4-isopropyltoluene, was detected in the three sites sampled for VOCs.
Because transport of contaminants is a complex phenomenon, many factors affect the measurementand portrayal of pollutants in storm water runoff. Contaminant characteristics, source location,dilution, mixing, speed of transport, exposure to various chemical and physical reactions, andsorption onto sediment particles (or subsequent release back into the water column) are some of thefactors that affect measurements. These and other factors dictate that many samples are required forthe analysis necessary to fully characterize surface water quality. Thus results from single samples ofstorm-water cannot be used to characterize pollution from an individual storm, much less establish

Water Quality Analysis ReportSeptember 2001
ii
regulatory standards. As a result, these data are being used as a guide for further characterization ofthe creeks and their pollution sources.
Sampling data were analyzed by County staff and a Technical Advisory Committee. A draft of thisreport was made available to Project Clean Water stakeholders for their input. Recommendationsfor sampling storms during FY 2001-02 include: 1) elimination of testing for contaminants whichwere not detected, 2) adding sampling points in sub-watersheds, 3) sampling alternative storm draindischarges, and 4) continued intense sampling of a ‘pilot’ watershed to explore pollutant loading inthat watershed.
In addition to water chemistry data collected by Project Clean Water, staff has began samplingbenthic macroinvertebrates as a way of measuring the general biological condition of local streams.Data collected this year will serve as a baseline for comparison with information collected duringfuture years. Preliminary data suggest that creek study reaches subject to a high degree of humandisturbance have poor overall water quality.
This entire report can be viewed online at:http://www.countyofsb.org/project_cleanwater/reports_and_studies.htm
Water Quality Analysis ReportSeptember 2001
1
1.0 INTRODUCTION
Project Clean Water, initiated in the fall of 1998, is Santa Barbara County’s programmatic effort toimprove the water quality in local creeks and in the ocean. The program is implemented by stafffrom the Public Works Department and the Public Health Department. Project Clean Water isdriven by public concern over numerous beach advisories and historic closures due to elevated levelsof bacteria. Bacteria levels are measured by weekly ocean-water sampling near the creek outfalls at20 popular local beaches. Creeks and storm-drain outfalls appear to be the major source of bacteriain the nearshore environment. The sampling is conducted year-round under the Ocean WaterMonitoring Program by the County Public Health Department.
As an initial investigation, the South Coast Watershed Characterization Study was conducted in 1998by Project Clean Water staff to characterize the water quality of four south coast streams (URSGreiner Woodward Clyde 1999). This study marked the first major local effort at evaluating baselinewater quality conditions and water quality impacts from storm water runoff and wet weatherconditions. Both dry and wet weather sampling occurred within the watersheds of Arroyo Burro,Mission, Carpinteria, and Rincon Creeks. The most significant water quality parameter that wasconsistently high was the indicator bacteria (total coliform, fecal coliform, and enterococcus groups).
In order to gain a better understanding of the types and extent of pollutants contributed by stormwater and low flow runoff, as well as to address future regulatory requirements (see Section 2.0,Regulatory Setting), Project Clean Water staff designed an expanded program of dry and wetweather sampling for the 1999-2000 season. The sampling program significantly broadened theprevious year's study by adding many more creek sites and water quality parameter measurements,such as volatile organic compounds (VOCs) and various pesticides. In addition, the 1999-2000storm water sampling program focused heavily on collecting samples during the “first flush” of eachstorm event, i.e., during increasing flow due to initial runoff.
The purpose of this sampling effort was to conduct a broad screening of water quality in local creeksin order to ascertain which contaminants are present at significant levels, and which watershedsexhibit consistently higher levels of contaminants. Once this is determined, a more informedapproach can be made in identifying geographic areas (and their associated problematiccontaminants) in need of treatment or source control Best Management Practices .
The 2000-01 water quality sampling program was a continuation of the effort begun during the1999-2000 season. Project Clean Water Staff believe that the information collected, combined withone more year of sampling, will compliment our existing data and make statistical evaluation of theresults more robust.
A description of the methods used and results are presented in this report along with a discussion ofthe findings and recommendations for further study.

Water Quality Analysis ReportSeptember 2001
2
2.0 REGULATORY SETTING
There are two main regulatory programs under which the County must address the quality of surfacewater. These are the National Pollutant Discharge Elimination System (NPDES), and TotalMaximum Daily Loads (TMDLs). Under the Federal Clean Water Act both of these programs areenforced through regulations promulgated by the U.S. Environmental Protection Agency (EPA),and both programs have been delegated to the California State Water Resources Control Board andRegional Water Quality Control Boards.
2.1 NPDES
One of the programs under the federal NPDES regulations addresses storm water discharges. Thestorm water program is divided into two phases. The first phase was promulgated in 1987 andaffected municipalities with populations greater than 100,000 people. Storm water permits for thesemedium to large municipalities, such as the counties of Ventura, Los Angeles, and San Diego, weresubmitted to their respective Regional Water Quality Control Boards in the early 1990s.
Those portions of Santa Barbara County with an urban population of at least 50,000 and apopulation density of at least 1,000 per square mile fall under the Phase II NPDES regulations forsmall municipalities. Additional requirements may, at the discretion of the State Board, be applied tothose areas with at least 10,000 and a population density of at least 1,000 per square mile. Under thePhase II requirements, owners and operators of municipal separate storm sewer systems (“MS4s”)must obtain a storm water permit for discharges into surface waters and must develop a program toreduce pollutant runoff to the maximum extent practicable. The application for this permit, whichmust include Best Management Practices to reduce pollutant runoff into the storm sewer system, isdue to the Regional Water Quality Control Board on March 1, 2003.
There are some differences between the Phase I and the Phase II programs, notably the requirementfor storm water monitoring. Phase I communities are required to conduct storm water monitoring;Phase II communities (at least in the first five years) are not. Nonetheless, a watershed monitoringprogram has been established under Project Clean Water. Although storm water monitoring is not arequirement under NPDES Phase II regulations, this information will be used to define pollutiontypes and sources, guide development of Best Management Practices, and establish currentconditions to gage the success of the long-term goals of Project Clean Water.
2.2 TMDLs
TMDL regulations are contained in Section 303(d) of the Clean Water Act. TMDLs are designatedfor water bodies of the state that have indicated signs of being impaired or impacted for beneficialuses of these waters. The State Water Resources Control Board (SWRCB) with concurrence of theEPA and the Regional Water Quality Control Boards established a listing of all impaired waterbodies. This list is updated every two years. The most recent listing was in 1998.

Water Quality Analysis ReportSeptember 2001
3
This listing is subsequently prioritized based upon known and/or perceived impacts to the beneficialuses of these waterbodies. Santa Barbara County currently has eight listed water bodies for specificpollutants of concern, which are listed in Table 2-1 below.
Table 2-1 Santa Barbara County Section 303(d) Impaired Watersheds
Watershed Beneficial Use ImpairmentArroyo Burro Creek Pathogens1
Rincon Creek Pathogens, sedimentationSanta Ynez River Nutrients, salinity, sedimentsSan Antonio Creek SedimentsGoleta Slough Metals, pathogens, sedimentation, etc.Carpinteria Salt Marsh Nutrients, sedimentation, etc.Mission Creek Pathogens
The TMDL process begins once impaired waterbodies have been established and prioritized. Thetotal amount of pollution that can be discharged to these impaired water bodies (load allocation)from all land use categories in the watershed is determined by the agencies that have jurisdiction inthe watersheds in coordination with the local Regional Water Quality Control Board. From theseload allocations, appropriate water quality standards are established for each beneficial useimpairment identified in the 303(d) list.
Local entities that have jurisdiction over the impacted watershed must develop a formalizedimplementation plan to reduce or eliminate the discharge of these pollutants to levels that meet thepreviously developed water quality standards. Often this means the cooperation of agencies thathave overlapping jurisdiction such as in the Rincon Creek area where both Santa Barbara Countyand Ventura County have jurisdiction over parts of the creek.
Preliminary target dates have been established for the start of the TMDL process for all of thewaterbodies prioritized in the Section 303(d) listing. For Santa Barbara County all impairedwaterbodies are scheduled to begin development of the appropriate water quality standard(s) foreach waterbody by 2006, except for the Santa Ynez River, which is 2003. Full plan developmentincluding establishment of the appropriate water quality standards is to be completed within fiveyears of the target start date. In every watershed but the Santa Ynez River, this will occur by the year2011.
The TMDL process has gained more attention in recent years due to lawsuit judgments that haveforced local jurisdictions such as Ventura and Los Angeles to establish TMDLs more rapidly.
TMDLs are created for individual watersheds that often cross-jurisdictional boundaries and may beoutside of the NPDES permit areas. As such, they offer a unique challenge and opportunity to
1 See Section 4.5.1, Bacteria, for explanation of relationship between pathogens and indicator bacteria

Water Quality Analysis ReportSeptember 2001
4
cooperatively work with all agencies that may be discharging to the local watersheds. BecauseTMDLs have not yet been established in Santa Barbara County, it is difficult to estimate actual costsassociated with specific projects or system components. Nor is it possible to judge their effect onthe scope of Project Clean Water
2.3 Basin Plan Objectives and State Ocean Water Quality Standards
In addition to NPDES and TMDLs, the Regional Water Quality Control Board sets water qualityobjectives to provide the highest quality water reasonably possible (RWQCB 1994). These arepresented in the Water Quality Control Plan, or Basin Plan. The objectives are implemented andenforced through waste discharge permits or NPDES permits. Table A-4 lists those objectives, andTable A-5 shows the applicable designated uses assigned to each watershed. The Basin Plan is alsoimplemented by the Board's support of local programs that help achieve the goals of the Basin Plan.Numeric and narrative objectives are established in the Basin Plan and these objectives are used inthis report to compare with the results of the 2000-01 water quality monitoring data.
The Basin Plan establishes freshwater objectives for fecal coliform for inland surface waters.However, the standards require a minimum number of sampling events within a given time period.Due to the limited number of sampling events spread out over a significant period of time (severalmonths) comparison to these standards was not possible. Therefore, another set of standards is usedto determine creek water quality.
The State Ocean Water Quality Standards2 for bacteria have been established as follows:
Total Coliform – 10,000 MPNFecal Coliform – 400 MPNEnterococcus – 104 MPN
where MPN is the most probable number, describing the statistical concentration of bacteria in 100ml of water. Exceedance of these standards requires the local Health Officer to post warning signsat the beach area where recreational water contact may occur. This same mandate does notcurrently apply to freshwater areas such as creeks, streams and/or freshwater lakes.
2 There is a fourth standard that is a ratio of Total Coliform to Fecal Coliform levels, which was not calculated orutilized, since comparison to individual indicator bacteria standards sufficed for the purposes of this study.

Water Quality Analysis ReportSeptember 2001
5
3.0 METHODS
The major goal of the 2000-01 water quality monitoring program was to evaluate and comparerunoff from all of the urbanized watersheds in the south coast area and to a limited extent in theunincorporated urbanized areas of the north county area. This watershed-based approach focuses onthe overall pollutant contributions from the entire watershed as opposed to pollutant contributionsfrom specific sources or defined land uses. A watershed-based approach was selected for thisprogram in order to maximize the area covered, while minimizing the total number of samplingsites.
3.1 Sampling Overview
Creek water was sampled during both low flow and storm flow conditions. Low flow sampling inthe lower portions of the watershed included some base flow but mostly urban runoff fromnuisance flows (i.e., pavement cleaning, irrigation, car washing, etc.), illicit connections, or non-storm water runoff from adjacent properties.
Storm flow conditions were sampled throughout the south coast and at seven locations in the northcoast. The number of individual watersheds makes the south coast unique, and also difficult tocharacterize. Due to the high cost of laboratory analysis, only one station was monitored for the fullsuite of parameters in most watersheds. One station was usually located at the most downstreampoint in the watershed above tidal influence. (The cost of laboratory services for analyzing the fullsuite of constituents in one sample was approximately $1,000.) Bacteria and other selectedconstituents were collected at additional upstream locations.
3.2 Sample Sites
On the south coast alone, there are over 50 individual watersheds draining to the ocean in SantaBarbara County, about 23 of which drain the urbanized areas from Goleta to Rincon. Sample siteswere selected on all major south coast watersheds within the urbanized portions of the county fromEagle Canyon Creek in western Goleta to Rincon Creek on the border with Ventura County.Sample sites were also selected for north county creeks that drain unincorporated urbanized areas,including Davis Creek in Vandenberg Village and Orcutt Creek in Orcutt. See Table A-1 for a list ofcreeks sampled and Figures A-1 and A-2 for maps of the sample locations.
On the south coast, one site per watershed was sampled as close to the mouth of the creek aspossible (avoiding tidal influence) for a full suite of constituents. In North County, sites werelocated in creeks at the most downstream end of the urbanized areas. Two sites, in Orcutt, weresampled for the full suite of constituents in North County.
In addition to the creek sampling, four storm drains were selected for sampling this year. The siteswere chosen as potential treatment control pilot project Best Management Practice sites. The datacollected will not only help to characterize target pollutants, enabling selection of the proper BestManagement Practice technology, but the data will also act as baseline conditions to evaluateperformance of the Best Management Practice after implementation.
Water Quality Analysis ReportSeptember 2001
6
We also sampled one site on several occasions throughout each storm in an effort to calculatepollutant loading (see section 3.5). The site on Atascadero creek (ATA 030+00), just above thecheck structure at the end of Ward Drive, was chosen because of access to volume (discharge)measurements from the United States Geological Survey.
The sampling program also included bacteria and other selected constituents-only sampling sites.These sampling sites therefore reflect smaller areas within each creek’s watershed and may in somecases partially reflect storm water runoff from certain land uses, such as agriculture or residential.
A total of 44 sites were sampled countywide, of which 29 sites were sampled for the full suite ofconstituents. Note that not all sites were sampled during low flow conditions, or for all stormevents. Table A-1 describes the type and amount of sampling which occurred at each site.
3.3 Sample Collection
The south coast contains a relatively large number of small watersheds, and thus grab samples weredetermined to be the most cost-effective use of resources for this year’s expanded program. Theadvantage of grab samples is they can be collected over a large area with a minimum of field crew.The disadvantage is that they represent a single snapshot of water quality at one instant during astorm. In contrast, composite samples combine smaller samples throughout the storm into onesingle, more representative sample. However, composite samples still only provide a snapshot of thetremendous amount of water that passes through a creek during a storm, and require additionalmanpower by repeated sampling of the same site or automatic samplers, both of which wereunavailable during the 2000-01 season.
Since the goal of the 2000-01 program was to continue characterizing the types and, in selectedwatersheds, the extent, of pollutants within the south coast watersheds, it was desired to collect datarepresenting the maximum concentrations or the maximum range of pollutants within the creeks. Itwas assumed that the most pollutants would be observed in the creeks during the rising limb of thecreek hydrograph, i.e., during the period when the water levels in the creek are rising or at their peak.Every effort was made to capture samples during peak runoff in the creek, although many factorsaffect the timing of peak runoff. Variability due to permeable surfaces (pavement, etc), orographiceffects, saturation of soils, and limitations in predicting peak flow and mobilizing personnel over awide area to collect the samples are some of the factors.
PCW staff made up the core group of samplers with support from additional County employees andvolunteers to make up the necessary numbers of samplers. For safety and efficiency reasons,samplers were divided into teams of two. Ideally, a minimum of seven teams (14 samplers) wouldbe sent out into the field. With seven sampling teams, samples could be collected from all locationswithin 2 to 3 hours. However, 14 samplers were not always available. As a result, a fewer numberof teams were sent into the field for some of the sampling events. This increased the overallsampling time to a maximum of 4 hours per team.
At the Atascadero loading site, we had originally planned to take samples for all constituents everyhour during sampled storms. This would allow us to capture pollutants on the rising and falling
Water Quality Analysis ReportSeptember 2001
7
limbs of the hydrograph. However, this sampling method turned out to be logistically difficult andsamples were taken when the opportunity arose.
3.4 Analysis Performed
Numerous water quality analytes (128 total) were chosen based upon previous storm water qualityassessments in the southern California area (SCWCS 1998, SCCWRP 1996), analytes required to bemonitored by Phase 1 communities under their NPDES permit conditions, and pollutants that maybe present in the Santa Barbara south coast area. General categories of constituents include bacteria,pesticides, VOCs, metals, nutrients and other constituents (such as total suspended sediments andoil and grease). The constituents (not including bacteria) are shown in Table A-2. Table A-3 showsthe EPA method used in processing the constituents, and their associated lab cost.
See Section 4.2, Storm Sampling Results, for a description of the storms that were sampled. Noanalytes were dropped throughout the 2000-01 storm sampling program.
Each category of analytes is briefly discussed below.
3.4.1 Bacteria
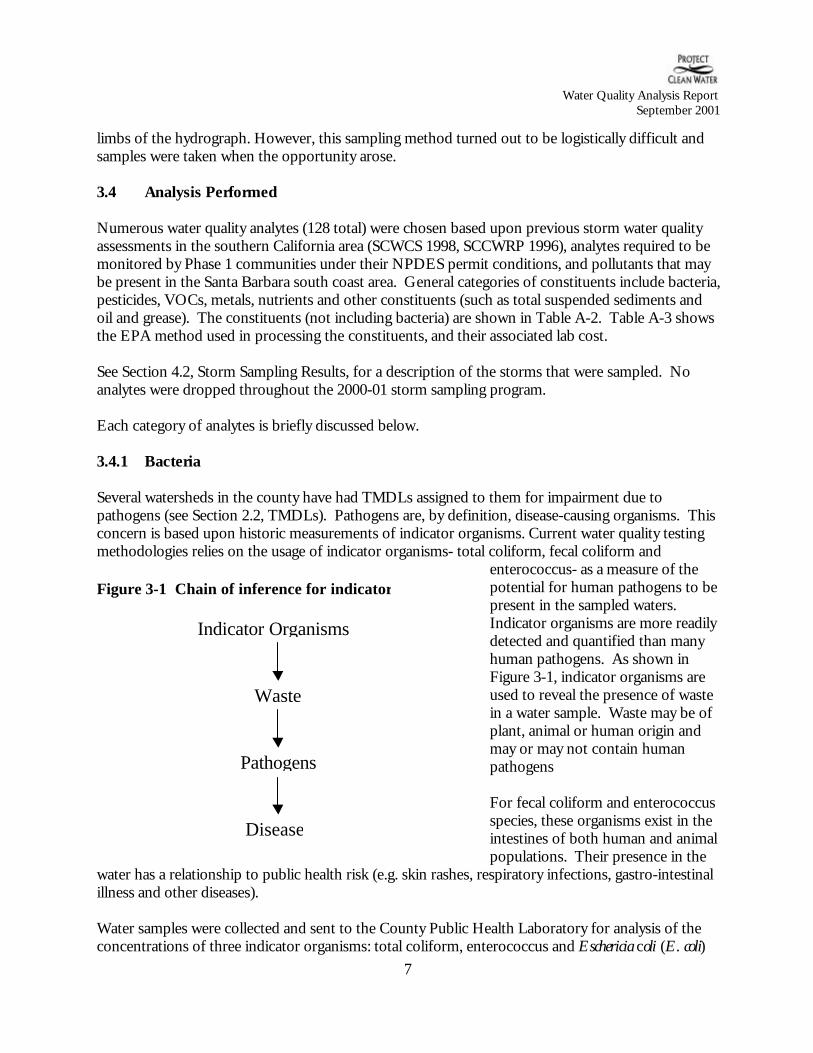
Several watersheds in the county have had TMDLs assigned to them for impairment due topathogens (see Section 2.2, TMDLs). Pathogens are, by definition, disease-causing organisms. Thisconcern is based upon historic measurements of indicator organisms. Current water quality testingmethodologies relies on the usage of indicator organisms- total coliform, fecal coliform and
enterococcus- as a measure of thepotential for human pathogens to bepresent in the sampled waters.Indicator organisms are more readilydetected and quantified than manyhuman pathogens. As shown inFigure 3-1, indicator organisms areused to reveal the presence of wastein a water sample. Waste may be ofplant, animal or human origin andmay or may not contain humanpathogens
For fecal coliform and enterococcusspecies, these organisms exist in theintestines of both human and animalpopulations. Their presence in the
water has a relationship to public health risk (e.g. skin rashes, respiratory infections, gastro-intestinalillness and other diseases).
Water samples were collected and sent to the County Public Health Laboratory for analysis of theconcentrations of three indicator organisms: total coliform, enterococcus and Eschericia coli (E. coli)
Indicator Organisms
Waste
Pathogens
Disease
Figure 3-1 Chain of inference for indicatororganisms

Water Quality Analysis ReportSeptember 2001
8
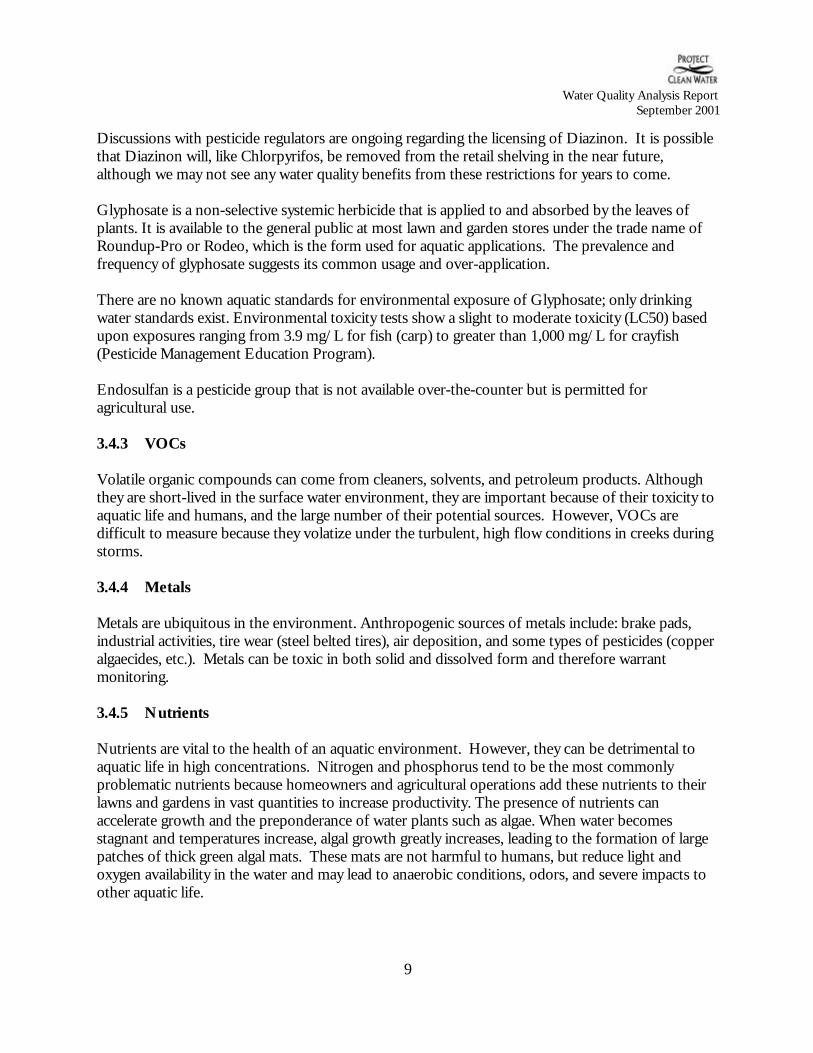
bacteria. Figure 3-2 below displays the relationship between total coliform, fecal coliform, and E.coli. E. coli bacteria is the most prevalent form of fecal coliform bacteria. This species normallycomprises approximately 85-95% of the fecal coliform that may be present in water sample. Onceagain, the vast majority of E. coli bacteria are not human pathogens and in most cases are beneficialto humans by aiding in digestion of food. One subspecies of E. coli (0157:H7) is pathogenic. Thispathogenic E. coli has been involved in several foodborne illness outbreaks.
Figure 3-2 Schematic Showing Relationship Among Bacteriologic Indicators
3.4.2 Pesticides
Pesticides include all chemicals used to control “pests” of any sort, including herbicides, algaecides,fungicides, and rodenticides. These chemicals are used by homeowners and commercial operationsto control weeds, ants, termites, and harmful garden bugs, among other things.
The presence of these chemicals, particularly chlorinated pesticides, are being monitored because oftheir toxicity to aquatic life and humans. Several pesticides are described in more detail below.
Chlorpyrifos, an organophosphate pesticide, is sold under several trade names, but the mostcommon is Dursban. Chlorpyrifos made headlines two years ago as the EPA and the manufacturerreached an agreement to cease manufacturer’s retail distribution prior to December 2000 and allproduct sales by December 2001 due to increasing evidence of aquatic toxicity at very lowconcentrations. Dursban is used for professional as well as non-professional applications, for thecontrol of ants, fleas, and termites.
Diazinon is often used by homeowner’s to combat ant infestations. Diazinon has been shown to betoxic to aquatic life at very low levels, often below the normal detection limits of testing laboratories.
Total Coliform
Fecal Coliform
E. coli
Water Quality Analysis ReportSeptember 2001
9
Discussions with pesticide regulators are ongoing regarding the licensing of Diazinon. It is possiblethat Diazinon will, like Chlorpyrifos, be removed from the retail shelving in the near future,although we may not see any water quality benefits from these restrictions for years to come.
Glyphosate is a non-selective systemic herbicide that is applied to and absorbed by the leaves ofplants. It is available to the general public at most lawn and garden stores under the trade name ofRoundup-Pro or Rodeo, which is the form used for aquatic applications. The prevalence andfrequency of glyphosate suggests its common usage and over-application.
There are no known aquatic standards for environmental exposure of Glyphosate; only drinkingwater standards exist. Environmental toxicity tests show a slight to moderate toxicity (LC50) basedupon exposures ranging from 3.9 mg/L for fish (carp) to greater than 1,000 mg/L for crayfish(Pesticide Management Education Program).
Endosulfan is a pesticide group that is not available over-the-counter but is permitted foragricultural use.
3.4.3 VOCs
Volatile organic compounds can come from cleaners, solvents, and petroleum products. Althoughthey are short-lived in the surface water environment, they are important because of their toxicity toaquatic life and humans, and the large number of their potential sources. However, VOCs aredifficult to measure because they volatize under the turbulent, high flow conditions in creeks duringstorms.
3.4.4 Metals
Metals are ubiquitous in the environment. Anthropogenic sources of metals include: brake pads,industrial activities, tire wear (steel belted tires), air deposition, and some types of pesticides (copperalgaecides, etc.). Metals can be toxic in both solid and dissolved form and therefore warrantmonitoring.
3.4.5 Nutrients
Nutrients are vital to the health of an aquatic environment. However, they can be detrimental toaquatic life in high concentrations. Nitrogen and phosphorus tend to be the most commonlyproblematic nutrients because homeowners and agricultural operations add these nutrients to theirlawns and gardens in vast quantities to increase productivity. The presence of nutrients canaccelerate growth and the preponderance of water plants such as algae. When water becomesstagnant and temperatures increase, algal growth greatly increases, leading to the formation of largepatches of thick green algal mats. These mats are not harmful to humans, but reduce light andoxygen availability in the water and may lead to anaerobic conditions, odors, and severe impacts toother aquatic life.

Water Quality Analysis ReportSeptember 2001
10
The nitrogen cycle is normally driven by nitrogen fixing bacteria in the soil. Ammonia, oftendeposited as animal waste, is oxygenated to nitrites and further to nitrates. In an oxygenatedenvironment, nitrites are short-lived.
3.4.6 Other Constituents
Other constituents sampled for include turbidity, total suspended solids, hardness, specificconductance, oil and grease, and total recoverable petroleum hydrocarbons, among others. Whilemany of these physical parameters are expected to be present and may not be toxic in the aquaticenvironment, their concentrations may be indicative of other problems, or useful for generalcharacterization of the creek.
Hardness is a measure of the level of dissolved carbonates in the water column. Geologicalformations in this area (mainly lime and sandstone formations) are easily degraded by water. As aresult, most ground and surface water displays fairly high hardness in the range of 300-500 mg/L.
Specific conductance can help to determine the degree of tidal influence at a given sample point,since higher levels of specific conductance indicate higher concentrations of salinity.
The presence of high concentrations of total suspended solids can be attributed to sediment runofffrom the development of the watershed or from construction sites, erosion on the banks and creekbed due to increased flow rates.
Total Organic Carbon (TOC) and Biological Oxygen Demand (BOD) are indicators of biologicalactivities within the watersheds. Elevated TOC indicates an abundance of organic (most likelyvegetative) materials. Elevated organic materials often lead to an increase of organisms that work tobreak down these materials (e.g. bacteria, insects, etc.). This degradation activity puts a “demand”on the supply of oxygen in the water. Left unchecked, with an ongoing supply of organic materials,the oxygen supply in the watershed will ultimately drop and the watershed fauna may becomeimpacted due to this reduction.
3.5 Changes to Sampling Program
3.5.1 Water Chemistry Analysis
We made several modifications to the 2000-01 sampling program based upon our discussions withthe TAC and evaluation of last year’s sampling program.
Because dissolved metals are used to measure aquatic toxicity standards, total metals were droppedand replaced with dissolved metals. Last year, the total metal data was converted into dissolvedmetal data using an EPA conversion equation in order to compare to the toxicity criteria. Resultsindicated relatively high levels of dissolved metals, often exceeding the chronic toxicity criteria. Thisyear, that conversion will not be necessary. Some select stations located in the upper portions of thewatershed were tested for both total and dissolved metals in order to 1) understand the relationshipbetween the two fractions and confirm last year’s conclusions, and 2) determine background levelsoriginating from natural sources.
Water Quality Analysis ReportSeptember 2001
11
We discontinued testing for Methyl Blue Activated Substances (MBAS). MBAS is an indicator ofsoaps and detergents and is often used to detect sanitary sewer leaks. We dropped this constituentbecause there are many sources of MBAS aside from sanitary sewer leaks (e.g., car washing) and itwas detected in most creeks from last year’s data. Based on local experience, we feel MBAS is abetter analyte for low-flow conditions where sanitary waste is suspected.
Last year’s data showed that volatile organic compounds (VOCs) were typically low or non-detectable. Volatile compounds tend to dissipate in rapidly flowing creeks under storm conditions.Therefore, we dropped VOCs for most creeks and will now rely on Total Recoverable PetroleumHydrocarbons and oil and grease as indicators of the presence of petroleum products that containVOCs. We continued testing for VOCs this year at Bell Canyon and Arroyo Burro Creeks since theyexhibited relatively high levels of these constituents last year.
Also, chlorinated pesticides were typically low or non-detectable in most creeks last year. This classof pesticides has become less commonly used than other pesticides. However, since chlorinatedpesticides were detected in Santa Monica Creek on more than one occasion last year, we continuedtesting chlorinated pesticides at lower Santa Monica Creek (SM 061+00). We also added anadditional site along upper Santa Monica (SM 088+00) creek to better determine source areas.
Four entirely new sites at storm drain outfalls were added. These sites were or still are underconsideration as potential treatment control pilot project Best Management Practice3 project sites.These sites are located at Carneros Creek (Robin Hill Road), San Jose Creek (North Kellogg),Atascadero Creek (South Turnpike Connector), and Carpinteria Creek (6 th Street). As opposed to thecreek sampling sites, this data shows direct urban runoff undiluted by creek flows.
The indicator bacteria tests were discontinued at most sites during storm sampling because resultsfrom the South Coast Watershed Characterization Study and last year’s Project Clean Watersampling effort were consistently very high and additional testing seemed unnecessary. Bacteriatesting will be continued at 303(d)-listed creeks and other creeks of concern (Carpinteria, ArroyoParedon, Arroyo Burro and Atascadero Creeks). In addition, several bacteria-only sites were addedat upstream locations to determine the bacteria levels that are introduced upstream of the urbanizedareas.
Finally, we sampled Atascadero Creek (AT 030+00) throughout the storms to reflect pollutantloading. Our goal was to collect samples during the rising limb, at the apex, and during the fallinglimb of the creek hydrograph, to the extent practicable. This effort, in conjunction with thecollection of flow volume data, will help us to track the variability of water quality within the creekthroughout the storm event. Four discreet samples were collected at the Atascadero site during theOctober 26, 2000, storm, and three discrete samples were collected during the remaining storms(January 8, 2001, January 24, 2001 and April 6, 2001).
3 Under a state grant, the County will install urban runoff treatment control Best Management Practices to treatstormwater runoff. Four sites were sampled to generate baseline information.

Water Quality Analysis ReportSeptember 2001
12
3.5.2 Biological Monitoring
To augment water chemistry data, Project Clean Water staff conducted biological monitoring usingthe Environmental Protection Agency’s Rapid Bioassessment Protocols for Use in Streams and WadeableRivers (1999). Our goal is to continue the monitoring over several years to evaluate the ecologicalhealth of and track changes in south-county urbanized streams. Data collected this year will be usedas a baseline for monitoring in future years. Twelve representative sites were selected forcomparison of urbanized-impacted reaches with relatively undisturbed reaches. Sites were selectedalong Carpinteria (2), Gobernador (1), San Jose (3), Atascadero (2), Arroyo Burro(2), San Onofre(1), and Arroyo Hondo (1) Creeks.
Study and comparison of the selected creeks will provide a better understanding of their physicaland biological conditions, and how they are influenced by the various natural and human-inducedfactors. Specifically, this program has been developed to answer the following questions:
• What range of physical and biological conditions are characteristic of relatively undisturbed,pristine local creeks?
• What physical and biological impacts have resulted in local creeks due to various types andintensities of human development including agriculture, suburban, and urban?
• Which land uses, activities, and water pollutants are most harmful to creek ecosystems?
Field surveys were conducted between the dates of May 17, 2001, and June 1, 2001, to evaluate thephysical and biological conditions present at each study reach. Field work conducted at each studyreach included plant and wildlife surveys, collection of three BMI samples from the creek bed,mapping, photography, and measurement of several parameters (e.g., stream flow, temperature, pH,conductivity, and riparian corridor width). In addition, a semi-quantitative creek habitat assessmentwas conducted using a protocol developed by the EPA. The EPA protocol involves visualassessment and numeric scoring of the physical habitat present at the study reach.
Research is being conducted determine numerous physical parameters for each of the study reaches,including watershed area, elevation, gradient, upstream creek channel length, stream order, andwatershed land use types (e.g., open space, agriculture, residential, commercial, industrial, etc.) andpercent cover, respectively.
Laboratory work is being conducted to process BMI samples collected during the field surveys.This involves the random selection and identification of 100 BMIs from each sample (300 per studyreach) to the lowest practicable taxonomic level (typically genus). Quality control measures arebeing implemented to ensure random selection and accurate, consistent identification of BMIs.Preliminary processing and identification of the BMI samples is complete. Quality control isunderway.
Quantitative and qualitative analysis will be conducted to assess relationships between biologicalmetrics (e.g., BMI diversity, proportion of disturbance-sensitive taxa, etc.), physical factors (e.g.,watershed area, gradient, water quality, etc.), and measures of human disturbance (e.g., percent ofwatershed disturbed, habitat assessment scores, etc.). Quantitative statistical methods including
Water Quality Analysis ReportSeptember 2001
13
linear regressions and analysis of variance (ANOVA) will be used to establish the strength of theserelationships, and whether they are statistically significant. The use of statistical methods willprovide greater scientific validity to the conclusions of the analysis.
The Annual Program Report will be prepared to more fully describe the purpose of the biologicalmonitoring, study watersheds, and bioassessment methodology, and to present all data gatheredduring field and laboratory work, results of the data analysis, and recommendations for future work.
3.6 Precipitation and Storm Tracking
Based upon local experience, samples were collected following a minimum rainfall of at least 0.25inches within a period of several hours. Amounts less than this or distributed over a longer durationwere not expected to generate sufficient runoff to mobilize pollutants. Also, storm water runoff wasnot sampled if more than 0.25-inch of rain occurred within the previous three days. Antecedent dryconditions of at least three days prior to storm water monitoring is common practice among thePhase I regulated communities, such as Ventura County (Ventura County 1999). Allowing sufficientantecedent dry conditions is thought to maximize the build-up of pollutants and subsequent fluxmeasured in the runoff.
Each storm is unique in the quantity and intensity of rain, so weather data was closely tracked todetermine the best time to initiate sampling. Due to the variation in rainfall within the watershedssampled, sampling was occasionally initiated at a point when some areas received more than 0.25inches while other areas did not. Every attempt was made to collect data from a storm that deliveredat least 0.25 inch to the entire south coast and/or north coast area.
Historical average annual rainfall for the south coast area is approximately 18 inches per year (basedon period from September 1 to August 31, and an average of data since 1868). Rainfall varies greatlyfrom year to year, with a standard deviation of 8.17 inches. (SB County Flood Control 1999).During the 2000-01 storm sampling season, 25.97 inches of rainfall fell in downtown Santa Barbara.
Weather data available on the Internet from various sources including satellite imagery, radar, andmodeling was used to forecast storm events. For real-time data, the County maintains acomprehensive flood warning system, the Automated Local Evaluation in Real Time (ALERT)network, that provides rainfall and stream flow gage data. This network is used to determine when,where, and how much rainfall has occurred. Figure B-1 show the location of rainfall and streamgauges throughout the county
Cumulative precipitation during the 2000-01 monitoring season is shown for one station (SantaBarbara #545) in Figure B-2. Hourly precipitation during the monitored storms is shown in FiguresB-3 through B-6.
3.7 Sampling QA/QC
Project Clean Water staff developed an extensive quality assurance/quality control plan for fieldsampling. A sampling protocol document was created (Appendix E) and a preliminary trainingsession was held for the County staff members and volunteers that would be participating in the
Water Quality Analysis ReportSeptember 2001
14
sampling. The individuals were composed of Project Clean Water staff, Environmental HealthServices staff, and volunteers. As mentioned above, for certain sampling events not all of thesetrained individuals could participate in the sampling events. At no time was a sample team createdthat did not have at least one trained sampler. Volunteers or less experienced samplers were pairedwith experienced samplers that performed on-site training during the collection process.
All sample bottles were labeled, handled and transported following the developed protocols. Chainof custody forms identified sample locations, date and time of collection, samplers and time ofdelivery to testing laboratory and/or transfer to laboratory technicians for transport to testinglaboratories. Bacteria analyses were conducted at the Santa Barbara County Public HealthLaboratory, while all other analyses were sent to Zymax Envirotechnology laboratory in San LuisObispo. The Public Health Laboratory is certified by the State of California’s EnvironmentalLaboratory Accreditation Program and Zymax is certified by the State of California’s Department ofHealth Services.
Field duplicates were not taken due to the higher lab cost of processing and previouslydemonstrated reliability of analysis in the South Coast Watershed Characterization Study (1998).Blanks were not included in the shipment of samples to the labs, again due to the high lab cost ofprocessing the constituents. Each laboratory performed QA/QC procedures according tocertification criteria.

Water Quality Analysis ReportSeptember 2001
15
4.0 RESULTS & DISCUSSION
Table A-4 shows the Practical Quantitation Limit (PQL) and any known standard or objective foreach constituent. The PQL is the lowest level that the lab is confident of reporting. Therefore, anull result means that the constituent was not detected or the lab was not confident of the valuebecause it was at or below the PQL.
Zymax would often report different PQLs for the same constituent and the same storm for differentsites. Zymax would also report the same PQL for a constituent for each site for one storm, andthen the PQL would change to a new value for the same constituent for each site for a differentstorm. The variation in PQLs was due to turbidity and subsequent dilution of samples. Therefore, ifthe PQL changed over the course of the four storms sampled for the full suite of constituents, thenthe range of PQLs was provided in Table A-4.
4.1 Low Flow Sampling
Samples were collected prior to and during the winter storm season at storm drain sites thatcontained flow. Bacteria levels under low flow conditions were consistently lower than bacterialevels for storm water runoff. The same is generally true for all other parameters. Selected Zymaxresults are shown in Table 4-1 below.
Table 4-1. Selected Low-Flow Sampling results
2000-01 Low Flow Sampling 2000-01 Storm SamplingConstituent Results
(# of Detections)# of Non-Detections Min. Avg. Max.
Chlorpyrifos 7 0.00004 0.00030 0.00290Demeton 7 -- -- --Diazinon 0.00008, 0.00023 (2) 5 0.00004 0.00042 0.00840Malathion 7 0.0001 0.0002 0.0007Parathion 7 -- -- --Glyphosate 0.014 (1) 6 0.009 0.034 0.160Ammonical Nitrogen 0.1-0.4 (5) 1 0.1 0.4 1.8Nitrate as Nitrogen 1, 1.3 (2) 4 0.5 4.8 24Nitrite as Nitrogen 6 0.5 0.5 0.5Phosphate as P 6 1.1 1.9 2.7Total Kjeldahl Nitrogen 0.5-1.3 (6) 0.5 2.6 13.0Total Phosphorus 0.16-0.4 (6) 0.02 1.20 8.40
4.2 Storm Sampling Results
Although each site was only to be sampled four times, samples were taken during six storms, asdescribed above, due to differing rainfall in the north and south county. South county sites weresampled October 26, 2000, January 8-10, 2001 (sites not sampled on the 8th were sampled on the10th), January 24, 2001 and April 6-7, 2001. North county sites were sampled January 24, 2001,February 9, 2001, April 6-7, 2001, and April 20, 2001. After each sampling event, the sites were
Water Quality Analysis ReportSeptember 2001
16
reevaluated to determine whether they were still appropriate in terms of safety, accessibility and tidalinfluence. No sites were dropped during the 2000-01 season.
As discussed above, grab samples were collected at or before the peak runoff. The results of thetiming of each storm, stream hydrographs, precipitation data, and time of sample collection is shownin Appendix B. Samples were collected during the first few hours of the storm runoff whenexpected pollutant loads would be at their highest. Sampling during this period is sometimes referredto as the "first flush", a time when pollutants are initially mobilized, especially from imperviousareas, and runoff is most concentrated. This differs from the timing of storm water sampling thatwas conducted in the 1998 South Coast Watershed Characterization Study, where sampling oftenoccurred several hours following the peak runoff.
Preliminary analysis of the results reveals high levels of bacteria in the creeks (up to 25 times theState’s Ocean Water Advisory level). Metals were also detected in many creeks at levels approachingor, in a few cases, exceeding basin plan standards. Nitrogen and phosphorus were found in all creekswith highest levels found in agriculturally dominated watersheds. A limited number of VOCs weredetected in some creeks. Pesticide results indicate that glyphosate and diazinon were present in amajority of the creeks.
Tables C-1 and C-2 summarize results from 2000-01, while Table C-3 compares these results to1999-2000. In addition, graphs have been prepared showing data for all storms and all constituentsthat appeared in the results (Appendix C). All graphs are labeled from west to east according to thesite numbers listed in Tables A-1a-c and shown in Figures A-2a-c. Appendix D shows the samefigures for the Atascadero loading site.
4.3 Summary of Findings
Described below are the findings observed from this year’s storm water sampling, presented bycategories of constituents. For each category, a table is provided (Tables 4-1 through 4-7) whichshows a summary of the results presented in Appendix C.
Although some geographic and temporal trends were observed and some constituents were found inrelatively higher concentrations compared to regional and national criteria and objectives, the datadiscussed below represent only two years of sampling. Therefore, the data may not necessarily bestatistically significant or representative. It is not apparent from these results that any watershedstood out dramatically from the rest as having unusually high concentrations for contaminantsduring a majority of the storms.
4.3.1 "First Flush" Pollutant Loading
In some areas it has been found that the first storms of the season transport a relatively high load ofpollutants, and that subsequent storms may transport somewhat less. Previous national evaluationssuch as the National Urban Runoff Program (NURP) study (EPA 1983 Results of the Nationwide UrbanRunoff Program, Volume 1- Final Report) as well as more localized studies (Marsalek, J. 1990“Evaluation of Pollutant Loads from Urban Nonpoint Sources” Wat. Sci. Tech. 22(10/11):23-30)have shown this correlation between elevated pollutant concentrations and the “first flush,” or the
Water Quality Analysis ReportSeptember 2001
17
first rain of the season. The first flush usually occurs in areas where a long dry period is followed byconsistent and frequent rains. During the dry period, pollutants build up on impervious surfaces andare subsequently washed off during the rain, diminishing in concentration as the rainy seasonprogresses. In fact, NPDES Phase I regulated communities are required to sample storm waterrunoff during the first three storms of the season in order to characterize the maximum pollutantconcentrations expected. Although investigators have demonstrated the accuracy of this assumptionin many regions of the country, they are not well-defined in southern California (SCCWRP 1996).This is probably due to long periods of dry weather and pollutant accumulation between storms.
Some Santa Barbara County data (e.g., biochemical oxygen demand, dissolved zinc) exhibited higherconcentrations of pollutants in the first storm vs. later storms, whereas for some pollutants (e.g.,dissolved mercury and total suspended solids), concentrations appeared higher in the later storms.For example, a comparison of Diazinon levels in Atascadero Creek over three sampling periods, thesecond and third sampling events showed higher concentrations than the first sampling event.Carpinteria Creek on the other hand had higher levels of the pesticide in the first event and lowerlevels in subsequent events. In this case, it is possible that seasonal use of pesticides and/orfertilizers may be reflected by these results.
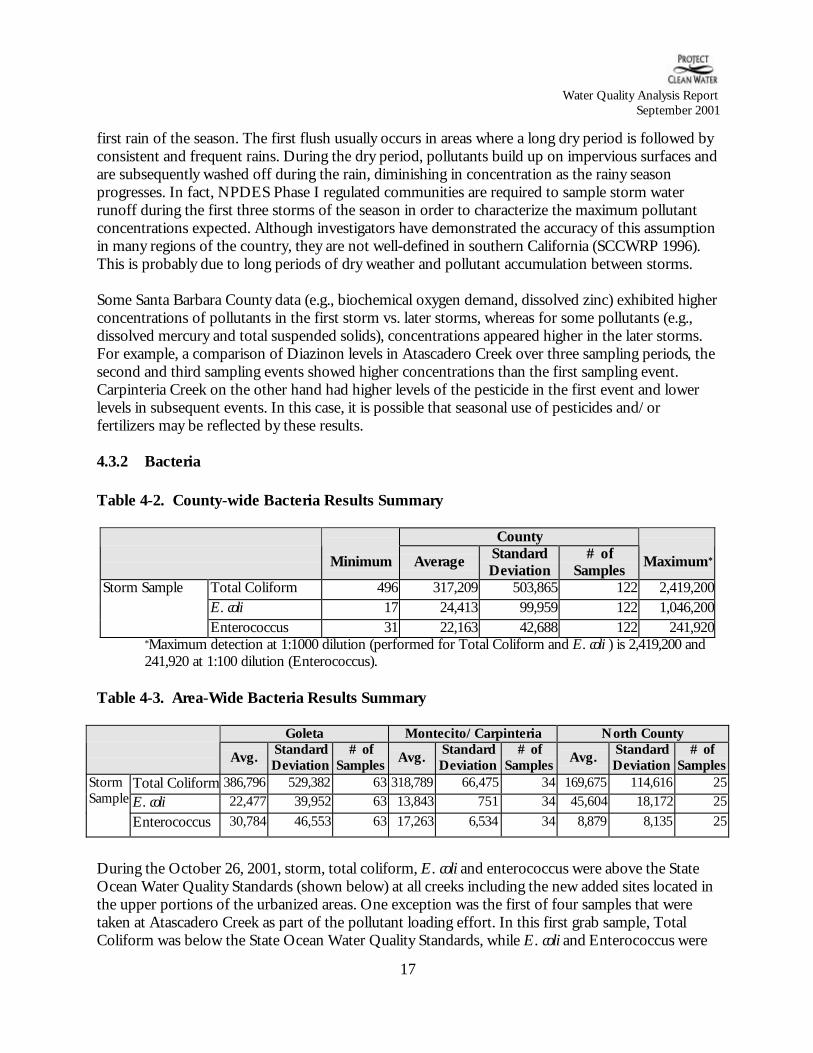
4.3.2 Bacteria
Table 4-2. County-wide Bacteria Results Summary
County
Minimum Average StandardDeviation
# ofSamples Maximum*
Total Coliform 496 317,209 503,865 122 2,419,200E. coli 17 24,413 99,959 122 1,046,200
Storm Sample
Enterococcus 31 22,163 42,688 122 241,920*Maximum detection at 1:1000 dilution (performed for Total Coliform and E. coli ) is 2,419,200 and241,920 at 1:100 dilution (Enterococcus).
Table 4-3. Area-Wide Bacteria Results Summary
Goleta Montecito/Carpinteria North County
Avg. StandardDeviation
# ofSamples Avg. Standard
Deviation# of
Samples Avg. StandardDeviation
# ofSamples
Total Coliform 386,796 529,382 63 318,789 66,475 34 169,675 114,616 25E. coli 22,477 39,952 63 13,843 751 34 45,604 18,172 25
StormSample
Enterococcus 30,784 46,553 63 17,263 6,534 34 8,879 8,135 25
During the October 26, 2001, storm, total coliform, E. coli and enterococcus were above the StateOcean Water Quality Standards (shown below) at all creeks including the new added sites located inthe upper portions of the urbanized areas. One exception was the first of four samples that weretaken at Atascadero Creek as part of the pollutant loading effort. In this first grab sample, TotalColiform was below the State Ocean Water Quality Standards, while E. coli and Enterococcus were

Water Quality Analysis ReportSeptember 2001
18
above these standards. All indicator bacteria in the subsequent three samples at this site were aboveState Ocean Water Quality Standards.
During the second storm on January 8, 2001, results from nine tests were below State Ocean WaterQuality Standards, although no site passed all three criteria. Things took a turn for the worse onJanuary 24, 2001, when only five sites were below State Ocean Water Quality Standards for E. coli.During the last storm in which samples were taken along the South Coast and in North County,results from seven tests were below State Ocean Water Quality Standards; again, no site passed allthree criteria. Only one site, Gobernador (GO 080+00) on Jan. 8, 2001, passed with respect to StateOcean Water Quality Standards for enterococcus.
In an effort to better determine the background levels of bacteria coming into the urbanized areas,Project Clean Water staff sampled the uppermost accessible section of Cold Springs Creek (near theTangerine Falls) during a February 24, 2001, storm. The results from this sample passed the StateOcean Water Quality Standards for all the indicator bacteria. These results, combined withbackground samples taken in the past, indicate that the bacteria counts quickly rise with exposure tourban impacted creek stretches.
• Bacteria results were by far the most consistent. Previous studies (SCWCS, SCCWRP 98 BightDry and Wet Weather studies, ongoing monitoring by the ocean water monitoring program)have shown that stormwater runoff greatly increases the amount of bacterial in the creeks andsubsequent transport to the ocean. Comparison of this sampling period’s dry weather samplingto wet weather sampling shows, on average, 1 to 2 orders of magnitude increase in the bacteriallevels during wet weather events. In most of the watersheds tested during dry weather,background levels of total coliform and enterococcus were at or exceeding current ocean waterstandards. Recreation 1 standards contained in the Basin Plan cannot be used for comparisonpurposes with this year’s data because the sampling frequency and patterns do not meet thecriteria for statistical evaluation as spelled out in the Basin Plan for recreational water contactareas.
4.3.3 Pesticides
Table 4-4. County-wide Pesticide Results Summary
Minimum Average Maximum StandardDeviation
# ofDetections
Glyphosate 0.009 0.034 0.160 0.029 674,4'-DDT 0.00004 0.00004 0.00004 0 1Endosulfan I 0.00004 0.00009 0.00017 0.00007 3Endosulfan II 0.00005 0.00008 0.00011 0.00003 1Endosulfan sulfate 0.00004 0.00007 0.00011 0.00004 3Chlorpyrifos 0.00004 0.00030 0.00290 0.00055 30Diazinon 0.00004 0.00042 0.00840 0.00120 65Malathion 0.0001 0.0002 0.0007 0.0002 16

Water Quality Analysis ReportSeptember 2001
19
• The number of detections of pesticides increased dramatically this year from last year.
• Detections and exceedances of chlorpyrifos and malathion were generally more frequentlydetected, but not always in higher concentration, during the first part of the rainy season. This isespecially true for western Goleta creeks
• The temporal variation exhibited by chlorpyrifos and malathion was absent with diazinon.
• Although 4-4’-DDE was detected last year, it was not detected this year. However, 4,4’-DDTwas detected this year in one creek on one occasion (SM 061+00 on October 26, 2000).
• The California Office of Environmental Health Hazard Assessment has developed a PublicHealth Goal of 1.0 mg/L for glyphosate in drinking water, whereas the federal EPA haspublished a maximum contaminant level of 0.7 mg/L for glyphosate in drinking water. TheRegional Water Quality Control Board has set water quality objectives for glyphosate in drinkingwater at 0.7 mg/L. Last year, the maximum value observed during the storm events sampled was0.57 mg/L, which occurred in Carpinteria creek on November 8, 1999. This year, the maximumvalue observed was 0.16 mg/L, which occurred in Carneros creek on October 26, 2000.
4.3.4 VOCs
• The number of detections of VOCs was lower, but this can be attributed to the fact that thenumber of tests for these constituents was greatly reduced.
4.3.5 Metals
Table 4-5. County-wide Metal Results Summary
Minimum Average Maximum StandardDeviation
# ofDetections
Arsenic 0.05 0.05 0.05 0 1Chromium 0.01 0.02 0.03 0.01 5Copper 0.01 0.03 0.47 0.06 63Lead 0.013 0.014 0.015 0.001 2Mercury 0.00009 0.00043 0.00110 0.00025 32Nickel 0.01 0.02 0.09 0.02 13Zinc 0.01 0.09 0.33 0.09 71
• The number of detections of dissolved metals showed no particular pattern compared to lastyear; some were detected more often, others less often, and some approximately the samenumber of times. Thus, overall trends for metals were difficult to ascertain other than for thegroup as a whole. Results indicate earlier storms liberated more metals into the creeks than laterstorms. For example, of the 71 detections of dissolved zinc, almost one-third of thesedetections occurred during the first storm of the year.

Water Quality Analysis ReportSeptember 2001
20
• Almost every watershed normally sampled for metals displayed some level of metals present inthe water samples collected. The only watershed that did not have any metals detected was MariaYgnacio (MYW 158+00).
• As shown in Tables C-1 and C-2, metals exceeded standards more than any other constituent(besides bacteria). With increased detection capabilities and the ability to better observeenvironmental impacts, standards have become more restrictive. As an example, the EPA GoldBook standard (1986) indicates a chronic standard for Copper as 0.12 mg/L. Recent revisionsto the EPA Aquatic Toxicity Standards indicate that this standard has been revised to 0.009mg/L. Although these standards are not currently part of the NPDES permit/programrequirements, they may be incorporated in new or renewal permits or as part of the TMDLprocess.
4.3.6 Nutrients
Table 4-6. County-wide Nutrient Results Summary
Minimum Average Maximum StandardDeviation
# ofDetections
Ammonical Nitrogen 0.1 0.4 1.8 0.3 78Nitrate as Nitrogen (NO3-N) 0.5 4.8 24 5.2 94Nitrite as Nitrogen (NO2-N) 0.5 0.5 0.5 0 1Phosphorus as Phosphorus (PO4-P) 1.1 1.9 2.7 0.6 10Total Phosphorus 0.02 1.19 8.4 1.56 110Total Kjeldahl Nitrogen 0.5 2.6 13 2.0 103
• The number of detections of nutrients during this year’s sampling were generally the same asthose from last year.
• Many nutrients are found in all creeks and at all times of the year.
• Nitrate as nitrogen was found in much higher concentrations in creeks influenced by agriculturalrunoff.
• In the three watersheds with an upper and lower site (Orcutt, Santa Monica, and Carpinteria),detections were more frequent and in higher concentration at the downstream site (e.g.,ammonical nitrogen, nitrate, Total Kjeldahl Nitrogen, and total phosphorus).
Water Quality Analysis ReportSeptember 2001
21
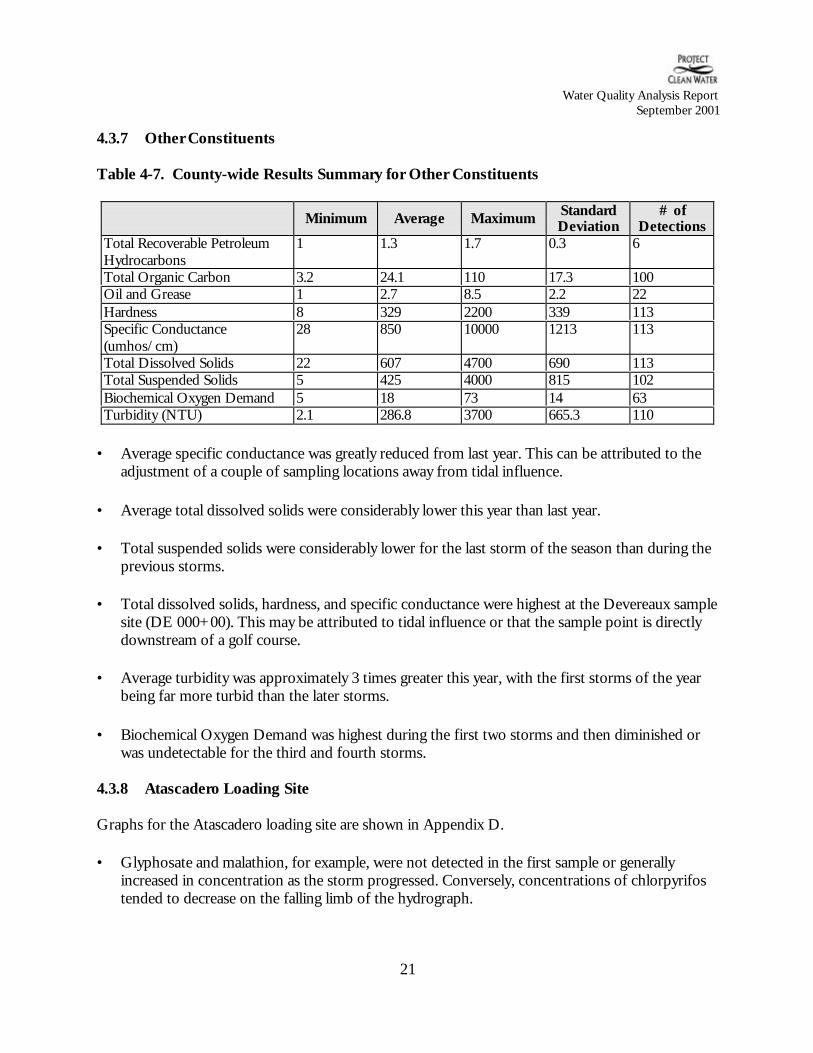
4.3.7 Other Constituents
Table 4-7. County-wide Results Summary for Other Constituents
Minimum Average Maximum StandardDeviation
# ofDetections
Total Recoverable PetroleumHydrocarbons
1 1.3 1.7 0.3 6
Total Organic Carbon 3.2 24.1 110 17.3 100Oil and Grease 1 2.7 8.5 2.2 22Hardness 8 329 2200 339 113Specific Conductance(umhos/cm)
28 850 10000 1213 113
Total Dissolved Solids 22 607 4700 690 113Total Suspended Solids 5 425 4000 815 102Biochemical Oxygen Demand 5 18 73 14 63Turbidity (NTU) 2.1 286.8 3700 665.3 110
• Average specific conductance was greatly reduced from last year. This can be attributed to theadjustment of a couple of sampling locations away from tidal influence.
• Average total dissolved solids were considerably lower this year than last year.
• Total suspended solids were considerably lower for the last storm of the season than during theprevious storms.
• Total dissolved solids, hardness, and specific conductance were highest at the Devereaux samplesite (DE 000+00). This may be attributed to tidal influence or that the sample point is directlydownstream of a golf course.
• Average turbidity was approximately 3 times greater this year, with the first storms of the yearbeing far more turbid than the later storms.
• Biochemical Oxygen Demand was highest during the first two storms and then diminished orwas undetectable for the third and fourth storms.
4.3.8 Atascadero Loading Site
Graphs for the Atascadero loading site are shown in Appendix D.
• Glyphosate and malathion, for example, were not detected in the first sample or generallyincreased in concentration as the storm progressed. Conversely, concentrations of chlorpyrifostended to decrease on the falling limb of the hydrograph.
Water Quality Analysis ReportSeptember 2001
22
• Based upon the relatively small amount of flow in Atascadero on January 24, 2001, it appearsthat many dissolved metals do not appear in low flows, at least not above the PracticalQuantitation Limits (detection limits) offered by Zymax.
• Specific conductance and total dissolved solids tapered off as the storm progressed.
4.3.9 Treatment Control Pilot Project (TCPP)
For most constituents, the Best Management Practice sites were no worse than non-BestManagement Practice sites with the following exceptions:
• Dissolved zinc was detected in 15 of the 16 samples taken at these sites. This percentage ofdetection is greater than the average for other non-Best Management Practice sites.
• The North Kellogg site had a significantly greater BOD than other Best Management Practiceand non-Best Management Practice sites. Also, BOD was detected at the 6th Street site duringthe last storm and not at any other Best Management Practice or non-Best Management Practicesites.
• Oil and grease was detected in 9 of the 16 samples taken at these sites. This percentage ofdetection is greater than the average for other non-Best Management Practice sites.
4.3.10 Benthic Macroinvertebrate Sampling
The locations of the 12 Program study reaches are shown in Figures F-1 to F -4. Preliminaryphysical and biological data produced thus far is provided in Table F-1. It is important to realizethat the data set provided in Table 1 is incomplete and preliminary, and, especially in the case of theBMI data, is subject to change based on the results of the quality control efforts that are underway.Nevertheless, based on a cursory analysis of the preliminary data, it appears that there are strongrelationships between human disturbance, water quality and BMI community diversity andcomposition in the study creeks.
In general, it appears that creek study reaches subject to a high degree of human disturbance havepoor overall water quality as indicated by elevated conductivity, and support BMI communities oflow diversity that are almost completely dominated by disturbance-tolerant taxa such as true flies(Order Diptera) from the families Chironomidae and Simulidae, and non-insects such as gastropods(snails), copepods, and oligochaete worms. This is especially the case for study reaches with asubstantial proportion of urban (i.e., commercial and industrial) development in their watersheds,and those that have been subject to a great deal of creek bed and bank alterations and loss ofriparian vegetation e.g. such as AT-1, AT-2, AB-1, C-1 and C-2). Conversely, creek study reachesthat are relatively undisturbed by human development have good overall water quality as indicatedby lower conductivity, and support diverse BMI communities including numerous disturbance-sensitive taxa such as caddisflies (Order Trichoptera), stoneflies (Order Plecoptera) and mayflies(Order Ephemeroptera).
Water Quality Analysis ReportSeptember 2001
23
Thus far, the preliminary data appears to be consistent with what was expected at the outset of thisstudy, and with the results of several similar studies that have been completed in other parts of thestate and country. A full analysis, including statistical testing, will be undertaken immediately afterthe data is complete and finalized. The results of the data analysis will be presented in theconsultants’ report.

Water Quality Analysis ReportSeptember 2001
24
5.0 RECOMMENDATIONS
The storm-water quality data obtained in FY 1999-2000 and 2000-01 was developed in part to be thebasis for more focused sampling in subsequent years. Since very little was previously known aboutthe characteristics of the County’s urban runoff prior to last year's sampling effort, results fromthese first two full seasons of water quality testing have established a baseline and provided ascreening-level evaluation of overall water quality in local creeks.
Staff recommends that the sampling program of 2001-02 be continued with modifications that takeadvantage of additional resources while maintaining some continuity so as to develop a sufficientdata base upon which to guide measures to improve water quality within our community.
Recommendations developed by staff and by the County's Technical Advisory Committee on WaterQuality Sampling for the 2001-02 season are presented below. County staff will evaluate the cost andresources necessary to implement these recommendations as appropriate.
• Send field duplicates of a percentage of selected samples to another laboratory for QA/QCpurposes.
• Study one creek and/or one storm in greater detail. Focus down to level of TCPP sites, sub-watersheds, and/or storm drains. Staff has selected San Jose creek to assess relative input ofpollutants from various land uses.
• Discontinue testing at Vandenberg Village due to likelihood that this community will not beincluded in the County’s Phase II permit.
• Discontinue bacteria sampling at Orcutt 2 and 3. The catchments above these sites drain anagricultural field and a golf course, respectively. As such, they are not good indicators of the typeand quantity of bacteria contained in urban stormwater.
• Discontinue testing at the two Best Management Practice sites (North Kellogg and Robin HillRoad) ranked lower by the consultant (Geosyntec). Add sampling site at Bella Vista open space(Devereaux creek) to generate baseline data for a potential treatment control pilot project BestManagement Practice site.
• Drop total metals at all sites.
• Continue benthic macroinvertebrate sampling.
Below are suggestions that should be considered for future programs, or as suggestions for academicstudies.
Water Quality Analysis ReportSeptember 2001
25
• Conduct a pilot study to determine a spatial distribution of pollutants as measured across a crosssection of flow. (This would help establish the variability of water quality in flowing streams,thus providing a basis of estimating sampling error.)
• Consider adding bioassay tests for toxicity, while keeping all other potentially toxic compoundssuch as metals and pesticides. (This would help establish the relationship of measured pollutantsand environmental effects.)

Water Quality Analysis ReportSeptember 2001
26
6.0 REFERENCES
EPA 1983. Results of the Nationwide Urban Runoff Program, Volume 1- Final Report
EPA 1986. “Goldbook” Quality Criteria for Water.
EPA. 1999. National Recommended Water Quality Criteria-Correction (EPA 822-Z-99-001).
Haile, R. W., Witte, J. S., Gold, M., Cressey, R., McGee, C., Millikan, R. C., Glasser, A., Harawa, N.,Ervin, C., Harmon, P., Harper, J., Dermand, J., Alamillo, J., Barrett, K., Nides, M. & G.-Y.Wang. 1999. The health effects of swimming in ocean water contaminated by storm drainrunoff. Epidemiology. 10: 355-363.
Marsalek, J. 1990. “Evaluation of Pollutant Loads from Urban Nonpoint Sources” Wat. Sci. Tech.22(10/11):23-30
Noble, R. T., Dorsey, J. H., Leecaster, M., Orozco-Borbon, V., Reid, D., Schiff, K. & Weisberg, S.B. 2000. A regional survey of the microbiological water quality along the shoreline of thesouthern California Bight. Environ. Monit. Assess. 64.
Pesticide Management Education Program, Cornell University. http://pmep.cce.cornell.edu/profiles/ herb-growthreg/ fatty-alcohol-monuron/ glyphosate/ herb-prof-glyphosate.html
RWQCB (Regional Water Quality Control Board). 1994. Water Quality Control Plan.
Santa Barbara County Flood Control District. 2000 . Precipitation Report
SCCWRP 1998. Bight Study.
SCCWRP. 2000. Estimates Of Mass Emissions to the Southern California Bight. (draft).
URS Greiner Woodward Clyde. 1998. South Coast Watershed Characterization Study - AnAssessment of Water Quality Conditions in Four South Coast Creeks. Prepared for Countyof Santa Barbara Public Health Department.