radio engineering microwave radio 1.1-ghz...
TRANSCRIPT
BELL SYSTEM PRACTICES
AT&TCa Standard
SECTION 940-384-100
Issue 1, August 1978
I
RADIO ENGINEERING
MICROWAVE RADIO
11 -GHz SYSTEMS
ENGINEERING
CONTENTS PAGE
1. INTRODUCTION . . . . . . . - .
A. General . . . . . . . . . .
B. FCC Rules . . . . . . . . .
C. 11-GHz Propagation . . . . . .
D. Synopsis . . . . . . . . . .
2. FREQUENCY AND CHANNEL GROWTH
PLANS . . . . . . ..-. . .
A. Frequency Plans . . . . . . .
B. Channel Growth Plans for Analog
Systems . . . . . . . . . .
C. Channel Growth Plans for Digital
Systems . . . . . . . . . .
D. Channel Growth Plans for Combined
Systems . . . . . . . . . .
3. SYSTEM CHARACTERISTICS INFLUENCING
PERFORMANCE . . . . . . . . .
A. General . . . . . . . . . .
B. System Gain..... . . .
C. Section Lass . . . . . . . . .
D. Cross-Polarization Discrimination (XPD)
Characteristics . . . . . . . .
4. OVERVIEW OF OUTAGE CALCULATIONS .
2
2
2
2
3
4
4
4
9
9
10
10
10
12
17
20
GUIDELINES
NOTICE
CONTENTS
A. General . . . . . . .
B. Analog Systems . . . .
C. Digital Systems . . . .
5. SYSTEM OUTAGE OBJECTIVES .
A. Annual Objectives . . .
B. 11-GHz Apportionment . .
6. OUTAGE DUE TO RAIN . . .
A. General . . . . . . .
B. Fade Margin for SPF Systems
C. Fade Margin for DPF Systems
D. Rain Outage Charts . . .
7. OUTAGE DUE TO
A.
B.
c.
D.
E.
F.
General .
Fade Margin
. . . .
PAGE
. . . 20
. . . 20
. . . 20
. . . 21
. . . 21
.,. 21
. . . 21
. . . 21
. . 21
. . 23
. . . 23
MULTIPATH FADING . 24
. . . . . . . . . 24
for SPF Analog Systems
. . . . . . . . . 25
Multipath Fade Margins for SPF and
DPF Digital Systems . . . . . . 25
Outage per Hop, (Nondiversity) . 25
Outage per Hop, DPF Systems . . 25
Space and Frequency Diversity
Improvements . . . . . . . . 26
Not for use or disclosure outside the.. — Bell System except under written agreement
Printed in U.S.A.
t
Page 1

SECTION 940-384-100
-------- --————----- --CONTENTS PAGE
8. OUTAGE DUE TO EQUIPMENT FAILURE . 28
A. General . . . . . . . ...28
B. Caicuiation . . . . . . . . . 29
9. SUMMATION AND CALCULATION OF
OUTAGE . . . . . . . . . . .30
A. Introduction and System Description . 30
B. Procedure . . . . . . ...30
10. INTERFERENCE CONSIDERATIONS . . . 34
A. Overview and
B. Identification
Interference
Definitions . . . . 34
and Characteristics of
. . . . . . . . . 35
C. Allocation of interference . . . . 37
D. Interference Budgets . . . . . . 37
E. Fade Margin Adjustments . . . . 42
F. Digital Into Analog Interference . . 45
11. TRADEOFFS AND ANCILLARY TOPICS . 46
A. Antenna Tradeoffs . . . . . . 46
B. Received Signal Power limitations . 46
C. Use of Passive Repeaters . . . . 46
D. Omission of Radomes . . . . . 47
1. INTRODUCTION
A. General
1.01 This section provides guidelines essential tothe engineering of 11-GHz microwave radio
routes. Coverage includes both analog radio systemsusing a single polarization per frequency (otherwiseknown as SPF operation) as well as digital radiosemploying cochannel or dual polarization perfrequency (DPF) operation. Channel widths ofboth 20 and 40 MHz are covered. While analogsystems are always SPF, digital systems can be
Page 2
- --- -. —.. .. .operated either SPF or DPF. Digital radio systemswith SPF characteristics have bit rates of 80 to90 megabits when applied to 40-MHz wide 11-GHzchannels. Digital radio systems with DPFcharacteristics have bit rates of 40 to 45 megabitson each of two polarizations available in a 40-MHzwide channel. The total capacity per frequency isthe same in both cases, being equal to or slightlyless than two DS-3 signals or 1344 voice frequencycircuits.
1.02 Whenever this section is reissued, the reasonfor reissue will be indicated in this paragraph.
1.03 These guidelines are independent of specificsystems and are applicable to any equipment
capable of satisfying the performance criteria hereinestablished. In addition to related and necessaryfacts, concepts, and methodology, major topicsinclude:
1. Frequency and channel growth plans
2. Rain and multipath outage
3. Overall system reliability calculations
4. Interference considerations.
B. FCC Rules
1.04 This section accords with FCC Rules andRegulations Part 21, covering Point-to-Point
Microwave and Local Television Transmission RadioServices.
C. 11-GHz Propagation
1.05 In terms of its application to microwavetransmission systems, the 11-GHz band
occupies a transitional area between frequenciesprimarily affected by multipath outage, and frequenciesat which outages contributed by rain and fog becomethe overriding concern. At frequencies of 4 and 6GHz, rain attenuation is negligible, and outagecaused by selective fading over the relatively longhop lengths can be effectively offset by space orfrequency diversity techniques. On the other hand,at frequencies of 18, 29, and 40 GHz, the shorthops dictated by rain attenuation preclude selectivefading. In the 11-GHz band, rain can be a significantcause of propagation outage. Here, however, hopscan be sufficiently long to experience multipathphenomena, thus 11-GHz design must take both

I
1SS 1, SECTION 940-384-100
sources of outage into consideration. In contrastto selective fading, there is no compensatorytechnique applicable to the blanket attenuationcaused by rain—the only recourse is to restrict hoplength. Thus hop lengths in 11 GHz will frequentlybe rain limited.
1.06 Under DPF operation, the effects of bothrain and multipath go beyond simple selective
or nonselective attenuation, as each can causedepolarization of the transmitted wave. Theresultant loss of cross-polarization (XPD) discriminationcan result in serious cochannel interference in DPFdigital installations. Here, a 2-dB penalty (reductionof the fade margin) is allowed for rain causeddepolarization, while the DPF multipath fade marginmust be limited to approximately 30 dB, as fadedepths beyond this level can be expected to causethe bit error rate to exceed the error thresholdof 10-3. The multipath fade margin in SPF digitalinstallations must also be restricted to 30 dB.With SPF, the offending mechanism is notdepolarization, but results from increased sensitivityto the dispersive effects of multipath fades. Thisarises from the increased vulnerability of the SPF8-level PSK signal to multipath effects as comparedto the 4-level signal used in DPF operation.
D. Synopsis
1.07 The emphasis of this section is directed tofactors which determine system reliability,
i.e., the determination of anticipated outage resultingfrom rain, multipath, and possible equipment failure.Following the topic of frequency allocations andchannel growth plans which follows this introductionin Part 2 of this section, Part 3 discusses systemparameters and characteristics which are of pertinentsignificance in determination of system performance.Included here are definitions of system gain andsection loss which are necessary in the initialcalculation of the hop fade margin. The fademargin, which will vary according to equipmentparameters and path length, is necessary todetermination of propagation outages. This fademargin, as initially calculated from system parameters,is unrealistically high in not as yet having beenadjusted (truncated) to account for the degradationscontributed by rain, multipath, and interference.Hence, prior to the calculation of outage, reducedor “practical” fade margins for rain and multipathwill be separately evolved (in Parts 6 and 7),permitting the outagereali~tically evaluated.
.—
contributed by each to be
..
1.08 In Part 4, the topic of outage calculation isbegun with an overview which deals in large
measure with differences between analog and digitalsystems. Part 5, which follows, defines andestablishes the system outage objectives. Since,in addition to multipath and equipment failure,rain outage is significant at 11 GHz, previousapportionments between multipath and equipmentfailure are abandoned in favor of a more flexibleapproach. The topic of rain outage is the subjectof Part 6. The factors necessary to the renditionof practical rain fade margins for SPF and DPFsystems are covered. The adjusted margins,together with hop length, are applied to a rainoutage chart which yields outage time in minutesper year for horizontal and vertical polarizations.A 4-hop system is then used to demonstrate overallrain outage determination.
1.09 Following in logical order, Part 7 coversmultipath outage. Differences between SPF
and DPF systems are again emphasized, andappropriate fade margins are described. SinceXPD degradation and resultant cochannel interferencewill affect DPF outage, conventional equations areinadequate, and DPF outage is determined via anoutage chart. Part 7 concludes with calculationsnecessary to determination of improvements inoutage time available from the application of spaceand frequency diversity.
1.10 The final source of outage, equipment failure,is treated in Part 8, while Part 9 provides
a summary demonstration serving to integrate andsolidify the previous concepts and methodology.The same 4-hop system which appeared in Part 6is again applied to a summation of outage from allcauses. Outage times prior to and following spacediversity improvement are calculated.
1.11 The final major topic to be considered, inPart 10 of this section, deals with the
development of interference budgets and thecomputation of the fade margin interference penaltyfor SPF and DPF light and heavy route digitalsystems. The effect of interference on a regenerativedigital system will differ from previously documentedanalog systems. Tentative budgets are evolvedfor both rain and multipath fades, following whichinterference penalties are calculated.
1.12 As improved knowledge and additionalinformation regarding 11-GHz operation is...- .. . . -
Page 3

SKTION 940-384-100
gaine~, a@tions. an~ments to this._sectioncan” be” anticipated.
2. FREQUENCY AND CHANNEL GROWTH PLANS
A. Frequency Plans
2.01 11-GHz radio systems use the frequencyassignments that originated with TJ and TL
microwave radio. These assignments are the sameas recommended by the CCIR (ConsultativeCommittee, International Radio), although thenumbering and channel pairing differ. Table Agives the frequencies and the corresponding TLand CCIR channel numbers. The channels designatedP and J make up the so called “regular” plan,while those designated D and E comprise the“alternate” plan.
2.o2 At a given radio station, transmitters arein one half of the band, and receivers are
in the other half. A high-low station is one inwhich the receivers are in the upper half-band,and the transmitters are in the lower half-band.In a low-high station, the situation is reversed.Figures 1 and 2 respectively illustrate the 40-MHzregular and alternate frequency plans. The transmitterand receiver associated with the same 2-way channelin the same hop always use the same polarizationand make up a channel pair. (For example,transmitter llJ and receiver 12P serving the hopaccessed from the left of Fig. 1 both use Pv) Itshould be noted that PI and P2 are opposite(orthogonal) polarizations, as are P, and P,. Solong as this criterion is met, the assignment ofvertical or horizontal polarization is arbitrary, henceactual H and V designations are not specified.Beyond this, the need for adjacent channels servinga common hop to be on opposite polarizations isspecified by the channel groupings as in Tables C,D, and E. Examination of Fig. 1 and 2 revealsthat the same frequency is used to transmit inboth directions, i.e., the same channel pair is usedin both directions, comprising what is known asthe 2-frequency plan. In older systems, wherefrequency stability was not very high, the samefrequency could not be transmitted in both directionsfrom a given station, necessitating the previous4-frequency plan. In this plan, separate channelpairs were used in each direction. Strict separationof transmitted frequency was required due to thepossibility of slight deviations from nominal transmitterfrequency giving rise to “single frequency”interference. This interference, resulting from
heterodyne tones as high as- s$veralwas capable of appearing m the active
megahertzl- . .part of the
disturbed channel baseband. With modern highstability systems, the same frequency can betransmitted in both directions at any station. Sincethis type of operation uses less frequency spectrumon a given route, 2-frequency operation is preferred.
2.03 The channel pairings recommended for analogor digital systems which operate on a
2-frequency plan are shown in Table B for bothregular and alternate plans. These pairings havebeen selected to minimize interference betweentransmitters and receivers in the same antennawaveguide. This interference is the result of thirdorder intermodulation products (A+B-C) and (2A-B)which are generated in the nonlinearities of metalliccontacts and surfaces of the common waveguiderun by the strong transmitter signals. Productpowers ranging from -60 dBm to less than -120 dBmhave been measured at receiver inputs. Thealternate plan of Table B contains one less channelpair than the regular plan. The deleted channelsare 9D and 5E which, as shown in Table A, arelocated at the interface of the high and lowhalf-bands and are separated by only 50 MHz. Forthis reason, they cannot be used on the sameantenna. If separate transmitting and receiving(simplex) antennas are used however, both of thesechannels can be used. Regular plan channels 4Pand 2J cannot be used for any signals having abandwidth greater than 30 MHz, as these channelsare only 15 MHz from the edges of the 11-GHzcommon carrier band. Thus, for digital systemsusing duplexed antennas, both regular as well asalternate plans provide only eleven 2-way channels.
B. Channel Growth Plans for Analog Systems
2.04 Table C shows the recommended growthplan for 40-MHz 12-channel analog systems
using the regular or alternate frequency plans.Again, as in Table B and as explained above,channels 9D and 5E are excluded from the alternateplan configuration. The chosen channel pairing issuch that the intermodulation tones are 30 MHzaway from the received channel carriers, and aretherefore well suppressed by the channel filtering.The channels are segregated into two groups whichare assigned opposite polarization. In this manner,adj scent channelreducing adjacent
frequencies are cross-polarizedchannel interference.
Page 4
I

1SS 1, SECTION 940-384-100
— --
TABLE A
11-GHz FREQUENCY PLAN
FREQUENCY TL CHANNEL CCIR CHANNEL
MHz DESIGNATORREG ALT
DESIGNATOR
REG ALT REG ALT
11,685* 2J* 12’*
11,665— 2D 12’11,645 3J 11’
11,625 3D 11’
11,605 6J 10’11,585 6D 10’
11,565 7J 9’11,545 7D 9’
11,525 10J— 8’11,505 10D 8’
11,485 llJ. 7’11,465 llD 7’
11,445 4J . 6’11,425 4D 6’
11,405 lJ 5’11,385— lD 5’
11,365 8J 4’11,345 8D 4’
11,325 5J – 3’11,305 5D 3’
11,285 12J 2’11,265 12D 2’
11,245 9J 1’11,225 9D 1’
11,175 5E **
11,155 5P 1211,135 8E 12
11,115 8P 1111,095 9~ 11
11,075 9P 1011,055 12~ 10
11,035 12P 911,015 3~
10,995 3P 810,975 2~
10,955 2P 710,935 7~
10,915 7P- 610,895 6~
10,875 6P 510,855 11~
10,835 11P 410,815 lo~
10,795 10P 310,775 1~
10,755 lP- 210,735 4~
10,715* 4P~ 1*
* These channels may not have an emlsslon designator greater than 30,000F.**Not defmed by CCIR
-.
9
8
7
6
5
4
3
2
Page 5

SECTION 940-384-100
~.-. ..- ~. .-. .. -----
POLARIZATION
PI Pa P3 P,
11700 r 1 , ,
1
NOTE: PI M P2, ALSOP3AKI P4 AREOIFFEREN’iPOLNUZATI~
1—Two-Frequency, 40-MHz, 11-GHz Regular Frequency Plan (Low-High Repeater Shown)
Page 6
,

1SS 1, SECTION 940-384-100
POLARIZATION
PI P2 P3 P,
._
1l-m I 1
“=%T7’’’’E=--’E=A
--r-m--/’ “!l .1--’ 4I I
7E
~,6E -------
1lE
----$=1
:1’
,i
\II
I 10E
10,,5 w -’17a-9
loma
NOTE: PI ~ P2, ALSOP3 Ml P, AREDIFFERENTPOLARIZATIW
Fig. 2—Two-Frequency, 40-MHz, 11-GHz Alternate Frequency Plan (low-High Repeater Shown)
..” -= --- .’ - -
Page 7

SECTION 940-384-100
CHANNEL PAIRINGS
REGUIAR PLAN
LOWER
BAND
HALP
1P
2P
3P
4P
5P
6P
7P
8P
9P
10P
11P
12P
uPPERBAND
HALP
2J
lJ
4J
3J
6J
5J
8J
7J
10J
9J
12J
llJ
REGULARPLAN
ALTERNATEPLAN
ALTERNATE PLAN
LOWER
BAND
HALP
lE
2E
3E
4E
6E
7E
8E
9E
10E
llE
12E
UPPER
BAND
HALP
lD
2D
3D
4D
6D
7D
8D
5D
10D
llD
12D
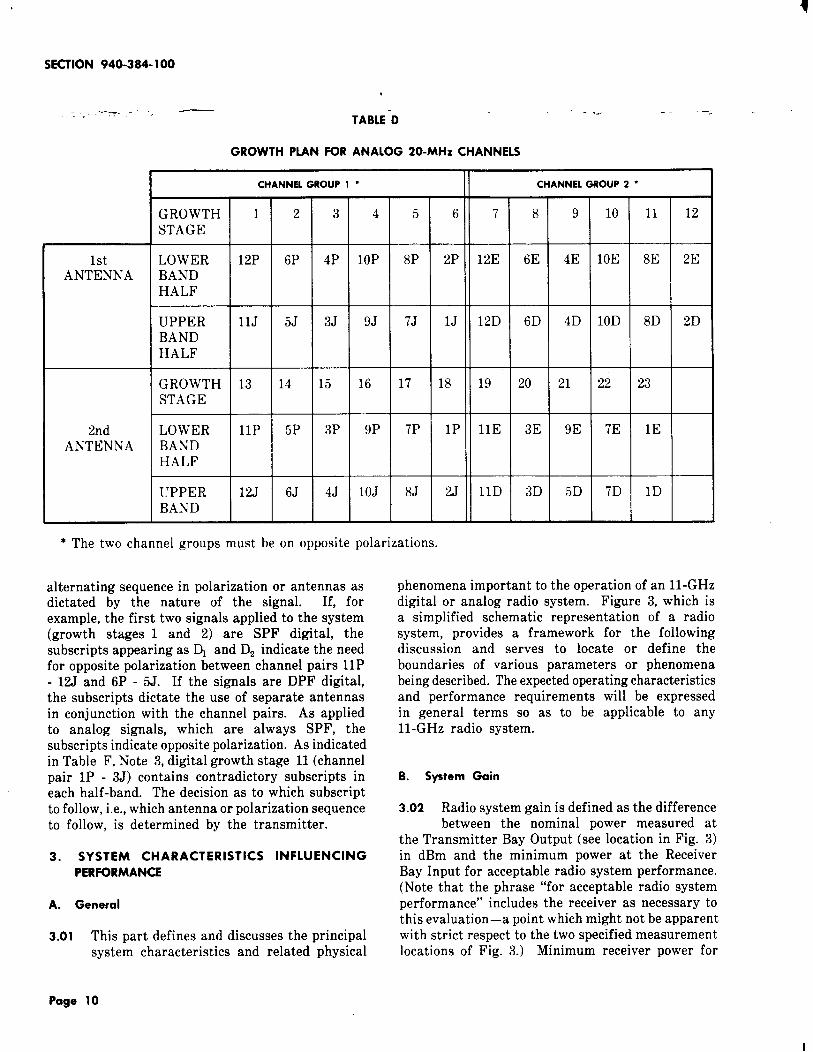
2.OS Table D provides the gro~ plan forsystem% - -using 23 channels available from the combined
regular and alternate frequency plans. Therecommended procedure is to install the first sixregular channels on one polarization and the firstsix alternate channels on the opposite polarization.Then, a second antenna is used for the remainingchannels with regular channels using the samepolarization as on the first antenna, and alternatechannels using the other polarization. A secondantenna is necessary to avoid the intermodulationproducts which can be generated in the commonwaveguide run by the transmitters. For properoperation of a 23-channel 20-MHz system, theadj scent regular and alternate channels must beon opposite polarization. Again, as with the12-channel system, the assignment of the alternatechannels to group 2 serves this purpose. Therecommended protection channel selection is growthstage 2 (channels 6P and 5J, or 6E and 6D) forlxN systems, and stage 2 and stage 5 (channels8P and 7J, or 8E and 8D) for 2xN systems. Otherselections of protection channels may be used, butfor 2xN systems, the protection channels shouldbe separated by at least 160 MHz to maximize theeffect of frequency diversity.
TABLE C
GROWTH PLAN FOR ANALOG 40-MHZ CHANNELS
2
6P
5J
6E
6D
3
4P
3J
4E
4D
4
10P
9J
10E
10D
5 6 7
8P 2P 11P
7J lJ 12J
8E 2E llE
8D 2D llD
CHANNEL GROUP 2 ●
8
CHANNEL GROUP I ●
GROWTH 1STAGE
LOWER 12PBANDHALF
UPPER llJBANDHAI.F
LOWER 12EBANDHALF
UPPER 12DBANDHALF
5P
6J
3E
3D
9
3P
4J
9E
5D
10
9P
10J
7E
7D
11 12
7P 1P
8J 2J
lE
lD
* The two channel groups must be on opposite polarizations.
Page 8

1SS 1, SECTION 940-384-100
C. Channel Growth Plans for Digital Systems
2.06 The recommended frequency growth planfor digital systems is shown in Table E.
This plan is virtually the same as the 40-MHzanalog plan shown in Table C. An exception,however, will be noted in the fact that channels2J and 4P have been deleted. These are thechannels located at the upper and lower band edgeswhich cannot be used when required bandwidthexceeds 30 MHz. Elimination of these channelsleaves two remaining half-pairs (3J and 1P) which,as shown in growth stage 12, can make up anonstandard channel pair. Since 1P and 3J initiallybelonged to separate groups, the group assignmentis governed by the transmitter (1P) placing thenew channel in group 2. On SPF digital systems,the two channel groups must be on oppositepolarizations as in analog operation. The channelpairings are again chosen to reduce the interferencescaused by intermodulation products from thetransmitter signals. These products will consistof a broad, continuous spectrum like the transmitteddigital spectrum. This interference has to be wellbelow the error threshold noise level of the receiver(defined as a bit error rate of 10-s) in order toavoid deliberate reduction of the system fademargin. In DPF systems there is normally enoughfilter selectivity available to make this interferencenegligible. However, when the second group ofchannels is added, DPF systems require that thisgroup be operated over a separate antenna to avoidhaving the intermodulation spectra fall within thepassband of the desired receiver carriers. It shouldbe noted that SPF systems may require the useof a second antenna for purposes of transmitter-receiverisolation, since in digital SPF operation, higher bitrates and therefore wider filter bandwidths canmake intermodulation interference potentially serious.Unless reliable ways can be found to keep theintermodulation products low, high power SPFsystems may require separate antennas fortransmitters and receivers on all but very lightroute systems. While other growth plans haveoccasionally been suggested, these plans generallyrun the risk of third order products or usenonstandard channel pairings and thereby riskincreased frequency congestion in areas which usestandard pairings. Although each case should beconsidered on its own merits, these plans are notrecommended.
D. Channel Growth for Combined Systems
2.07 A 40000F9Y (emission designation for digitallymodulated signal having a bandwidth of 40
MHz) digital signal cannot be operated 40 MHz froman analog signal unless the antenna system providesthe needed additional discrimination between thetwo signals. If the analog and digital systemsshare a common antenna, the only possible sourceof this discrimination is the cross-polarization (XPD)discrimination of the antenna system. However,if the digital system uses DPF channels, XPD isnot available and the analog and digital channelsmust then be separated by at least 60 MHz. Thismeans that whenever one DPF digital channel isinstalled, three analog channels are given up—thechannel itself and the two adj scent channels. Inthe worst case, route capacity is, under singleantenna conditions, limited to three analog andthree DPF digital frequencies.
2.08 To get maximum capacity on a combinedroute, the DPF digital and the analog
channels should be put at the opposite ends ofeach half-band. By doing this (again under singleantenna conditions) only one radio frequency is lostat the interface between the digital and analogchannels as opposed to the two adjacent frequenciesrequired when digital DPF and analog channels areintermixed. For this reason, the recommendedgrowth plan for a combined DPF digital-analogsystem will be different from the previous analoggrowth plans. On existing routes that will experiencedigital growth, the growth plan to be followedmust be determined on an individual basis. Theanticipated digital and analog growth must also beconsidered before the decision to change to a newgrowth plan is made.
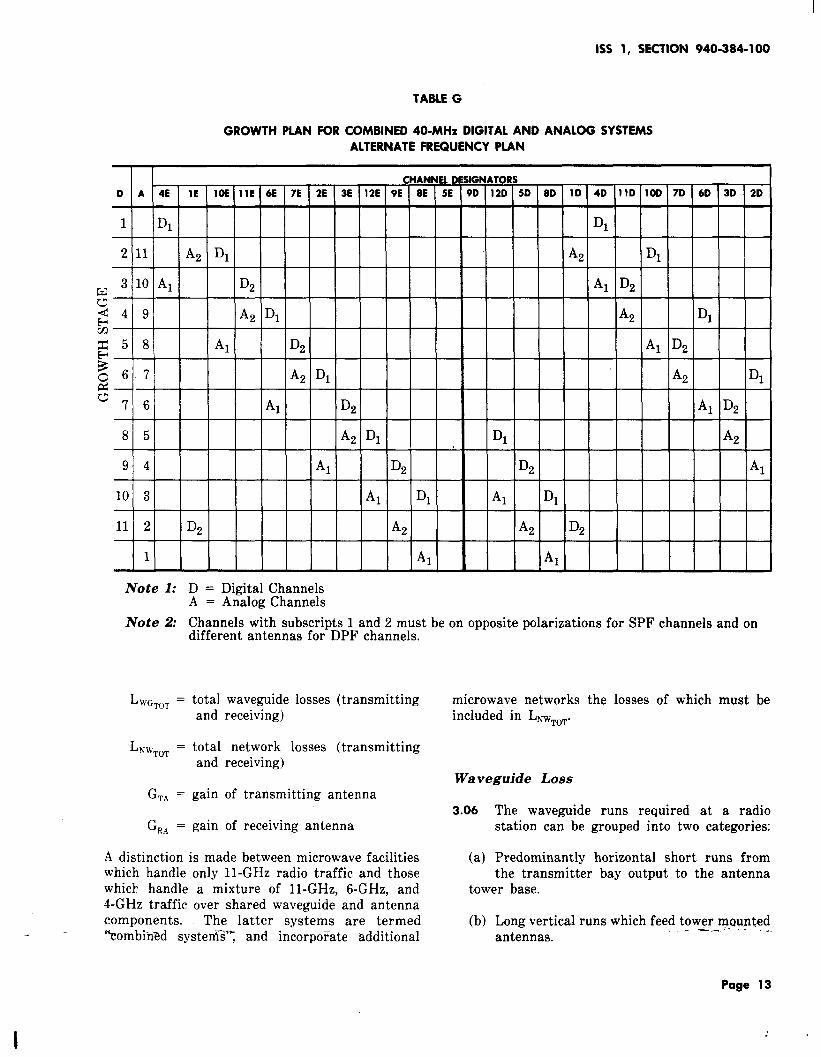
2.09 Tables F and G illustrate the respectiveregular and alternate frequency plans for
combined systems. The reversed growth stagesequence for digital and analog channels is containedin the two left-hand columns. Growth stage one(Table F) for digital signals is shown to involvechannels 11P and 12J at the top of the table, whilethe first growth stage for analog channels appearsat the bottom, using channels 1P and 2J. Thesubscripts 1 and 2 (see Table F, Note 2) used inconjunction with the analog or digital channeldesignations are identical in meaning–the use oftwo subscripts serves merely to emphasize the
— .- —.-
Page 9
SKTION 940-384-100
+——. -.. — - -, .- —-. ..- =--
TABLE D
GROWTH PLAN FOR ANALOG 20-MHz CHANNELS
t IICHANNEL GROUP 1 ●
6 7
2P 12E
lJ 12D
18 19
1P llE
2J llD
CHANNEL GROUP 2 “
4 5
10P 8P
9J 7J
16 17
9P 7P
10J 8J
389
6E 4E
IGROWTHSTAGE
2 3 10 11
8E
12
2E
1
12P
llJ
1stANTENNA
LOWERBANDHALF
UPPERBANDHALF
6P 4P 10E
10D
22
7E
7D
5J
14
3J
15
+
6D 4D
20 21
8D
23
lE
2D
FGROWTHSTAGE
2nd LOWERANTENNA BAND
HALF
UPPERBAND
13
11P
12J
T3E 9E5P 3P
T3D 5D6J 4J lD
* The two channel groups must be on opposite polarizations.
alternating seuuence in polarization or antennas as phenomena important to the operation of an 11-GHzdictated ~y ~he nature of the signal. If, forexample, the first two signals applied to the system(growth stages 1 and 2) are SPF digital, thesubscripts appearing as D1 and Dz indicate the needfor opposite polarization between channel pairs 11P- 12J and 6P - 5J. If the signals are DPF digital,the subscripts dictate the use of separate antennasin conjunction with the channel pairs. As appliedto analog signals, which are always SPF, thesubscripts indicate opposite polarization. As indicatedin Table F, Note 3, digital growth stage 11 (channelpair 1P - 3J) contains contradictory subscripts ineach half-band. The decision as to which subscriptto follow, i.e., which antenna or polarization sequenceto follow, is determined by the transmitter.
3. SYSTEM CHARACTERISTICS INFLUENCING
PERFORMANCE
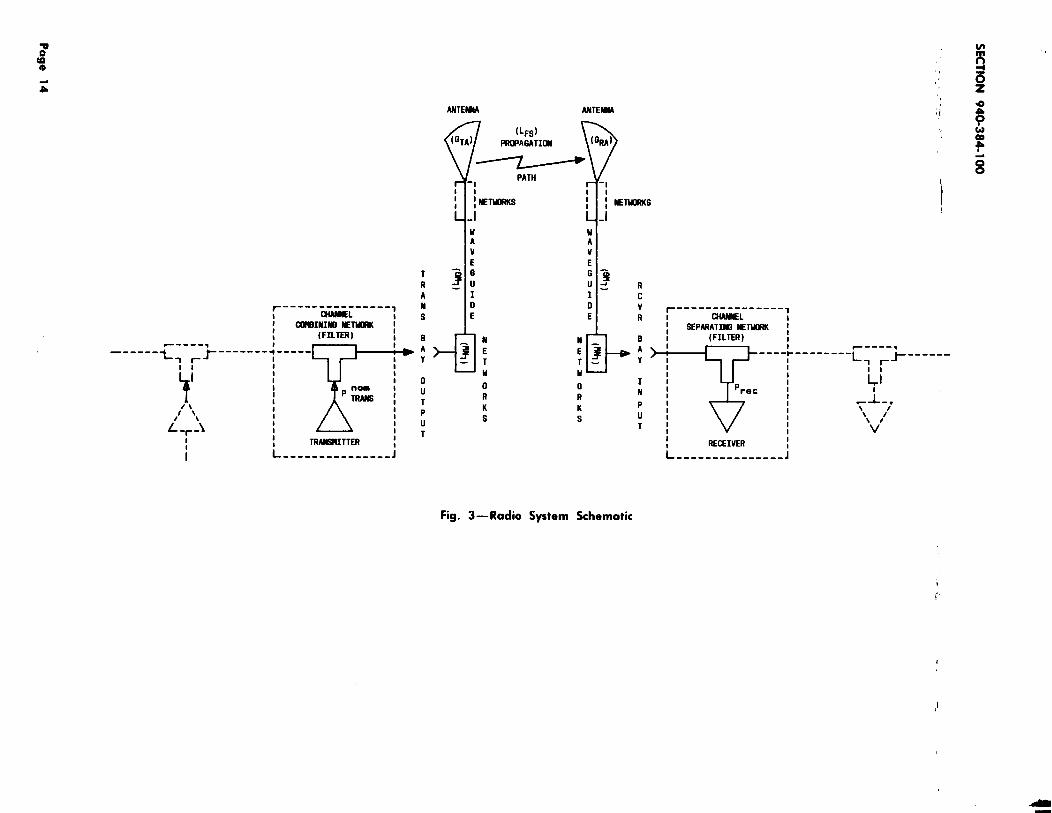
digital or analog radio system. Figure 3, which isa simplified schematic representation of a radiosystem, provides a framework for the followingdiscussion and serves to locate or define theboundaries of various parameters or phenomenabeing described. The expected operating characteristicsand performance requirements will be expressedin general terms so as to be applicable to any11-GHz radio system.
B. System Gain
3.02 Radio system gain is defined as the differencebetween the nominal power measured at
the Transmitter Bay Output (see location in Fig. 3)in dBm and the minimum power at the ReceiverBay Input for acceptable radio system performance.(Note that the phrase “for acceptable radio systemperformance” includes the receiver as necessary tothis evaluation–a point which might not be apparentwith strict respect to the two specified measurementlocations of Fig. 3.) Minimum receiver power for
A. General
3.01 This part defines and discusses the principalsystem characteristics and related physical
Page 10

1SS 1, SECTION 940-384-100
TABLE E
GROWTH PLAN FOR 40-MHz DIGITAL CHANNELS
REGULARPLAN
ALTERNATEPLAN
GROWTH 1STAGE
LOWER 12PBANDHALF
UPPER llJBANDHALF
LOWER 12EBANDHALF
UPPER 12DBANDHALF
CHANNEL GROUP 1 ●
2 3 4
6P 10P
5J 9J
6E 4E 10E
6D 4D 10D
5
8P
7J
8E
8D
II CHANNEL GROUP 2 ●
6 7 8 9
2P 11P 5P 3P
lJ 12J 6J 4J
2E llE 3E 9E
2D llD 3D 5D
10
9P
10J
7E
7D
[1
7P
8J
lE
lD
—
12**
1P**
3J**
* The two channel groups must be on opposite polarization for SPF channels and on different antennasfor DPF channels. See Paragraph 2.06—in some cases SPF channels may require separate antennasfor transmitters and receivers.
** Group assignment governed by transmitter; 1P is part of
conditions:
Analog Systems: Maximum noise level
group 2 and 3J is part of group 1.
SL = Section Loss
F = Fade Margin
Digital Systems:
(worst message channel)= 55 dBrncO
Maximum Bit Error Rate(BER) = 10-3 for messageservice. Other rates mayapply for digital dataservices.
This definition of system gain results in the relationbetween system gain, section loss (see paragraph3.04) and fade margin given by:
SG=SL+F (1)
where
S_G-= System Gain— -- .-
It should be recognized that this definition of systemgain gives a performance measure of the “radioequipment alone, and does not depend on antennasize, waveguide losses, path length, or include theeffect of any active interferences. [Here, as SLbecomes larger, the system fade margin (F) mastbecome smaller to maintain acceptable performance.The receiver fade margin is, in turn, dependenton the internal thermal noise of the radio equipment,which reflects its performance quality.] It shouldalso be noted from Fig. 3 that the system gain(SG), as defined in equation (1) will be smallerthan the quantity [P~O~,,,n, - P,,C~i.], (the differenceof transmitter power and minimum received signalas measured at the respective bay output andinput) by the amount of the channel combiningand separating filter insertion losses. For multichannelsystems, the losses of several tandem filters areincurred.
Page 11

SECTION 940-384-100
:-. . TABLE F - -. —
GROWTH PLAN FOR COMBINED 40-MHz DIGITAL AND ANALOG SYSTEMS
REGULAR FREQUENCY PLAN
CHANNEL DESIGNATORS
D A 4P 1P I OP 11P 6P 7P 2P 3P 12P 9P 8P 5P 9J 12J 5J 8J lJ 4J llJ 10J 7J 6J 3J 2J
1 12 AZ DI A2 DI
2 11 Al D2 Al D2
3 10 A2 DI A2 DIw$4 9 Al D2 Al D2
z=5 8 AZ DI A2 DI
~6 7 Al D2 Al D2
EW7 6 A2 DI A2 DI
8 5 Al D2 Al D2
9 4 A2 DI AZ DI
10 3 D2 Al D2 Al
11 2 A2 Dl” A2 D2*
12 1 Al Al
lVote 1: D = Digital ChannelsA = Analog Channels
Note 2: Channels with subscripts 1 and 2 must be on opposite polarizations for SPF channels and ondifferent antennas for DPF channels.
●Note 3: The assignment of digital channel pair lP—3J per Note 2 is governed by the transmitter.
3.o3 For practical application in the determinationof fade margin, equation (1) above is solved
for F, and SG for this purpose can be obtainedfrom equipment design specifications. The fademargin thus obtained must, however, be furtherreduced to allow for rain, multipath, depolarization,and interference as described in Parts 6 and 7 ofthis section.
C. Section Loss
3.o4 The power loss, due to all causes betweenthe Transmitter Bay Output and the succeeding
Receiver Bay Input is defined as the section loss(SL). As shown in Fig. 3, this loss includes the
free space or propagation path loss as well as thatcontributed by network and waveguide components.In the following paragraphs all elements (includingantenna gain) which accumulate to permit aquantification of total section loss over one hop arediscussed.
3.o5 An expression for SL can be written as:
SL = L~~ +LW~~o~ +Lm~o~ -G~A -G~A (2)
where
L~~ = propagation path loss (free space)
Page 12
1SS 1, SECTION 940-384-100
TABLE G
GROWTH PLAN FOR COMBINED 40-MHz DIGITAL AND ANALOG SYSTEMS
ALTERNATE FREQUENCY PLAN
CHANNELDESIGNATORSD A 4E lE IDE llE 6E 7E 2E 3E 12E 9E 8E SE 9D 12D SD 8D ID 4D lID 10D 7D 6D 3D 2D
1 DI DI
2 11 AZ DI A2 DI
3 10 Al D2 Al D2
z44 9 AZ DI A2 DIz~5 8 Al D2 Al D2
;6 7 A2 DI A2 DI
‘7 6 Al D2 Al D2
8 5 A2 DI DI A2
9 4 Al D2 D2 Al
10 3 Al DI Al DI
11 2 D2 A2 A2 D2
1 Al Al
lVote 1: D = Digital ChannelsA = Analog Channels
lVote 2: Channels with subscripts 1 and 2 must be on otmosite polarizations for SPF channels and on. .different antennas fo~ DPF channels.
LWG~o~= total waveguide losses (transmittingand receiving)
LNWTOT= total network losses (transmittingand receiving)
GTA = gain of
GRA = gain of
A distinction is made
transmitting antenna
receiving antenna
between microwave facilitieswhich handle only 11-GHz radio traffic and thosewhit+ handle a mixture of 11-GHz, 6-GHz, and4-GHz traffic over shared waveguide and antennacomponents. The latter systems are termed
.. %ombinZd systern%’~ and incorpo?-ate additional
{
microwave networksincluded in LW~o~.
Waveguide Loss
the losses of which must be
3.06 The waveguide runs required at a radiostation can be grouped into two categories:
(a) Predominantly horizontal short runs fromthe transmitter bay output to the antenna
tower base.
(b) Long vertical runs which feed tower mounted. ..--.+ . -----antennas.
Page 13
ANTEW ANTEWA
~...---=i-----,I II ~ISI~ ~TUIRK ~I (FILTER) I
P----,t r-------; -----
t—-----
11-
T
III I I
?
II I1 II I
: P%2 :
/’ ‘\ I 1I
L -.:1i I1 1
1 I TRMSl!ITTER it I
i L --------------- J
TRANs
BAY
0uTPuT
(7’ (LFs)(QTA) PROPASATIIM
b(L3RA)
r PATH \-1 1-
11 II ~ ETuLIRKs 1
‘ J i-
U uA Av vE E
0RKs
/-1
~ ETUORKS
A
0RKs
RcvR
sA
Y
1NPuT
t
~---- ------------L
1I III SEPARATI~ NETNX(K ~I (FILTER) II
T
I -----a----* --------
I 1 L J’-------I I
lr
I II
P1 i+
I rec 1I tI 1 L~ - -,.I 11 1 \
I \ /fi I vI
RECEIVER II 1L --------------- J
Fig. 3—Radio System Schematic
1
,[

1SS 1, SECTION 940-384-100
For category (a), dominant modepolarization waveguide is typically
operation, singleused, for example
WR-90. This type of waveguide does not createobjectionable loss, since only short distances areinvolved and, in addition, provides for convenientbending and handling.
3.07 Since tower mounted antennas [category (b)]usually require on the order of 100 feet or
more of vertical waveguide run, guide loss andcost become significant factors in selecting awaveguide type for this purpose. Here, circularwaveguide has a substantial advantage over othergeometries by providing both low loss and dualpolarization operation via a single guide run. Thetype of antenna (see paragraphs 3.08 and 3.09) willalso influence the selection of waveguide type,since the interfacing of the guide and antenna mayrequire transition networks in some cases. Suchnetworks increase cost and introduce some additionalloss. The options in selecting a waveguide for avertical antenna feed-run will also depend onwhether the station is to handle only 11-GHz traffic,or combined 11-GHz, 6-GHz and/or 4-GHz signals.Simultaneous use of lower frequency signals togetherwith 11 GHz with only one vertical waveguide runrequires the use of larger size guide, i.e., oversizefor the 11-GHz signal. Oversize guide can be usedeven in the absence of lower frequency bands, butthe multimode transmission phenomena which canoccur in oversize waveguide may create a varietyof problems, such as excessive envelope delaydistortion. Table H summarizes loss data for variouswaveguide options of interest for 11-GHz radiosystems.
Net works
3.08 A dual polarized 11-GHz-only radio systemwhich uses a single vertical waveguide run
.. — —-
WAVEGUIDE TYPE
Loss per 100 feet (dB)
.-
requires polarization combining networks and, iftransitions to other waveguide geometries or sizesoccur, transition networks and mode suppressors.In combined systems (4-, 6-, and 11-GHz) using acommon vertical antenna feed-run and antenna,combking networks are required to couple theother frequency bands into the waveguide. In somecases, mode suppressor networks may also berequired. Each such network contributes to thetotal section loss through reflection and ohmic losses.Since these networks are usually short, the ohmicloss contributions are very small, and with correctdesign, reflection losses can also be minimized.Typically, each such network will introduce 0.2- or0.3-dB 10ss.
Antenna Gain
3.09 The focusing of radiated energy introducedby the transmitting and receiving antennas
reduces the section loss by the sum of the on-axisgains of the two antennas (assuming correct antennaalignment). The on-axis power gains for someantennas which might typically be used with an11-GHz radio system are given in Table I, togetherwith other antenna parameters of interest.
Radome Losses
3.10 In an open environment, precipitation canaccumulate on the reflector and/or feed
structure of horn and dish antennas. Suchaccumulations can introduce losses of 10 dB ormore into the section loss. To prevent this condition,radomes are typically used to enclose the reflectoraperture and seal out moisture. Radomes may beplanar (rigid or flexible) or geometrically molded,for example, parabolic or conical. Accumulationof water, ice, or snow on the radome also results
TABLE H
11-GHz WAVEGUIDE DATA
WC281 Wcl 50 WC109
0.3 0.8 1.35
WR90
3.4
EW107
3.4–3.7*
..-= .-- .-..:.. .-
* Copper (3.4) versus aluminum (3.7).
Page 15
●

1’ ‘
SECTION 940-384-100
-._. -. —... .. . --- --TABLE I
ANTENNA RADIATION PARAMETERS AT 11 GHz (MIDBAND)
ANTENNA GAIN” ● BEAMWIDTH FRONT-TO-BACK SIDE-TO-SIDE
TYPE (dB) , DEGREES COUPUNG (dB) COUPLING (dB)
KS 15676 Horn 48.0 (Vwl) 0.81 (VP1~.) < 85 (Vwl) 93 (Same polarization)
Reflector (10’) 47.4 (Hwl) 0.66 (HP1~,) < 86 (Hwl) 100 (Cross-polarization)
Gabriel 43.8 1.2 (VP,-*) 75 (Vp,)
Minihorn (6’) 1.1 (HP1~.) 75 (Hw,)
UHR-1OB
P*A
6’ Dia 44 1.1 75
RDAI 8’ Dia 45.9–46.6 0.80-0.78 70–75
:: 10’ Dia 47.6–48.5 0.70-0.65 70–75::
c12’ Dia 49.2–49.9 0.60-0.50 70–75
* Performance varies with manufacturer, the values shown being representative.
** Includes the loss of a dry low-loss radome.
in increased loss in the propagation path, butmeasures to reduce such losses can be effected.
3.11 Ice and snow accumulation can be minimizedthrough use of resistance heaters distributed
through the radome surface. (Prevention of icebuildup may also be desirable to reduce the hazardof falling ice from tower mounted antennas.) Theuse of flexible planar radomes under tension alsominimizes ice and snow buildup through the flexingaction which results from normal wind conditions.Special chemical coatings which reduce absorption,adhesion, and friction of the radome surface toprecipitation are currently under experimentalinvestigation. These coatings not only reduceprecipitation losses, but reduce the recovery timeof the radome to normal conditions. It is anticipatedthat future information on the use of radomescoated with hydrophobic materials will be includedin this section as results become available.
3.12 The loss introduced by use of a radome,under dry conditions, can vary from less
than a few tenths of a dB to several dB, dependingon the specific radome used. It should be noted
-. —..
that the antenna gains given in Table I includethe loss contributed by a dry, low-loss radome. Atypical value of 4 dB is used as the loss resultingfrom a wet radome in the various representativecalculations throughout the remainder of this section.
Free Space Path Loss
3.13 The geometric spreading of energy radiatedfrom the transmitter location to the receiver
results in the free space path loss (LFs). (Thistopic of propagation path loss is the subject ofSection 940-310-101, which may be consulted ifadditional details are desired.) This contributionto the overall section loss (in dB) at the midbandfrequency is expressed by the relation:
LFs = 117.6 + 20 log (D) (miles)
or
L~s = 113.5 + 20 log (D) (kilometers)
Page 16
1SS 1, SECTION 940-384-100
where D is the transmitter-receiver separation inmiles or kilometers. It is sufficient to calculatethe path loss for midband.
D. Cross-Polarization Discrimination (XPD) Characteristics
3.14 Some 11-GHz digital radio systems havebeen designed to meet the FCC requirement
specifying a voice circuit loading equal to or greaterthan 1152 voice circuits per 40-MHz channel, to beimplemented through cochannel (dual polarization)operation. In this type of operation, otherwiseknown as dual polarization per frequency (DPF),the same channel frequency is transmitted on twoopposite polarizations with unique message informationapplied to each polarization. (The 3A-Radio DigitalSystem, for instance, uses a voice circuit loadingof 672 per polarization, yielding a total of 1344message channels per frequency. ) Signal selectivityis achieved only through the cross-polarizationdiscrimination available at the receiver. Therefore,in order to limit cochannel interference and resultantservice outages, systems of this type require thatunder standard, non faded conditions the systemcross-polarization discrimination be on the order of25 dB. The XPD of an 11-GHz radio system isdependent on natural phenomena as well as ondesign parameters.
rThus, due to the variability
of environmental phenomena the XPD will fluctuateabout its nominal design value, giving rise to timedependent system degradation and outage. Thosefactors and phenomena which determine the XPDof an 11-GHz radio system are discussed below.
Antenna System
3.15 Several effects can occur within an antenna,its associated waveguide, and other antenna
system components all of which may give rise toundesired coupling of cross-polarized energy into aradio channel. The antenna proper responds to across-polarized signal, that is, gives rise to a signalat the antenna output signal port, with a polarizationsensitivity which depends on the vertical andazimuthal arrival angle of the incoming wave. Thecross-polarization response pattern is the measureof such sensitivity.
3.16 Horn reflector and parabolic dish antennasused in 11-GHz radio systems both display
a deep null (high discrimination sensitivity) in thecross-polarized antenna response pattern along the
.. - axis defined bfihe center of the -main beam oft~e normal (copolarized) antenna pattern. For the
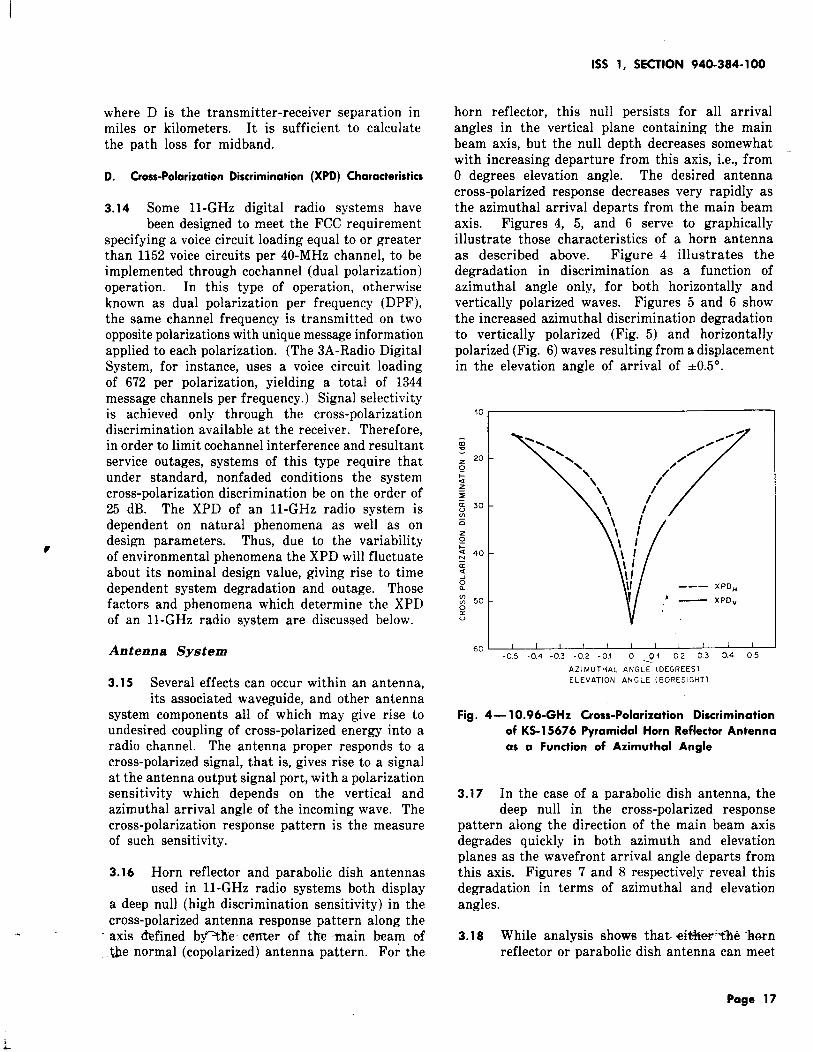
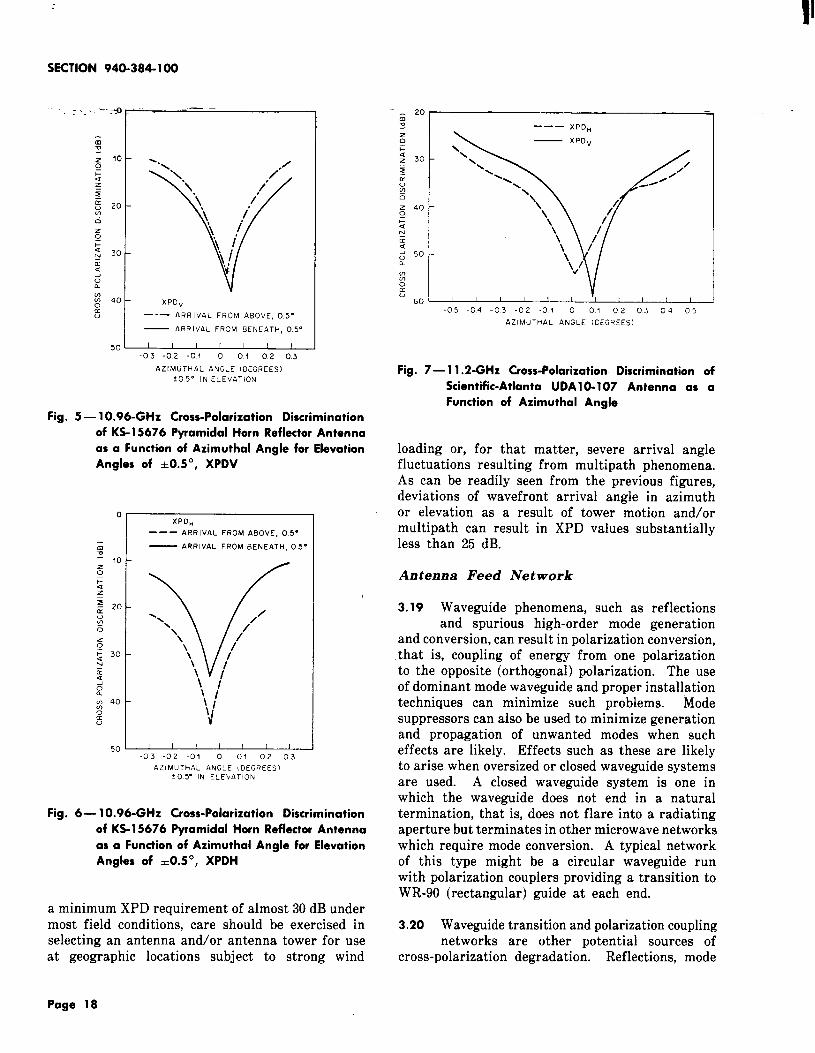
horn reflector, this null persists for all arrivalangles in the vertical plane containing the mainbeam axis, but the null depth decreases somewhatwith increasing departure from this axis, i.e., fromO degrees elevation angle. The desired antennacross-polarized response decreases very rapidly asthe azimuthal arrival departs from the main beamaxis. Figures 4, 5, and 6 serve to graphicallyillustrate those characteristics of a horn antennaas described above. Figure 4 illustrates thedegradation in discrimination as a function ofazimuthal angle only, for both horizontally andvertically polarized waves. Figures 5 and 6 showthe increased azimuthal discrimination degradationto vertically polarized (Fig. 5) and horizontallypolarized (Fig. 6) waves resulting from a displacementin the elevation angle of arrival of +0.5°.
60 I I 1 I I I 1 1 1 1 I I
-05 -04 -03 -02 -0.1 0 _fJl 02 03 0.4 05
AZIMUTHAL ANGLE (O EGREESI
ELEVATION ANGLE (BORES IGHT)
Fig. 4— 10.96-GHz Cross-Polarization Discrimination
of KS-15676 Pyramidal Ham Reflector Antenna
as a Function of Azimuthal Angle
3.17 In the case of a parabolic dish antenna, thedeep null in the cross-polarized response
pattern along the direction of the main beam axisdegrades quickly in both azimuth and elevationplanes as the wavefront arrival angle departs fromthis axis. Figures 7 and 8 respectively reveal thisdegradation in terms of azimuthal and elevationangles.
3.18 While analysis shows that +i&#iw-%%e“banreflector or parabolic dish antenna can meet
Page 17
SECTION 940-384-100
--.+ -. —–:.. .
I — ARRIVAL FROM BENEATH, 05”I
50 ~-03 -02 -01 0 0+ 02 03
AZIMUTHAL ANGLE (DEGREES)
105” IN ELEVATION
Fig. 5 — 10.96-GHz Cross-Polarization Discrimination
of KS-1 5676 Pyramidal Horn Reflector Antenna
as a Function of Azimuthal Angle for Elevation
Angles of +0.5°, XPDV -
XPDH
‘-- ARRIVAL FROM ABOVE, 05”
— ARRIvAL FROM BENEATH, 05°
1 I I I ! ( I
--— XPOH
— XPDV\
30 - \\
N\
-\\
\\
40\
\\
\
50
60 1 t
-05 -04 -03 -02 .01 0 01 02 03 04 05
AZ IMUTti AL ANGLE IOEGREES)
Fig. 7— 11.2-GHz Cross-Polarization Discrimination c
Scientific-Atlanta UDA 10-107 Antenna as a
Function of Azimuthal Angle
loading or, for that matter, severe arrival anglefluctuations resulting from multipath phenomena.As can be readily seen from the previous figures,deviations of wavefront arrival angle in azimuthor elevation as a result of tower motion and/ormultipath can result in XPD values substantiallyless than 25 dB.
-03 -02 -01 0 Oi 02 03
AZ IMUTtiAL ANGLE (DEGREES):05” IN ELEVATION
Fig. 6— 10.96-GHz Cross-Polarization Discrimination
of KS-15676 Pyramidal Horn Reflector Antenna
as a Function of Azimuthal Angle for Elevation
Angles of +0.5°, XPDH
Antenna Feed Network
a minimum XPD requirement of almost 30 dB undermost field conditions, care should be exercised inselecting an antenna and/or antenna tower for useat geographic locations subject to strong wind
3.19 Waveguide phenomena, such as reflectionsand spurious high-order mode generation
and conversion, can result in polarization conversion,that is, coupling of energy from one polarizationto the opposite (orthogonal) polarization. The useof dominant mode waveguide and proper installationtechniques can minimize such problems. Modesuppressors can also be used to minimize generationand propagation of unwanted modes when sucheffects are likely. Effects such as these are likelyto arise when oversized or closed waveguide systemsare used. A closed waveguide system is one inwhich the waveguide does not end in a naturaltermination, that is, does not flare into a radiatingaperture but terminates in other microwave networkswhich require mode conversion. A typical networkof this type might be a circular waveguide runwith polarization couplers providing a transition toWR-90 (rectangular) guide at each end.
3.20 Waveguide transition and polarization couplingnetworks are other potential sources of
cross-polarization degradation. Reflections, mode
Page 18
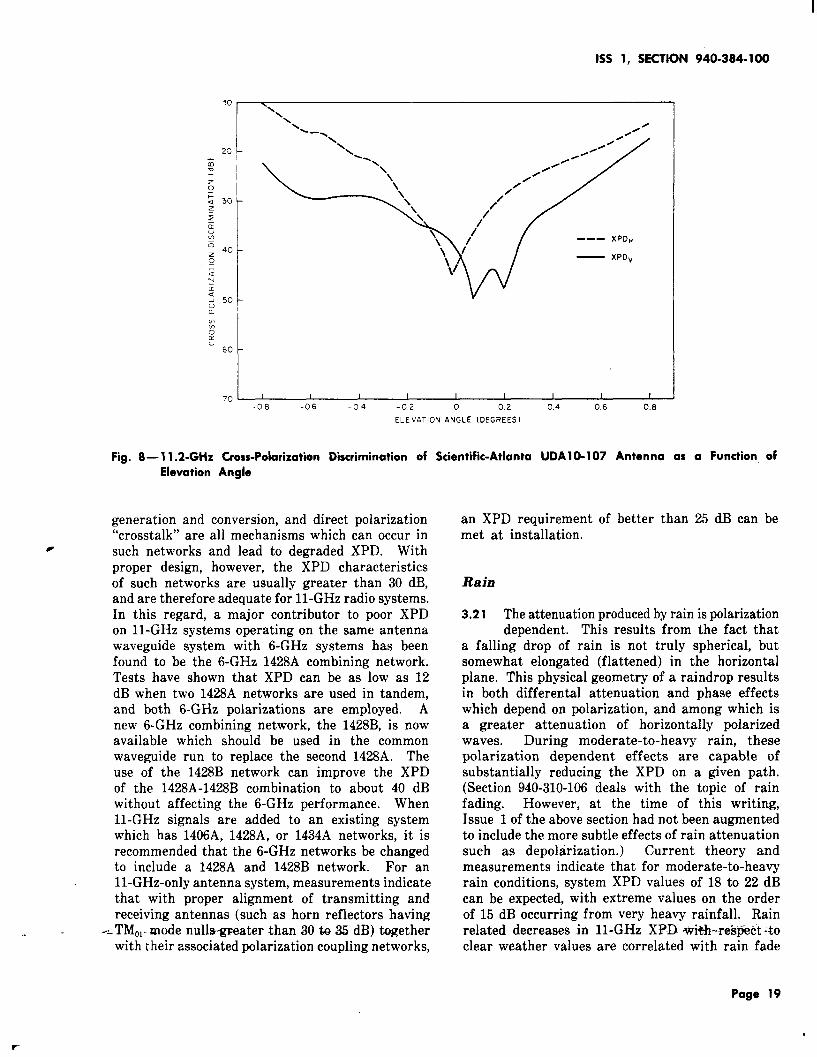
Fig. 8— 11 .2-GHZ
Elevation
I
1SS 1, SECTION 940-384-100
60
tI
I70 I 1 I I I I I I I I
-08 -06 -04 -02 0 02 0.4 06 0.8
ELEVATION ANGLE (DEGREES I
Goss-Polarization Discrimination of Scientific-Atlanta UDA1 O-107 Antenna as a Function of
Angle
generation and conversion, and direct polarization“crosstalk” are all mechanisms which can occur in
0 such networks and lead to degraded XPD. Withproper design, however, the XPD characteristicsof such networks are usually greater than 30 dB,and are therefore adequate for 11-GHz radio systems.In this regard, a major contributor to poor XPDon 11-GHz systems operating on the same antennawaveguide system with 6-GHz systems has beenfound to be the 6-GHz 1428A combining network.Tests have shown that XPD can be as low as 12dB when two 1428A networks are used in tandem,and both 6-GHz polarizations are employed. Anew 6-GHz combining network, the 1428B, is nowavailable which should be used in the commonwaveguide run to replace the second 1428A. Theuse of the 1428B network can improve the XPDof the 1428A-1428B combination to about 40 dBwithout affecting the 6-GHz performance. When11-GHz signals are added to an existing systemwhich has 1406A, 1428A, or 1434A networks, it isrecommended that the 6-GHz networks be changedto include a 1428A and 1428B network. For an11-GHz-only antenna system, measurements indicatethat with proper alignment of transmitting andreceiving antennas (such as horn reflectors having
-_ TMO1-mode nulls-g~ater than 30 b 35 d13) tigether..with their associated polarization coupling networks,
an XPD requirementmet at installation.
Rain
of better than 25 dB can be
3.21 The attenuation produced by rain is polarizationdependent. This results from the fact that
a falling drop of rain is not truly spherical, butsomewhat elongated (flattened) in the horizontalplane. This physical geometry of a raindrop resultsin both differental attenuation and phase effectswhich depend on polarization, and among which isa greater attenuation of horizontally polarizedwaves. During moderate-to-heavy rain, thesepolarization dependent effects are capable ofsubstantially reducing the XPD on a given path.(Section 940-310-106 deals with the topic of rainfading. However, at the time of this writing,Issue 1 of the above section had not been augmentedto include the more subtle effects of rain attenuationsuch as depolarization.) Current theory andmeasurements indicate that for moderate-to-heavyrain conditions, system XPD values of 18 to 22 dBcan be expected, with extreme values on the orderof 15 dB occurring from very heavy rainfall. Rainrelated decreases in 11-GHz XPD -wi+h--rek@ct %oclear weather values are correlated with rain fade
Page 19
,
SECTION 940-384-100
—.deptki-i.e~~~he “minimum XPD values occur duringdeep rain fades.
Multipath Fading
3.22 Multipath fading of conventional signals ofsingle polarization in a given radio channel
is reasonably well understood and documented.(Section 940-310-102 on the topic of Selective Fadingdiscusses the physics of multipath phenomena andprovides experimentally verified statistics relativeto fade depth and fade duration.) However, thebehavior of cross-polarized energy coupled into aradio channel during fading is not completelycharacterized at the present time.
3.23 It is known that when multipath fadingoccurs it will affect the primary vertically
and horizontally polarized signals in an identicalmanner. In contrast to this, however, secondarypropagation paths and scattered energy can beindependently affected. As a consequence, thesesecondary sources may continue to contribute tothe received cross-polarized energy at a more orless constant level during periods when the primarysignal is experiencing a severe fade. Here too, itbecomes possible for signals being experienced asexternal interference to remain at relatively highlevels–in contrast to rain fading in which thefading of secondary signals as well as interferencewill be correlated with primary signal fading.Multipath fading is also capable of shifting thearrival angle of the incoming wave (as previouslydiscussed in paragraph 3.16) and can cause variationsof inclination in the plane of polarization both ofwhich result in degraded XPD and increasedcoupling of cross-polarized signals at the receivingantenna. The net result of all of these effects isan XPD which remains essentially unchanged forsmall to moderate fades, but degrades rapidly formoderate to deep fades.
4. OVERVIEW OF OUTAGE CALCULATIONS
A. General
4.01 For 11-GHz radio systems, the three majorcauses of system outage are:
(a) Rain attenuation
(b) Multipath fading
(c) Equipment failure.
‘With modern solid-state systernsj-equipment failurZ-should not be a serious contributor on systems withequipment protection, such as 1XN frequencydiversity (in which equipment protection is intrinsic)or hot standby (which can be used in conjunctionwith space diversity). Rain attenuation and selectivefading will affect both analog and digital systems;however, the relative effects will differ, dependingon the hop in question.
B. Analog Systems
4.02 Rain outage is usually the major factor tobe considered in analog systems. This arises
from the fact that rain attenuation is nonselectiveand cannot be compensated by space or frequencydiversity techniques. Outage time caused by raincan be held within tolerable limits only by reducinghop length, which assures a high signal level atthe receiver and reduces the probability of rainoccurrence on a given hop. The short hop lengthsdictated by rain outage also reduce the probabilityof selective fading, the remainder of which can, ifnecessary, be largely offset by the use of conventionalspace or frequency diversity.
C. Digital Systems
4.03 Rain outage is, of course, a concern of digitalas well as analog systems. Here, however,
problems related to multipath propagation can, inspite of diversity protection, become a major sourceof outage. For digital systems, the multipath fademargin will usually be smaller than the marginnecessitated by rain attenuation. As pointed outin paragraph 3.23, the fading of secondary pathsignals, as well as external interference, is notnecessarily correlated with primary path fading.In addition, multipath propagation can shift thearrival angle off the antenna main beam axis andcontribute to depolarization as well, which in DPFsystems results in degraded XPD and resultantcochannel interference. As a consequence, theDPF fade margin is determined by the cross-polarizationdiscrimination or, in other words, by the carrierto interference (C/1) ratio (which can degrade evento the point of producing negative ratios) ratherthan by the conventional carrier to thermal noiseratio (C/N). In SPF digital systems, the C/N isalso subordinate to the greater consideration ofthe effect of multipath induced distortion on the8-level signal. Since, in both cases, conventionalthermal noise is not a consideration, and sinceseverely degraded C/I ratios as well as distortion
Page 20

1SS 1, SECTION 940-384-100
can occur at fade depths corresponding to relativelyhigh C/N ratios, the multipath fade margin cannotbe significantly improved by such means as increasingtransmitter power, lowering waveguide loss, orincreasing antenna gain. These factors improvethe already adequate C/N ratio without affectingthose mechanisms responsible for digital degradation.The net effect is that in systems employing highperformance antennas, the operating fade marginfor multipath is in the 30-dB range. This hastwo significant effects on multipath outages:
(a) As predicted by the Rayleigh distribution,fading time at the 30-dB level is about 10
times that at the 40-dB level.
(b) The effectiveness of frequency diversity atthe 30-dB level is also reduced by a factor
of 10 from that at the 40-dB level.
(As will be subsequently pointed out in paragraph7.09, space diversity performance also degradeswith a reduced fade margin, but not to the pointof impracticality for use with digital systems. )Because of these effects, multipath can be thedominant source of digital system outage, exceptin those areas where rain severely limits hop
Flengths and so reduces multipath probability.
5. SYSTEM OUTAGE OBJECTIVES
A. Annual O~ectives
5.01 Outage objectives for Bell System microwavetransmission systems are stated in terms of
an allowed annual outage percentage for a statedroute length. For both long-haul and short-haulsystems, this 2-way objective is 0.02 percent or105 minutes per year. The distance over whichthis objective applies is 4000 miles in the case oflong-haul systems, and 250 miles for short haul,and includes outage from all causes, i.e., environmentalphenomena as well as equipment failure, of whichthis latter category includes such things as maintenanceand plant errors. Outage objectives for lengthsshorter than those specified are scaled down linearly.Thus, a 70 mile short-haul system would have anoutage objective of 70/250 X 105 min. = 29.4minutes per year.
B. 11-GHz Apportionment
‘–5.02 ‘ _Ithas bee% ~onsidered conventional practicewhen calculating outage at lower frequencies
(such as 4 and 6 GHz) to further apportion the0.02 percent 2-way annual objective such thatone-half or 0.01 percent was allocated to multipathwhile the remaining half was assigned to equipmentfailure. At 11 GHz, rain attenuation becomes anadditional source of outage which must be considered,and for which outage time must be allocated. Anytime which can therefore be obtained through areduction in the calculated outage contributed byany given factor or factors can be allocated to rain.For this reason, the approach best suited to 11 GHzis to disregard any strict apportionment in termsof previous convention, and to calculate and sumthe specific outages to assure that their total willnot exceed the scaled objective for that hop. Thismethod is demonstrated in the extended examplepresented in Part 9 of this section, and representsthe procedure to be followed.
6. OUTAGE DUE TO RAIN
A. General
6.01 Rain outage depends on hop length, the fademargin, and the intensity and duration of
the rain. The calculation of expected rain outagetime is facilitated by use of a rain outage chart, atypical example of which appears as Fig. 9. Theuse of this chart requires the application of hoplength and the hop rain attenuation margin (M).This rain margin is derived by modification of thebasic fade margin (F) which, in turn, is based onsystem gain and section loss as discussed in Part 3,and can be obtained by resolving equation (l), inwhich case,
F= SG-SL (3)
[Given a radio terminal pair of a particular type,the system gain parameter, SG, is fixed, whilesection loss, SL, is derived as in Part 3, equation (2).]The required modifications to F result in rain fademargins which differ for SPF and DPF systems.
B. Fade Margin for SPF Systems
6.02 The rain fade margins for SPF systems areobtained by first computing F as in equation
(3) above, and modifying (reducing) this value interms of interference and/or radome loss. Thecorrection for interference (the calculation of whichis rather involved) takes the form of a. .~nalty.. ---which results in a reduction of the fade margin.The calculation of this interference penalty is covered
Page 21

SECTION 940-384-100
____ . ,.
H-PUL HOP LWGTH (KM)
- -, -——.
..;,5 I I 1 N 1 I >1 I u 1 ml 1
r
t! t+. +%–-+
-+
40 h
1~++~ I 1;I I ! 1 1,$
I I
I 1 1 1 1 1 I 1 1 1 I 1 1 1 1 1 1 ,,, ,, Z,,, , ,,, ,,. ,1 I I
1 I I I I I [ I I 1 I I I1 I I I I +Il:ill Eli’’’’’’’’’’’’’’ ””lJ I [ I I II ) 1 I I I I ,,, : I I
65 II I I I I
I I 17 ~
1 1 I,,, I I I
, I ~[ 1 -i-
, 1 I
-1+- ;!:: ,!
V-POL HOP LFNLW IKM)
Fig. 9—Rain Attenuation Chart—Typical City
Page 22

II
1SS 1, SECTION 940-384-100
in Part 10 dealing with interference considerations.(See, in particular, paragraphs 10.21 and 10.22.)The best estimate for wet radome loss is 4 dB persection for good quality planar radomes. Conical,hemispherical or corrugated radomes have significantlyhigher loss. Analog systems require only the 4-dBwet radome allowance, while digital system fademargins are reduced by the wet radome allowanceand the calculated interference penalty.
C. Fade Margin for DPF Systems
6.03 The calculated fade margins [equation (3)]for DPF systems must be reduced by three
factors: The first is the same 4-dB wet radomeallowance as in the SPF case. The second factoris again an interference penalty which, however,will differ from the previous SPF value and thecalculation of which is also covered in Part 10.The third factor is unique to DPF systems and,as previously introduced in paragraphs 3.14 and3.21, involves the degradation of XPD during heavyrain. The resultant cochannel interference resultsin a reduced carrier-to-interference’ratio (C/1) whichmust be offset by an improved carrier to thermalnoise (C/N) ratio if the same BER used to definesystem gain is to be maintained. Again, reduction
r of the fade margin is applied to this purpose. Fora typical 4-level (modulation via 4-level FSK orPSK) digital signal, this loss of fade margin isapproximately 2 dB.
D. Rain Outage Charts
Background
6.04 The frequency and duration of high rainfallrates varies widely with geographical location.
Long-term U. S. Weather Service records havebeen processed for over 200 United States locations.From this data, charts have been derived showingthe expected minutes of outage for a range of hoplengths and rain attenuation margins. Separatecalculations must be made for vertical and horizontalpolarizations since the attenuation due to a specificrain rate is higher for horizontally polarized signals.When calculating outage time, the chart appropriateto the area should be used. Specific rain attenuationcharts pertinent to the territorial area of concern
-–to ead operating compmy have teen transmittedto the appropriate headquarters radio engineer. If
necessary, additional copies of these charts can berequested from the following address:
Engineering Dept. - Intercity TransmissionSystemsAmerican Telephone and Telegraph Company295 North Maple AvenueBasking Ridge, New Jersey 07920
6.05 The expected rain outage for a hop with afixed length and fade margin varies widely
with geographic location. The southeastern UnitedStates tends to have the most frequent and longestduration of high rainfall rates. Moving both northand west from that region improves the outagetime by a large factor. The far western regionshave the lowest incidence of high rain rates.Repeater spacings required to meet outage objectivesthus vary from short in the Southeast to long inthe Northwest.
Hop Length Determination
6.06 Formulas are available for the direct calculationof such factors as fade margin and outage
time. Since repeater spacings must be adjusted inrelation to rainfall, a question might arise as towhy no similar, direct method has been applied tothe determination of optimum hop length, as wellas to the origin of such hop length values asrequired input to Fig. 9, and as previously requiredin the calculation of free-space path loss towardthe evolution of equations (1) and (3). A chart ornomogram providing hop length as a function ofrain rate, outage time, and fade margin could bedevised. However, a chart of this type would beuseful only under the assumption that the optimumphysical locations would be available for stationplacement. In reality, the possibilities for stationlocation are highly restricted by such things asavailable real estate, areas en route to be served,and locations of high elevation (mountain tops, forexample, which reduce the need for high towersand long waveguide runs). C)ther variables mustalso be considered, with the net result that thereis usually more than one way to do a job in termsof required route length, service, and outage time.While longer hops could make for economy, multipathwould increase along with rain outage, and theadded cost of space diversity could offset any gain.Short hops, while reducing rain outage and multipath,would also increase equipment failure. Since hoplength (and the related -number -of”liir-p~~“will- yedictated by practical limitations and considered
Page 23

SECTION 940-384-100
.<_.. ----..’. .:. -
alternatives, it must be inserted by the designengineer with the calculated fade margin becomingthe dependent variable. Again, as with the allocationof outage time, the best method of deciding amongalternatives is essentially trial and error, that is,to follow the example in Part 9, using consideredpractical possibilities and testing the entire routeagainst outage time and economy.
Chart Use
6.07 The sample rain outage chart of Fig. 9 isthat of a typical city. Outage time (in
minutes) is shown for combinations of rain attenuationmargins ranging from 40 to 65 dB and path lengthsof 10 to 60 km. Since the path length is shownin kilometers rather than miles, the appropriateconversion factors are:
1 mile = 1.6093 km
1 km = 0.6214 miles
The curves on the upper edge of the chart arefor horizontal polarization, while those on the lowerportion are for vertical polarization.
6.o8 To use this chart—say, for horizontalpolarization–the point corresponding to the
intersection of the rain attenuation margin andpath length is located in the upper portion. Thispoint is then projected vertically downward untilit intersects the curve in the center of the chart,and the minutes of outage are read from the scaleon the left of the center section. The same processis used for vertical outage time, except that thelower portion of the chart is used. Keep in mindthat the rain attenuation margin used with thischart is
M(Rain Margin) = F - (Wet radomeloss)
- (Depolarizationcorrection)
- (Correction forinterference)
where
Wet radome loss = 4 dB
Depolarization correction ~ 2 dB (DPF)
= O dB”(SPF) - “ -- --
Interference (Digital Systems) = As calculatedper Part 10
If the interference penalty is momentarily disregarded,it can be seen that the rain margin for SPF systemswill be 4 dB smaller than F, as calculated fromsystem gain minus section loss, while that forDPF systems will be 6 dB smaller.
6.09 The example of Fig. 10 serves to furtherdemonstrate the use of the rain outage
chart. This is a light route (2000 VF circuits)DPF system consisting of 4 hops, and is the sameexemplary system used in Part 9 as a summarydemonstration of outage calculation. The hoplengths and associated rain margins are providedin Fig. 10. Since the interference penalty ascalculated in Part 10 for such a light route DPFsystem is 0.4 dB, the indicated rain margins arereduced by 6.4 dB from the fade margins (F) asotherwise obtained from equation (3). The C-Dhop, having a 40-km path length and a 50-dB rainattenuation margin, is fully marked on Fig. 9,while the remaining three hops are shown only aspoints. The total outage times as derived fromthe chart are tabulated below
HOP
A-B
B-C
C-D
D-Z
D
PATH
LENGTH
KM
16
35
40
22
M OUTAGE TIME
RAIN
ATTENUATION v H
MARGIN DB MIN. MIN.——
58.0 – 1.0
51.2 7.6 12.3
50.0 10.5 16.0
55.2 1.3 4.5——G 19.4 33.8
7. OUTAGE DUE TO MULTIPATH FADING
A. General
7.OI For many 11-GHz radio paths, system outagewill be controlled almost entirely by rain.
The short repeater spacings and the use of frequencyor space diversity combine to make outages dueto multipath fading negligible. For some paths,for example long paths in dry climates, or evenmoderate paths in coastal areas, multipath effects
Page 24

can be significant. The effects are most likely inhot humid and flat regions and least likely in cool,dry, and mountainous terrain. Over theterrain, fading on a short path is much lessthan fading on a long path.
B. Fade Margins for SPF Analog Systems
samelikely
7.02 Fade margins for SPF analog systems arefound by the direct application of equation
(3):
F= SG-SL
C. Multipath Fade Margins for SPF and DPF Digital
Systems
7.o3 Multipath fade margins for digital systemsare usually much smaller than the fade
margins determined by system gain minus sectionloss. In DPF, loss of XPD can result in cochannelinterference, while in SPF operation selective fadingcan result in distortion. The best evidence availablenow suggests that for moderate length hops, amultipath fade of approximately 30 dB results in
r a high probability of exceeding the 10-3 BER. Notethat this is a statement of probability, not that ofa clear cut cause and effect relationship. Somefades less than 30 dB will cause high error rates,while some deeper fades will not. Longer hops,lower fade margins [from equation (3)], and lowerXPDS will make the onset of high error rates occurslightly lower than 30 dB. The usual variationsbetween 11-GHz systems using high quality antennasand with high fade margins for rain are quitesmall. Thus, the assumption can be made thatthe fade margin for multipath in digital systemsis usually no more than 30 dB.
— .-
B
.1! = 51.2M\
1SS 1, SECTION 940-384-100
D. Outage per Hop (Nondiversity)
7.o4 Estimates and methods of procedure fordetermining multipath outage time as a
function of path length, frequency, fade margin,and climate and terrain factors are described inSection 940-310-102. This section can be appliedto calculations involving SPF analog and digitalsystems, as well as DPF digital systems which—require special considerations.
7.05 The curves and formulas in Section 940-310-102are applicable to digital systems even though
the outage criterion is based on a 10”3bit errorrate rather than on thermal noise per se. Sincethe SPF multipath fade margin will coincide withthe 10”3 BER, and since the application of thismargin to the formulas in Section 940-310-102 yieldsoutage time as “time below level”, the time duringwhich the signal level is below this fade marginwill also coincide with the 10-3 BER. As pointedout in Section 940-310-102, however, 11-GHzinstallations which are located on mountain topshaving midpath clearance hundreds of feet in excessof the radius of the first Fresnel zone can experienceless selective fading than predicted by the conventionalequations.
E, Outage per Hop, DPF Systems
7.06 An approximation of the DPF outage isshown in Fig. 11. The curve is drawn for
typical systems with a thermal noise fade margingreater than 40 dB at 25 miles. A 10-3 BER wasused to define an outage, thus the Fig. 11 curvereflects a fade margin in the order of 30 dB. Thecurve provides the outage in minutes per year asa function of repeater spacing. The c factor forthese curves is 1.0, corresponding to averagehumidity and average terrain conditions. A c factorof 1.0 is appropriate for the Middle West. Corrections
o
A40 KM22 KM
M=55.2DS
v=”” \c z
----Fig. 10—4-Hop System
Page 25

SKTION 940-384-100
for othek-iiiieas” are made by multiplying the outagetime obtained from Fig. 11 by different values ofc derived as follows:
[1w —1.3
C=x —50
where x = 2.0 humid regions
= 1.0 average humidity
= 0.5 dry regions
and w = terrain roughness (the standarddeviation of the terrain heightsmeasured at l-mile intervals alongthe path).
(For w > 140, use 140 as themaximum value. For w <20 use20 as the minimum value)
An extended discussion of the c and w factors isavailable in Section 940-310-102. (Note that a valueof w = 50 has been defined as normal, in whichcase c will remain at 1 for average conditions.) Acomparison of the DPF outage time (using the curveof Fig. 11) and the 11-GHz conventional systemoutage time (inserting similar parameters) aspredicted in Section 940-310-102, reveals that theoutage for DPF digital systems (due to the existenceof XPD degradation) will be muchoutage time based only on thermalfade margin of 40 dB or greater.
greater thannoise with a
100
10
1,0
0.1
- u.
ONE - IJAY
E, E. R.= 10-~
c . 1,0
(AvG TERRAIN % cLIf+3TE)
-.—.
o 10 20 30 40 50 60
PATH LENGTH I N K I LOMETERS
Fig. 11 —Multipath Outage Versus Hop Length (DPF)
F. Space and Frequency Diversity Improvements
Space Diversity
7.o7 Outage due to multipath can be greatlyreduced by switching a receiver to a second
antenna which is vertically separated from the mainantenna. (Section 940-310-115, as well as EL 3420on which 940-310-115 was based, provide detailedcoverage of this subject.) For the 11-GHz band,withI, is
equal gain antennas, the improvement factor,given by:
F
[1I = 1.3(10 )-3 ~ 106
D
where
S is the separation in feet
Page 26
1SS 1, SECTION 940-384-100
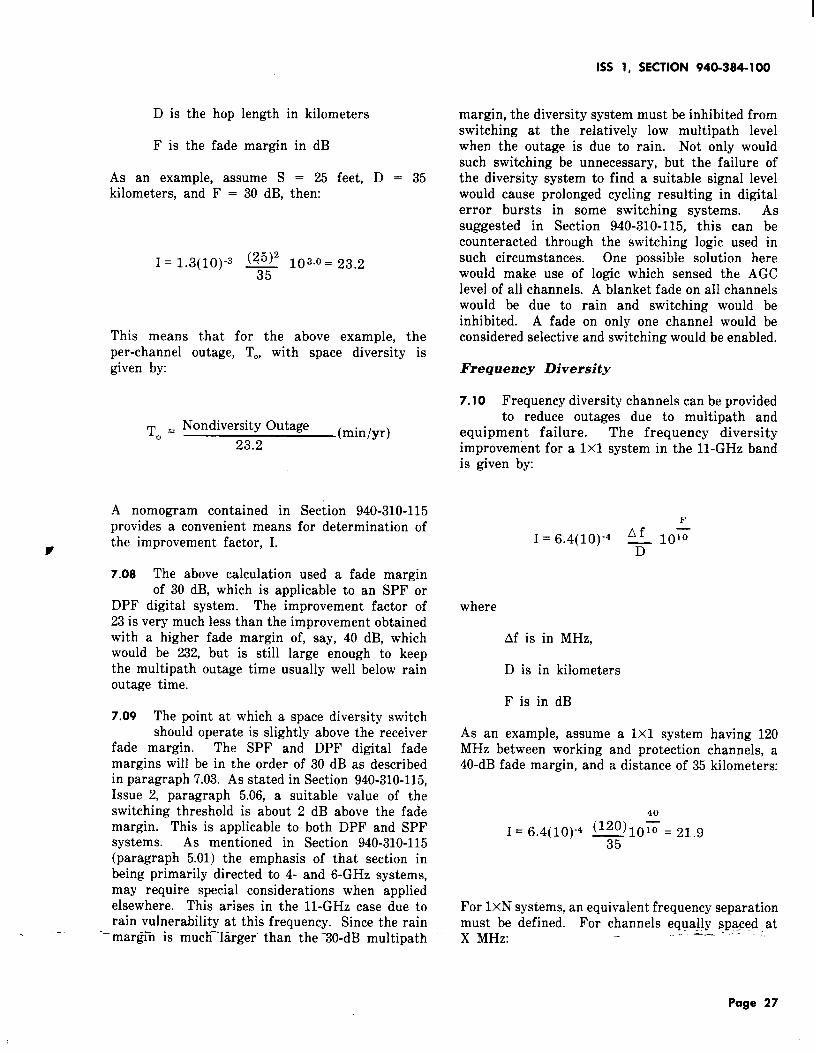
D is the hop length in kilometers
F is the fade margin in dB
As an example, assume S = 25 feet, D = 35kilometers, and F = 30 dB, then:
I= 1.3(10 )-3 ~ 103.0= 23+235
This means that for the above example, theper-channel outage, TO, with space diversity isgiven by
TO = Nondiversity Outage (min/yr)23.2
A nomogram contained in Section 940-310-115provides a convenient means for determination ofthe improvement factor, I.
r
7.08 The above calculation used a fade marginof 30 dB, which is applicable to an SPF or
DPF digital system. The improvement factor of23 is very much less than the improvement obtainedwith a higher fade margin of, say, 40 dB, whichwould be 232, but is still large enough to keepthe multipath outage time usually well below rainoutage time.
7.o9 The point at which a space diversity switchshould operate is slightly above the receiver
fade margin. The SPF and DPF digital fademargins will be in the order of 30 dB as describedin paragraph 7.03. As stated in Section 940-310-115,Issue 2, paragraph 5.06, a suitable value of theswitching threshold is about 2 dB above the fademargin. This is applicable to both DPF and SPFsystems. As mentioned in Section 940-310-115(paragraph 5.01) the emphasis of that section inbeing primarily directed to 4- and 6-GHz systems,may require special considerations when appliedelsewhere. This arises in the 11-GHz case due torain vulnerability at this frequency. Since the rain
.. ‘– marg~n is mucfi-larger than the”730-dB multipath
margin, the diversity system must be inhibited fromswitching at the relatively low multipath levelwhen the outage is due to rain. Not only wouldsuch switching be unnecessary, but the failure ofthe diversity system to find a suitable signal levelwould cause prolonged cycling resulting in digitalerror bursts in some switching systems. Assuggested in Section 940-310-115, this can becounteracted through the switching logic used insuch circumstances. One possible solution herewould make use of logic which sensed the AGClevel of all channels. A blanket fade on all channelswould be due to rain and switching would beinhibited. A fade on only one channel would beconsidered selective and switching would be enabled.
Frequency Diversity
7.10 Frequency diversity channels can be providedto reduce outages due to multipath and
equipment failure. The frequency diversityimprovement for a 1x1 system in the 11-GHz bandis given by
F
I = 6.4(10 )-4 ~f lo=T
where
Af is in MHz,
D is in kilometers
F is in dB
As an example, assume a 1x1 system having 120MHz between working and protection channels, a40-dB fade margin, and a distance of 35 kilometers:
40
I = 6.4(10 )-4 &&)lO~ = 21.9
For lxN systems, an equivalent frequency separationmust be defined. For channels equa~l~ spaced atX MHz:
. .. ..
Page 27

SECTION 940-384-100
.__. . .. .-.: >’..- --
Afq = N 7.11 “ While frequency diversi&can be successfully
N+ N+ NQ+. ..-+~applied to analog SPF systems, its application
x 2x 3x NX to digital systems results in little advantage. Whenthe fade margin is reduced to 30 dB, and appliedto the 1x3 system which previously yielded animprovement of 15.2, we find that the improvement
For example, a 1x3 system with X = 120 MHz, drops by an order of magnitude:yields an equivalent separation of 83 MHz
Af =3
eq = 83 MHz&+2+A
120 240 360
Substitution of 83 MHz in the improvement formulagives:
I = 6.4(10)–4 ~ 10400 = 15.2
If the channels should be unequally spaced, Af,~ isfound as follows:
Af = Nw nl nz + ‘3, etc.
—+— —
xl X2 X3
where nl is the number of channels separated byxl MHz, nz the number separated by Xz MHz, etc.
Example: 1x3 system with channels spaced 80,160 and 80 MHz
For the usual number of hops in short-haul radiosystems, a valid approximation is that the multihopsystem outage is equal to the sum of that calculatedfor each hop.
F
[1-1 = 6.4(10)–4 ‘+ 1010= 1.52
for
F=30dB
Af = 83 MHz
D = 35 kilometers
It happens that this value is outside of the range(I > 10) where the improvement formula is a goodapproximation. For I <10, the actual improvementwill be somewhat larger than given by the formula,but it is clear that a 1x3 frequency diversity systemprovides only a modest improvement for multipathoutages. For digital systems, the combination ofhigher nondiversity outage and reduced effectivenessof frequency diversity will make the calculatedmultipath outages significant on all but short hops.Space diversity may be needed on some or all ofthe medium to long 11-GHz hops.
8. OUTAGE DUE TO EQUIPMENT FAILURE
A. General
8.01 Modern microwave equipment incorporatingsolid-state devices is characterized by high
reliability. If, as will be assumed in this discussion,some form of equipment protection is afforded,either by hot standby or lXN frequency diversity,outage time due to equipment failure will be smallwhen compared to 11-GHz propagation outages.As will be recalled from the discussion in paragraph5.02, enhanced reliability can be a contributingfactor in the conclusion that previous fixedapportionments of total outage in terms of propagationand equipment failure are not applicable to 11GHz. If, however, this enhanced reliability cannot
Page 28

1SS 1, SECTION 940-384-100
be reasonably expected, the apportionment should is 5 x 0.2 = 1.0 per year. The outage probabilitybe reconsidered. thus becomes:
B. Calculation1.0 Failure/Yr. X 4 hr. time to repair = 4 6X ~o_ ~
8.02 The expected value of per-channel outage 24 hr{day X 365 days{yr.time (T~) for a protected system can be
approximated by
TE=% (pE)’2
where
N = the number of working channels
P~ = probability of outage of one channel
P~ is, in turn, determined from the expected meantime between failure (MTBF) and anticipated meantime to repair for each transmit-receive panel. Ifwe assume that each T/R panel has a mean timebetween failure of five years, the expected number
Fof channel failures = l/MTBF or 0.2 failures peryear. If the mean time to repair is four hours,the per-panel outage probability is:
0.2 x 4 = 9.1 x 10–524X 365
Based on the above, it can be seen that the T~ fora 1Xl hot standby system is simply (P~) z for asingle transmitter-receiver unit. For a lxNfrequency diversity system of one or more hops,N is the number of working channels and P~ isthe probability of failure in one of the channels.
8.03 As an example, consider a 5-hop system(five T/R panels in a one-way channel)
protected by frequency diversity. First for thedetermination of P~, we will again assume afive-year MTBF and total time to repair averagingfour hours. Here, the expected number of channel
‘__failui& per yeai-[~ l/M’I’BF X number of panels]
A 1x3 system will have:
TE = 2(PE )2 = 4.2 X 10⁻⁷ or 0.2 minutes/yr.(one-way)
A 1x1O system will have:
T~ = ~ (PE )2 = 1.1 X 10⁻⁶ or 0.6 minutes/yr.
‘2 (one-way)
At 0.6 minutes per year, it takes 200 years toaccumulate 120 minutes (2 hours). For 2-waychannels
MTBF (2-way) = ~[2;.:01
=100 years
With ten 2-way working channels,the route will have an equipment10 years.
one channel inoutage once in
8.04 It is important to note that this analysisassumes that the MTBF of the protection
switch is much larger than the T/R panels, andthat all T/R panel equipment failures. ca.yse,regu~ststo the switching system for protection: Also, local
Page 29
SKTION 940-384-100
exptien&e%hcXild be relied upon to determine theoutage time impact of craft errors.
9. SUMMATION AND CALCULATION OF OUTAGE
A. Introduction and System Description
9.01 The dominant outages for 11-GHz radiosystems result from rain, multipath, and
equipment failure, each of which has now beenelaborated upon. It yet remains to summarize theseseparate outages to arrive at an overall outagefigure for the particular system under examination.This final outage value is to be compared withthe annual outage objective to determine itsacceptability or the need for additional systemimprovements. In this part, a summary demonstrationwill be used to arrive at this final value of outagetime, thus exemplifying the methodology of Parts6, 7, and 8 through application to a representativesystem. Included here will be an analysis of spacediversity as will be found necessary in meetingthe outage objective.
9.02 The system used in this example will bethe same 4-hop system described in Part 6
(see Fig. 10) in conjunction with rain outage. Asmay be recalled, this was a light route (2000 voicecircuits) DPF system having an overall route lengthof 113 kilometers or 70 miles. The annual 2-wayoutage objective for a route of this length (ascovered in paragraph 5.01) is: 70/250 x 105 min.= 29.4 minutes per year. (Using kilometers, theratio becomes 113/402 X 105 min.) Equipmentprotection will be provided by frequency diversity,resulting in a 1x3 configuration for this 4-hopsystem. (Here, the use of frequency diversityresults from the need to provide lXN equipmentprotection. Since it will not be switched formultipath outage, it does not enter the selectivefading calculations.)
9.o3 The resultant outage time as herein calculatedwill be found to be as follows
Rain Outage Time: 4 hops 24.2 min
Multipath Outage: 4 hops 3.8 min
Equipment Outage: 4 hops 0.3 min(1X3) —
Total: 28.3 min
- It is important to note that -the outage ebjective - --as well as the calculated outage time is stated interms of a 2-way channel. Since both multipathand equipment outages in the two directions areusually independent events, the calculated outagefor a one-way channel must be doubled and thenadded to the rain outage. Rain outage is directly‘calculated as a 2-way outage. As can be seenabove, the total calculated outage time of 28.3minutes for the final adjusted system falls justwithin the 29.4-minute outage objectives.
9.o4 In this example, the summation will be madeover the four hops. This assumes that the
system had no intermediate droppicg points. Whenthere are dropping points, the summation of outagetimes should be done separately for each pair ofdropping points, and then combined to find theend-to-end total. (If channels are dropped oradded along the route, the value of N as used inthe calculation of equipment outage will change,resulting in T~ changes. ) .
B. Procedure
Rain Attenuation Margin and Outage
9.o5 The determination of rain outage is dependenton the value of the hop fade margin (F)
from which the rain margin (M) will be derived.In DPF systems, the fade margin (F) will bereduced by three allowances: wet radome,interference, and depolarization. The resultantrain attenuation margin in conjunction with hoplength will then yield outage time when applied tothe appropriate rain outage chart. To illustratethe use of equations (1) and (2) of Part 3 [as wellas equation (3) of Part 6] the rain attenuationmargin will be first calculated. For this, thefollowing are given:
(a) Light route DPF system: 4 hops as inFig. 10
(b) G~A = G~A = 48.3 dB
(c) 180 feet waveguide in each section, LWG=6.1 dB
(d) SG = 112 dB
(e) 11-GHz-only system, L~W~o~= 0.5 dB
Page 30
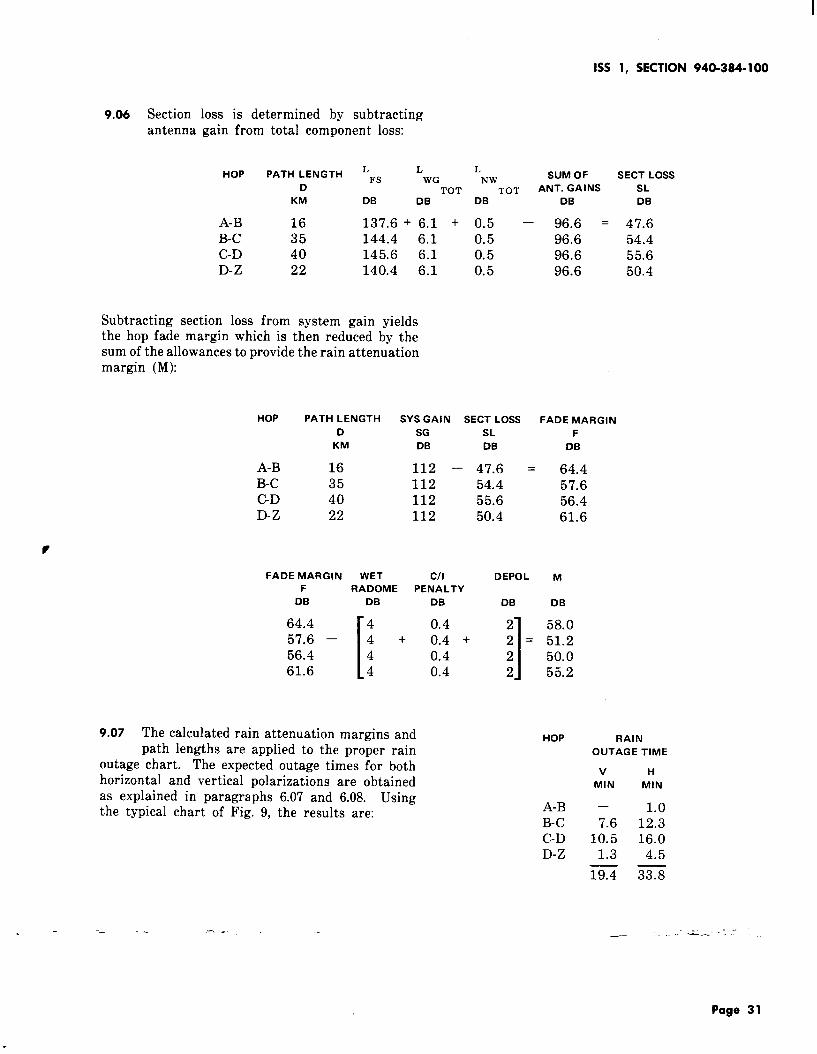
1SS 1, SECTION 940-384-100
9.06 Section loss is determined by subtractingantenna gain from total component loss:
HOP PATH LENGTH ‘F~L L
WG Nw SUM OF SECT LOSS
D TOT TOT ANT. GAINS SL
KM DB DB DB DB DB
A-B 16 137.6 + 6.1 + 0.5 – 96.6 = 47.6B-c 35 144.4 6.1 0.5 96.6 54.4CD 40 145.6 6.1 0.5 96.6 55.6D-Z 22 140.4 6.1 0.5 96.6 50.4
Subtracting section loss from system gain yieldsthe hop fade margin which is then reduced by thesum of the allowances to provide the rain attenuationmargin (M):
HOP PATH LENGTH SYS GAIN SECT LOSS FADE MARGIN
D SG SL F
KM DB DB DB
A-B 16 112 – 47.6 = 64.4B-C 35 112 54.4 57.6CD 40 112 55.6 56.4D-Z 22 112 50.4 61.6
FADE MARGIN WET Cll
F RADOME PENALTY
DB DB DB
64.4
[
4 0.457.6 – 4 + ().4 +56.4 4 0.461.6 4 0.4
DEPOL M
DB DB
2
158.0
2 = 51.22 50.02 55.2
9.o7 The calculated rain attenuation margins andpath lengths are applied to the proper rain
outage chart. The expected outage times for bothhorizontal and vertical polarizations are obtainedas explained in paragraphs 6.07 and 6.08. Usingthe typical chart of Fig. 9, the results are:
HOP
A-BB-CC-DD-Z
RAIN
OUTAGE TIME
v H
MIN MIN
— 1.07.6 12.3
10.5 16.01.3 4.5
==
.. — -- ,..-.. —
Page 31

I
SECTION 940-384-100
The_ +gital. system ig expected to grow to a 1x3configuration on two frequencies (dual polarized). “’A good polarization pattern to equalize outagetimes is:
-- - ti. - -- —--- .
HOP CH 1 CH 2 CH 3 PROT
POL OUTAGE POL OUTAGE POL OUTAGE POL OUTAGE
A-B V – v– H 1.0 H 1.0B-C H 12.3 v 7.6 v 7.6 H 12.3C-D V 10.5 H 16.0 v 10.5 H 16.0D-Z V 1.3 v 1.3 H 4.5 H 4.5
Total 24.1 min 24.9 min 23.6 min 33.8 min
The average rain outage for the three workingchannels is 24.2 minutes.
Equipment Outage
9.08 Rain outage is directly calculated as a 2-wayoutage. Equipment outage, which is computed
on a one-way basis, must therefore, be doubled toconform to the 2-way annual objective. We havehere a 4-hop system with three working channels.If each T/R panel has a MTBF of five years, andthe time to repair is four hours, we have for aone-way channel the following probability
~~ = (# of HOPS) ~ Time to Repair
MTBF Hours/year
.*X 4 = 3.7(10 )-45 24 X 365
For a 1x3 system:
~ (PE)’ = 2 [(3.7) (10)-4] 2~~=N+l
= 2.7 (10)-7 years
This is equivalent to:
0.14 minutes per year (one-way)
Multipath Outage
9.o9 The nondiversity multipath outage must nowbe determined for each hop. As with
equipment outage, the one-way value must bedoubled prior to outage summation for the fourhops. Since this is a digital DPF system, outagetime must be determined from the curve of Fig. 11(see paragraph 7.06) which represents the bestapproximation at the time of this writing.
9.10 The nondiversity, one-way multipath outageobtained from Fig. 11 is that for average
terrain and climatic conditions, i.e., c = 1.0. Forthis system, average humidity will be assumed, butthe four hops will have terrain roughness factorsof 80, 100, 120, and 90. (See tabulation below.)The c factor for each hop is calculated as describedin paragraph 7.06, and the c = 1 value of outageobtained from the Fig. 11 curve is multiplied bythis new value to yield the adjusted one-way outage.The respective values are then doubled to 2-wayoutage and totaled to yield annual outage in minutesper year. The results of this computation aresummarized in the following table:
D
HOP KM
A-B 16B-C 35C-D 40D-Z 22
w
80100120
90
1-WAY~=1
‘n MIN
0.54 1.60.41 50.00.32 93.00.47 6.0
Total
2-WAY
OUTAGE
MIN
1.741.059.5
5.6
107.8 rein/year
or
0.3 minutes per year (2-way)
Page 32
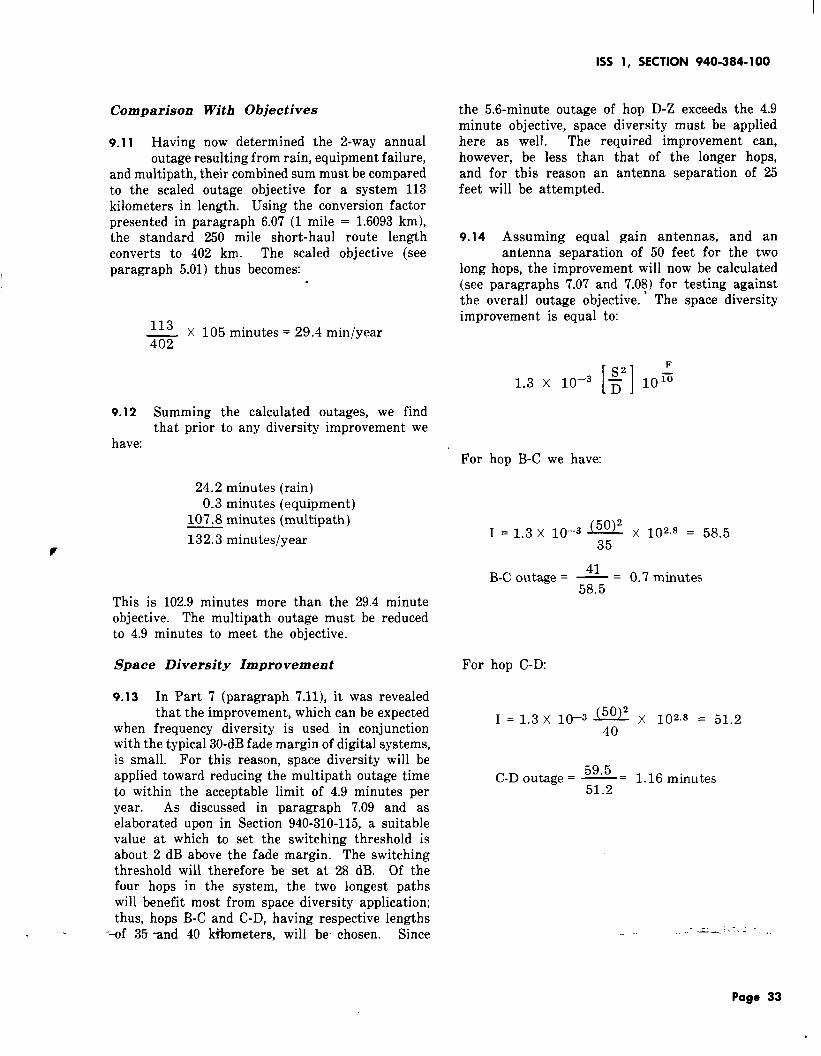
1SS 1, SECTION 940-384-100
Comparison With Objectives
9.11 Having now determined the 2-way annualoutage resulting from rain, equipment failure,
and multipath, their combined sum must be comparedto the scaled outage objective for a system 113kilometers in length. Using the conversion factorpresented in paragraph 6.07 (1 mile = 1.6093 km),the standard 250 mile short-haul route lengthconverts to 402 km. The scaled objective (seeparagraph 5.01) thus becomes:
,
113 X 105 minutes = 29.4 min/vear
9.12
have:
the 5.6-minute outage of hop D-Z exceeds the 4.9minute objective, space diversity must be appliedhere as well. The required improvement can,however, be less than that of the longer hops,and for this reason an antenna separation of 25feet will be attempted.
9.14 Assuming equal gain antennas, and anantenna separation of 50 feet for the two
long hops, the improvement will now be calculated(see paragraphs 7.07 and 7.0~) for testing againstthe overall outage objective. The space diversityimprovement is equal to:
402,.
Summing the calculated outages, we findthat prior to any diversity improvement we
24.2 minutes (rain)0.3 minutes (equipment)
107.8 minutes (multipath)
132.3 minutes/year
For hop B-C we have
I = 1.3 X 10–3 w X 102.8 = 58.535
41B-C outage = — = 0.7 minutes
58.5This is 102.9 minutes more than the 29.4 minuteobjective. The multipath outage must be reducedto 4.9 minutes to meet the objective.
Space Diversity Improvement
9.13 In Part 7 (paragraph 7.11), it was revealedthat the improvement, which can be expected
when frequency diversity is used in conjunctionwith the typical 30-dB fade margin of digital systems,is small. For this reason, space diversity will beapplied toward reducing the multipath outage timeto within the acceptable limit of 4.9 minutes peryear. As discussed in paragraph 7.09 and aselaborated upon in Section 940-310-115, a suitablevalue at which to set the switching threshold isabout 2 dB above the fade margin. The switchingthreshold will therefore be set at 28 dB. Of thefour hops in the system, the two longest pathswill benefit most from space diversity application;thus, hops B-C and C-D, having respective lengths
‘--of 35 and 40 kilometers, will be- chosen. Since
For hop C-D:
I = 1.3 X 10–s ~ X 10Z.8 = 51.2
59.5C-D outage = —= 1.16 minutes
51.2
.—
Page 33

.
SECTION 940-384-100
For, hop_QzZ:.---- .“”
I= 1.3 X 10⁻³ & X 102.8 = 23.26
56D-Z outage = - = 0.24 minutes
23.26
Summation and Final Evahzatlon.
9.15 The new multipath outage is:
HOP
A-B 1.7B-C 0.7C-D 1.16D-Z ~
3.8 minutes
Combining this new value of outage with thepreviously determined outages for rain and equipmentfailure results in a total outage from all causes of
Rain 24.2 minutesEquipment 0.3 minutesMultipath 3.8 minutes
28.3 minutes/year
The objective for this system of 29.4 minutes peryear is just met.
10. INTERFERENCE CONSIDERATIONS
A. Overview and Definitions
Ratlonale
10.01 As noted in the introduction of this section,the determination of outage time is dependent
on a knowledge of the hop fade margin. Thetheoretical fade margin (F) having a thermal noisecriterion and predicted from equation (3) of Part 6is unrealistic in being excessively high. To arriveat a practical and therefore valid fade margin,allowances are made as necessary to account forthe deleterious effects of wet radome loss,depolarization, and the existence of interference.
The wet radome and depolarizat~n allowances weLe .respectively quantified at 4 and, for DPF systems,2 dB. The allocation for interference is not soeasily disposed of. In this part, the rationale andprocedure for determination of interference budgetswill be discussed. The purpose of the interferencebudget is essentially the same as the previousallowances in preserving the integrity of the fademargin.
Analog and D~gltal Systems
10.02 The interference coordination for digitalsystems is quite different from that of
analog systems. In analog systems, in which noisewill be cumulative, the carrier-to-interference (C/1)objectives are set to limit the interference noiseto a specific amount per exposure so as to providethe required noise performance under non fadedconditions. Since in analog systems, only a smallportion of the total noise originating in a hop isallocated to interference sources, the interferenceis always below the normal thermal and cross-modulationnoise. The determination and use of analog C/Iobjectives is discussed in Section 940-330-104, whilethe C/I objectives for 11-GHz analog systems arecontained in Section 940-330-140. In all cases, themost recent objectives as represented in engineeringletters or as contained in the available computerprogram should be used.
10.03 Unlike analog systems, digital systems,which are regenerative, will have essentially
error free performance during non faded conditions.For deep fades, however, the performance degradesrapidly as the signal-to-noise ratio nears the outagepoint. Hence, the design of a digital system isdominated by the error performance near and atthe outage point. In contrast to analog systems,and depending on the magnitude and degree ofcorrelation between the fading of the carrier andthe interference, digital systems will frequently bedesigned to allow interferences during non fadedperiods to exceed the thermal noise in a hop.
The Interference Budget
10.04 To arrive at an interference budget, thepossible interference must be identified as
to type (source) and category, i.e., whether theinterference fades with the carrier, remains fixed,or is only partially correlated with carrier fading.The interference in these three categories must beitemized, quantified, and an allowance for each
Page 34
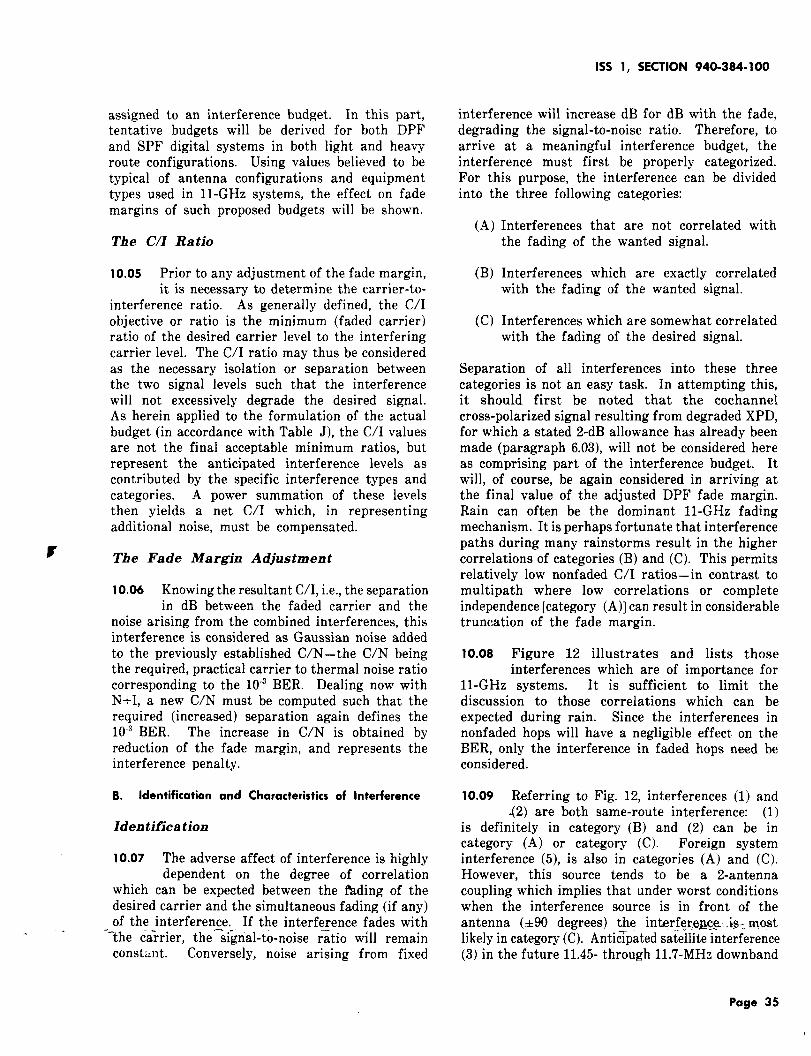
1SS 1, SECTION 940-384-100
assigned to an interference budget. In this part,tentative budgets will be derived for both DPFand SPF digital systems in both light and heavyroute configurations. Using values believed to betypical of antenna configurations and equipmenttypes used in 11-GHz systems, the effect on fademargins of such proposed budgets will be shown.
The C/I Ratio
10.05 Prior to any adjustment of the fade margin,it is necessary to determine the carrier-to-
interference ratio. As generally defined, the C/Iobjective or ratio is the minimum (faded carrier)ratio of the desired carrier level to the interferingcarrier level. The C/I ratio may thus be consideredas the necessary isolation or separation betweenthe two signal levels such that the interferencewill not excessively degrade the desired signal.As herein applied to the formulation of the actualbudget (in accordance with Table J), the C/I valuesare not the final acceptable minimum ratios, butrepresent the anticipated interference levels ascontributed by the specific interference types andcategories. A power summation of these levelsthen yields a net C/I which, in representingadditional noise, must be compensated.
F The Fade Margin Adjustment
10.06 Knowing the resultant C/I, i.e., the separationin dB between the faded carrier and the
noise arising from the combined interferences, thisinterference is considered as Gaussian noise addedto the previously established C/N–the C/N beingthe required, practical carrier to thermal noise ratiocorresponding to the 10-3 BER. Dealing now withN+I, a new C/N must be computed such that therequired (increased) separation again defines the10-s BER. The increase in C/N is obtained byreduction of the fade margin, and represents theinterference penalty.
B. Identification and Characteristics of Interference
Identification
10.07 The adverse affect of interference is highlydependent on the degree of correlation
which can be expected between the fhding of thedesired carrier and the simultaneous fading (if any)of the interference. If the interference fades with
‘–the ia>rier, the s~gnal-to-noise ratio will remainconstunt. Conversely, noise arising from fixed
interference will increase dB for dB with the fade,degrading the signal-to-noise ratio. Therefore, toarrive at a meaningful interference budget, theinterference must first be properly categorized.For this purpose, the interference can be dividedinto the three following categories:
(A) Interferences that are not correlated withthe fading of the wanted signal.
(B) Interferences which are exactly correlatedwith the fading of the wanted signal.
(C) Interferences which are somewhat correlatedwith the fading of the desired signal.
Separation of all interferences into these threecategories is not an easy task. In attempting this,it should first be noted that the cochannelcross-polarized signal resulting from degraded XPD,for which a stated 2-dB allowance has already beenmade (paragraph 6.03), will not be considered hereas comprising part of the interference budget. Itwill, of course, be again considered in arriving atthe final value of the adjusted DPF fade margin.Rain can often be the dominant 11-GHz fadingmechanism. It is perhaps fortunate that interferencepaths during many rainstorms result in the highercorrelations of categories (B) and (C). This permitsrelatively low nonfaded C/I ratios— in contrast tomultipath where low correlations or completeindependence [category (A)] can result in considerabletruncation of the fade margin.
10.08 Figure 12 illustrates and lists thoseinterferences which are of importance for
11-GHz systems. It is sufficient to limit thediscussion to those correlations which can beexpected during rain. Since the interferences innonfaded hops will have a negligible effect on theBER, only the interference in faded hops need beconsidered.
10.09 Referring to Fig. 12, interferences (1) and.(2) are both same-route interference: (1)
is definitely in category (B) and (2) can be incategory (A) or category (C). Foreign systeminterference (5), is also in categories (A) and (C).However, this source tends to be a 2-antennacoupling which implies that under worst conditionswhen the interference source is in front of theantenna (+90 degrees) the interfer~~~e .is~wc@likely in category (C). Anticipated satelhte interference(3) in the future 11.45- through 11.7-MHz downband
Page 35

SECTION 940-384-100
.:-:,. --— .-”” ‘
------ 3--
‘\-*.
.------~
(-.. “y31UWL 5 ~
‘\ .. 1. \
R
1. WE 3EC710N2. WCES7 SECTIOS3. 3ATELLITE4. .SMCTI(IN5. FUIEIQNSYSTEM6. OvEmACH7. REFLECTILM8. WACENT -L
—--- +---z #.------—- - /-- ./ 77 .,”
6
“%. 1>. \
,g&--f#ll Mu,”- -.--- /0
.-~
A
/ R
‘R // ,/4
Fig. 12— Interferences in
(satellite to earth link) will tend to be closer tocategory (B) than to (A). Propagation tests currentlyin progress should add considerable information tothe correlation between space and terrestrial paths.Interferences from overreach (6) and reflections (7)are in category (B) while junction sources are incategory (C). Adjacent channel (8) is (B) or (C).
Characteristics and Assumptions
10.10 Before an interference budget for digitalsystems can be suggested, it is necessary
to review certain characteristics and make additionalassumptions related to system features andperformance. It is known, for example, that incontrast to analog systems, the interference noisearising in a hop can, in certain instances, be allowedto exceed the nominal thermal noise. Here, theAGC action of the receiver, in attempting to restorethe nominal level of a faded signal, will actdifferently on various interference types depending
,- 4 --—-
/
7 ,/- ,~’-/,/f
//’ o,~,0
~,/
T
11-GHz Radio Systems
I
on the category of correlation. Thus, the fadedepth at which the hop reaches an unacceptableBER may be equal to the nominal fade marginwithout interference [as can happen in categories(B) and (C), in which case interference can actuallyexceed the hop thermal noise]. It may also beslightly less than the nominal fade margin, or canoccur at the level of a significantly reduced fademargin in the case of category (A). Regardingthis from a converse perspective, insight can beobtained as to the interference objectives withrespect to a non faded carrier The non fadedinterference objectives are found by increasing thefaded C/Is given in the interference budget bysome fraction of the hop fade margin (F), whichwill be a variable as calculated for each hop. Thenon faded values of the interferences in category(A) will be equal to their faded carrier values plusthe full fade margin (since the AGC can, under adeep fade, raise their level by this amount). Thenonfaded values of the category (C) interferences
Page 36
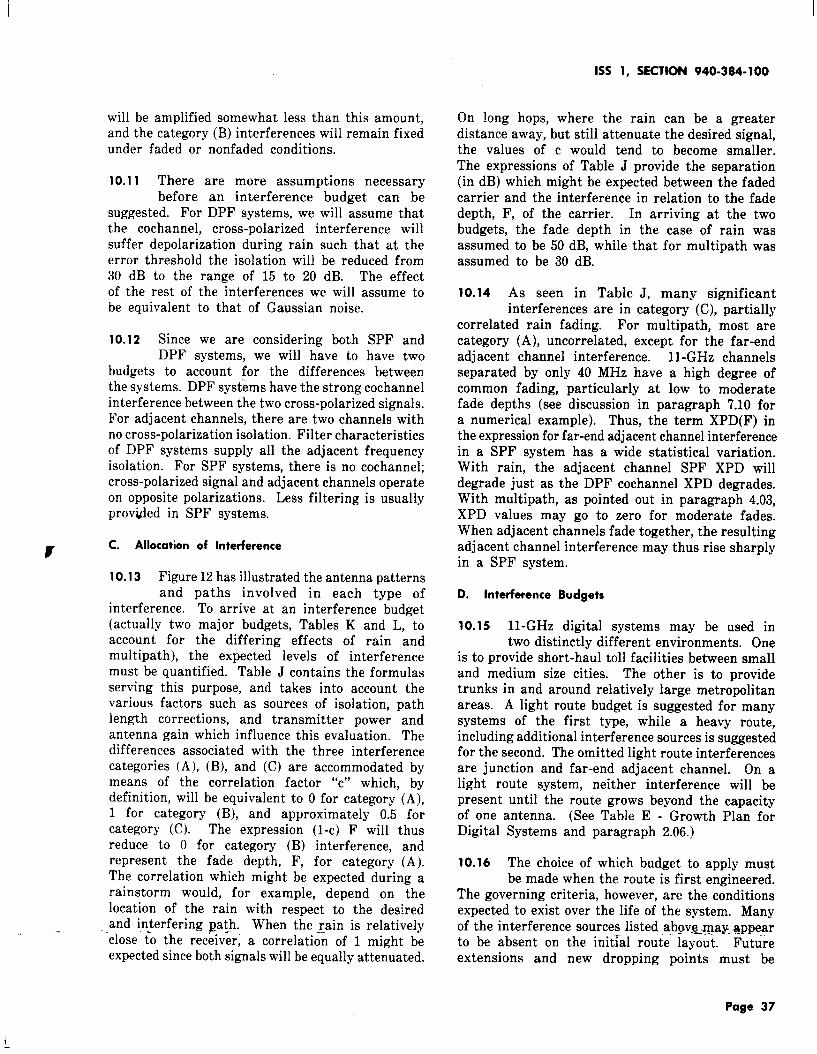
1SS 1, SECTION 940-384-100
will be amplified somewhat less than this amount,and the category (B) interferences will remain fixedunder faded or non faded conditions.
10.11 There are more assumptions necessarybefore an interference budget can be
suggested. For DPF systems, we will assume thatthe cochannel, cross-polarized interference willsuffer depolarization during rain such that at theerror threshold the isolation will be reduced from30 dB to the range of 15 to 20 dB. The effectof the rest of the interferences we will assume tobe equivalent to that of Gaussian noise.
10.12 Since we are considering both SPF andDPF systems, we will have to have two
budgets to account for the differences betweenthe systems. DPF systems have the strong cochannelinterference between the two cross-polarized signals.For adjacent channels, there are two channels withno cross-polarization isolation. Filter characteristicsof DPF systems supply all the adj scent frequencyisolation. For SPF systems, there is no cochannel;cross-polarized signal and adjacent channels operateon opposite polarizations. Less filtering is usuallyprovi#ed in SPF systems.
FC. Allocation of Interference
10.13 Figure 12 has illustrated the antenna patternsand paths involved in each type of
interference. To arrive at an interference budget(actually two major budgets, Tables K and L, toaccount for the differing effects of rain andmultipath), the expected levels of interferencemust be quantified. Table J contains the formulasserving this purpose, and takes into account thevarious factors such as sources of isolation, pathlength corrections, and transmitter power andantenna gain which influence this evaluation. Thedifferences associated with the three interferencecategories (A), (B), and (C) are accommodated bymeans of the correlation factor “c” which, bydefinition, will be equivalent to O for category (A),1 for category (B), and approximately 0.5 forcategory (C). The expression (l-c) F will thusreduce to O for category (B) interference, andrepresent the fade depth, F, for category (A).The correlation which might be expected during arainstorm would, for example, depend on thelocation of the rain with respect to the desiredand interfering Ea!h. When the Zain is relatively
‘close ~o the receiver, a correlation of 1 might beexpected since both signals will be equally attenuated.
On long hops, where the rain can be a greaterdistance away, but still attenuate the desired signal,the values of c would tend to become smaller.The expressions of Table J provide the separation(in dB) which might be expected between the fadedcarrier and the interference in relation to the fadedepth, F, of the carrier. In arriving at the twobudgets, the fade depth in the case of rain wasassumed to be 50 dB, while that for multipath wasassumed to be 30 dB.
10.14 As seen in Table J, many significantinterferences are in category (C), partially
correlated rain fading. For multipath, most arecategory (A), uncorrelated, except for the far-endadj scent channel interference. 11-GHz channelsseparated by only 40 MHz have a high degree ofcommon fading, particularly at low to moderatefade depths (see discussion in paragraph 7.10 fora numerical example). Thus, the term XPD(F) inthe expression for far-end adjacent channel interferencein a SPF system has a wide statistical variation.With rain, the adjacent channel SPF XPD willdegrade just as the DPF cochannel XPD degrades.With multipath, as pointed out in paragraph 4.03,XPD values may go to zero for moderate fades.When adjacent channels fade together, the resultingadj scent channel interference may thus rise sharplyin a SPF system.
D. Interference Budgets
10.15 11-GHz digital systems may be used intwo distinctly different environments. One
is to provide short-haul toll facilities between smalland medium size cities. The other is to providetrunks in and around relatively large metropolitanareas. A light route budget is suggested for manysystems of the first type, while a heavy route,including additional interference sources is suggestedfor the second. The omitted light route interferencesare junction and far-end adj scent channel. On alight route system, neither interference will bepresent until the route grows beyond the capacityof one antenna. (See Table E - Growth Plan forDigital Systems and paragraph 2.06.)
10.16 The choice of which budget to apply mustbe made when the route is first engineered.
The governing criteria, however, are the conditionsexpected to exist over the life of the system. Manyof the interference sources listed abpv~-~ay...app~rto be absent on the initfal route layout. Futureextensions and new dropping points must be
Page 37

SECTION 940-384-100
.- ..-—. - . .. :.-”.....TABLE J
— .—— . -- -—- ..
INTERFERENCE EXPRESSIONS
c/1 FADINGCATEGORYTYPE OF INTERFERENCE DURING FADE RAIN
Cochannel1. Same Section Rfi-(l-c)F B
2. Adjacent Rfi+DCO,-(l-c)F c
3. Satellite D,–(l-c)F+PCO, B
4. Junction D,+ DCO,–(l-C)F+PCO, c
5. Foreign System D,+ DZ+DCO,–(l-C)F+ PCO, c
6. Overreach DOV+DCO,–(l-C)F B
7. Reflections D,+ DCO,–(l-C)F cAdjacent Channel (~ 40 MHz–two interferers)8a. DPF L~–(1-c)F B8b. SPF L~–(1-c)F+XPD(F) B
Definitions of terms (see also Fig. 12)
MULTIPATH
A
A
A
A
A
A
A
Bor CBor C
c = Fade correlation function. By definition, c=O for category A and c=l for category B. Correlation ofcategory C interferences vary, being generally close to 0.5.
Rfi = Front-to-back ratio of one antenna
F = Fade depth. To include the 4-dB wet radome loss for rain, replace (1-c)F by (1-c)F-4.
DDin@ti,r,nC~
cm = Path length correction = 20 log
Dwanted
D, = Discrimination receiving antenna to off-axis signals (azimuth or elevation)
Signal P~G~Pm, = Power correction = 10 log
Interference P~G~
= complex factor for satellites
Dz = Discrimination of transmitting antenna (off-axis)
DOV= Combined discrimination of transmitting and receiving antennas involved in overreach path
L~ = Filter discrimination to two adjacent channels
XPD(F) = XPD variation as function of fade depth, F.
Page 38
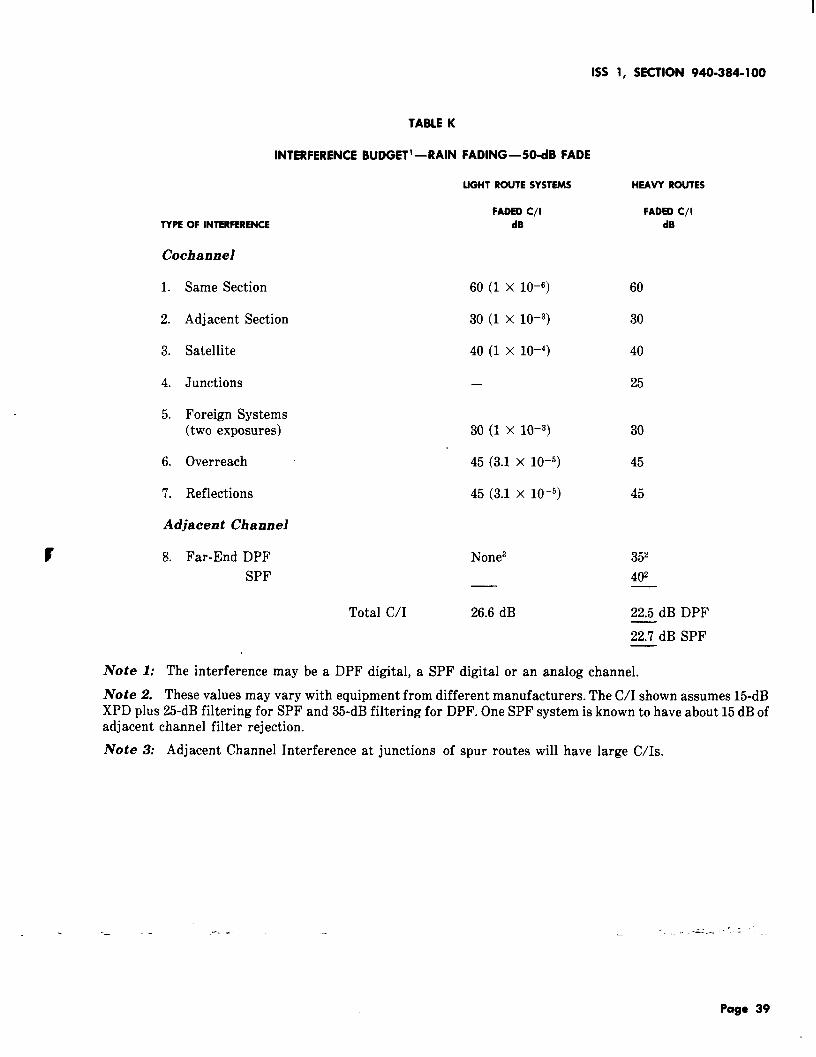
1SS 1, SECTION 940-384-100
TABLE K
INTERFERENCE BUDGET1 —RAIN
TYPE OF INTERFERENCE
Cochannel
1. Same Section
2. Adjacent Section
3. Satellite
4. Junctions
5. Foreign Systems(two exposures)
6. Overreach
7. Reflections
Adjacent Channel
8. Far-End DPF
SPF
Total C/I
FADING—50-dB FADE
LIGHTROUTESYSTEMS
FADEDC/lclB
60 (1 X 10⁻⁶)
30(1x 10⁻³)
40(1x 10-’)
—
30(1x 10-’)
45 (3.1 x 10⁻⁵)
45 (3.1 x 10⁻⁵)
None3
26.6 dB
HEAW ROUTES
FADED C/l
dB
60
30
40
25
30
45
45
352
4CP
22.5 dB DPF
22.7 dB SPF
lVote 1: The interference may be a DPF digital, a SPF digital or an analog channel.
lVote 2. These values may vary with equipment from different manufacturers. The C/I shown assumes 15-dBXPD plus 25-dB filtering for SPF and 35-dB filtering for DPF. One SPF system is known to have about 15 dB ofadjacent channel filter rejection.
JVote 3: Adjacent Channel Interference at junctions of spur routes will have large C/Is.
— -- .- - . ....’ ----..’”- ~ “.-
Page 39
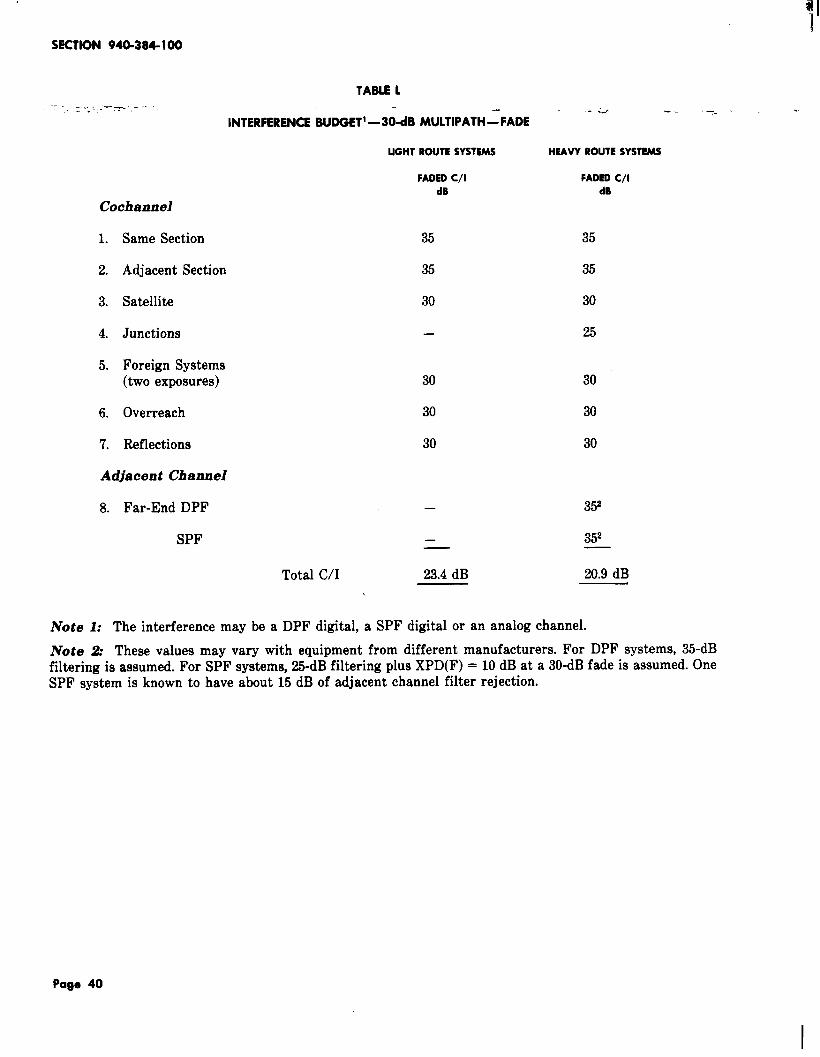
SECTION 940-384-100
. ------- ---;.-. . .--
TABLE L
INTERFERENCE BUDGET1 —30dB MULTIPATH=FADE-2 --.—e -
UGHT ROUTE SYSTEMS HEAW ROUTE SYSTEMS
FADED C/l FADED C/l
dB dB
Cochannel
1. Same Section
2. Adjacent Section
3. Satellite
4. Junctions
5. Foreign Systems(two exposures)
6. Overreach
7. Reflections
Adjacent Channel
8. Far-End DPF
SPF
35
35
30
—
30
30
30
35
35
30
25
30
30
30
— 3/Y
— 3P
Total C/I 23.4 dB 20.9 dB
Note 1: The interference may be a DPF digital, a SPF digital or an analog channel.
Note 2: These values may vary with equipment from different manufacturers. For DPF systems, 35-dBfiltering is assumed. For SPF systems, 25-dB filtering plus XPD(F) = 10 dB at a 30-dB fade is assumed. OneSPF system is known to have about 15 dB of adjacent channel filter rejection.
Page 40
1SS 1, SECTION 940-384-100
considered. The possibility of future foreign systemscannot be ruled out. The satellite allocation mustbe considered even though no satellites are currentlyoperating with 11-GHz downlinks, since 11.45 to11.7 GHz is an authorized satellite band. The oneclear criterion is the planned ultimate developmentof the particular route. If the route will not growbeyond one antenna (5 or 6 frequencies in use with1200 to 1344 VF per working frequency), light routeconditions probably apply. If that condition is notmet, the higher interference of the heavy routecase should be used in computing fade margins.A specific multihop route may have some hops,light route; and one or more hops, heavy route.This situation might arise near a major city whichis the hub of several light routes.
10.17 The proposed interference budgets for bothSPF and DPF systems are shown in Tables K
and L. Table K applies to rain fading and is basedon a 50-dB fade depth, while Table L is appropriateto multipath and assumes a 30-dB fade. It shouldbe noted that for light routes, the SPF and DPFbudgets are identical. The values appearing inthe budgets are in accordance with Table J, andrepresent the anticipated interference levels belowthe faded carrier. The total C/I represents thesum of the specific power ratios which, for the
P purpose of illustration, have been included withthe Table K light route budget. The sum in thiscase equals 2.16 X 10⁻³)and the net C/I is determinedby:
10 log 1 = 26.6 dB2.16 X 10–3
— .- -. - ——
Page 41

SECTION 940-384-100
E. Fade Margin Adjustments.-
:-:. -—~-’-”” ‘“ “.-C\N Assessment and Preliminary RainMargin
10.18 To assess the effect of interference on fademargins, assumptions must be made about
the performance of typical SPF and DPF digitalsystems. Prior to any modification of the fademargin, it is first necessary to know the level ofisolation corresponding to the 103 BER errorthreshold between the faded carrier and any noise.Although theoretical curves are available showingC/N and C/I pairs corresponding to a 10-3 BER,significant deviations from the theoretical are foundin practical, well designed systems. On the basisof thermal noise, the following final values of 16dB (DPF) and 20.5 dB (SPF) C/N separation willbe used as representative of good practice:
CONDITION FOR
10–3 B.E.R.
C/N Theoretical
1Without
C/N Practical InterferenceC/N w/1 5 dB Cocharmel XPD
In either system type, the nonfaded C/N obtainedon a typical hop might be as much as 70 dB.Thus, in interference free circumstances, one wouldestimate the DPF system to have a fade marginof 70 - 14 = 56 dB. In heavy rain, however,the XPD can degrade to 15 dB, thus reducing thefade margin by 2 dB. This is the 2-dB depolarizationallowance described in paragraph 6.03 andacknowledged again, here, in paragraph 10.07. Thisadditional 2 dB increases the 14-dB practical C/Nabove to 16 dB. Thus, our fade margin nowbecomes 70 - 16 = 54 dB. The allowance of 4dB for wet radome losses further reduces thismargin resulting in a DPF rain margin M, of70 - 16 - 4 = 50 dB, which is the rain marginprior to the reduction for the interference penalty.
10.19 The SPF system modeled above would havean interference free margin of 70 - 20.5
= 49.5 dB. With the radome allowance, M =49.5-4 = 45.5 dB.
.— ,- -r. --- —-
DPF SYSTEM SPF SYSTEM
10.5 dB 15.5dB14 dB 20.5 dB16 dB not applicable
Radome Losses
10.20 Radome losses can occur at either thetransmitter or receiver, or at both. When
treating interferences in the rain limited case, itis somewhat pessimistic, therefore, to assume carrierradome loss while ignoring a corresponding loss tothe interferences. We shall adopt this approachin the following section.
The Interference Penalty and Final RainMargin
10.21 The C/N separation without interferencewhich corresponds to the 10-3 BER was
specified in paragraph 10.18 as 16 dB for DPFsystems and 20.5 dB for SPF systems. In theinterference budgets, a total C/I was determinedrepresenting an equivalent level of noise separatedfrom the faded carrier by the amount of this net
Page 42
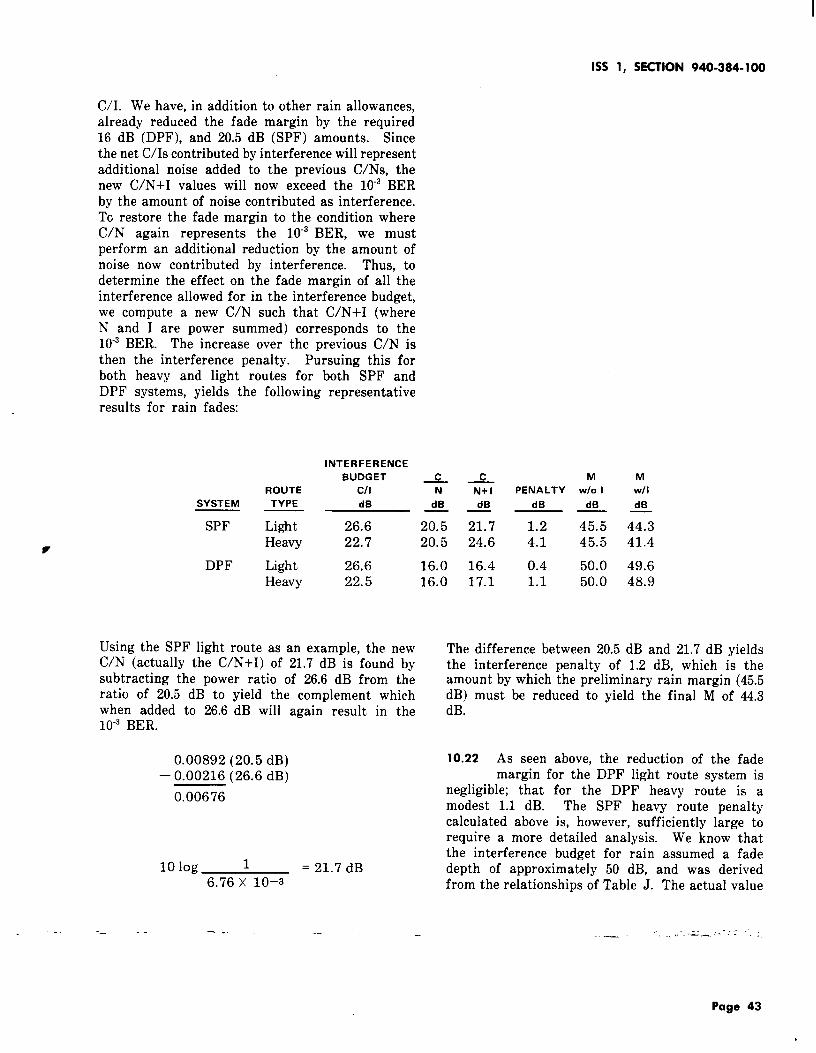
1SS 1, SKTION 940-384-100
C/I. We have, in addition to other rain allowances,already reduced the fade margin by the required16 dB (DPF), and 20.5 dB (SPF) amounts. Sincethe net C/Is contributed by interference will representadditional noise added to the previous C/Ns, thenew C/N+ I values will now exceed the 10-3 BERby the amount of noise contributed as interference.To restore the fade margin to the condition whereC/N again represents the 10-3 BER, we mustperform an additional reduction by the amount ofnoise now contributed by interference. Thus, todetermine the effect on the fade margin of all theinterference allowed for in the interference budget,we compute a new C/N such that C/N+ I (whereN and I are power summed) corresponds to the10-3 BER. The increase over the previous C/N isthen the interference penalty. Pursuing this forboth heavy and light routes for both SPF andDPF systems, yields the following representativeresults for rain fades:
INTERFERENCE
BUDGET c c M M
ROUTE Cll 7 x PENALTY W/0 I Wll
SYSTEM TYPE dB dB dB dB dB dB—. —— —.
SPF Light 26.6 20.5 21.7 1.2 45.5 44.3Heavy 22.7 20.5 24.6 4.1 45.5 41.4
DPF Light 26.6 16.0 16.4 0.4 50.0 49.6Heavy 22.5 16.0 17.1 1.1 50.0 48.9
Using the SPF light route as an example, the newC/N (actually the C/N+I) of 21.7 dB is found bysubtracting the power ratio of 26.6 dB from theratio of 20.5 dB to yield the complement whichwhen added to 26.6 dB will again result in the10-3 BER.
0.00892 (20.5 dB)– 0.00216 (26.6 dB)
0.00676
10 log 1 = 21.7 dB6.76 X 10–3
._ -- -.
The difference between 20.5 dB and 21.7 dB yieldsthe interference penalty of 1.2 dB, which is theamount by which the preliminary rain margin (45.5dB) must be reduced to yield the final M of 44.3dB.
10.22 As seen above, the reduction of the fademargin for the DPF light route system is
negligible; that for the DPF heavy route is amodest 1.1 dB. The SPF heavy route penaltycalculated above is, however, sufficiently large torequire a more detailed analysis. We know thatthe interference budget for rain assumed a fadedepth of approximately 50 dB, and was derivedfrom the relationships of Table J. The actual value
,.. -— . .. . .-= --- -- - .
Page 43

of the correlation factor (c) for the category (C)inter fe.rarwes-.af Xabb3, was 0.46. This meansthat each dB less fade will increase the faded C/Iforcategory (C)interferences by O.54dB. Applyingthis correction we have the following improvedresults for SPF systems:
INTERFERENCE
ROUTE Cfl
SYSTEM TYPE dB—.
SPF Light 29.3Heavy 25.9
10.23 Inarriving attheabove, an iterative processis used: Therain margin without interference
is 45.5 dB, which already differs from 50 dB by4.5 dB. When the further reduction for theinterference penalty is included, 45.5 will be reducedagain to some smaller number. This final, smallernumber will then represent the amount by whichthe actual rain margin differs from the initial 50-dBfade depth. For the sake of illustration andsimplicity, take the SPF light route case above,and assume that a value of 44.9 dB (which happensto be correct) was chosen as a first logical possibilityfor the final M. This now represents a 5.1-dBdifference from the original 5(J dB. Since forcategory (B) the expression (1-c)F reduces to zero,only the category (C) interferences in the budgetwill be impacted by this change. In the SPF lightroute budget, there are three such interferencesadj scent section, foreign systems, and reflections.Increasing the C/Is for these three items by 0.54x 5.1 or 2.75 dB each, a new power summationyields a net C/I of 29.3. Solving for the interferencepenalty as before, we obtain a value of 0.6 dB,which when subtracted from 45.5 yields 44.9 dlil,indicating that this first assumption was correct.
Fade Margin Adjustment for Multipath
10.24 The fade margins for both SPF and DPFdigital systems are limited to 30 dB. As
will be shown by subsequent calculation, a 30-dBfade margin already falls below the level whichwould require additional reduction. In the DPF
-. -. .- > -- .—-
C c M M
T TGi- PENALTV W/O I Wf I
dB dB dB dB dB—— ——
20.5 21.1 0.6 45.5 44.920.5 22.0 1.5 45.5 44.0
case, the isolation between a 30-dB faded carrierand the N+ I will be about 5 dB greater than therequired C/N of 16 dB specified in paragraph 10.18.Thus, there is no additional interference penaltyrequired for DPF. In the SPF case, however, theC/N+ I (particularly in the heavy route case) issufficiently close to the required C/N of 20.5 dBthat some question remains regarding its adequacy.As opposed to the established DPF fade marginof 30 dB, the need to also reduce the SPF digitalfade margin to 30 dB as a result of unforeseenmultipath distortion has become known onlyrecently—at the approximate time of this writing.Therefore, the combined effects of multipath-relateddistortion together with interference might befound to cause signal degradation at fade marginswhich only slightly exceed interference requirements.Pending additional experience, the conclusion ofSPF fade margin adequacy should be consideredwith some reservation.
10.25 The interference budget for multipath iscontained in Table L. Here, both SPF
and DPF systems are interference limited ratherthan thermal noise limited, i.e., the fade marginis almost entirely determined by the interference.At the critical point where the error rate goes to10-3,the thermal noise which, as stated in paragraph10.18 can be 70 dB below the level of the nonfadedcarrier, will be almost 20 dB below the interference.Since the Table L budget is dominated by category(A) interferences, the C/Is will change dB for dBwith increasing multipath fades.
Page 44

1SS 1, SECTION 940-384-100
10.26
budget
The following computation serves to illustratethe relationship of the multipath interferenceto a 30-dB fade margin:
INTERFERENCE
BUDGET ~ REQUIRED ADDED
30 DB FADE C/N N+l ~ FADE
ROUTE Cll 30 DE FADE 30 DE FADE N
SYSTEM
>30DB
TYPE dB dB dB dB dB—.
SPF Light 23.4 40Heavy 20.9 40
Again, taking the SPF light route as an example,the net C/I from Table L is 23.4 dB. If thethermal noise is at -70 dB, the C/N during a 30-dBfade will be 40 dB as recorded above. Powersumming 23.4 and 40 results in a C/N+ I of 23.3 dB,which is 2.8 dB greater than the required, practicalC/N of 20.5 dB. Were it not for the fact thatthe fade margin is restricted to 30 dB, this 2.8-dBsurplus could be added to the fade margin, increasingits level to 32.8 dB as shown here for illustrationonly. In the same manner, SPF heavy routecalculations provide only a fractional surplus of0.3 dB which, as previously noted, should be
F accepted as adequate with reservation. In theDPF case, the required C/N (paragraph 10.18) isreduced from the 20.5-dB SPF value to 16 dB.This allows ample separation between a 30-dBfaded carrier and the level of the N+I.
F. Digital Into Analog Interference
10.27 The coexistence of digital and analog systemsis possible. However, the interference from
a digital system into an analog system is usuallysomewhat higher than that from other analogsystems. The interference into an analog systemis dependent on the exact characteristics of thedigital system. In Table M, an attempt is made,however, to give one set of interference objectiveswhich are typical of the necessary isolation fromall 11-GHz digital systems. Since this table wascalculated to reflect all digital systems, it issomewhat generalized, but still reasonably accurate(to within about 2 dB). Software is available tocompute more accurate numbers from the spectraldensities of specific digital systems should moredetailed coordinatjo~ be desired. __— .-
23.3 20.5 2.820.8 20.5 0.3
MULTIPATH
FADE
MARGIN
dB
32.830.3
TA81E M
DIGITAL INTO ANALOG INTERFERENCE
REQUIRED NONFADED C/l (dB)
11 -GHz 20-MHZ 4D-MHZ
LNALOD SYSTEM COCHANNEL SEPARATDN SEPARATION
TL-2 67 47 20(L600)
TL-2 68 48 20(U600)
TL-2 77 58 22(1200)
TN-1 62 64 20(1200)
TN-1 66 70 30(1800)
TN-1 67 74 44(2400)
——
Page 45

SECTION 940-384-100
11. TRADEOFFS AND ANCILLARY TOPICS. .. . . . . .. .. .. —
.: -----
A. Antenncr Tradeoffs
11.01 The fade margin for an 11-GHz radio hopis defined by the equation [see Part 3 and
equations (l), (2), and (3)}
F= SG– SL=SG+GTA +GR~– L~s– Lw~TOT
–L‘TOT
where LFS is the unfaded path loss for the hoplength. Given a radio terminal pair of a particulartype, the system gain SG is fixed, while theremaining parameters G~A, GEA, %C, LNW dependon the specific antcgma and antenna feed networkchosen for the radio station. Tradeoffs betweenthe several antenna system parameters providesfor economy and flexibility in selecting componentsto achieve a given fade margin. On short hops,smaller antennas may provide adequate margin.Alternately, larger antennas may be used to avoidthe expensive (but low loss) circular guide for longwaveguide runs to provide the same margin.
B. Received Signal Power limitations
11.02 Through adjustments of antenna systemparameters [see equation (l)], or by shortening
the hop length, the fade margin can be increasedby raising the unfaded received signal power abovethe nominal received level. A limit on this procedureis imposed by system specifications for the overloadlimit on received signal power, i.e., the maximumreceived signal power level above which distortioneffects occur. The possible effect of up-fadesshould also be considered in the overload limit.
reflector radiation pattern make it undesirable foruse in congested microwwe- areas because of the-potential for interference problems. Partly becauseof this infrequent use, not much detailed informationis available on electromagnetic radiation propertiesof passive repeaters for use in microwave radiorelay systems.
Use With Space Diversity
11.04 A passive repeater not only changes thedirection of propagation of a reflected wave,
but acts as an antenna and contributes a gainproduct arising from the receive and transmitresponse patterns of the reflector. A reflector withlarge vertical aperture (large height) creates aresponse pattern with a very narrow bandwidth inthe vertical plane. (Beam-width is inverselyproportional to aperture size in the plane in whichthe beam angle is measured.) If this beam is toonarrow, service outages can occur through loss ofsignal power resulting from “beam wander”, i.e.,refractive bending effects which cause the beamcenter to be displaced from what is the nominalbeam-center direction. This effect can occur foreither the receive or transmit response pattern ofthe reflector. This phenomena is not an amplitudefade in the usual sense of this term, and spacediversity techniques are not applicable, i.e., multipathfading statistics cannot be used to compute outagetime reduction with space diversity antennaconfigurations. To minimize the effect of “beamwander” on radio system outage time, the verticalheight of a passive reflector in the 11-GHz bandshould be limited according to the relation:
A <660T
where
A = aperture height in feet
D = path length in kilometersC. Use of Passive Repeaters
General
11.03 Use of passive repeaters in microwave radiosystems in the United States is limited, but
in instances where terrain problems or the remotenessof the site poses economic or engineering obstaclesto use of a conventional repeater station, reflectorsare used. In general, the high sidelobes of the
Space and frequency diversity protection switchingsystems can be applied to hops using passiverepeaters. In the typical case where the passiveis relatively near one end of the hop, fading willbe of concern only on the longer path from thepassive to the far-end repeater. A discussion ofpassive repeaters used in conjunction with spacediversity is contained in Section 940-310-115.
Page 46

1SS 1, SECTION 940-384-100
Cross-Polarization Effects
11.05 At 11 GHz, the surface tolerance limitavailable on passive reflectors appears
adequate to prevent XPD degradation from surfaceirregularities. Since the orthogonality of the linearpolarized axes are maintained on reflection, shiftsin the transmitting and/or receiving antenna orantenna feed orientation can be used to minimizeany remaining misalignment.
. — -- ----
D. Omission of Radomes
11.06 For most regions of the United States,radomes should always be provided. For
drier climates and shorter hops, omission of theradome may be considered. This can be donewhen the route has a calculated rain outage (withradomes) which results in a total outage time wellbelow the prorated outage objective. Omission ofthe radome will result in a substantial increase inrain outage time.
-— .. ..”.-=-.. .--: “.
Page 47
47 Pages