radical budget and ozone chemistry during autumn in the
TRANSCRIPT
Radical budget and ozone chemistry during autumnin the atmosphere of an urban site in central ChinaXingcheng Lu1 , Nan Chen2, Yuhang Wang3 , Wenxiang Cao2, Bo Zhu2, Teng Yao1 ,Jimmy C. H. Fung1,4 , and Alexis K. H. Lau1,5
1Division of Environment, Hong Kong University of Science and Technology, Hong Kong, 2Hubei Provincial EnvironmentalMonitoring Center, Wuhan, China, 3School of Earth and Atmospheric Science, Georgia Institute of Technology, Atlanta,Georgia, USA, 4Department of Mathematics, Hong Kong University of Science and Technology, Hong Kong, 5Department ofCivil and Environmental Engineering, Hong Kong University of Science and Technology, Hong Kong
Abstract The ROx (=OH+HO2+ RO2) budget and O3 production at an urban site in central China (Wuhan)during autumn were simulated and analyzed for the first time using a UW Chemical Model 0-D box modelconstrained by in situ observational data. The daytime average OH, HO2, and RO2 concentrations were2.2 × 106, 1.0 × 10⁸, and 5.2 × 10⁷molecules cm�3, respectively. The average daytime O3 production ratewas 8.8 ppbv h�1, and alkenes were the most important VOC species for O3 formation (contributing 45%)at this site. Our sensitivity test indicated that the atmospheric environment in Wuhan during autumnbelongs to the VOC-limited regime. The daily average HONO concentration at this site during the studyperiod reached 1.1 ppbv and played an important role in the oxidative capacity of the atmosphere.Without the source of excess HONO, the average daytime OH, HO2, RO2, and O3 production ratesdecreased by 36%, 26%, 27%, and 31% respectively. A correlation between the HONO to NO2
heterogeneous conversion efficiency and PM2.5 × SWR was found at this site; based on this relationship, ifthe PM2.5 concentration met the World Health Organization air quality standard (25μgm�3), the O3
production rate in this city would decrease by 19% during late autumn. The burning of agriculturalbiomass severely affected the air quality in Wuhan during summer and autumn. Agricultural burning wasfound to account for 18% of the O3 formation during the study period. Our results suggest that VOCcontrol and a ban on agricultural biomass burning should be considered as high-priority measures forimproving the air quality in this region.
1. Introduction
ROx, composed of OH, HO2, and organic peroxy (RO2) radicals, largely controls the oxidation capacity of theatmosphere. Chemical reactions between ROx and NOx are central to oxidative processes in the atmosphericenvironment, which have a substantial effect on air quality via the formation of, for example, O3 andsecondary organic aerosols. Reactive OH and RO radicals are produced by the reactions of HO2 and RO2 withNO. At the same time, these two reactions also produce NO2, a major precursor for the formation of O3. Inboth urban and remote areas, the methyl peroxy radical (CH3O2) is the dominant RO2 species, whereasHO2 concentrations are normally higher than those of RO2 [Liu et al., 2012; Xue et al., 2013]. The structuresand concentrations of the radicals are determined by the nature and abundance of the volatile organiccompounds (VOCs) in the atmosphere. All of the radical species (ROx and NOx) together with the level of solarradiation determine the O3 level in the ambient environment.
O3 is the main component of photochemical smog, one of the most common air pollution eventsworldwide, especially in China. This pollution is caused by a complicated set of photochemicalreactions involving VOCs and NOx. In the past 10 years, many studies have been made to investigatethe ROx budget and O3 formation across the country. For example, Hofzumahaus et al. [2009] quantifiedthe OH and HO2 concentrations in the Pearl River Delta (PRD) region and reported an OH concentration(~107molecules cm�3) 3 to 5 times greater than expected. Lou et al. [2010] combined observational dataand model calculations and found that organic compounds contributed up to 85% of OH reactivity in thePRD region during the afternoon. Liu et al. [2012] applied the REAM-1D model to simulate the ROx budgetand O3 production rate in Beijing. They likewise reported that aromatic compounds, as well as HONO froman unknown source, were the major driving forces for O3 production in that city. Moreover, some of
LU ET AL. ROX BUDGETS AND O3 IN CENTRAL CHINA 3672
PUBLICATIONSJournal of Geophysical Research: Atmospheres
RESEARCH ARTICLE10.1002/2016JD025676
Key Points:• ROx budget and O3 production weresimulated and studied at Wuhan(urban site) for the first time, centralChina, using 0-D box model
• Excess HONO contributed up to 31%of O3 production at this site during theday
• Agricultural biomass burningcontributed 18% of O3 formationduring the episode dates
Supporting Information:• Supporting Information S1
Correspondence to:Y. Wang and J. C. H. Fung,[email protected];[email protected]
Citation:Lu, X., N. Chen, Y. Wang, W. Cao, B. Zhu,T. Yao, J. C. H. Fung, and A. K. H. Lau(2017), Radical budget and ozonechemistry during autumn in theatmosphere of an urban site in centralChina, J. Geophys. Res. Atmos., 122,3672–3685, doi:10.1002/2016JD025676.
Received 20 JUL 2016Accepted 5 MAR 2017Accepted article online 8 MAR 2017Published online 29 MAR 2017
©2017. American Geophysical Union.All Rights Reserved.
the above studies found that the complicated set of photochemical reactions in the atmosphere couldnot be reconciled with current knowledge. For example, in the case of HONO, great efforts havebeen devoted to identification of the unknown production sources for this trace gas. Su et al. [2011]reported that the unknown HONO may come from soil emissions, and Liu et al. [2014] showed that asubstantial amount of the unexplained HONO was formed by heterogeneous aerosol reactions by usingREAM 1-D model.
Wuhan, the capital city of Hubei province, is one of the most important centers for industry, education, andeconomy in central China. Concurrently with the “Rise of Central China” strategy, the gross domestic productof this city reached 900 billion Chinese yuan by 2013, placing it in the top 10 Chinese cities. Substantialeconomic and infrastructural development has brought great benefits to residents, but it has been a“double-edged sword”; urban development has also raised environmental issues for the region, includingair pollution and ecological deterioration. The building of a large number of energy-intensive factories andthe growth of vehicle ownership have led to substantially increasing emission of SO2, NOx, VOC, and primaryparticulate matter across this region. In addition to these consequences of modernization, the emissions ofVOCs and particulate matter from agricultural burning have also exerted adverse effects on the air qualityin this region. In the past 10 years, Wuhan has had several severe air pollution issues, including episodes withhigh levels of O3 and haze [X. Lyu et al., 2016].
Public consciousness of environmental protection has increased, and several observational and box model-based air quality studies have been carried out in this region. For instance, Querol et al. [2006] found thatthe daily mean PM10 concentration reached 156μgm�3 at residential sites and 197μgm�3 at industrialsites in the city. Their results also indicated that industrial emissions and power plant combustion werethe two major sources of the high PM level in Wuhan. Xu et al. [2016] reported that air pollution inWuhan was associated with urbanization. They found that an area of built-up land was associated withhigher SO2, NO2, and PM10 levels. Recently, X. P. Lyu et al. [2016] analyzed the VOC concentration at thesame site and reported that coal burning and vehicle exhausts were the two major contributors to O3
formation there.
Few studies have reported the oxidative capacity, ROx budget, and O3 formation in the atmosphere over thisregion. It is essential to develop a detailed understanding of the ambient ROx level because it strongly deter-mines the degree of primary pollutant removal and O3 formation [Hofzumahaus et al., 2009] in the atmo-sphere. To obtain a full picture of the photochemical reaction processes in Wuhan, we analyzed the ROx
budget and O3 formation using the observation-constrained UW Chemical Model (UWCM) [Wolfe andThornton, 2011]. This 0-D box model is constrained by physical meteorological parameters (relative humidity,temperature, and pressure) and chemical species, including VOCs, O3, NOx, CO, HONO, and HNO3. Due to theavailability and continuity of the relevant VOC data, we chose autumn (26–30 September, 3–6 October, and26–31 October 2013) for the study period. Sensitivity tests were performed to study the effectiveness of themeasures to control O3 formation at this site. The influence of the excess HONO (HONO from unknownsources other than NO+OH) was also investigated in this study. Agricultural burning is common in autumnacross this region. According to the Moderate Resolution Imaging Spectroradiometer near-real-time(MODISNRT) C5 data product, about 500 fire points were identified across the city in October 2013. Therefore, theeffect of biomass burning on O3 production was also analyzed. The remainder of this paper is organized asfollows. Section 2 describes the measurement data and the setup of the UWCM 0-D box model. Insection 3.1, we analyze the ROx budget and its reaction rate. O3 formation, control strategies for VOCs andNOx to reduce O3 production, and the effect of excess HONO on the O3 budget are presented insection 3.2. Section 3.3 focuses on the effects of biomass burning on O3 formation in Wuhan. Finally, theoverall study is summarized in section 4.
2. Methodology2.1. Observation Data
During the study period in autumn 2013, a comprehensive set of VOC trace gases, including 48 nonmethanehydrocarbons, 15 halocarbons, and 3 oxygenated VOCs (OVOCs), were measured concurrently at the rooftop(18m above the ground) of the Hubei Provincial Environmental Monitoring Center (114°21041″E, 30°31054″N),
Journal of Geophysical Research: Atmospheres 10.1002/2016JD025676
LU ET AL. ROX BUDGETS AND O3 IN CENTRAL CHINA 3673
in Wuchan district, Wuhan city. The sam-pling site was located in an urban area,and it was near the traffic lane. A gaschromatograph with a mass spectro-meter and flame ionization detector(GC-MS/FID; codeveloped by WuhanTianhong Instrument Inc. and PekingUniversity (TH_PKU-300)) was usedto measure the real-time VOC levels.After passing through a perfluoroalkoxyTeflon tube, each air sample was puri-fied and concentrated via two steps:(1) a first pass through a temperatureof �80°C to remove water vapor andcarbon dioxide followed by (2) a secondpass through another cold trap at�150°C for concentration. After thepurification and concentration pro-cesses, the temperature was raised to100°C and the gas was introduced intothe GC-MS/FID system for further mea-surement. Six different concentrationsof a standard sample (0.03–0.25 ppbv)were used to calibrate the GC-MS/FIDevery 2weeks. Further details aboutthe detection limits and the qualityassurance/quality control of this instru-ment can be found in Wang et al.[2014] and X. P. Lyu et al. [2016].
Other trace gases and aerosol com-ponents, including HONO, HNO3, andpotassium, were measured onlineusing Measuring AeRosols and GAses(Metrohm-MARGA 1S, Switzerland). Thematerial, diameter, and length of thesample line were linear low-densitypolyethylene, 1/2″ and 2.5m, respec-tively. The flow rate was 16.7 Lmin�1.The detection limit and repeatability
of the HONO measurement were 0.03μgm�3 and 3.3%, respectively. Nie et al. [2015] reported that themain source of interference in HONO measurement using MARGA should be mainly from the NO2
conversion in the wet rotating denuder. We followed their method to correct our HONO data(HONOLOPAP = 0.833 ×HONOWRD� 0.17) [Su, 2008]. The MARGA system was calibrated each week using aLiBr standard solution to ensure the detection limit and accuracy of the data. The PM2.5, SO2, NOx, CO, andO3 levels were measured with a set of related commercial analyzers developed by Thermo EnvironmentalInstruments Inc., USA. PM2.5 was measured by a particulate matter detector (Thermo Fisher-1405D), NOx
was detected with a chemiluminescence NOx analyzer (Model 42i), SO2 was measured with a fluorescenceanalyzer (Model 43i), and O3 and CO were measured with a CO analyzer (Model 48i) and an O3 analyzer(Model 49i), respectively. The detection limit (precision) for Model 42i, Model 43i, Model 48i, and Model 49iare 0.4 ppbv (±0.4 ppbv), 0.5 ppbv (±1 ppbv), 0.04 ppmv (±0.1 ppmv), and 0.5 ppbv (±1 ppbv), respectively.A molybdenum converter was used for NO2 measurement, and as a result, part of the NOy (e.g., peroxyace-tylnitrate (PAN), HNO3, and alkyl nitrates) may have been transformed to NO2 during the sampling. Therefore,we applied formula (1) in Lamsal et al. [2008] to correct our NO2 data; more detail can be found in the
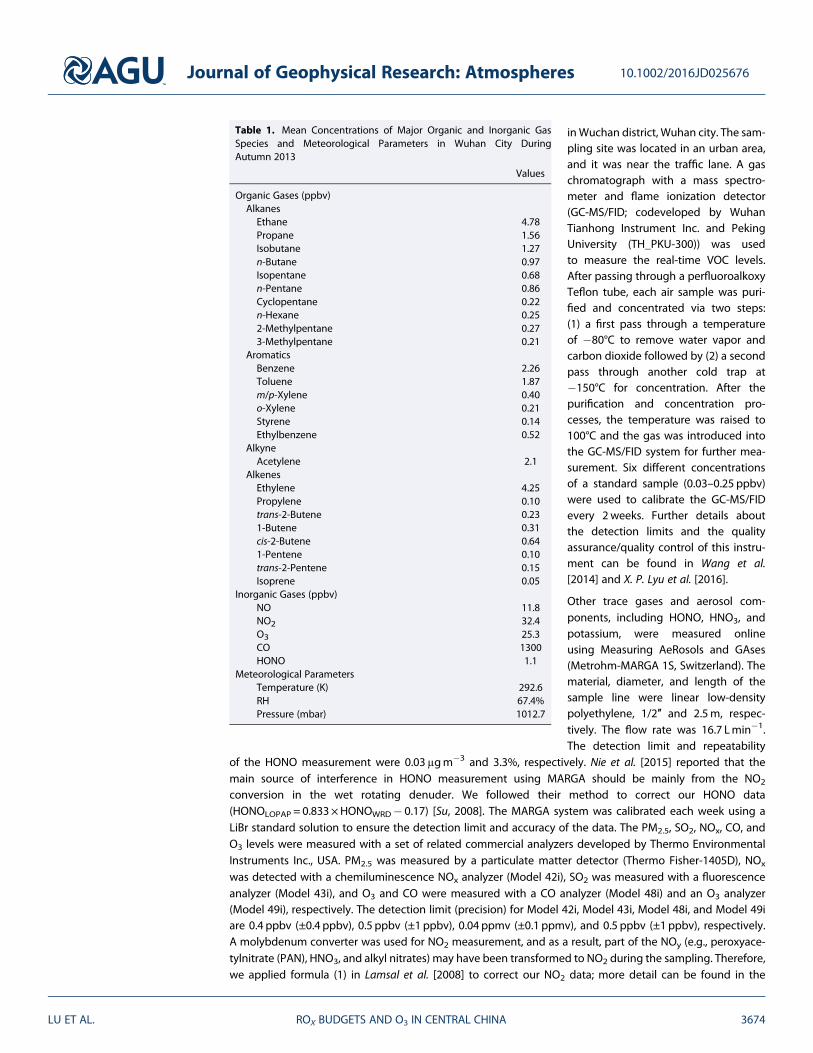
Table 1. Mean Concentrations of Major Organic and Inorganic GasSpecies and Meteorological Parameters in Wuhan City DuringAutumn 2013
Values
Organic Gases (ppbv)AlkanesEthane 4.78Propane 1.56Isobutane 1.27n-Butane 0.97Isopentane 0.68n-Pentane 0.86Cyclopentane 0.22n-Hexane 0.252-Methylpentane 0.273-Methylpentane 0.21
AromaticsBenzene 2.26Toluene 1.87m/p-Xylene 0.40o-Xylene 0.21Styrene 0.14Ethylbenzene 0.52
AlkyneAcetylene 2.1
AlkenesEthylene 4.25Propylene 0.10trans-2-Butene 0.231-Butene 0.31cis-2-Butene 0.641-Pentene 0.10trans-2-Pentene 0.15Isoprene 0.05
Inorganic Gases (ppbv)NO 11.8NO2 32.4O3 25.3CO 1300HONO 1.1
Meteorological ParametersTemperature (K) 292.6RH 67.4%Pressure (mbar) 1012.7
Journal of Geophysical Research: Atmospheres 10.1002/2016JD025676
LU ET AL. ROX BUDGETS AND O3 IN CENTRAL CHINA 3674
supporting information. The temporal resolution for the measurement of all of the gases and particulatematter was 1 h. The diurnal profile of NO, NO2, O3, and HONO can be found in Figure S1. The average majorVOC concentrations can be found in Table 1.
2.2. 0-D Box Model
We used the UWCM 0-D box model to simulate the ROx budget and O3 production at this site. This model is amodified version of the UW-CAFE model; further details of this model can be found in Wolfe and Thornton[2011] and Wolfe et al. [2016]. The organic and inorganic chemistry in this model was based on MasterChemical Mechanisms (MCM) version 3.2 (http://mcm.leeds.ac.uk/MCMv3.2/), a set of near-explicit photooxi-dation schemes [Jenkin et al., 1997; Saunders et al., 2003]. The gas species identified herein can be describedwith a total of 10,608 reactions. The UWCMmodel coupled with MCM has been successfully implemented inother ambient photochemical studies around the world [Riedel et al., 2014; Kim et al., 2015]. The emissionsand deposition of chemical species were not considered in the 0-D box model; hence, a 24 h first-orderdilution rate scaled by hourly wind speed over daily average wind speed was implemented for all species toprevent those with long lifetimes from increasing to an unrealistic level [Wolfe et al., 2014]. Two days’ spin-up was needed, and hence, 8 days of results were available for analysis (29–30 September, 5–6 October, and28–31 October) [Kim et al., 2015]. Because the photolysis frequencies (J values) at this site were not measuredduring the study period, the National Center for Atmospheric Research tropospheric ultraviolet and visible(TUV) transfer model (http://www.acd.ucar.edu/TUV) was used to calculate the photolysis rate for the boxmodel simulation. The O3 column density measured by the Total Ozone Mapping Spectrometer, MODIS aero-sol optical depth (MYD08), aerosol single scattering albedo (OMAERUVd v003), andModern Era Retrospective-Analysis for Research andApplications surface albedo (MAT1NXRADv5.2.0)were used as the inputs for the TUVmodel. To model the cloud effect, the J value (s�1) was scaled with equation (1):
Jcorrected ¼ JTUV� SWRcloud= SWRclear; (1)
where Jcorrected represents the scaled photolysis rate, JTUV is the photolysis rate calculated by the TUV modelwithout considering the cloud effect, SWRcloud (Wm�2) represents the downward short-wave radiationreaching the ground at a specific hour, and SWRclear represents the clear-sky downward short-wave radia-tion at the ground surface. The short-wave radiation reaching the ground was calculated with WeatherResearch Forecast (WRF) v3.6. The details of the WRF model configuration are introduced in section 2.3.The concentrations of the observed OVOCs (C2H5CHO, C3H7CHO, and C4H9CHO) were compared with thoseof the OVOCs simulated by the box model without constraints. The daytime average (9:00 to 17:00)observed concentrations of C2H5CHO, C3H7CHO, and C4H9CHO were 1.8, 0.07, and 0.04 ppbv, whereas thedaytime average simulated concentrations of these three OVOCs were 1.2, 0.07, and 0.034 ppbv. The con-centrations of HCHO and CH3CHO as simulated by the model were 7.1 and 5.2 ppbv, respectively, whichare comparable with the findings of other observational studies in China [Liu et al., 2012; Zhang et al.,2012; Ma et al., 2016]. This comparison indicated that the results simulated by the UWCM 0-D box modelcould be used for further analysis.
2.3. WRF Model Configuration
We applied the model WRF v3.6 to simulate the wind field and downward short-wave radiation flux. Threenested domains were set, and the domain coverage is shown in Figure S2. Domain 1 (27 km) covered theentire China, as well as some surrounding countries, such as Japan, Korea, Thailand, and most of India.Domain 2 (9 km) covered Hubei, Hunan, Henan, and Jiangxi provinces. Domain 3 (3 km) included all of thecities in Hubei province; the simulation results from this domain were used in the following analysis. We usedthe Grell-Devenyi ensemble cumulus parameterization scheme [Grell and Dévényi, 2002], the YonseiUniversity planetary boundary layer scheme [Hong et al., 2006], the Morrison two-moment microphysicsscheme [Morrison et al., 2009], and the Noah land-surface model [Chen and Dudhia, 2001] for the simulation.The scheme of Dudhia [1989] was selected for the short-wave radiation, and the Rapid Radiative TransferModel [Mlawer et al., 1997] was chosen as the long-wave radiation scheme. The short-wave radiation fromthe WRF model was used to correct the J value calculated by the TUV model; the wind direction from theWRF was used to show the observation site was influenced by the surrounding agricultural burning duringthe late October. A matrix of the performance statistics of WRF is shown in Table S1. In general, the perfor-mance of WRF in this study was comparable to that in other study [Wu et al., 2013].
Journal of Geophysical Research: Atmospheres 10.1002/2016JD025676
LU ET AL. ROX BUDGETS AND O3 IN CENTRAL CHINA 3675
3. Results and Discussions3.1. ROx Budget Analysis
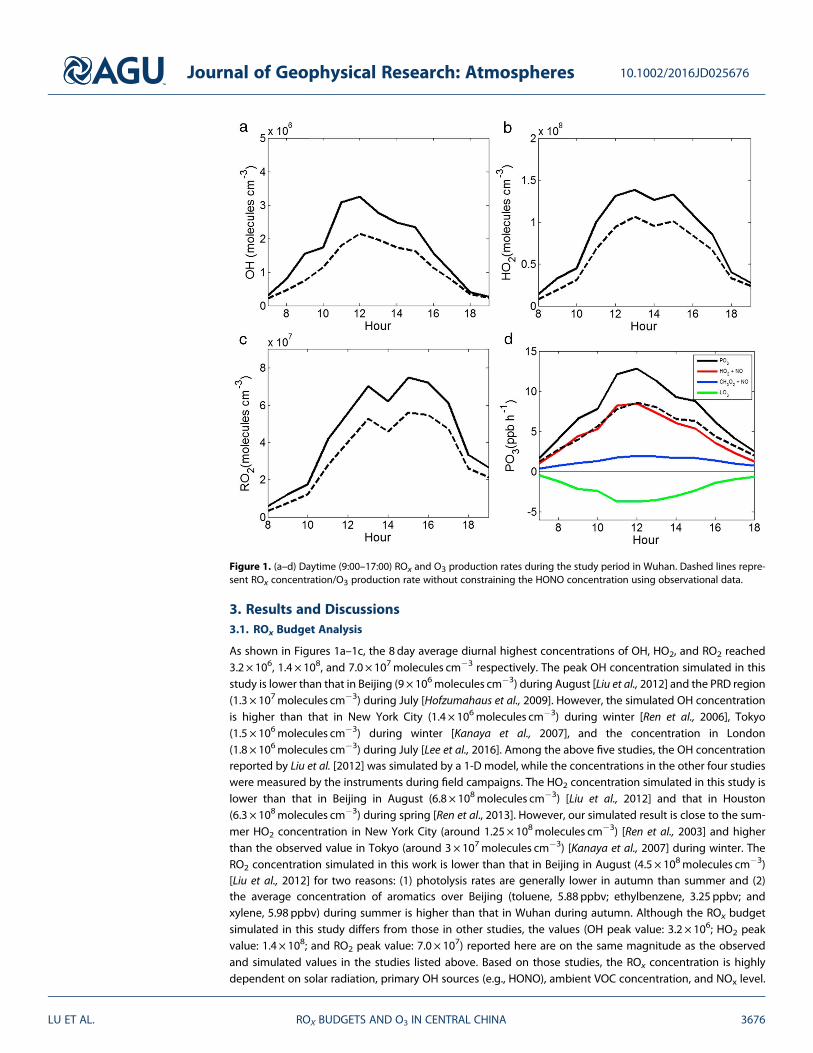
As shown in Figures 1a–1c, the 8 day average diurnal highest concentrations of OH, HO2, and RO2 reached3.2 × 106, 1.4 × 10⁸, and 7.0 × 10⁷molecules cm�3 respectively. The peak OH concentration simulated in thisstudy is lower than that in Beijing (9 × 10⁶molecules cm�3) during August [Liu et al., 2012] and the PRD region(1.3 × 10⁷molecules cm�3) during July [Hofzumahaus et al., 2009]. However, the simulated OH concentrationis higher than that in New York City (1.4 × 10⁶molecules cm�3) during winter [Ren et al., 2006], Tokyo(1.5 × 10⁶molecules cm�3) during winter [Kanaya et al., 2007], and the concentration in London(1.8 × 10⁶molecules cm�3) during July [Lee et al., 2016]. Among the above five studies, the OH concentrationreported by Liu et al. [2012] was simulated by a 1-D model, while the concentrations in the other four studieswere measured by the instruments during field campaigns. The HO2 concentration simulated in this study islower than that in Beijing in August (6.8 × 10⁸molecules cm�3) [Liu et al., 2012] and that in Houston(6.3 × 10⁸molecules cm�3) during spring [Ren et al., 2013]. However, our simulated result is close to the sum-mer HO2 concentration in New York City (around 1.25 × 10⁸molecules cm�3) [Ren et al., 2003] and higherthan the observed value in Tokyo (around 3 × 10⁷molecules cm�3) [Kanaya et al., 2007] during winter. TheRO2 concentration simulated in this work is lower than that in Beijing in August (4.5 × 10⁸molecules cm�3)[Liu et al., 2012] for two reasons: (1) photolysis rates are generally lower in autumn than summer and (2)the average concentration of aromatics over Beijing (toluene, 5.88 ppbv; ethylbenzene, 3.25 ppbv; andxylene, 5.98 ppbv) during summer is higher than that in Wuhan during autumn. Although the ROx budgetsimulated in this study differs from those in other studies, the values (OH peak value: 3.2 × 10⁶; HO2 peakvalue: 1.4 × 10⁸; and RO2 peak value: 7.0 × 10⁷) reported here are on the same magnitude as the observedand simulated values in the studies listed above. Based on those studies, the ROx concentration is highlydependent on solar radiation, primary OH sources (e.g., HONO), ambient VOC concentration, and NOx level.
Figure 1. (a–d) Daytime (9:00–17:00) ROx and O3 production rates during the study period in Wuhan. Dashed lines repre-sent ROx concentration/O3 production rate without constraining the HONO concentration using observational data.
Journal of Geophysical Research: Atmospheres 10.1002/2016JD025676
LU ET AL. ROX BUDGETS AND O3 IN CENTRAL CHINA 3676
The dashed line in Figures 1a–1c is the simulated ROx budget without the source of excess HONO.Specifically, in the dashed line case, the simulated HONO concentration is not constrained in the simulationwith observations and there is only one gas-phase production reaction for HONO (NO+OH) in themodel. Theaverage HONO concentration produced by NO+OH is only around 0.3 ppbv, whereas the average observedHONO concentration was around 1.1 ppbv during the study period, as shown in Table 1. Such a large discre-pancy between the observed and modeled HONO concentrations has a substantial effect on the calculatedambient ROx budget and oxidative capacity of the atmosphere. As seen in Figures 1a–1c, the 8 day averagedaytime OH, HO2, and RO2 concentrations decreased to some extent without the excess HONO source. Indetail, when constrained by the observational data including HONO, the daytime average (9:00–17:00)concentrations of OH, HO2, and RO2 were 2.2 × 10⁶, 1.0 × 10⁸, and 5.2 × 10⁷molecules cm�3, respectively.The daytime average concentrations of these three radicals without the excess HONO source were1.4 × 106, 7.4 × 10⁷, and 3.8 × 10⁷molecules cm�3. The OH concentration decreased by 36%, the HO2
concentration by 26%, and the RO2 concentration by 27% compared with the HONO-constrained case.Hence, we can conclude that the excess HONO source influences the atmospheric oxidative capacity to alarge degree, and the increased level of OH creates a more photochemically active environment in theatmosphere over this region. This excess HONO source was not taken into consideration in some previousmodel simulations; hence, it is important to include this term in future model-based ROx budget analysisand studies into O3 control policy.
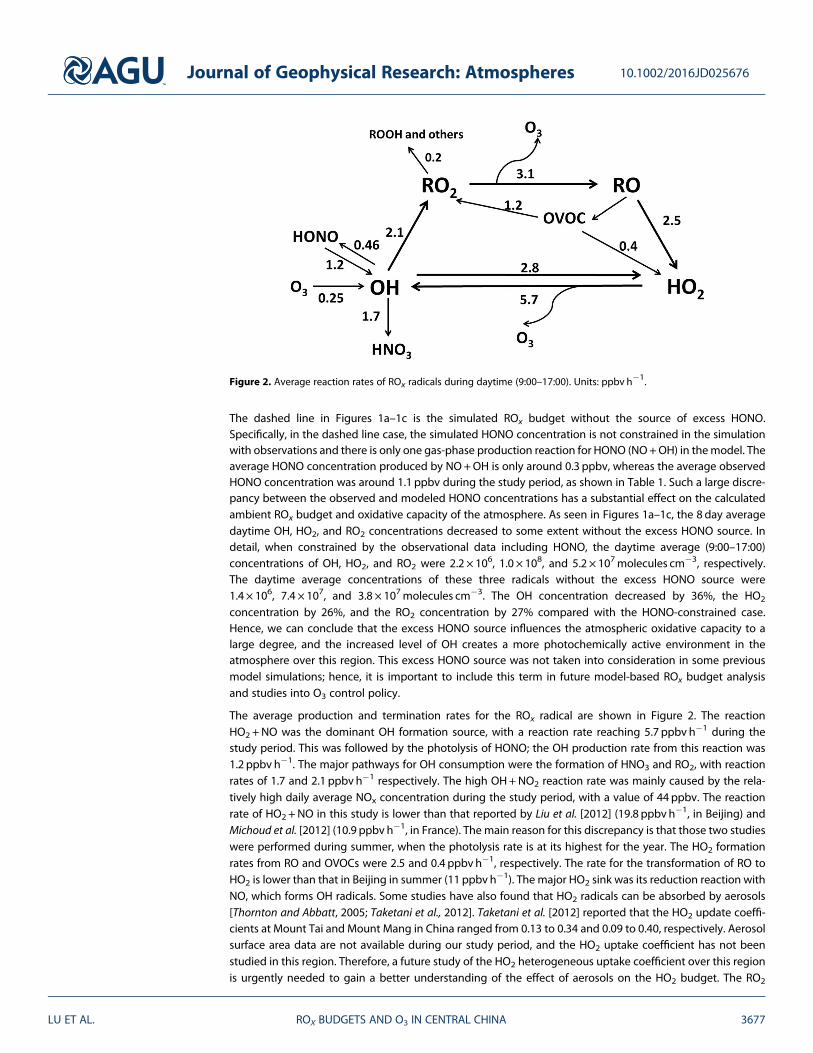
The average production and termination rates for the ROx radical are shown in Figure 2. The reactionHO2 +NO was the dominant OH formation source, with a reaction rate reaching 5.7 ppbv h�1 during thestudy period. This was followed by the photolysis of HONO; the OH production rate from this reaction was1.2 ppbv h�1. The major pathways for OH consumption were the formation of HNO3 and RO2, with reactionrates of 1.7 and 2.1 ppbv h�1 respectively. The high OH+NO2 reaction rate was mainly caused by the rela-tively high daily average NOx concentration during the study period, with a value of 44 ppbv. The reactionrate of HO2 +NO in this study is lower than that reported by Liu et al. [2012] (19.8 ppbv h�1, in Beijing) andMichoud et al. [2012] (10.9 ppbv h�1, in France). The main reason for this discrepancy is that those two studieswere performed during summer, when the photolysis rate is at its highest for the year. The HO2 formationrates from RO and OVOCs were 2.5 and 0.4 ppbv h�1, respectively. The rate for the transformation of RO toHO2 is lower than that in Beijing in summer (11 ppbv h�1). The major HO2 sink was its reduction reaction withNO, which forms OH radicals. Some studies have also found that HO2 radicals can be absorbed by aerosols[Thornton and Abbatt, 2005; Taketani et al., 2012]. Taketani et al. [2012] reported that the HO2 update coeffi-cients at Mount Tai and Mount Mang in China ranged from 0.13 to 0.34 and 0.09 to 0.40, respectively. Aerosolsurface area data are not available during our study period, and the HO2 uptake coefficient has not beenstudied in this region. Therefore, a future study of the HO2 heterogeneous uptake coefficient over this regionis urgently needed to gain a better understanding of the effect of aerosols on the HO2 budget. The RO2
Figure 2. Average reaction rates of ROx radicals during daytime (9:00–17:00). Units: ppbv h�1.
Journal of Geophysical Research: Atmospheres 10.1002/2016JD025676
LU ET AL. ROX BUDGETS AND O3 IN CENTRAL CHINA 3677
formation rates from OH and OVOCswere 2.1 and 1.2 ppbv h�1, respectively,which are also lower than thosereported in summer in Beijing. In addi-tion to the difference in photolysis rates,the ambient VOC concentration is alsoan important factor that may cause thediscrepancy between the RO2 formationrates in Beijing and Wuhan. As analyzedabove, the average ethylbenzene andxylene concentrations in Beijing duringthe summer of 2007 were 3.25 and5.98 ppbv, respectively, whereas in ourstudy the concentrations of these twospecies were only 0.52 and 0.40 ppbv.We also note that due to the high
NOx concentration, the reactions NO+HO2 and RO2 +NO are the two major pathways for radical cyclingat this site, which are commonly seen in NOx-abundant environments [Elshorbany et al., 2009; Dusanteret al., 2009].
3.2. O3 Photochemistry Analysis3.2.1. O3 FormationThe O3 production and loss rates are shown in Figure 1d. In general, the ozone gross production rate wasdefined by the following formula [Zhang et al., 2016]:
PO3 ¼ k0 NO½ � HO2½ � þXn
i¼1ki NO½ � RO2½ �i; (2)
where k0 is the rate constant for the NO+HO2 reaction, and ki are the rate constants for each specific RO2
+NO reaction. The O3 loss was attributed to the destruction of both NO2 (e.g., OH+NO2) and O3 (e.g.,O1D+H2O). During our study period, the O3 gross production rate reached 8.8 ppb h�1. As expected, theO3 production rate was highest at noon, with a peak value of 12.8 ppbv h�1. The O3 loss rate may have beeninfluenced by interference in the NO2 measurement. The formation of O3 by the reaction HO2 +NO was themost important source, with a peak reaction rate of 8.4 ppbv h�1 at noon. CH3O2 was the most abundant RO2
species: its contribution to the formation of O3 peaked at 2.0 ppbv h�1 during the study period. The daytimeaverage O3 loss rate was around 2.6 ppbv h�1, which was lower than the O3 production rate. Therefore, theaverage daytime net O3 production rate at this site was 6.2 ppbv h�1 in autumn. Like the ROx budget, excessHONO plays an important role in O3 formation. Without the excess HONO, the daytime average O3 grossformation rate was only 6.1 ppbv h�1, which is around 69% of the original formation rate. From the 0-Dbox model, we conclude that HONO plays an important role in the formation of O3. Further research istherefore needed to better understand the HONO formation mechanism and implement it into a 3-D chemi-cal transport model to improve the regional simulation of O3.
VOCs play a major role in O3 formation, so we investigated which VOC species contributed most to O3
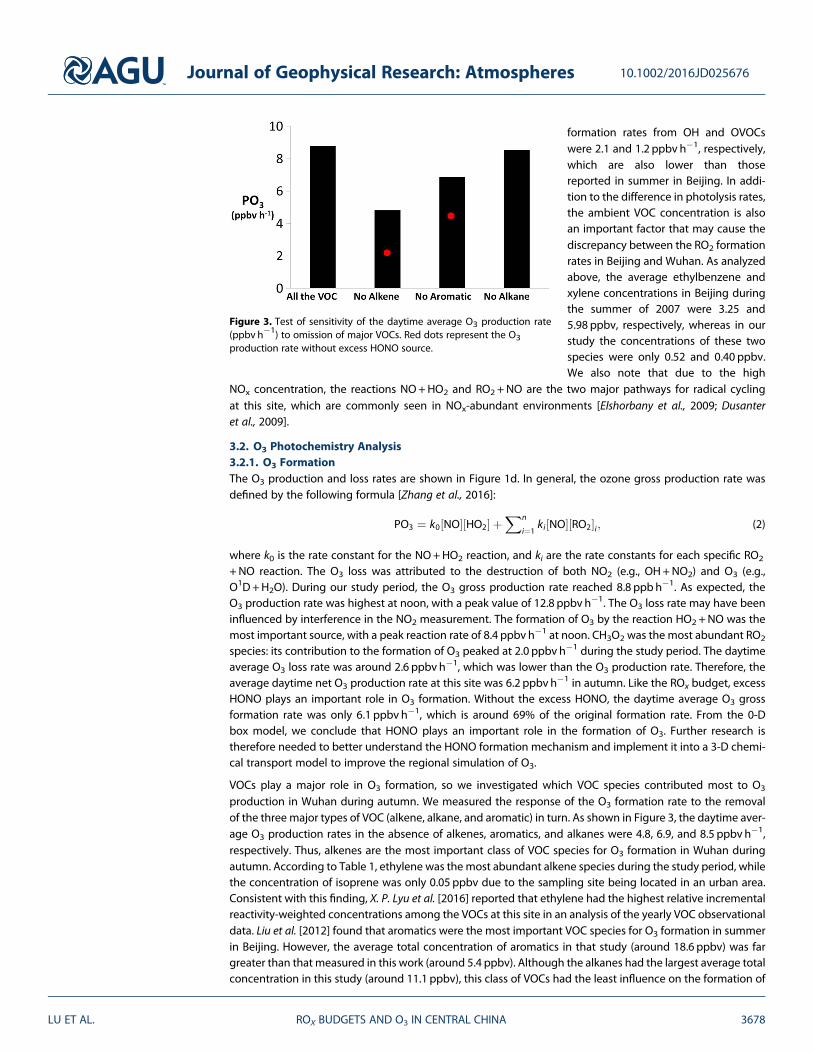
production in Wuhan during autumn. We measured the response of the O3 formation rate to the removalof the three major types of VOC (alkene, alkane, and aromatic) in turn. As shown in Figure 3, the daytime aver-age O3 production rates in the absence of alkenes, aromatics, and alkanes were 4.8, 6.9, and 8.5 ppbv h�1,respectively. Thus, alkenes are the most important class of VOC species for O3 formation in Wuhan duringautumn. According to Table 1, ethylene was the most abundant alkene species during the study period, whilethe concentration of isoprene was only 0.05 ppbv due to the sampling site being located in an urban area.Consistent with this finding, X. P. Lyu et al. [2016] reported that ethylene had the highest relative incrementalreactivity-weighted concentrations among the VOCs at this site in an analysis of the yearly VOC observationaldata. Liu et al. [2012] found that aromatics were the most important VOC species for O3 formation in summerin Beijing. However, the average total concentration of aromatics in that study (around 18.6 ppbv) was fargreater than that measured in this work (around 5.4 ppbv). Although the alkanes had the largest average totalconcentration in this study (around 11.1 ppbv), this class of VOCs had the least influence on the formation of
Figure 3. Test of sensitivity of the daytime average O3 production rate(ppbv h�1) to omission of major VOCs. Red dots represent the O3production rate without excess HONO source.
Journal of Geophysical Research: Atmospheres 10.1002/2016JD025676
LU ET AL. ROX BUDGETS AND O3 IN CENTRAL CHINA 3678
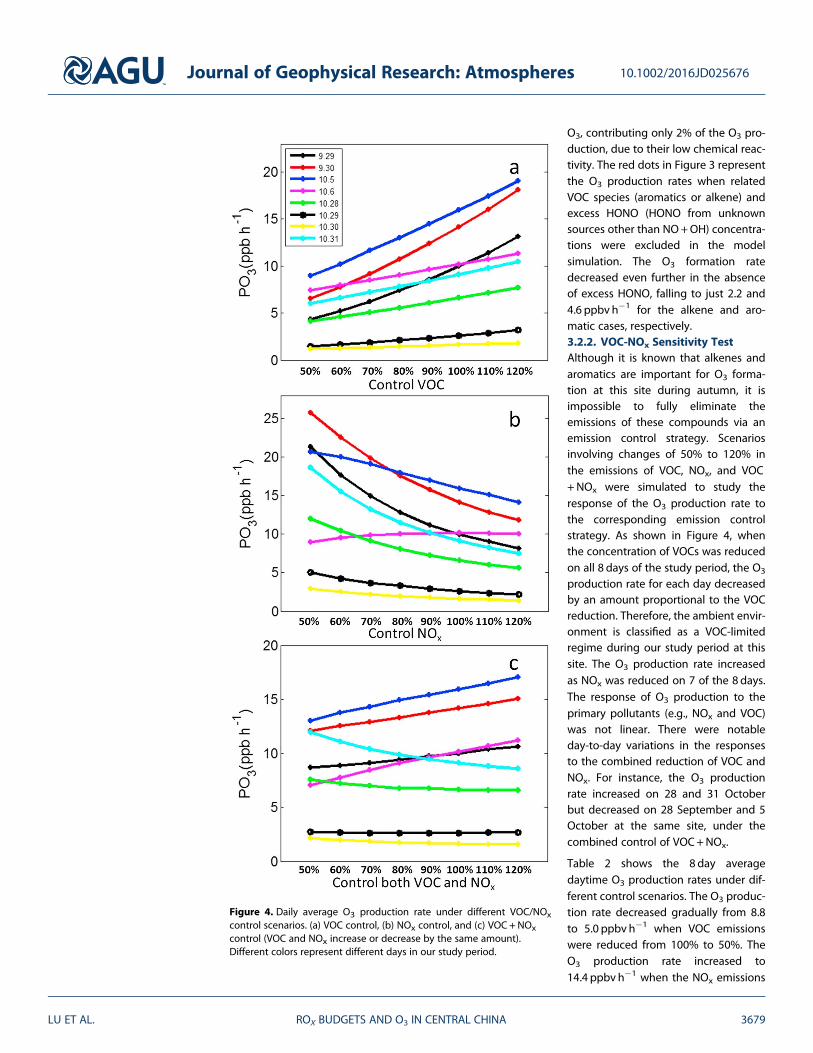
O3, contributing only 2% of the O3 pro-duction, due to their low chemical reac-tivity. The red dots in Figure 3 representthe O3 production rates when relatedVOC species (aromatics or alkene) andexcess HONO (HONO from unknownsources other than NO+OH) concentra-tions were excluded in the modelsimulation. The O3 formation ratedecreased even further in the absenceof excess HONO, falling to just 2.2 and4.6 ppbv h�1 for the alkene and aro-matic cases, respectively.3.2.2. VOC-NOx Sensitivity TestAlthough it is known that alkenes andaromatics are important for O3 forma-tion at this site during autumn, it isimpossible to fully eliminate theemissions of these compounds via anemission control strategy. Scenariosinvolving changes of 50% to 120% inthe emissions of VOC, NOx, and VOC+NOx were simulated to study theresponse of the O3 production rate tothe corresponding emission controlstrategy. As shown in Figure 4, whenthe concentration of VOCs was reducedon all 8 days of the study period, the O3
production rate for each day decreasedby an amount proportional to the VOCreduction. Therefore, the ambient envir-onment is classified as a VOC-limitedregime during our study period at thissite. The O3 production rate increasedas NOx was reduced on 7 of the 8 days.The response of O3 production to theprimary pollutants (e.g., NOx and VOC)was not linear. There were notableday-to-day variations in the responsesto the combined reduction of VOC andNOx. For instance, the O3 productionrate increased on 28 and 31 Octoberbut decreased on 28 September and 5October at the same site, under thecombined control of VOC+NOx.
Table 2 shows the 8 day averagedaytime O3 production rates under dif-ferent control scenarios. The O3 produc-tion rate decreased gradually from 8.8to 5.0 ppbv h�1 when VOC emissionswere reduced from 100% to 50%. TheO3 production rate increased to14.4 ppbv h�1 when the NOx emissions
Figure 4. Daily average O3 production rate under different VOC/NOxcontrol scenarios. (a) VOC control, (b) NOx control, and (c) VOC + NOxcontrol (VOC and NOx increase or decrease by the same amount).Different colors represent different days in our study period.
Journal of Geophysical Research: Atmospheres 10.1002/2016JD025676
LU ET AL. ROX BUDGETS AND O3 IN CENTRAL CHINA 3679
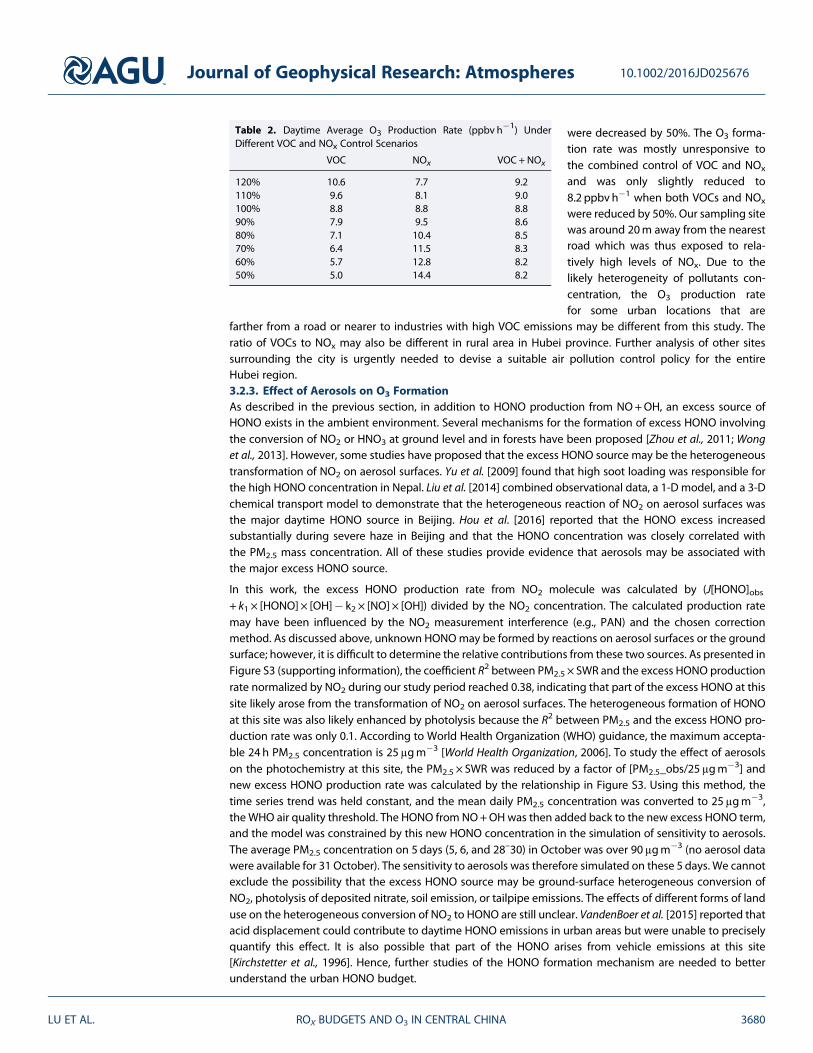
were decreased by 50%. The O3 forma-tion rate was mostly unresponsive tothe combined control of VOC and NOx
and was only slightly reduced to8.2 ppbv h�1 when both VOCs and NOx
were reduced by 50%. Our sampling sitewas around 20m away from the nearestroad which was thus exposed to rela-tively high levels of NOx. Due to thelikely heterogeneity of pollutants con-centration, the O3 production ratefor some urban locations that are
farther from a road or nearer to industries with high VOC emissions may be different from this study. Theratio of VOCs to NOx may also be different in rural area in Hubei province. Further analysis of other sitessurrounding the city is urgently needed to devise a suitable air pollution control policy for the entireHubei region.3.2.3. Effect of Aerosols on O3 FormationAs described in the previous section, in addition to HONO production from NO+OH, an excess source ofHONO exists in the ambient environment. Several mechanisms for the formation of excess HONO involvingthe conversion of NO2 or HNO3 at ground level and in forests have been proposed [Zhou et al., 2011; Wonget al., 2013]. However, some studies have proposed that the excess HONO source may be the heterogeneoustransformation of NO2 on aerosol surfaces. Yu et al. [2009] found that high soot loading was responsible forthe high HONO concentration in Nepal. Liu et al. [2014] combined observational data, a 1-D model, and a 3-Dchemical transport model to demonstrate that the heterogeneous reaction of NO2 on aerosol surfaces wasthe major daytime HONO source in Beijing. Hou et al. [2016] reported that the HONO excess increasedsubstantially during severe haze in Beijing and that the HONO concentration was closely correlated withthe PM2.5 mass concentration. All of these studies provide evidence that aerosols may be associated withthe major excess HONO source.
In this work, the excess HONO production rate from NO2 molecule was calculated by (J[HONO]obs+ k1 × [HONO] × [OH]� k2 × [NO] × [OH]) divided by the NO2 concentration. The calculated production ratemay have been influenced by the NO2 measurement interference (e.g., PAN) and the chosen correctionmethod. As discussed above, unknown HONOmay be formed by reactions on aerosol surfaces or the groundsurface; however, it is difficult to determine the relative contributions from these two sources. As presented inFigure S3 (supporting information), the coefficient R2 between PM2.5 × SWR and the excess HONO productionrate normalized by NO2 during our study period reached 0.38, indicating that part of the excess HONO at thissite likely arose from the transformation of NO2 on aerosol surfaces. The heterogeneous formation of HONOat this site was also likely enhanced by photolysis because the R2 between PM2.5 and the excess HONO pro-duction rate was only 0.1. According to World Health Organization (WHO) guidance, the maximum accepta-ble 24 h PM2.5 concentration is 25μgm�3 [World Health Organization, 2006]. To study the effect of aerosolson the photochemistry at this site, the PM2.5 × SWR was reduced by a factor of [PM2.5_obs/25μgm
�3] andnew excess HONO production rate was calculated by the relationship in Figure S3. Using this method, thetime series trend was held constant, and the mean daily PM2.5 concentration was converted to 25μgm�3,the WHO air quality threshold. The HONO from NO+OHwas then added back to the new excess HONO term,and the model was constrained by this new HONO concentration in the simulation of sensitivity to aerosols.The average PM2.5 concentration on 5 days (5, 6, and 28–30) in October was over 90μgm�3 (no aerosol datawere available for 31 October). The sensitivity to aerosols was therefore simulated on these 5 days. We cannotexclude the possibility that the excess HONO source may be ground-surface heterogeneous conversion ofNO2, photolysis of deposited nitrate, soil emission, or tailpipe emissions. The effects of different forms of landuse on the heterogeneous conversion of NO2 to HONO are still unclear. VandenBoer et al. [2015] reported thatacid displacement could contribute to daytime HONO emissions in urban areas but were unable to preciselyquantify this effect. It is also possible that part of the HONO arises from vehicle emissions at this site[Kirchstetter et al., 1996]. Hence, further studies of the HONO formation mechanism are needed to betterunderstand the urban HONO budget.
Table 2. Daytime Average O3 Production Rate (ppbv h�1) UnderDifferent VOC and NOx Control Scenarios
VOC NOx VOC +NOx
120% 10.6 7.7 9.2110% 9.6 8.1 9.0100% 8.8 8.8 8.890% 7.9 9.5 8.680% 7.1 10.4 8.570% 6.4 11.5 8.360% 5.7 12.8 8.250% 5.0 14.4 8.2
Journal of Geophysical Research: Atmospheres 10.1002/2016JD025676
LU ET AL. ROX BUDGETS AND O3 IN CENTRAL CHINA 3680
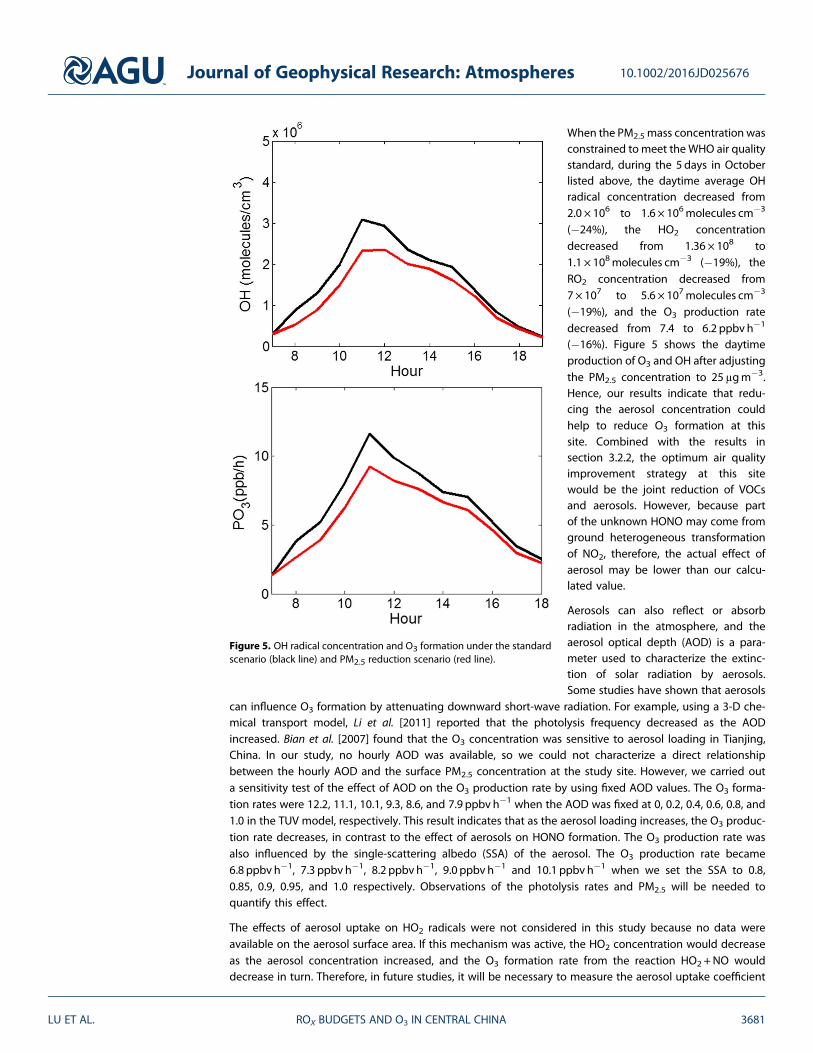
When the PM2.5 mass concentration wasconstrained to meet the WHO air qualitystandard, during the 5 days in Octoberlisted above, the daytime average OHradical concentration decreased from2.0 × 106 to 1.6 × 10⁶molecules cm�3
(�24%), the HO2 concentrationdecreased from 1.36 × 10⁸ to1.1 × 108molecules cm�3 (�19%), theRO2 concentration decreased from7× 107 to 5.6 × 10⁷molecules cm�3
(�19%), and the O3 production ratedecreased from 7.4 to 6.2 ppbv h�1
(�16%). Figure 5 shows the daytimeproduction of O3 and OH after adjustingthe PM2.5 concentration to 25μgm�3.Hence, our results indicate that redu-cing the aerosol concentration couldhelp to reduce O3 formation at thissite. Combined with the results insection 3.2.2, the optimum air qualityimprovement strategy at this sitewould be the joint reduction of VOCsand aerosols. However, because partof the unknown HONO may come fromground heterogeneous transformationof NO2, therefore, the actual effect ofaerosol may be lower than our calcu-lated value.
Aerosols can also reflect or absorbradiation in the atmosphere, and theaerosol optical depth (AOD) is a para-meter used to characterize the extinc-tion of solar radiation by aerosols.Some studies have shown that aerosols
can influence O3 formation by attenuating downward short-wave radiation. For example, using a 3-D che-mical transport model, Li et al. [2011] reported that the photolysis frequency decreased as the AODincreased. Bian et al. [2007] found that the O3 concentration was sensitive to aerosol loading in Tianjing,China. In our study, no hourly AOD was available, so we could not characterize a direct relationshipbetween the hourly AOD and the surface PM2.5 concentration at the study site. However, we carried outa sensitivity test of the effect of AOD on the O3 production rate by using fixed AOD values. The O3 forma-tion rates were 12.2, 11.1, 10.1, 9.3, 8.6, and 7.9 ppbv h�1 when the AOD was fixed at 0, 0.2, 0.4, 0.6, 0.8, and1.0 in the TUV model, respectively. This result indicates that as the aerosol loading increases, the O3 produc-tion rate decreases, in contrast to the effect of aerosols on HONO formation. The O3 production rate wasalso influenced by the single-scattering albedo (SSA) of the aerosol. The O3 production rate became6.8 ppbv h�1, 7.3 ppbv h�1, 8.2 ppbv h�1, 9.0 ppbv h�1 and 10.1 ppbv h�1 when we set the SSA to 0.8,0.85, 0.9, 0.95, and 1.0 respectively. Observations of the photolysis rates and PM2.5 will be needed toquantify this effect.
The effects of aerosol uptake on HO2 radicals were not considered in this study because no data wereavailable on the aerosol surface area. If this mechanism was active, the HO2 concentration would decreaseas the aerosol concentration increased, and the O3 formation rate from the reaction HO2 +NO woulddecrease in turn. Therefore, in future studies, it will be necessary to measure the aerosol uptake coefficient
Figure 5. OH radical concentration and O3 formation under the standardscenario (black line) and PM2.5 reduction scenario (red line).
Journal of Geophysical Research: Atmospheres 10.1002/2016JD025676
LU ET AL. ROX BUDGETS AND O3 IN CENTRAL CHINA 3681
for HO2 in this region and to analyze the combined effect of aerosols on HONO, AOD, and HO2 and theconsequences for O3 formation.
3.3. Agricultural Burning Effect
Surrounded by a large area of farming land, Wuhan is heavily affected by the agricultural burning of biomassin its rural environs. Based on the MODIS NRT C5 fire data (https://firms.modaps.eosdis.nasa.gov/firemap/),more than 500 fire hot spots were detected in Hubei province during October 2013. Agricultural burningemits substantial amounts of VOCs, CO, and aerosols, which can increase the ambient concentrations ofthose pollutants in urban areas. Hence, it is important to understand how such activity influences O3
formation at our study site.
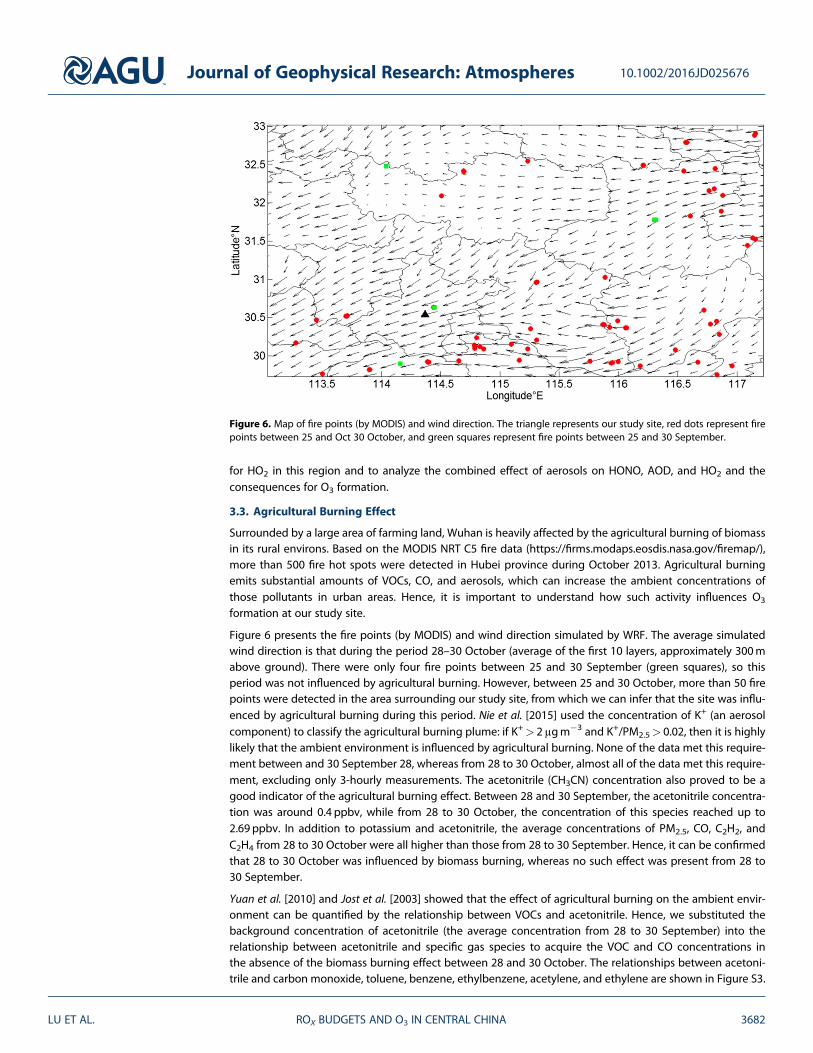
Figure 6 presents the fire points (by MODIS) and wind direction simulated by WRF. The average simulatedwind direction is that during the period 28–30 October (average of the first 10 layers, approximately 300mabove ground). There were only four fire points between 25 and 30 September (green squares), so thisperiod was not influenced by agricultural burning. However, between 25 and 30 October, more than 50 firepoints were detected in the area surrounding our study site, from which we can infer that the site was influ-enced by agricultural burning during this period. Nie et al. [2015] used the concentration of K+ (an aerosolcomponent) to classify the agricultural burning plume: if K+> 2μgm�3 and K+/PM2.5> 0.02, then it is highlylikely that the ambient environment is influenced by agricultural burning. None of the data met this require-ment between and 30 September 28, whereas from 28 to 30 October, almost all of the data met this require-ment, excluding only 3-hourly measurements. The acetonitrile (CH3CN) concentration also proved to be agood indicator of the agricultural burning effect. Between 28 and 30 September, the acetonitrile concentra-tion was around 0.4 ppbv, while from 28 to 30 October, the concentration of this species reached up to2.69 ppbv. In addition to potassium and acetonitrile, the average concentrations of PM2.5, CO, C2H2, andC2H4 from 28 to 30 October were all higher than those from 28 to 30 September. Hence, it can be confirmedthat 28 to 30 October was influenced by biomass burning, whereas no such effect was present from 28 to30 September.
Yuan et al. [2010] and Jost et al. [2003] showed that the effect of agricultural burning on the ambient envir-onment can be quantified by the relationship between VOCs and acetonitrile. Hence, we substituted thebackground concentration of acetonitrile (the average concentration from 28 to 30 September) into therelationship between acetonitrile and specific gas species to acquire the VOC and CO concentrations inthe absence of the biomass burning effect between 28 and 30 October. The relationships between acetoni-trile and carbon monoxide, toluene, benzene, ethylbenzene, acetylene, and ethylene are shown in Figure S3.
Figure 6. Map of fire points (by MODIS) and wind direction. The triangle represents our study site, red dots represent firepoints between 25 and Oct 30 October, and green squares represent fire points between 25 and 30 September.
Journal of Geophysical Research: Atmospheres 10.1002/2016JD025676
LU ET AL. ROX BUDGETS AND O3 IN CENTRAL CHINA 3682
The correlation coefficient (R2) between acetonitrile and almost all of these species exceeded 0.25 during ourstudy period (except o-xylene). To simulate the PO3 without the biomass burning effect, the acetonitrile levelmeasured between 28 and 30 September (0.4 ppbv) was used as a background and the VOC levels werescaled to this acetonitrile background level using the correlation in Figure S4.
The simulated O3 production rate in original run between 28 and 30 October was 3.6 ppbv h�1. When theextra VOCs and CO from agricultural burning were removed, the O3 production rate decreased to2.9 ppbv h�1 (�18%). Note that the agricultural burning is very frequent in Hubei province during thesummer. For example, according to the MODIS NRT C5 fire data, more than 1300 fire hot spots were detectedfrom June to August 2013. At this site, agricultural burning can be expected to play a particularly importantrole in O3 formation during summer due to the higher photolysis rate. Yamaji et al. [2010] and Pan et al. [2015]also reported that biomass burning is detrimental to the air quality in central China. Therefore, the localgovernment would be advised to restrict agricultural burning in this region to reduce the local O3 concentra-tion. The original simulated O3 formation rate between 28 and 30 October was lower than the 8 day average.The 29 and 30 October study periods were cloudy days, so the J values for these 2 days were heavily scaleddown (see equation (1) and section 2.2). The high VOC concentrations on 28–30 October may have beenpartly caused by anthropogenic emissions. In the future, simulations using a 3-D chemical transport model,which can rule out the contribution from local emissions, will be needed to further study the exact effectof biomass burning on the air quality in this region.
4. Conclusions
The UWCM 0-D box model involving MCM v3.2 chemical mechanism was combined with observational datato analyze the ROx budget and O3 production rate in the city of Wuhan during autumn. Our results showedthat the average maximum concentrations of OH, HO2, and RO2 were 3.2 × 10⁶, 1.4 × 10⁸, and7.0 × 107molecules cm�3, respectively, of the same order of magnitude as in other regions (Beijing, NewYork, Tokyo, and London). The reaction HO2+NO was the major OH production source, with an average reac-tion rate of 5.7 ppbv h�1 during the study period. The daytime average O3 formation rate was 8.8 ppbv h�1,and the loss rate was 2.6 ppbv h�1. Unlike in Beijing in summer, alkenes contributed the most to O3 formationin Wuhan during autumn, accounting for 45% of O3 production in this study. VOC/NOx sensitivity tests indi-cated that the ambient environment belonged to the VOC-limited regime during the study period. In general,a 50% decrease in the VOC concentration was found to reduce the O3 production rate from 8.8 to5.0 ppbv h�1, whereas the equivalent reduction for NOx would increase the O3 production rate from 8.8 to14.4 ppbv h�1. The O3 formation rate did not change greatly when both VOCs and NOx were controlledtogether. Our results also show that aerosols promoted HONO formation and, as a result, O3 production. Ifthe ambient PM2.5 concentration were decreased to 25μgm�3 (the WHO standard), the O3 formation ratewould fall from 7.4 to 6.0 ppbv h�1 (�19%). Therefore, from a control policy perspective, we would adviselocal government to prioritize their efforts to reduce both the ambient VOC and PM2.5 concentrations. Ourresults also show that biomass burning contributed around 18% of O3 formation at this site during agricul-tural burning episodes. Hence, to further minimize the O3 concentration in this city, the government shouldalso monitor and restrict agricultural burning in the region. This study is only valid for the Wuhan urban area.O3 is a secondary ambient pollutant, and a substantial amount of it in the urban area may originate fromupwind of the city. To establish a control policy for the entire region, further study of the area surroundingthis city is needed.
ReferencesBian, H., S. Han, X. Tie, M. Sun, and A. Liu (2007), Evidence of impact of aerosols on surface ozone concentration in Tianjin, China, Atmos.
Environ., 41(22), 4672–4681.Chen, F., and J. Dudhia (2001), Coupling an advanced land surface-hydrology model with the Penn State-NCARMM5modeling system. Part I:
Model implementation and sensitivity, Mon. Weather Rev., 129(4), 569–585.Dudhia, J. (1989), Numerical study of convection observed during the winter monsoon experiment using a mesoscale two-dimensional
model, J. Atmos. Sci., 46(20), 3077–3107.Dusanter, S., D. Vimal, P. S. Stevens, R. Volkamer, and L. T. Molina (2009), Measurements of OH and HO2 concentrations during the
MCMA-2006 field campaign—Part 1: Deployment of the Indiana University laser-induced fluorescence instrument, Atmos. Chem. Phys.,9(5), 1665–1685.
Journal of Geophysical Research: Atmospheres 10.1002/2016JD025676
LU ET AL. ROX BUDGETS AND O3 IN CENTRAL CHINA 3683
AcknowledgmentsWe thank Glenn Wolfe who distributedthe UWCM box model source code tothe public. We also thank the twoanonymous reviewers for theirconstructive comments. Xingcheng Luwas supported by the OverseasResearch Award from the Hong KongUniversity of Science and Technology.Yuhang Wang is supported by theAtmospheric Chemistry Program of theU.S. National Science Foundation. Thisresearch was also support by HongKong RGC funding (project C5022-14G).The MODIS NRT C5 data product can befound at https://firms.modaps.eosdis.nasa.gov/firemap/. The AOD and SSAdata can be downloaded via https://giovanni.sci.gsfc.nasa.gov/giovanni/.The chemical species data used in thisstudy are available from J.C.H Fung([email protected]).
Elshorbany, Y. F., R. Kurtenbach, P. Wiesen, E. Lissi, M. Rubio, G. Villena, E. Gramsch, A. R. Rickard, M. J. Pilling, and J. Kleffmann (2009),Oxidation capacity of the city air of Santiago, Chile, Atmos. Chem. Phys., 9(6), 2257–2273.
Grell, G. A., and D. Dévényi (2002), A generalized approach to parameterizing convection combining ensemble and data assimilationtechniques, Geophys. Res. Lett., 29(14), 1693, doi:10.1029/2002GL015311.
Hofzumahaus, A., et al. (2009), Amplified trace gas removal in the troposphere, Science, 324(5935), 1702–1704.Hong, S. Y., Y. Noh, and J. Dudhia (2006), A new vertical diffusion package with an explicit treatment of entrainment processes,Mon. Weather
Rev., 134(9), 2318–2341.Hou, S., S. Tong, M. Ge, and J. An (2016), Comparison of atmospheric nitrous acid during severe haze and clean periods in Beijing, China,
Atmos. Environ., 124, 199–206.Jenkin, M. E., S. M. Saunders, and M. J. Pilling (1997), The tropospheric degradation of volatile organic compounds: A protocol for mechanism
development, Atmos. Environ., 31(1), 81–104.Jost, C., J. Trentmann, D. Sprung, M. O. Andreae, J. B. McQuaid, and H. Barjat (2003), Trace gas chemistry in a young biomass burning plume
over Namibia: Observations and model simulations, J. Geophys. Res., 108(D13), 8482, doi:10.1029/2002JD002431.Kanaya, Y., R. Cao, H. Akimoto, M. Fukuda, Y. Komazaki, Y. Yokouchi, M. Koike, H. Tanimoto, N. Takegawa, and Y. Kondo (2007), Urban
photochemistry in central Tokyo: 1. Observed and modeled OH and HO2 radical concentrations during the winter and summer of 2004,J. Geophys. Res., 112, D21312, doi:10.1029/2007JD008670.
Kim, S., S. Y. Kim, M. Lee, H. Shim, G. M. Wolfe, A. B. Guenther, A. He, Y. Hong, and J. Han (2015), Impact of isoprene and HONO chemistry onozone and OVOC formation in a semirural South Korean forest, Atmos. Chem. Phys., 15(8), 4357–4371.
Kirchstetter, T. W., R. A. Harley, and D. Littlejohn (1996), Measurement of nitrous acid in motor vehicle exhaust, Environ. Sci. Technol., 30(9),2843–2849.
Lamsal, L. N., R. V. Martin, A. Van Donkelaar, M. Steinbacher, E. A. Celarier, E. Bucsela, E. J. Dunlea, and J. P. Pinto (2008), Ground-level nitrogendioxide concentrations inferred from the satellite-borne Ozone Monitoring Instrument, J. Geophys. Res., 113, D16308, doi:10.1029/2007JD009235.
Lee, J. D., L. K. Whalley, D. E. Heard, D. Stone, R. E. Dunmore, J. F. Hamilton, D. E. Young, J. D. Allan, S. Laufs, and J. Kleffmann (2016), Detailedbudget analysis of HONO in central London reveals a missing daytime source, Atmos. Chem. Phys., 16(5), 2747–2764.
Li, J., et al. (2011), Impacts of aerosols on summertime tropospheric photolysis frequencies and photochemistry over Central Eastern China,Atmos. Environ., 45(10), 1817–1829.
Liu, Z., et al. (2012), Summertime photochemistry during CAREBeijing-2007: ROx budgets and O3 formation, Atmos. Chem. Phys., 12(16),7737–7752.
Liu, Z., Y. Wang, F. Costabile, A. Amoroso, C. Zhao, L. G. Huey, R. Stickel, J. Liao, and T. Zhu (2014), Evidence of aerosols as a media for rapiddaytime HONO production over China, Environ. Sci. Technol., 48(24), 14,386–14,391.
Lou, S., et al. (2010), Atmospheric OH reactivities in the Pearl River Delta–China in summer 2006: Measurement and model results, Atmos.Chem. Phys., 10(22), 11,243–11,260.
Lyu, X., N. Chen, H. Guo, L. Zeng, W. Zhang, F. Shen, J. Quan, and N. Wang (2016), Chemical characteristics and causes of airborne particulatepollution in warm seasons in Wuhan, central China, Atmos. Chem. Phys., 16(16), 10,671–10,687.
Lyu, X. P., N. Chen, H. Guo, W. H. Zhang, N. Wang, Y. Wang, and M. Liu (2016), Ambient volatile organic compounds and their effect on ozoneproduction in Wuhan, central China, Sci. Total Environ., 541, 200–209.
Ma, Y., Y. Diao, B. Zhang, W. Wang, X. Ren, D. Yang, M. Wang, X. Shi, and J. Zheng (2016), Detection of formaldehyde emissions froman industrial zone in the Yangtze River Delta region of China using a proton transfer reaction ion-drift chemical ionization massspectrometer, Atmos. Meas. Tech., 9(12), 6101.
Michoud, V., et al. (2012), Radical budget analysis in a suburban European site during the MEGAPOLI summer field campaign, Atmos. Chem.Phys., 12(24), 11,951–11,974.
Mlawer, E. J., S. J. Taubman, P. D. Brown, M. J. Iacono, and S. A. Clough (1997), Radiative transfer for inhomogeneous atmospheres: RRTM, avalidated correlated-k model for the longwave, J. Geophys. Res., 102(D14), 16,663–16,682, doi:10.1029/97JD00237.
Morrison, H., G. Thompson, and V. Tatarskii (2009), Impact of cloud microphysics on the development of trailing stratiform precipitation in asimulated squall line: Comparison of one-and two-moment schemes, Mon. Weather Rev., 137(3), 991–1007.
Nie, W., et al. (2015), Influence of biomass burning plumes on HONO chemistry in eastern China, Atmos. Chem. Phys., 15(3), 1147–1159.Pan, X., Y. Kanaya, H. Tanimoto, S. Inomata, Z. Wang, S. Kudo, and I. Uno (2015), Examining themajor contributors of ozone pollution in a rural
area of the Yangtze River Delta region during harvest season, Atmos. Chem. Phys., 15(11), 6101–6111.Querol, X., X. Zhuang, A. Alastuey, M. Viana, W. Lv, Y. Wang, A. López, Z. Zhu, H. Wei, and S. Xu (2006), Speciation and sources of atmospheric
aerosols in a highly industrialised emerging mega-city in central China, J. Environ. Monit., 8(10), 1049–1059.Ren, X., et al. (2003), OH and HO2 chemistry in the urban atmosphere of New York City, Atmos. Environ., 37(26), 3639–3651.Ren, X., et al. (2006), Behavior of OH and HO2 in the winter atmosphere in New York City, Atmos. Environ., 40, 252–263.Ren, X., et al. (2013), Atmospheric oxidation chemistry and ozone production: Results from SHARP 2009 in Houston, Texas, J. Geophys. Res.
Atmos., 118, 5770–5780.Riedel, T. P., et al. (2014), An MCM modeling study of nitryl chloride (ClNO2) impacts on oxidation, ozone production and nitrogen oxide
partitioning in polluted continental outflow, Atmos. Chem. Phys., 14(8), 3789–3800.Saunders, S. M., M. E. Jenkin, R. G. Derwent, and M. J. Pilling (2003), Protocol for the development of the Master Chemical Mechanism, MCM
v3 (Part A): tropospheric degradation of non-aromatic volatile organic compounds, Atmos. Chem. Phys., 3(1), 161–180.Su, H. (2008), HONO: a study to its sources and impacts from field measurements at the sub-urban areas of PRD region, PhD thesis, Peking
Univ.Su, H., Y. Cheng, R. Oswald, T. Behrendt, I. Trebs, F. X. Meixner, M. O. Andreae, P. Cheng, Y. Zhang, and U. Pöschl (2011), Soil nitrite as a source
of atmospheric HONO and OH radicals, Science, 333(6049), 1616–1618.Taketani, F., Y. Kanaya, P. Pochanart, Y. Liu, J. Li, K. Okuzawa, K. Kawamura, Z. Wang, and H. Akimoto (2012), Measurement of overall uptake
coefficients for HO2 radicals by aerosol particles sampled from ambient air at Mts. Tai and Mang (China), Atmos. Chem. Phys., 12(24),11,907–11,916.
Thornton, J., and J. P. Abbatt (2005), Measurements of HO2 uptake to aqueous aerosol: Mass accommodation coefficients and net reactiveloss, J. Geophys. Res., 110, D08309, doi:10.1029/2004JD005402.
VandenBoer, T. C., C. J. Young, R. K. Talukdar, M. Z. Markovic, S. S. Brown, J. M. Roberts, and J. G. Murphy (2015), Nocturnal loss and daytimesource of nitrous acid through reactive uptake and displacement, Nat. Geosci., 8(1), 55–60.
Wang, H., et al. (2014), Source profiles of volatile organic compounds from biomass burning in Yangtze River Delta, China, Aerosol Air Qual.Res., 14(3), 818–828.
Journal of Geophysical Research: Atmospheres 10.1002/2016JD025676
LU ET AL. ROX BUDGETS AND O3 IN CENTRAL CHINA 3684
Wolfe, G. M., and J. A. Thornton (2011), The Chemistry of Atmosphere-Forest Exchange (CAFE) Model—Part 1: Model description andcharacterization, Atmos. Chem. Phys., 11(1), 77–101.
Wolfe, G. M., et al. (2014), Missing peroxy radical sources within a summertime ponderosa pine forest, Atmos. Chem. Phys., 14(9), 4715–4732.Wolfe, G. M., M. R. Marvin, S. J. Roberts, K. R. Travis, and J. Liao (2016), The Framework for 0-D Atmospheric Modeling (F0AM) v3. 1, Geosci.
Model Dev., 9(9), 3309.Wong, K. W., C. Tsai, B. Lefer, N. Grossberg, and J. Stutz (2013), Modeling of daytime HONO vertical gradients during SHARP 2009, Atmos.
Chem. Phys., 13(7), 3587–3601.World Health Organization (2006), Air Quality Guidelines: Global Update 2005: Particulate Matter, Ozone, Nitrogen Dioxide, and Sulfur Dioxide,
World Health Organ., Copenhagen.Wu, D., J. C. H. Fung, T. Yao, and A. K. H. Lau (2013), A study of control policy in the Pearl River Delta region by using the particulate matter
source apportionment method, Atmos. Environ., 76, 147–161.Xu, G., L. Jiao, S. Zhao, M. Yuan, X. Li, Y. Han, B. Zhang, and T. Dong (2016), Examining the impacts of land use on air quality from a
spatio-temporal perspective in Wuhan, China, Atmosphere, 7(5), 62.Xue, L. K., T. Wang, H. Guo, D. R. Blake, J. Tang, X. C. Zhang, S. M. Saunders, and W. X. Wang (2013), Sources and photochemistry of volatile
organic compounds in the remote atmosphere of western China: Results from the Mt. Waliguan Observatory, Atmos. Chem. Phys., 13(17),8551–8567.
Yamaji, K., et al. (2010), Impact of open crop residual burning on air quality over central eastern China during the Mount Tai Experiment 2006(MTX2006), Atmos. Chem. Phys., 10(15), 7353–7368.
Yu, Y., B. Galle, A. Panday, E. Hodson, R. Prinn, and S. Wang (2009), Observations of high rates of NO2-HONO conversion in the nocturnalatmospheric boundary layer in Kathmandu, Nepal, Atmos. Chem. Phys., 9(17), 6401–6415.
Yuan, B., Y. Liu, M. Shao, S. Lu, and D. G. Streets (2010), Biomass burning contributions to ambient VOCs species at a receptor site in the PearlRiver Delta (PRD), China, Environ. Sci. Technol., 44(12), 4577–4582.
Zhang, Y., Y. Mu, J. Liu, and A. Mellouki (2012), Levels, sources and health risks of carbonyls and BTEX in the ambient air of Beijing, China,J. Environ. Sci., 24(1), 124–130.
Zhang, Y., et al. (2016), Large vertical gradient of reactive nitrogen oxides in the boundary layer: Modeling analysis of DISCOVER-AQ 2011observations, J. Geophys. Res. Atmos., 121, 1922–1934, doi:10.1002/2015JD024203.
Zhou, X., et al. (2011), Nitric acid photolysis on forest canopy surface as a source for tropospheric nitrous acid, Nat. Geosci., 4(7), 440–443.
Journal of Geophysical Research: Atmospheres 10.1002/2016JD025676
LU ET AL. ROX BUDGETS AND O3 IN CENTRAL CHINA 3685